Embed Size (px)
Citation preview

379
Proceedings of 26th ITTC – Volume II
The Specialist Committee on Scaling of Wake Field
Final Report and Recommendations to the 26th ITTC
1. OVERVIEW
1.1 Membership and Meetings
The members of the Specialist Committee on Scaling of Wake Field of the 26th ITTC are:
Thomas C. Fu (Chairman) Naval Surface Warfare Center, Carderock Division (NSWCCD) W. Bethesda, MD, U.S.A.
Ali Can Takinaci (Secretary) Istanbul Technical University Faculty of Naval Architecture and Ocean Engineering Istanbul, TURKEY
María J. Bobo Canal de Experiencias Hidrodinámicas de El Pardo (CEHIPAR) Madrid, SPAIN
Wojciech Gorski Ship Design and Research Center (CTO-SA) Gdansk, POLAND
Christian Johannsen Hamburgische Schiffbau-Versuchsanstalt (HSVA) Hamburg, GERMANY
Hans-Jürgen Heinke Schiffbau-Versuchsanstalt Potsdam (SVA Potsdam) Potsdam, GERMANY
Chiharu Kawakita Nagasaki Research and Development Center Nagasaki, JAPAN
Jin-Bao Wang Marine Design & Research Institute of China (MARIC) Shanghai, CHINA
Four committee meetings have been held during the work period:
Madrid, Spain, February 2009 at the Canal de Experiencias Hidrodinámicas de El Pardo (CEHIPAR).
Hamburg, Germany, October 2009 at the Hamburgische Schiffbau-Versuchsanstalt (HSVA).
Shanghai, China, June 2010 at the Marine Design & Research Institute of China (MARIC).
Istanbul, Turkey, February 2011 at the Istanbul Technical University (ITU) Faculty of Naval Architecture and Ocean Engineering.
1.2 Tasks
The recommendations for the work of the Specialist Committee on Scaling of Wake Field as given by the 25th ITTC were as follows:
Define the physical nature of wake.

The Specialist Committee on Scaling of Wake Field
380
Review the existing scaling methods and available full-scale data.
Review the applicability of CFD methods for the prediction of full-scale wake. Liaise with the Specialist Committee on CFD in Marine Hydrodynamics.
Address the available options for simulating full-scale wake both numerically and experimentally including the limitations of existing test procedures. Liaise with the Specialist Committee on Detailed Flow Measurement.
Write guidelines for methods of scaling of wake fields. Conduct a survey of numerical methods for prediction of wake-fields at model and full-scale.
1.3 Approach
The recommended actions of 26th ITTC Specialist Committee on Scaling of Wake Field, as stated above are focused on two main areas, the review of existing scaling methods and of the methods for simulating full-scale wakes both numerically and experimentally. The review of numerical methods focused on the applicability of Computational Fluid Dynamics (CFD) methods for simulating full-scale wakes. While the review of full-scale wake simulation for experiments focused on evaluating the various methods. All three of these efforts, review of existing scaling methods, review of current CFD tools, and review of experimental methods included reviewing and when needed developing ITTC procedures. Since the Committee on Scaling of Wake Field is a Specialists Committee the literature survey of numerical and experimental methods was not constrained to the period since the 25th ITTC Meeting, though it did build of and efforts of the 25th ITTC Specialists Committee on Wake-Fields efforts.
It should also be noted that the wake scale effect of twin screw ships is not specifically addressed in our effort or in the proposed guidelines. The wake scale effect of twin screw ships with open sterns is usually small, and for such ships it is common to assume wTS = wTM. For twin skeg-like stern shapes a wake correction is recommended in the ITTC 1978 Performance Prediction Method. A correction like the one used for single screw ships may be used.
As part of the effort to review the existing scaling methods and available full-scale data, the committee surveyed member ITTC organizations on their current wake scaling and simulation methods, as well as on their use of CFD in the simulation of wakes. Specific test cases were prepared and passed on to those surveyed to aid in the evaluation of the various methods. The results of the survey and quantitative comparison of the methods are described in Section 6 below.
The results of the survey were also used to focus the efforts of the committee as they developed the Experimental Scaling of a Model Wake guideline. A short description of this guideline is given in Section 3.
By reviewing all of the ITTC Procedures for references to wake field scaling, it was found that five existing procedures refer to wake field scaling and simulation. These procedures are:
7.5-02-03-03.1: Model-Scale Cavitation Test
7.5-02-03-03.3: Cavitation Induced Pressure Fluctuations Model Scale Experiments
7.5-02-03-03.5 Cavitation Induced Erosion on Propellers, Rudders and Appendages
7.5-02-03-03.6: Podded Propulsor Model-Scale Cavitation Test

381
Proceedings of 26th ITTC – Volume II
7.5-02-03-01.4: Performance, Propulsion 1978 ITTC Performance Prediction - section 2.4.3
Review of these procedures was made to standardize the procedures for scaling simulated wakes. Small changes to the first four of these procedures referencing the new proposed guidelines have been submitted. The last procedure 7.5-02-03-01.4 does not require any changes.
What follows are sections defining the physical nature of wakes (Section 2), a review of the existing scaling methods (Section 3), the results of the survey (Section 6), review of the applicability of CFD (Section 5), followed by section 6 on experimental methods for full-scale wake simulation and section 7 on numerical methods for wake scaling, and finally, a section (8) reviewing the existing ITTC procedures and the committee’s recommendations (Section 9).
2. BACKGROUND
2.1 The Physical Nature of Wakes
In the field of Hydrodynamics the word “wake“ means “the disturbance flow field caused by the relative motion between a hull form and a uniform incident flow parallel to the hull longitudinal center plane.“ The nominal wake field is the wake field that would be measured at the propeller plane without the presence or influence of the propeller. The nominal wake, [wn] can be decomposed as:
[wn] = [wp] + [wv] + [ww] + [Δw]
Where the [wp] is the potential wake field, that is the wake that would arise if the ship were in an ideal fluid, without viscous effects. [wv] is the frictional wake field and arises from the viscous nature of the water passing over the hull surface. [ww] is the wake component due to wave action and is caused by the movement
of water particles in the gravity waves set up by the ship. [w] represents the non-linear part of the wake field decomposition and the brackets, [ ], denote the total wake field rather than point values.
From the propeller design point of view the determination of the wake field in which the propeller operates is of fundamental importance. The mean wake field determines, along with other parameters, the overall design dimensions of the propeller and variability of the wake field influences the propeller blade section design and pitch.
The wake behind a ship with an operating propeller is called the effective or total wake. It is an artificial concept having its origin in our inability to deal with the ship and propeller as a unit. The flow through the propeller for a given vessel is influenced by the power transmitted by the propeller. If the interaction between the propeller and ship causes flow separation, the normal relation between nominal and effective wakes will be influenced.
2.2 Wake Field Scaling
Since the model of a ship is tested at equal Froude numbers between ship and model scales, a disparity in Reynolds number exists which leads to a relative difference in the boundary layer thickness between the model and the ship, the model having the relatively thicker boundary layer. For propeller design it is then necessary to scale the wake measured from the model. Different methods can be utilized. The most popular semi-empirical wake scaling procedures are the so called contraction methods. They take a measured nominal wake as a starting point and then reduce, in different ways, the “width” of the wake, however very few validation studies exists upon which to base any firm conclusions of the different wake field scaling procedures. All contraction methods have in common that they need flow field information over some distance outside the propeller disk.

The Specialist Committee on Scaling of Wake Field
382
In connection with propeller design, wake decomposition into the axial flow field and the transverse flow field is typical. Most scaling methods deal with the axial velocities only. In most design situations the usual practice is to scale the nominal wake field from model scale to ship scale and then find the effective wake field at ship scale from the derived effective wake model.
2.3 Measurement of Full-Scale Wakes
When investigating the accuracy of methods for scaling of wake fields from model scale measurements up to full-scale predictions, it is of course indispensable to have real and reliable full-scale data to compare with. This need is as old as wake measurements at model scale, but nevertheless, the number of well documented and reliable full-scale measurements is still extremely small. The reason for that is the huge technical effort that is necessary to measure the flow speed behind a real ship. Measuring points of interest lay far outside of the ship hull in a regime of high flow speed and harsh environmental conditions.
Measurements of the nominal wake field, i.e. in absence of the propeller, are almost impossible, since the ship needs to be towed by another vehicle or must be driven by any onboard device, which must not influence the flow conditions in the measurement area. Just one case has been reported by Chai et al. (1981), where pitot tubes were used to measure the nominal wake field behind the 37 m long passenger ship Hong Xing while being towed by a tug boat for this purpose.
Figure 1: LDV system for full-scale wake measurements
Measuring the total wake is much easier at full-scale, because the ship can be driven by its own propeller. The usefulness of a total wake measurement, however, is less than that of the nominal wake, because it contains both the influence of the ship hull and of the propeller action on the flow. When comparing to corresponding model measurements or calculated wake fields, it is inherently more difficult to clearly identify the origin of any differences.
Two groups of total wake measurements can be distinguished: first, those utilizing probes physically located in the flow, and second, those done by optical measuring techniques, such as Laser Doppler Velocimetry (LDV) or multiple camera observations of particles in the flow. Even Particle Image Velocimetry (PIV) might be an option in future.
Optical measuring systems, an example is

383
Proceedings of 26th ITTC – Volume II
shown in Figure 1, require only one or two windows in the hull and do not disturb the propeller inflow being measured. Their disadvantage is that the accessible area of measuring points is limited by the reach of the laser beams. Depending on the clarity of the water, in most cases the wake measurement is limited to the upper portion of the propeller disc only. There are several measurements by Laser Doppler Velocimetry (LDV) in front of the working propeller reported in the literature. Most of these efforts date back to the 1980s. One case, carried out on board of the Japanese 5000 t training vessel Seiun Maru, has been reported by Tanibayashi (1990, 1991). Other LDV wake measurements were carried out onboard of the 1500 TEU container vessel Sydney Express (Kux et al. (1982, 1985), Laudan (1983)) as well as onboard of the 183 m long product tanker St. Michaelis (Kux et al. (1982), Stöhrmann (1983), Laudan (1983)). Stöhrmann et al. (1983) also performed LDV wake measurements onboard of the German twin-screw F 122 class frigate Bremen. Kuiper et al. (2002) measured the wake of a 37 m long patrol vessel using LDV. Norris (1984) introduced another example of LDV wake measurements during the 17th ITTC. The most comprehensive data set, however, might be the so-called Hamburg Test Case (HTC), which originates from LDV measurements done by Lammers et al. (1987, 1989) onboard of the 1600 TEU container vessel Ville de Mercure. These data have been the basis for various CFD validation efforts already. The same group of scientists performed wake measurements onboard of the 60.000 t bulk carrier Fjord Land as well (1989). Apart from the LDV measurements, Komura et al. (1992) describe a technique using a set of three cameras to observe tracer particles in the water. This set-up was used to measure the wake field of Seiun Maru also (see above). The agreement of both measurements has been judged by the author as "fairly well", while the measuring effort and robustness are in favor of the tracer observation method.
Figure 2: Set-up for full-scale wake measurement by Pitot tubes
Wake measurements by means of probes located in the flow is similar to the techniques usually applied at model scale. It is independent of the water quality and, depending on the choice of probes, normally gives the full three-dimensional picture of the wake field. The rack used for positioning the probes in a large number of different locations, however, represents a considerable disturbance of the flow to be measured and, and this might be of much more concern for the ship owner, as it represents a certain endangering of the propeller acting behind this arrangement. Figure 2 shows an example of such a swing arm rack, here applied on a 167 m long ship A geosim series of wake measurements, including the full-scale situation, was carried out by

The Specialist Committee on Scaling of Wake Field
384
Ogiwara (1994) onboard of the 200.000 t tanker Ryuko Maru. He installed five-hole pitot tubes located almost one diameter in front of the propeller. For the 80 m long fishery research vessel Prof. Siedlecki a rotating arm installation was used by Lau (1975). Before finalization, however, these measurements had to be aborted due to serious stability problems with the rack of probes. The wake field of a fast 46 m long patrol boat was measured by Day (1980), using a five-hole pitot tube, which was equipped with piezo-electric sensor to allow measurement of high frequency flow variations.
3. REVIEW OF EXISTING WAKE SCALING METHODS
3.1 Introduction
This section provides details for the numerical wake scaling in connection with propeller calculations and cavitation tests in model basins. It deals with considerations regarding computational fluid dynamics (CFD) methods to predict a full-scale wake field on the basis of RANS calculations as well as on the use of measured model-scale wake fields and application of scaling procedures.
The measurement of the three-dimensional wake field components at model-scale is routinely performed during the design phase of ships. The Reynolds numbers for model tests are typically in the range 106 to 107. Ships are mainly working at Reynolds numbers of 109. The flow around a ship is strongly influenced by Reynolds number (Lübke, 2002), (Gad-el Hak, 1989). Increasing Reynolds number leads to a reduction of the boundary layer thickness and an altering of the velocity profile in the near wall region.
Model scale Full-scale LppM = 7.00 m LppS = 300 m VM = 1.27 m/s VS = 8.33 m/s nM = 8.73 s-1 nS = 1.33 s-1 ReM = 8.224 106 ReS = 2.1 109
Figure 3: Calculated Wake Fields - Tanker “Ryuko Maru”
Model scale Full-scale LppM = 6.40 m LppS = 153.7 m VM = 1.89 m/s VS = 9.26 m/s nM = 8.573 s-1 nS = 1.75 s-1 ReM = 1.190 107 ReS = 1.196 109
Figure 4: Calculated Wake Fields – Container Ship “Ville de Mercure”
Due to the continuous development of numerical methods it is possible to carry out verified calculations of a full-scale wake field (Lübke, 2002). The comparison of calculated wake fields for model and full-scale shows in general, that the thickness of the boundary layer at the ship is relatively smaller than on a model (Figures 3 and 4). The result is a larger wake gradient. The maximum values of the wake fraction coefficients are lower behind a ship. The increased Reynolds number also

385
Proceedings of 26th ITTC – Volume II
results in a reduction of the strength of the bilge vortex.
The cavitation behavior of the propeller in the wake field has a large influence on the pressure pulses at the aft ship. Not only is the thickness of the cavitation important but also the time in which the cavitation is developing and disappearing. The prediction of the cavitation in connection with the propeller inflow is the determining factor for the calculation of the propeller induced pressure fluctuations.
The propeller thrust loading and cavitation number determined by the geometry of the propeller blades and the cavitation of the propeller. In the wake peak, behind the stem above the propeller shaft, is where the propeller blade is most heavily loaded and the cavitation is most strongly developed. The displacement of the volume of the cavitation at the propeller blades generates pressure fluctuations similar to the displacement of the propeller blades. These parts of the pressure fluctuations are small in comparison with the induced contribution, resulting from the pulsation of the cavitation in the wake field. The variation of the size of the cavitation volume per time is the dominant factor for the level of the propeller induced pressure fluctuations (Huse, 1972).
2
2
2
2
ˆ
cavcav
p
V
t
VK
Also important is the position of where the propeller blade cavitation appears. The cavitating tip vortex can dominate the generation of the propeller induced pressure fluctuations, especially for skew propellers (Weitendorf, 1977).
The analysis of the propulsion of large container ships led to a diagram for the estimation of the propeller induced pressure fluctuations to the first order for three cases of wake deficit, Figure 4 (Carlton, 2001). The wake deficit is determined as the dimensionless velocity difference between the mean and the
maximum effective wake fraction. The diagram makes clear the large influence of the wake irregularity on the vibration of the aft of the ship (constant clearance of 25% of the propeller diameter).
The propulsion committee discussed a “Difficulty Index” as an indication for vibration problems in the report of the 23rd ITTC.
Difficulty Index C)A/A(Z
wnT /
0E
7
4352
105DI
with C = tip-hull clearance in m, n = propeller rotation rate in rpm, Z = number of blades, T = propeller thrust in kN and = displacement in m3. Δw expresses the depth of the wake peak at the propeller tip radius and it is defined as wmax-wmin. The depth of the wake peak goes into the calculation of the difficulty index with the 5th power.
3.2 Wake Scaling Using Simple Methods
The definition of a "simple" wake scaling method shall be that all points of the measuring plane are treated by the same scaling factor, i.e. the shape of the iso-lines of constant axial velocity remains unchanged, only its overall level is shifted. This definition, indeed, is a simple and certainly not very realistic assumption, which however, is often applied to avoid time consuming calculations.
The simple methods just differ in the way the scaling factor is determined. It is near at hand to use the same factor, which is also used to correct the model wake fraction wTM (found in the towing tank propulsion test in combination with the open water test, normally assuming KT-identity) to a full-scale wake fraction wTS to achieve a full-scale powering prediction. The ITTC (1978) for example has recommended the formula
FM
FFSTMTS Ck
CCktwtw
)1(
)1()04.0()04.0(

The Specialist Committee on Scaling of Wake Field
386
where t is the thrust deduction fraction, k is the form factor, CFS and CFM are the frictional coefficients of ship and model respectively and CF is the roughness allowance. From this formula a scaling factor wTS/wTM can be determined, which not only depends on the above mentioned parameters t, CFS, CFM, CF and k, but also on the model wake fraction wTM itself.
Another option proposed by Abels (2006) for example, is to use Yazaki's method (1969),
giving a scaling factor TM
TS
ww
11
as a function of
model wake fraction, ship length, beam and draft.
Other scaling factors are imaginable, but the drawback of all these simple methods is evident: since all points of the measuring plane are treated equally, flow areas are also scaled, which are weakly or even not at all exposed to any wake effect, neither at model scale, nor in full-scale. The lower outer sector of the propeller disc may be an example for such an area. Consequently the simple scaling will result in areas, where the corrected local flow speed exceeds the speed of the undisturbed flow! Scaling effects on the transverse flow components or even on vortex structures like bilge vortices are of course not at all captured by these simple methods.
While there may be cases when less sophisticated methods are be appropriate, analyses of the scaling methods and the review of current practices by the 26th ITTC Specialist’s Commit-tee on the Scaling of Wake Fields revealed that the Sasajima-Tanaka method of wake scaling is not only the most commonly used but also provides the results with lowest discrepancy from full scale CFD wake predictions. This method tends to give the best approximation of the up-per part of the wake field in terms of the wake deficit depth and width therefore it is believed to give realistic approximation of full-scale propeller working conditions. However it must be noted that quality of the Sasajima-Tanaka method
varies in and therefore may give misleading results for some specific hull forms. Having provided this warning, the ITTC recommends application of the Sasajima-Tanaka method in cases where direct full scale wake data are not available.
3.2.1 Sasajima-Tanaka Method
Nagamatsu Tetsueo (1979) presented a method to predict ship wake from measured model wake by applying the theory of two-dimensional turbulent wake. From basic investigations on two-dimensional wing, the following physical properties of turbulent wake were made clear with respect to the scale effect on viscous wake. (1) The width of wake is in pro-portion to the momentum thickness and not to the scale of model and ship. (2) Velocity distribution in wake varies downstream as a function of non-dimensional distance divided by momentum thickness. (3) The value of the wake peak is affected significantly by the difference of the velocity pro-file at the stern frame between model and ship. In the Sasajima-Tanaka method only the first item above is taken into account for scaling the viscous wake, and the method is described in detail in the Proceedings of the 11th ITTC, Tokyo, 1966, under the title “On the Estimation of Wake of Ships.”
Sasajima and Tanaka consider the wake divided in two components, potential, wp, and frictional, wf. The component ww is ignored. It is assumed that displacement effect is proportional to boundary layer thickness and
wfs = wfm • (1-wps)/(1- wpm)
where wf and wp are the local frictional and potential wakes respectively.
The determination of the potential wake is made towing the model astern. wp is supposed to be independent of scale but the frictional wake, wf, difference between the total and the potential wakes, suffers scale effect and should be contracted toward the center plane. Scale

387
Proceedings of 26th ITTC – Volume II
effect will be mainly determined by a function of Cfm/Cfs, where subscript m refers to model values and s refers to ship scale. Linear combination of local values, w = wp+wf is assumed.
3.2.2 Practical Application of this Method to the Nominal Wake Extrapolation.
Figure 5: Typical propeller plane wake chart
Total and potential model wakes, wtm and wpom are measured. The values used for the extrapolation are taken, on the potential and total wake charts, at the propeller plane in several horizontal sections parallel to the water plane. Each section is defined by its height or r/R relation, see Figure 5.
First wpm is determined considering the displacement effect of boundary layer on wp, from the relation:
wpm/ wpo = Km = (wpm/ wpo) at δm
where δm being boundary layer thickness of models.
For an ideal fluid: wpm = wpo
For a real fluid: wpm < wpo
Out of the boundary layer wm= wp and w < wpo. Then, curves wm= f(xm) and wpo =f(xm) should intersect. The intersection point determines the value of Km = relation between the values of wtm and wpo for a xmt after the inter-section of curves wpo and wtm. Figures 6 and 7 show a typical example.
If there is no intersection of wpo and wtm, then Km = 1.
Figure 6: Typical example of how Km is determined
For the model:
wpm = Km • wpo
wfm = wt - wpm
wpm - wpo = (Km – 1)• wpo
For the real ship:
wps - wpo = (Ks – 1)• wpo
It is assumed that the relation between the values of (wp - wpo) for the ship and the model is proportional to the relation of the relative thickness of their boundary layers:
(wpm - wpo)/(wps - wpo) = (δ/L)m /(δ/L)s = Cfm/Cfs = ((Km – 1)• wpo )/ ((Ks – 1)• wpo)
Ks = 1 + (Km – 1) • Cfs / Cfm
wps = Ks • wpo
-10
-8
-6
-4
-2
0
2
4
6
8
10
V2
0.8 R
0.6 R
- 0.6 R
- 0.8 R
-10
-8
-6
-4
-2
0
2
4
6
8
10
V2
0.8 R
0.6 R
- 0.6 R
- 0.8 R
Determination of Km
0.0
0.1
0.2
0.3
0.4
0.5
0.6
0.00 0.02 0.04 0.06 0.08 0.10 0.12 0.14 0.16Xm
Wpo
; Wpm
; Wt
Wpo Wtm Wpm Wfm Wpo-Wtm intersection

The Specialist Committee on Scaling of Wake Field
388
In a similar way:
(x/L)s/(x/L)m = Cfs / Cfm
xs = xm • λ • Cfs/Cfm
wfm /(1 - wpm ) = wfs / (1 - wps)
wfs = wfm / (1 - wps ) / (1 - wpm )
Figure 7: Typical resulting ship scaled wake for the Sasajima-Tanaka Method
Summarizing the above, it can be stated that simple methods for wake scaling may be meaningful to get a very rough first idea of the full-scale flow distribution, but should not be used for any serious investigation.
3.3 Wake Scaling Using CFD Methods
The means for tuning a model wake field to a full-scale wake depends upon the available data base (model test results, ship lines) and the characteristic of the wake field. There are existing methods which are based on available model data and use CFD to compute the full-scale effect (meaning the difference in field distribution in model and full-scale) in order to extrapolate the model measured wake values to full-scale. However with the current advances in CFD techniques and increasing computational power available these methods are supplemented by direct computations of full-scale using Reynolds-Averaged Navier–Stokes (RANS) models. Furthermore there are new computational techniques, such as Large-
Eddy-Simulation (LES) or Detached-Eddy-Simulation (DES), which are being currently investigated with the purpose of full-scale wake simulation. However it must be noted that the currently accepted standard for wake analyses is based on RANS methods.
3.4 Correction of a Measured Wake Field with CFD results
To use CFD methods to correct model-scale measurements to estimate a full-scale wake field, additional calculations should be carried out for the ship at model scale. The calculated and measured wake fields should then be analyzed.
The original method for deriving the full-scale wake has been proposed by Koronowicz et al. (2003). The method originally has been proposed for the purpose of effective wake de-termination; however it can be used for obtaining the full-scale nominal wake as well. The method utilizes the potential code developed by the authors (PANSHIP-2) and is based on the successive calculations of the nominal wake in model scale and the effective (including the propeller operation) wake in full-scale. Resulting differences between the full-scale and model scale wakes can be added to the nominal wake measured in the standard wake model test and in this way the full-scale, effective wake is obtained. In order to derive the nominal wake in full-scale the same procedure can be applied, however both model and full-scale flow should be solved without the propeller. The method is based on the assumption that although potential flow solvers are inappropriate to give satisfactory solutions for wake flows, they accurately capture the scale effects.
In order to compute the nominal wake field behind the ship hull (either model or full-scale) the so-called successive approximations method is applied which can be described by following steps:
Ship Prediction
0.0
0.1
0.2
0.3
0.4
0.5
0.6
0 0.2 0.4 0.6 0.8 1 1.2 1.4 1.6 1.8Xs
Wps
; Wfs
; W
ts
Wps Wfs Wts

389
Proceedings of 26th ITTC – Volume II
Step 1 – calculation of the velocity and pressure fields around a double hull deep immersed in the fluid, at constant speed,
Step 2 – the pressure field in the region of the double hull division allows for calculation of the wave system and the velocity and pressure fields on the hull are modified accordingly,
Step 3 – the velocity field in the boundary layer on the hull is calculated along the stream lines and the hull surface is modified ac-cording to the boundary layer thickness,
Step 4 – computations are repeated iteratively as to obtain the acceptable consistency,
Step 5 – finally the nominal wake is calculated within the propeller operation area based on the RANS equations for a space grid de-fined in the aft part of the hull.
Example calculations has been provided for three different hull forms showing the significance of the scale effect for wake flow (Figure 8) and also for the calculations of the propeller induced excitations. Results of computations show that first blade harmonic of excitations (both shaft forces and pressure pulses) are significantly lower when the full-scale wake obtained using the proposed method is used (comparing to the model nominal wake). However, it is not the case when assessing the second and third harmonics of the thrust and torque fluctuations.
Figure 8: Axial distribution of the nominal wake fraction for the model and ship S-60 and
effective wake for the ship.
If the comparison shows large differences in the calculated and measured wake fields a direct calculation of the full-scale wake field should not be done. If the wake field is characterized by strong bilge vortices there is the danger that the vorticity calculated by the CFD code will be too small. In these cases the measured model scale wake field should be used as the basis for the wake scaling. The differences in the calculated model and full-scale wake fields should be determined. With these differences the measured model wake field can be used to get the full-scale wake.
3.5 Boundary Layer Derived Wake Scaling Methods
The following wake scaling methods based on the proportionality between the thickness of the boundary layer and the coefficient of the friction resistance of the ship.
x~CF
From the proportionality between the thickness of the boundary layer and the coefficient of the friction resistance follows that the boundary layer on the ship is relative thinner than on the model, tested at Froude identity. The characteristic of the nominal wake field will be mostly similar in model and full-scale. This is why the contraction of the model wake field the simplest way to predict a full-scale wake field. The contraction of the

The Specialist Committee on Scaling of Wake Field
390
boundary layer is the basis of a number of different methods.
3.5.1 Method from Sasajima
This method (Sasajima and Tanaka, 1966) is based on the determination of the potential wake, towing the model astern. Wp is supposed to be independent of scale, but the frictional wake, wf, difference between the total and the potential wakes, suffers scale effects and should be contracted toward the center plane. A linear combination of local values, w = wp + wf is also assumed.
In Section 6 it will be shown that when this method is used to predict the nominal wake pattern of the ship from geometrically similar (geosim) models the results are clearly dependent on which model is used. The predictions from the two biggest models are closer than the one from the smallest model.
3.5.2 Method from Dyne
Dyne’s method (Dyne, 1974) to determine the scale effect on the nominal wake consists in carrying out wake measurements on a geosim series of models covering a large range of Reynolds numbers and studying the variation of the wake with CF. There is a single prediction from the results of all models.
3.5.3 Method from Hoekstra
Hoekstra’s method (Hoekstra, 1975) is based on the assumption that the wake components, wf, wp and ww, are not independent of each other. The wake contraction between ship and model affects the total wake and not only the frictional part of it. The total contraction of the nominal wake is threefold, namely contraction to the center plane, contraction to the hull above the propeller and a concentric contraction around the propeller axis. A component will be more or less significant depending on the type of ship and wake pattern. The method considers
two different cases according to the existence or non-existence of bilge vortices. The ship predictions with this method from the results of the geosim models differ largely from one another.
3.5.4 Method from Tanaka
The main idea of Tanaka’s method (Tanaka, 1979) is to consider the near-wake on the propeller plane as the result of the interpolation between the characteristics of the boundary layer at the stern and those of the far-wake downstream. The wave component of the wake is ignored and the ship is considered to lie between a two-dimensional body and a body of revolution. This method is easy to apply but the wake prediction still depends upon the model scale.
3.5.5 Method from García
To avoid or at least mitigate the dependency of the wake extrapolation on the model scale and obtain a unique ship prediction no matter which model is used, García (García, 1989) has developed a new method, based in Tanaka’s but introducing the dependency of the form factor on the model scale and its repercussion on the friction wake component.
3.5.6 Method from Mehlhorn
The method from Mehlhorn (Mehlhorn, 1983) based on the main assumptions from Hoekstra. The method for shifting of the coordinates in the propeller disc with help of the contraction parts for the determination of the ship wake had been modified
3.5.7 Method from Tetsuo
Nagamatsu Tetsuo presented a method to predict ship wake from measured model wake by applying the theory of two-dimensional turbulent wake (Tetsuo, 1979). From basic investigations of a two-dimensional wing, the following physical properties of a turbulent wake were made clear with respect to the scale effect on viscous wake. (1) The width of wake

391
Proceedings of 26th ITTC – Volume II
is proportional to the momentum thickness and not to the scale of model and ship. (2) The velocity distribution in the wake varies downstream as a function of non-dimensional distance divided by momentum thickness. (3) The value of the wake peak is affected significantly by the difference of the velocity profile at the stern frame between model and ship. In the well-known Sasajima-Tanaka's method (Sasajima and Tanaka, 1966), described in section 3.2.1 above, only the first item above is taken into account for scaling the viscous wake. The method for predicting the ship wake was developed in view of the above observations. Applicability of this method to the wake of ship was examined by use of the geosim models of a cargo ship, and it was shown that the method presented here provides reasonable results and can be applied as a practical means for predicting ship wakes.
3.5.8 Method from Tanaka Ichiro
The scale effects of the boundary layer and wake distribution of ships with bilge vortices are investigated as an extension of the author's previous paper on the same problem without bilge vortices (Tanaka, 1983). It is assumed that the flow consists of the ordinary wake portion without bilge vortices and the vortex wake. The characteristics of the latter are discussed firstly with the mail purpose of investigating the Reynolds number effects on the location of the vortex center, circulation, velocity and vortices distributions. Secondly a method of correlating the model and ship's wake is proposed
4. VISCOUS NUMERICAL SIMULATION OF THE FULL-SCALE WAKE FIELD BY RANS
4.1 Introduction
Scaled nominal wake is especially useful when conducting cavitation and pressure fluctuation testing, and the quality of the predictions of cavitation and pressure pulses is directly related to how accurately the inflow to
the propeller is simulated (Wijngaarden, 2005). Yet until now, no universal empirical scaling method is widely accepted. Much effort has been put into CFD in the hope of finding a new way to scale nominal wakes.
With the rapid development of CFD software and hardware, it is now possible to numerically simulate full-scale wakes. In the past, more work has been done on the validation of the total wake. Theoretically, it should be no problem to perform full-scale nominal wake simulations, however, due to the a lack of full-scale nominal wake data for validation, only indirect methods can be used to build up confidence in CFD’s capabilities in regard to full-scale nominal wakes. There are two possible approaches, one is to use the same techniques of grid generation and calculation method and validate model-scale nominal wake simulations, and the other option is to validate the method for full-scale total wake simulation.
4.2 From Model-Scale Simulation to Full-Scale Nominal Wake Simulation
The predominant number of wake calculations are currently performed using RANS based CFD methods. These methods solve the time simulation averaged Navier-Stokes equations. However in order to solve the fluid flow problem some additional information regarding the fluid turbulence must be provided. Such additional equations are usually referred to as turbulence models or closures. Past experience (Larsson et al, 2003) shows that the type of turbulence model used in the computations are crucial for the quality of the wake prediction. It is often pointed out that the turbulence closure plays the decisive role (Visonneau, 2005; Hanninen, 2006) in the proper modeling of some wake features such as the wake deficit and so-called “hook-like” flow patterns. Tokyo 2005 and Gothenburg 2010 workshops which represent the highest level of CFD simulation gave the same conclusion.
The purpose of the Gothenburg 2010 Workshop on Numerical Ship Hydrodynamics

The Specialist Committee on Scaling of Wake Field
392
was to assess the performance of contemporary CFD codes used in hydrodynamics. In the workshop three hulls of different types were used and 18 test cases using these hulls were specified by the organizers. 33 groups carried out computations for one or more cases and reported the results. Two nominal wake cases, KVLCC2 and KCS are summarized here.
KVLCC2 is a MOERI tanker with U-shaped stern framelines (Van et al, 1998a, b, Kim et al 2001). It differs from the KVLCC2M, used in the CFD Workshop Tokyo 2005 (Hino, 2005), mainly at the stern contour near the propeller shaft. Towing tank tests were performed at KRISO for a Reynolds number, Re = 4.6×10⁶, and a Froude number, Fr = 0.142, low enough to minimize free-surface effects. The axial velocity contours and cross-flow vectors are available at three different cross-sections, x/Lpp = 0.85 , 0.9825 (propeller plane) and 1.1 (x axis origin at FP directed towards AP). The nominal wake fraction at the propeller plane, determined from towing tank experiments, at several radii were used to perform a more detailed assessment of the computations. Then the transverse evolution of the three velocity components at x/Lpp = 0.9825 and z/Lpp = -0.05075 were checked. The turbulent kinetic energy and five Reynolds stress components (uu, vv, ww, uv, uw) were also available at the propeller plane (x/Lpp = 0.9825) to make possible a more detailed assessment of the results.
Compared to 2000 and 2005, much progress has been made recently towards more consistent and reliable computations of afterbody flows for U shaped hulls. Predictions of the nominal velocity at the propeller plane for a U shaped hull such as the KVLCC2 tanker depends strongly on turbulence modeling. The intensity of the bilge vortex and its related affect on the velocity field is accurately reproduced by a majority of the contributors employing very similar turbulence models, implemented in different solvers and on different grids. Turbulence anisotropy and grid resolution played an acknowledged
prominent role. Around 3 million points were enough to assess the turbulence closures without any significant contamination from discretization errors. The turbulence data confirm that the turbulence anisotropy is large in the propeller disk and more specifically in the core of the bilge vortex. Explicit Algebraic Stress and Algebraic Reynolds Stress Models reproduced satisfactorily the measured structure of the turbulence and currently appear to be the most useful model in terms of robustness and computational cost for this specific flow field, compared to RSM or DES strategies. However, a more detailed analysis of the turbulence characteristics remains to be done through the use of the Reynolds stress anisotropy tensor, anisotropy invariant maps and the analysis of the turbulent kinetic energy budget.
The KCS was used to provide data for both investigation of the flow physics and CFD validation for a modern container ship with a bulbous bow. The ship was towed in calm water conditions (Fr = 0.26, Re = 1.4×10⁷). Measurements of the flow field made at MOERI in 2001 provided the cross-flow velocity vectors, secondary streamlines and axial velocity contours at x/Lpp = 0.9825. The challenge posed by this test case is to simulate accurately the flow field at the propeller plane, which means being able to compute accurately the intensity of the main bilge vortex. Since the measurements do not explore the core of the bilge vortex, it is difficult to determine the exact intensity of the stern bilge vortex and if there is an additional small counter-rotating vortex located below the main bilge vortex.
After comparison of the results from the different contributors, one can see the global agreement between computations and experiments in terms of local velocity profiles is very good. It seems that the DES model tended to predict more intense vortices. It was very interesting to locate the grey zone where both RANSE and LES formulations are used in order to determine the real domain of influence of the LES formulation. The linear isotropic

393
Proceedings of 26th ITTC – Volume II
turbulence models do their job correctly since this flow is not critical in terms of longitudinal vorticity content. It’s advisable to use relatively fine grids (around 3 million points or more, by most of the contributors), which reduces the amount of local numerical diffusion, leading globally to a more accurate flow simulation.
Wang, et al (2010) performed numerical simulation of the viscous wake field and predicted the resistance of the full ship KVLCC2M. The influences of grid type and turbulence model were investigated to get the optimized combination for accurate wake simulation. The method developed for the KVLCC2M is also used for a VLCC, a VLOC, and a 160K oil tanker, and the results agree well with test data. These computational results indicated that structured grids were better than unstructured ones and the RSM model was the best model to capture wake characteristics such as the “hook”. Also, a comparison between a double-model and free surface was made for a full ship, 160k oil tanker. The CFD results showed there was almost no difference
between wake fields and compared well with the test results (Figure 9).
Since it’s relatively easy to validate the model-scale nominal wake, it’s natural to use the method of validated model scale CFD simulations to extend full-scale nominal wake simulations.
Xu (1998) investigated the nominal wake field numerically on a M8503 model at four different orders of Reynolds number, including a full-scale Reynolds. Huang (2009) studied the nominal wake field around a container vessel at three different scales by numerical simulation. The result shows the wake tends to be smaller and contracted to the center of the disc and symmetry with the increasing model length.
Figure 9: Nominal axial wake field, 160k oil tank (RSM)
Lübke (Lübke and Abdel-Maksoud, 2002) investigated three ships at model and full-scale, with and without propellers, the “Ryuko Maru”,
“Ville de Mercure” and the Kriso Container Ship (KCS). The calculations were compared to the available test data. The focus was to investigate if CFD methods are able to give

The Specialist Committee on Scaling of Wake Field
394
acceptable results for the calculation of wake fields in model and full-scale. At model scale, the CFD and experimental results agree with each other very well and the results for full-scale were also encouraging (Figure 10-12).
It must be noted that the majority of the available examples of wake calculations are performed at model-scale. The main reason for this fact is the shortage of full-scale data for validation of numerical solutions. Additionally, the computational effort required for full-scale calculations is much larger, which is a limiting factor for many organizations.
Therefore the Specialist Committee on Scaling of Wake Fields of the 26th ITTC had calculated the model and full-scale wake fields for the KRISO container ship, the Hamburg Test Case, HTC, (container ship “Ville de Mercure”) and the ITU ship (see Figures 7, 8, and 9). The calculated wake fields can be used for the validation of CFD calculations or of wake scaling methods.
For validation purposes this report also contains a comprehensive list of full-scale wake measurements that may be used to check the ability of different numerical wake scaling methods to arrive at the full-scale propeller inflow. Since almost all these full-scale measurements represent the total wake, i.e. the wake in the presence of the working propeller, comparisons should be handled with care. It can either be made on the basis of the nominal wake, which requires correcting the full-scale results for the influence of the working propeller, or it can be made on the basis of the total wake.
model LppM = 6.40 m VM = 1.89 m/s DM = 0.254 m ReM = 1.190 107
ship LppS = 153.7 m VS = 9.26 m/s DS = 6.10 m ReS = 1.196 109
Figure 10: Calculated wake fields – HTC ship
model LppM = 7.279 m VM = 2.196 m/s DM = 0.250 m ReM = 1.480 107
ship LppS = 230.02 m VS = 12.34 m/s DS = 7.9 m ReS = 2.81 109
Figure 11: Calculated wake fields – KCS ship
model LppM = 4.038 m VM = 1.14 m/s DM = 0.17 m ReM = 4.08 106
ship LppS = 149.4 m VS = 6.945 m/s DS = 4.80 m ReS = 0.88 109
Figure 12: Calculated wake fields - ITU ship
In the case that numerical calculations of a nominal full-scale wake shall be used for validation, it is recommended to make sure that the calculation method is able to properly

395
Proceedings of 26th ITTC – Volume II
capture the main features of the wake in question (e.g. vortex structures). Therefore it is recommended that calculation of the nominal model wake field be performed first and then compared to the measured one.
Another option is to validate the wake field calculation on the basis of the final result of the cavitation experiment. This validation means comparison of cavitation extent, cavitation inception, or pressure pulse generation obtained in the cavitation experiment with corresponding full-scale results. This comparison, however, validates rather the numerical chain in total rather than the wake scaling technique alone.
4.3 Twin-Screw Ship Arrangements
The wake of a twin screw ship is a result of the wake field of the ship hull and the wake field caused by the appendages e.g. shaft tube, propeller shaft, shaft brackets etc. Therefore it is important to include all appendages in the CFD calculation of the propeller inflow.
model scale full-scale
Figure 13: Calculated wake fields of a navy ship for model and full-scale
The Figure 13 shows a comparison of the calculated model and full-scale wake field for a navy twin screw ship with propeller shaft and shaft brackets (Abdel-Maksoud, 2002). The differences between the wake field of the model and the ship has a high influence on the accuracy of the predicted cavitation and acoustic behaviour of the ship (cavitation inception speed, unsteady forces at the propeller, propeller induced pressure fluctuations).
4.4 Ships with Wake Influencing Devices
Important aspects of ship and propeller design are the propulsion efficiency and the vibration level in the aft of the ship. There are increasing demands to reduce the propeller induced pressure fluctuations, as well as the underwater noise, and to improve the propulsive efficiency.
The dominant feature for the reduction of the vibration level is the cavitation at the propeller. The cavitation behaviour of the propeller can be influenced by the propeller design, the inflow to the propeller or the working conditions. One possibility to improve the propeller inflow is the fitting of appendages such as wake equalizing ducts, vortex generator fins or spoilers on the ship. The technologies for the use of these appendages have existed for many years, but there is still little knowledge about scale effects on their influence on the propeller inflow.
Wake equalizing ducts (WED) change the velocity field in the range of the wake peak making the propeller inflow more uniform (Ok 2004), (Schneekluth 1986), (von der Stein 1996). The measurement or calculation of the nominal wake field of a ship with a wake equalizing duct isn’t standard. The main reason for this deficiency is that the wake equalizing duct and the spoilers are seen as a part of the propulsion system. Figure 14 shows the results of viscous flow calculations for a container ship with a WED for model and full-scale Reynolds numbers. The calculations show that the WED accelerates the water in the range of the wake peak (the maximum wake fractions are lower). The effect of the WED on the propeller inflow at full-scale is even more developed.

The Specialist Committee on Scaling of Wake Field
396
model scale, ReM = 1.3 107
full-scale, ReS = 1.7 109
Figure 14: Calculated wake fields - ship with Wake equalizing ducts
Vortex generators (VGF) are fins arranged in the aft ship (Han et al. 2006), (Johannsen 2000). The VGF generates a vortex. The size of the VGF depends from the thickness of the local boundary layer. Vortex generator fins produce a distinctly reduction of the wake peak. At model scale the vortices of the vortex generator fins touch the propeller disc. In full-scale the vortices lie above the propeller disc (Figure 15).
model scale, ReM = 1.3 107
full-scale, ReS = 1.7 109
Figure 15: Calculated wake fields - ship with vortex generators fins
The analysis of CFD calculations at the propulsion point of ships with WED or VGF shows that the scale effects on the propulsion coefficients thrust deduction fraction, wake fraction and hull efficiency are in similar dimensions than for the ships without appendages. The use of the known wake scaling methods for ships with WED or VGF is not possible. The wake equalizing duct and the vortex generator fins work differently at model and full-scale due to the different boundary layer thickness at various inflow speeds. An accurate prediction of the propeller inflow at full-scale is only possible with CFD calculations.
4.5 From Full-Scale Total Wake Simulation to Full-Scale Nominal Wake
The other choice of simulating full-scale nominal wakes is to adopt the method of full-scale total wake simulation. The most successful project with this reference is the EFFORT-project. Within the Work Package 4 of EFFORT, seven different hull forms were studied. It was shown that accurate viscous-flow computations are possible at full-scale, which showed good correlation with experimental data measured during sea trials of a ship with specially installed LDV systems.
Despite the suggestions resulting from the analyses of the wake computations performed for the Gothenburg 2000 workshop (Larsson at al., 2003) that the full-scale wake pattern may be less influenced by the turbulence model used, the follow up studies (mainly performed within the scope of EFFORT) show that the selection of the turbulence models plays a crucial role in quality of the wake simulation both in model and full-scale, (Visonneau, 2005). A number of papers following the completion of EFFORT dealt with the problem of turbulence model selection. It has been shown that widely used k- and the k- models perform poorly in the case of wake calculations, although in terms of general flow around the hull (wave pattern, pressure over hull surface, streamlines) the performance is considered satisfactory. The comparison of the computational results with experimental data (especially those resulting from model experiments) revealed that these models fail to appropriately reproduce the vortex structures in the flow. Therefore in the case of ship flows exhibiting the strong influence of the bilge vortices (thus showing the “hooklike” structures or strong vortices in the wake pattern) more sophisticated turbulence models should be used. The first step forward was the application of an improved two-equation turbulence model SST. While it became the widely accepted model for wake-like flow simulation problems some inadequacies are

397
Proceedings of 26th ITTC – Volume II
still under discussion. With respect to full-scale wake computations the application of an Explicit Algebraic Stress Model (EASM) (Visonneau, 2005) or more complex RSM model predict stronger bilge vortex than the SST model. However with the limited full-scale data the definite selection of the most appropriate turbulence model is difficult and should be preceded by additional studies especially focused on the grid size dependency as indicated by Starke et al. (2006).
Obviously, the ability to apply full-scale total wake simulation methods to a full-scale nominal wake would be a convincing CFD calculation; however, with limited resources from full-scale total wake validation this is very difficult to achieve.
4.6 Suggestions for Full-Scale Nominal Wake Simulation
Based on the survey results and the commettee’s analysis, the following factors were selected as having the most influence on the simulation of full-scale nominal wakes.
Free Surface and Sinkage & Trim The computational effort required for the
calculation of the single-phase viscous flow around a ship is in comparison to a two-phase flow calculation with free surface roughly one magnitude smaller. Therefore it is necessary to minimize the model errors for single phase wake field calculations in order to calculate the wake field with the required accuracy. For a slow full ship, it’s usually unnecessary to consider the free surface as well as trim and sinkage. However, for moderate to high speed vessel, such as high-speed container ship the following approach is recommended:
It is essential to incorporate the stern wave in the calculations, due to the circumstance that the area in the propeller plane above the propeller may change considerably, which has a major impact on the wake peak.
The dynamic sinkage and trim has also to be taken into account. Particularly the outer radii of the propeller plane are influenced.
Boundary Layer The treatment of the boundary layer has a
large effect on the calculated wake field. Therefore the thickness of the wall closest grid cell has to be chosen with great care. In case the thickness is chosen such, that it is within the logarithmic boundary layer, wall functions can be applied. At full-scale the resolution of the boundary layer down to the wall, although desired, proves to be most often as too ambitious, due to the much thinner boundary layer compared to model scale. This condition, in general, implies the use of wall functions. Flow separation, due to an increasing pressure gradient, is considered as an issue with less importance at full-scale.
Turbulence Modeling Two-equation turbulence models can be
considered as a de facto standard in the industry. Usually Shear-Stress-Transport (SST) k model performs better than k model in capturing wake characteristics. More advanced seven-equation Reynolds-Stress Transport (RSM) performs the best among almost all the models at both model scale and full-scale, but it requires relatively more computational time. Large eddy simulations demand even more computational resources and are currently considered inadequate for wake field calculations. So far, two-equation models SST k with a low Reynolds-number formulation are considered still to be the choice for wake field calculations for production work. However, if high resolution simulation of wake fields is needed, RSM should be used.
Grid Type and Quality Different cases have shown that structured
grids are better in predicting wake fields than unstructured ones. For different solvers the ranking in quality criteria may vary. The following criteria with the proposed limits may be subject to further discussion.

The Specialist Committee on Scaling of Wake Field
398
Aspect ratios of numerical cells should be smaller than 100 in the undisturbed flow. For wall bounded flows in no-slip conditions much higher ratios are acceptable.
The angle between cells has to be higher than 15°.
Volume change between neighboring grid cells are not allowed to exceed the value of 20.
Computation Factors With respect to numerical computations the
following factors are considered to be relevant.
The computations have to be carried out in double precision mode.
A second order discretization scheme is required for all items.
If a RSM model is used, it’s advisable to perform k model first to provide a good base for the RSM model
Relaxation factors should be adjusted according to the used solver, in general higher values decrease the computational time however may impose problem with convergence. In such cases lower values down to 0.15 shall be used.
A SIMPLE method is recommended to couple velocity and pressure equations.
5. PREDICTION OF SHIP WAKE PATTERN FROM GEOSIM STUDIES
One of the biggest problems in applied Hydrodynamics is the determination of the full-scale wake pattern from wake model tests, so as to be able to design a high efficiency propeller with an optimal behaviour from the
point of view of cavitation, vibrations and noise. The wake scaling methods proposed by Sasajima (1966), Hoekstra (1975), Tanaka (1979, 1983, 1984) and García (1989) have been applied to the geosim models of a cargo ship in order to obtain the configuration of the ship wake. This configuration was quite different depending on the extrapolation method. The same methods were applied for the prediction of the nominal wake configuration of the biggest model (scale 25) using the experimental results of the other two models (scales 34.4 and 60). The main characteristics of the ship are given with Table 1 below.
Table 1: Ship Particulars
SHIP PARTICULARS
LPP 225.00 m
B 32.25 m
T 13.72 m
DISP 84789 tons
LCB 2.32 % LPP
CB 0.830
CM 0.990
CP 0.831
Four models were built at scale factors of 25, 34.4, 45 and 60, and resistance, self-propulsion and wake tests were carried out at El Pardo Model Basin. The models of the geosim family were not only required to be “geometrical similar models” but also “hydrodynamic similar models”. Iso-Froude lines will permit the selection of the models that have a similar hydrodynamic behaviour and to discard the others. The Ctm values of the four models have been plotted against the Log10 of the Reynolds number and the iso-Froude lines drawn with a careful control of the slopes. These lines showed that the Ctm values for the model made at scale 45 were higher than those corresponding to the geosim family.

399
Proceedings of 26th ITTC – Volume II
A survey carried out after the tests confirmed that the model had suffered some deformations in the aft end and in the bottom. For these reasons its test results have not been considered in this study.
The axial wakes from the test results of all models are represented below together with the potential wake obtained towing backwards one of the models, Figure 16.
5.1 Model to Model Extrapolation
The prediction of the nominal wake configuration of the biggest model (scale 25) has been made from the results of the other two models (scales 34.4 and 60) applying the different extrapolation methods mentioned above. Wake prediction values together with the experimental values of the wake of the largest model have been represented for two different sections at the propeller plane (sections perpendicular to the centerplane and parallel to the waterplane, at heights 0.8R and -0.6R) in order to see which extrapolation method gives the best approximation to the test results of the largest model.
0 0.05 0.1 0.15 0.2 0.25 0.3 0.35 0.4 0.45 0.5 0.55 0.6 0.65 0.7 0.75 0.8 0.85
Scale: 60
0 0.05 0.1 0.15 0.2 0.25 0.3 0.35 0.4 0.45 0.5 0.55 0.6 0.65 0.7 0.75 0.8 0.85
Scale: 34.4
0 0.05 0.1 0.15 0.2 0.25 0.3 0.35 0.4 0.45 0.5 0.55 0.6 0.65 0.7 0.75 0.8 0.85
Scale: 25
0 0.05 0.1 0.15 0.2 0.25 0.3 0.35 0.4 0.45 0.5 0.55 0.6 0.65 0.7 0.75 0.8 0.85
Potential Wake Figure 16: Measured axial wakes results for the
three scales tested and the potential wake

The Specialist Committee on Scaling of Wake Field
400
0.8 R Sasajima
0,0
0,1
0,2
0,3
0,4
0,5
0,6
0,7
0 20 40 60 80 1 00 120 140
W
Pred from Scale 60Pred from Scale 34.4T est Scale 25
0.8 R Tanaka
0,0
0,1
0,2
0,3
0,4
0,5
0,6
0,7
0 20 40 60 80 100 120 140
W
Pred from Scale 60
Pred from Scale 34.4
Test Scale 25
0.8 R Hoekstra
0,0
0,1
0,2
0,3
0,4
0,5
0,6
0,7
0 20 40 60 80 100 120 140
W
Pred from Scale 60Pred from Scale 34.4Test Scale 25
0.8 R Garcia
0,0
0,1
0,2
0,3
0,4
0,5
0,6
0,7
0 20 40 60 80 100 120 140
W
Pred from Scale 60Pred from Scale 34.4Test Scale 25
Figure 17: Results for Section 0.8R
- 0.6 R Sasajima
0,0
0,1
0,2
0,3
0,4
0,5
0,6
0,7
0,8
0 20 40 60 80 100 120 140
W
Pred from Scale 60Pred from Scale 34.4T est Scale 25
- 0.6 R Tanaka
0,0
0,1
0,2
0,3
0,4
0,5
0,6
0,7
0,8
0 20 40 60 80 100 120 140
W
Pred from Scale 60Pred from Scale 34.4T est Scale 25
- 0.6 R Hoekstra
0,0
0,1
0,2
0,3
0,4
0,5
0,6
0,7
0,8
0 20 40 60 80 100 120 140
W
Pred from Scale 60Pred from Scale 34.4Test Scale 25
- 0.6 R García
0,0
0,1
0,2
0,3
0,4
0,5
0,6
0,7
0 20 40 60 80 100 120 140
W
Pred from Scale 60Pred from Scale 34.4Test Scale 25
Figure 18: Results for Section 0.6R

401
Proceedings of 26th ITTC – Volume II
Figures 17 and 18 show that the Sasajima, Tanaka and Garcia extrapolation methods give a good approximation to the experimental results while the Hoekstra extrapolations are not so close to the test results of the largest model. The same apply to other studies made with different series of geosim models
6. SURVEY RESULTS
Before preparing guidelines for wake scaling, a wake survey questionnaire was sent to a number of organizations. It was also accompanied by three test cases including the geometry of the ships and measured nominal wakes. The committee intended that the recipients could extrapolate their nominal wakes to full-scale wake. The main aim of sending the test cases was to have an idea of wake extrapolation capability depending on fullness of forms. Because, the first two forms had moderate fullness, the third, a tanker form, had an extreme block coefficient. A good number of responses were obtained with reference to the questionnaire but unfortunately no replies were received for the test cases. Therefore the following paragraphs refer to the analysis of the questionnaire results only.
6.1 Wake Scaling
The participants almost all confirmed performing wake scaling. The purpose of this scaling was mainly propeller design and cavitation investigation. Secondary purposes were input wake simulation and acoustic testing, as well as CFD validation. Participants also agreed that the typical scaling was performed for nominal wakes as well as distributions. Effective wake and average values were of secondary importance. The source of base data comes mainly from measurements. The verification of methods is not clear because positive and negative answers show equality. The source verification mainly is other full-scale observation such as cavitation and pressure pulses etc. The other sources are geosim series tests, full-scale
velocity measurements, and comparison to full-scale velocity measurements. In the testing of geosim series, nominal wake and distributions are usually measured. Participants, in general, were not validating their methods because positive and negative answers again were equal. According to comments of participants, Sasajima and Tanaka‘s wake scaling method play a major role. The Hoekstra method comes in second. Then different participants use their own methods for wake scaling.
6.2 Experimental Testing
The experimental testing facilities are mainly Close Type Cavitation Tunnel and Towing Tank. Other types of facilities are in the minority
6.3 Wake Simulation
Testing facilities commonly use wire screens, dummy hull models, and full hull models for wake simulation. Additional wire screens are not used in facilities using full hull models. On the contrary, additional wire screens are used in facilities using dummy models. Responders commonly admit to carrying out wake velocity measurements. Typical instrumentation systems are pitot tubes and LDV. Scale effect correction is not generally used in the facilities using dummy model or wire screen to produce simulated wake based on wake survey data from towing tanks. Sasajima and Hoekstra methods are commonly used in facilities using dummy model or wire screen in the wake simulation process.
6.4 Numerical Wake Predictions
The majority of institutions use CFD wake results. The purposes of the CFD results are mainly hull quality assessment, hull optimization and propeller design input. Most of the CFD predictions are performed at full-scale. Although most of the institutions have confidence in their results, only half of them perform validation studies, and also they do not

The Specialist Committee on Scaling of Wake Field
402
want to share their CFD results. Full-scale wake results were found satisfactory for the institutions since few of them use model scale CFD wakes. The commonly used methods are Fluent, Star CFD, Uncle, CFD-Ship, Das Boot, Tenasi, Open Foam, Parnassos, FDS3D, Neptune, FS-MINTS and SURF. They are mostly RANS type codes with the exception of Das Boot which is a Potential Flow code. Most of the CFD simulations are used without the contribution of the free surface, but with propeller modelling. Common propeller modelling is based on body forces instead of actual geometry.
7. COMPARISON OF METHODS
One of the important committee’s tasks was the evaluation of different wake scaling methods and recommendation, if possible, of the most suitable method.
7.1 Assessment of the Scaling Methods Based HTC, KCS and ITU Ships
Review of the results of questionnaires submitted to the committee revealed that several different methods are in use for the purpose of wake scaling. Furthermore in the case of five scaling methods their descriptions were available to the committee such that actual calculations could be performed. These methods are listed in Table 2 where scaling methods used in comparison study.
Table 2: Summary of the analytical wake No. Description 1 Mehlhorn 2 Hoekstra 3 Sasajima 4 Tanaka 5 Garcia-Gomez
It was agreed to perform the comparative study based on the same set of data in order to verify the applicability of the methods. The study was intended to use the same input data as proposed by the committee for the questionnaire i.e. HTC form (container vessel),
KCS form (container vessel) and ITU form (tanker). However due to insufficient full-scale experimental data to compare with, it was decided to make the comparison with results of full-scale CFD calculations provided by committee members. Furthermore, taking into account the observed differences between the towing tank wake measurements and model scale CFD results it was decided for the purpose of consistency to use the CFD results for the model scale data as well. Such an approach reflects the view of the committee, that although the quality of the CFD full-scale prediction may vary depending on the computation parameters (such as turbulence model or grid topology) the general dependency on Reynolds number in CFD calculations is correct. Therefore it can be said that the study revealed the robustness of the method in transposing the certain model wake to the corresponding full-scale wake but not the accuracy in predicting the full-scale wake in general. Due to limitation of the wake scaling methods only the axial component was considered.
7.1.1 Methodology of assessment
The assessment was performed in two steps. First the general agreement between the CFD derived full-scale wake and the full-scale wake obtained from a particular method was evaluated. This assessment was done based on the visual analysis of the wake patterns (contour maps of the axial velocity, Figures 19-21). Secondly the method was evaluated using the standard wake assessment procedure proposed by Odabasi and Fitzsimmons (1978) and widely used by many organizations. The aim at this point was to determine the propeller operational conditions imposed by the resulting full-scale wake with reference to the cavitation and pressure pulses. Furthermore it was possible to determine the safety margin of the method in terms of cavitation and excitation risk.

403
Proceedings of 26th ITTC – Volume II
7.1.2 Results
Results of first part of the assessment is provided allowing direct comparison of the differences between full-scale CFD wake and scaled full-scale wake according to each analyzed method. Color contour maps of the axial wake are presented side by side with the CFD derived wake on the left and scaled wake on the right (Figures 19-21). Graphs are bound in groups separately for each investigated ship.
full-scale CFD scaled
Mehlhorn method
Hoekstra method
Garcia-Gomez method
Tanaka method
Sasajima method
Figure 19: Comparison of different scaling methods – HTC ship
full-scale CFD scaled
Mehlhorn method
Hoekstra method

The Specialist Committee on Scaling of Wake Field
404
Garcia-Gomez method
Tanaka method
Sasajima method
Figure 20: Comparison of different scaling
methods – KCS ship
full-scale CFD scaled
Mehlhorn method
Hoekstra method Figure 21: Comparison of different scaling
methods – ITU ship
Garcia-Gomez method

405
Proceedings of 26th ITTC – Volume II
Tanaka method
Sasajima method
Figure 21 (cont.): Comparison of different
scaling methods – ITU ship
Furthermore the radially averaged (0.4≤r/R≤1.1) wake was presented in order to evaluate general characteristics of the wake. Again results of investigated methods were presented against the full-scale CFD (dotted red line) on three plots separately for each ship (Figures 22-24)
0,0000
0,1000
0,2000
0,3000
0,4000
0,5000
0,6000
0,7000
0,8000
0 30 60 90 120 150 180
Angular position [deg]
Wx
Full-scale CFD
Mehlhorn
Hoekstra
Garcia-Gomez
Tanaka
Sasajima
Figure 22: Radially averaged axial wake - HTC
ship
0,0000
0,1000
0,2000
0,3000
0,4000
0,5000
0,6000
0,7000
0 30 60 90 120 150 180Angular position [deg]
Wx
Full-scale CFD
Mehlhorn
Hoekstra
Garcia-Gomez
Tanaka
Sasajima
Figure 23: Radially averaged axial wake - KCS
ship

The Specialist Committee on Scaling of Wake Field
406
-0,2000
0,0000
0,2000
0,4000
0,6000
0,8000
1,0000
0 30 60 90 120 150 180
Angular position [deg]
Wx
Full-scale CFD
Mehlhorn
Hoekstra
Garcia-Gomez
Tanaka
Sasajima
Figure 24: Radially averaged axial wake - ITU
ship
The second step of the evaluation is presented in tables (Tables 3-5) divided into blocks for each investigated method, where the subsequent columns refer to the assessment criteria. The following criteria were used after Odabasi and Fitzsimmons (1978):
1. The maximum wake around the top dead center position of the propeller disc should satisfy: wmax < MIN{0.75; CB}.
2. The maximum acceptable wake peak should satisfy:
3. The width of the wake peak should not be less than θB=360/Z+10 deg.
4. The cavitation number for the propeller tip, defined as:
2
9.903 / 2
0.051P A
n
D Z T
nD
should lay in the safe region defined with reference to non-dimensional wake gradient.
The rows in each block in the table contain the following data: Attained – actual value of the criteria parameter calculated for the
examined wake, Req – required value to satisfy the criterion, Status – presents the non-dimensional measure of criteria satisfaction
and is positive (indicated in green) when the criterion is satisfied or negative (red) when the requirement is not met. Therefore this comparison shows not only the similitude of the examined method to full-scale CFD wake but also indicates if the method tends to give more optimistic results (leading to reduction of the safety margin against the cavitation and excitations).
Table 3: Wake quality assessment – HTC ship
HTC Criterion No. 1 2 3 4
Full-scale CFD
Attained 0,64 0,64 131,29 0,249Req 0,65 0,41 100,00 0,152
Status 0% -58% 31% 63%
MehlhornAttained 0,70 0,70 178,23 0,249Req 0,65 0,52 100,00 0,175
Status -8% -33% 78% 42%
Hoekstra Attained 0,64 0,64 125,68 0,249Req 0,65 0,40 100,00 0,161
Status 1% -61% 26% 55%
Garcia Attained 0,56 0,56 107,11 0,249Req 0,65 0,38 100,00 0,135
Status 13% -48% 7% 84%
Tanaka Attained 0,55 0,55 100,39 0,249Req 0,65 0,35 100,00 0,133
Status 15% -56% 0% 87%
Sasajima Attained 0,66 0,66 79,49 0,249Req 0,65 0,32 100,00 0,156
Status -2% -106% -21% 60%
Req
ReqAttained
407
Proceedings of 26th ITTC – Volume II
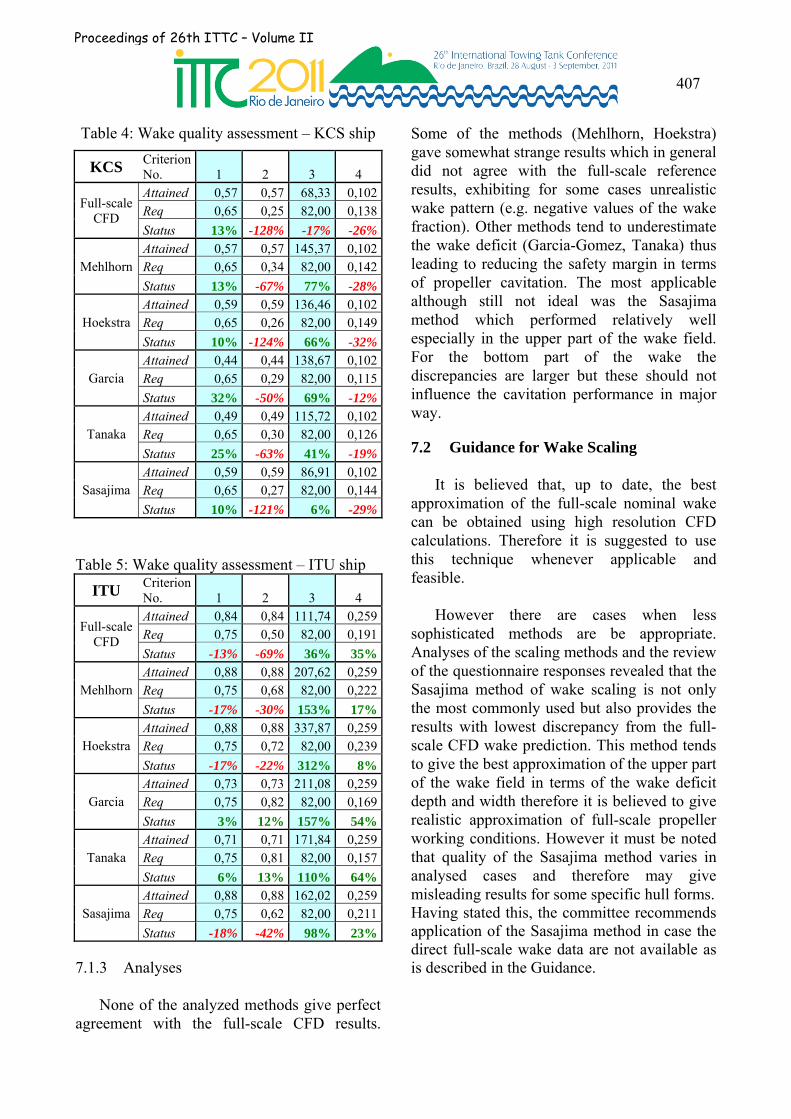
Table 4: Wake quality assessment – KCS ship
KCS Criterion No. 1 2 3 4
Full-scale CFD
Attained 0,57 0,57 68,33 0,102Req 0,65 0,25 82,00 0,138
Status 13% -128% -17% -26%
Mehlhorn Attained 0,57 0,57 145,37 0,102Req 0,65 0,34 82,00 0,142
Status 13% -67% 77% -28%
Hoekstra Attained 0,59 0,59 136,46 0,102Req 0,65 0,26 82,00 0,149
Status 10% -124% 66% -32%
Garcia Attained 0,44 0,44 138,67 0,102Req 0,65 0,29 82,00 0,115
Status 32% -50% 69% -12%
Tanaka Attained 0,49 0,49 115,72 0,102Req 0,65 0,30 82,00 0,126
Status 25% -63% 41% -19%
Sasajima Attained 0,59 0,59 86,91 0,102Req 0,65 0,27 82,00 0,144
Status 10% -121% 6% -29%
Table 5: Wake quality assessment – ITU ship
ITU Criterion No. 1 2 3 4
Full-scale CFD
Attained 0,84 0,84 111,74 0,259Req 0,75 0,50 82,00 0,191
Status -13% -69% 36% 35%
Mehlhorn Attained 0,88 0,88 207,62 0,259Req 0,75 0,68 82,00 0,222
Status -17% -30% 153% 17%
Hoekstra Attained 0,88 0,88 337,87 0,259Req 0,75 0,72 82,00 0,239
Status -17% -22% 312% 8%
Garcia Attained 0,73 0,73 211,08 0,259Req 0,75 0,82 82,00 0,169
Status 3% 12% 157% 54%
Tanaka Attained 0,71 0,71 171,84 0,259Req 0,75 0,81 82,00 0,157
Status 6% 13% 110% 64%
Sasajima Attained 0,88 0,88 162,02 0,259Req 0,75 0,62 82,00 0,211
Status -18% -42% 98% 23%
7.1.3 Analyses
None of the analyzed methods give perfect agreement with the full-scale CFD results.
Some of the methods (Mehlhorn, Hoekstra) gave somewhat strange results which in general did not agree with the full-scale reference results, exhibiting for some cases unrealistic wake pattern (e.g. negative values of the wake fraction). Other methods tend to underestimate the wake deficit (Garcia-Gomez, Tanaka) thus leading to reducing the safety margin in terms of propeller cavitation. The most applicable although still not ideal was the Sasajima method which performed relatively well especially in the upper part of the wake field. For the bottom part of the wake the discrepancies are larger but these should not influence the cavitation performance in major way.
7.2 Guidance for Wake Scaling
It is believed that, up to date, the best approximation of the full-scale nominal wake can be obtained using high resolution CFD calculations. Therefore it is suggested to use this technique whenever applicable and feasible.
However there are cases when less sophisticated methods are be appropriate. Analyses of the scaling methods and the review of the questionnaire responses revealed that the Sasajima method of wake scaling is not only the most commonly used but also provides the results with lowest discrepancy from the full-scale CFD wake prediction. This method tends to give the best approximation of the upper part of the wake field in terms of the wake deficit depth and width therefore it is believed to give realistic approximation of full-scale propeller working conditions. However it must be noted that quality of the Sasajima method varies in analysed cases and therefore may give misleading results for some specific hull forms. Having stated this, the committee recommends application of the Sasajima method in case the direct full-scale wake data are not available as is described in the Guidance.

The Specialist Committee on Scaling of Wake Field
408
8. EXPERIMENTAL METHODS FOR FULL-SCALE WAKE SIMULATION
8.1 Introduction
The goal in general of full-scale wake simulation for experiments is guideline is to generate a wake field for a cavitation test, which represents as well as possible the propeller inflow situation as it is expected to be in reality. The final result of a cavitation experiment, however, may it be cavitation extent, cavitation inception or pressure pulse generation, is additionally influenced by many other uncertainties perhaps cancelling out each other to some extent. Consequently, this increased propeller inflow realism will not necessarily result in an increased reliability of those final results. The methods described below and in the proposed new Guideline “Experimental Scaling of a Model Wake to a Target Wake”, focus on considerations regarding experimental methods to tune a model scale wake field in a cavitation tunnel towards a target wake field. This full-scale target wake field may have been either calculated directly by RANS calculations or simple application of scaling procedures to a model wake field. Very rarely would it be from full-scale wake measurements.
8.2 Direct Simulation of a Target Wake Field
There are mainly two methods in use for cavitation testing, that allow, with more or less accuracy, simulation of any kind of target wake field, i.e. independent of whether it is a model wake field, a full-scale wake field or even any kind of generic wake field (e.g. for research purposes) that is to be simulated. Those methods are
Wake simulation by wire screen technique Wake simulation by parallel plate wake
generator.
For these methods, considerations regarding the target wake and the accuracy of its simulation are necessary indeed, but have been addressed in the procedures mentioned in Section 1 already. Experimental wake scaling techniques, as they are the object of the present guideline, are not an issue when using one of these two methods.
When applying one or more of the experimental wake scaling techniques described here, it is strongly recommended to check its outcome by wake measurements under consideration of ITTC recommended procedures 7.5-02-03-02.3 or 7.5-02-03-02.4 respectively.
Independent of which, one should always keep in mind that the wake field adjusted in the cavitation tunnel is only one little piece of the complicated chain leading to a cavitation or pressure pulse prediction at its end. Many other aspects contribute to the accuracy of this prediction and their individual inaccuracies may to some extent cancel out each other. For this reason the use of a wake scaling method should not be justified by achievement of a particularly good similarity between model and full-scale wake alone, but by achievement of a particularly good similarity of model and full-scale cavitation behaviour or pressure pulse level. One should, for example, be aware of the fact, that the exaggerated model wake field might help to compensate for the under prediction of cavitation that might result from a too low gas content as it is usual in the tunnel water. If so, a more realistic wake simulation would even reduce the accuracy of a cavitation prediction. Resulting from the above it can be stated that the experimental wake scaling procedure has to be carefully adjusted to the individual cavitation testing facility

409
Proceedings of 26th ITTC – Volume II
8.3 Model Wake Field from a Complete Model
8.3.1 Scaling by Water Speed Increase
Wherever possible, the preferred method for wake field generation in a cavitation experiment is the installation of the complete ship model in the test section (see ITTC recommended procedure 7.5-02-03-03.5, section 2.1 from 2008). This setup still does not necessarily generate a model wake as it would be measured in a towing tank under Froude conditions. One reason is that cavitation tests in a large cavitation tunnel without free surface are normally conducted at much higher speed than would result from Froude's scaling law. One has to be aware of the fact that this speed increase results in a higher Reynolds number generating a more full-scale-like wake field. Since principally propeller load and cavitation number can be adjusted at any tunnel water speed in a cavitation tunnel (of course resulting in different tunnel pressures and model propeller speeds and therefore limited by technical constraints of the facility), this freedom gives the opportunity to tune the wake field towards the full-scale wake. A high tunnel water speed can therefore be regarded as one efficient mean for wake scaling, and the recommendation is simply to chose the speed as high as possible to come as close as possible to the full-scale Reynolds number.
For cavitation experiments carried out in a depressurized towing tank or any other facility with a free surface the deviation from Froude's scaling law has to be handled with extreme care, since it will spoil the full-scale similarity of the wave wake. The latter, however, is the main reason for performance of cavitation tests in a free surface facility.
8.3.2 Scaling by Flow Guiding
Besides the different speeds, another difference to the towing tank situation is that the test section of a cavitation tunnel normally offers a much more restricted cross section. In
a distance from the ship model where in the towing tank the water particles are still able to form natural flow lines as in reality, the tunnel walls of a cavitation tunnel already force the particles to go straight along the tunnel wall. To avoid this wake deformation, one can install so-called flow liners. These devices can also be used to tune the flow not only towards the unrestricted (tank) situation, but even towards the high Reynolds number full-scale situation. This correction, however, requires a careful flow liner layout based on RANS calculations. It is recommended that flow lines be calculated at full-scale Reynolds number in an unlimited flow regime and to shape the flow liner along these calculated flow lines around the afterbody. The liners should range from the aft shoulder of the ship model sufficiently far behind the propeller plane (at least three propeller diameters) as illustrated in Figure 25.
Figure 25: Flow liners in a cavitation tunnel using a complete ship model for wake
simulation Since each hull form naturally leads to a different flow liner geometry, this expensive technique might be restricted to research purposes
8.3.3 Scaling by Model Shortening
Shortening the ship model is a well known technique to reduce the boundary layer

The Specialist Committee on Scaling of Wake Field
410
thickness, making the frictional model wake more similar to full-scale. In cases of ships having a considerable parallel midship section, it is recommended to shorten this section to achieve the best results. In cases where this region is not long enough to achieve a sufficient shortening, it is recommended to (additionally) reduce the model length in the forebody rather than in the afterbody. For this purpose it is reasonable to replace the original forebody by a shorter dummy piece as shown in Figure 26. An easy relation to estimate the required shortening can be derived from simple flat plate boundary layer considerations according to Johannsen (1992):
111.1
111.0
ship
watertunnelshipmodelshortened V
Vll
where l [m] is the length of ship and model respectively, V [m/s] is the tunnel water or ship speed and is the model scale factor.
Figure 26: Shortening of a container vessel model.
8.3.4 Scaling by Adjustment of a Local Significant Advance Coefficient
When performing cavitation tests at high tunnel water speed, i.e. violating Froude's scaling law, the identity of model and full-scale cavitation number can be achieved in one horizontal plane only at the same time. According to ITTC recommended procedure 7.5-02 03-03.1, section 2.10, this horizontal
plane should be located in a depth, where the cavitation predominantly occurs. This is normally around 0.8 to 0.9 R at the top of the propeller disk. It can be reasonable, to do something similar with respect to the inflow velocity. Normally, the tunnel water speed is adjusted to meet a certain KT-value for the model propeller (thrust identity, see above procedure, section 2.2). This KT, however, is an integral value, and for wake scaling purposes it can be worthwhile to deviate from the resulting speed to achieve full-scale identity of a local advance coefficient J instead. If so, J-identity should be achieved in the same region as described above with respect to the cavitation number, i.e. in the region of maximum wake. Due to scale effects the 12 o'clock wake peak behind the ship model is generally deeper than at full-scale and compensation of this scale effect will require a higher tunnel water speed than obtained from KT-identity. When applying this wake scaling method it is recommended to determine the correct tunnel water speed by comparative RANS calculations of the model and full-scale wake field of the ship under consideration.
With respect to free surface facilities the caveats mentioned under "Scaling by Water Speed Increase" apply here as well.
8.3.5 Scaling by Hull Surface Treatment
Due to the low Reynolds number at model scale, flow separation may occur earlier on the hull than on the real ship. Similar to the dents in a golf ball it is possible to reduce this scale effect to some extent by surface treatment of the model hull. Sand roughening or wire screens along the surface are in use for this purpose. This technique, however, should be handled with care since the unrealistic surface roughening might also stimulate unrealistic cavitation. Further-more theoretical considerations are nowadays still impossible to quantify the effect of this technique. Even more than with the other techniques described in this procedure, it is recommended to check its

411
Proceedings of 26th ITTC – Volume II
outcome by a wake measurement when applying it to a cavitation experiment
8.4 Model Wake Field from a Dummy Model
A dummy model should be used in medium sized cavitation tunnels for cavitation tests and pressure fluctuation measurements. The afterbody of the dummy model must be similar to the ship. The length of the geometric similar after body depends on the dimension of the test section and the blockage factor. The test section blockage should not exceed 25 %.
Attention should be paid to the design of the fore body. The first step of the wake field simulation should be a check that no flow separation on the dummy model occurs.
The wake field of the dummy model at a given inflow speed should be measured to get the necessary information regarding the wake field simulation. Typically, the wake of a small dummy model results in a wake peak that is even less pronounced than in full-scale. Wire mesh screens can therefore be mounted perpendicular to the hull to simulate the predicted full-scale propeller inflow. The configuration used strongly depends on the skills of the model basin and on existing correlation data between model and full-scale.
The wake scaling by additional wire screen patches is a time consuming iterative process of wire screen modifications and wake measurements to achieve the target propeller inflow. During the wake field simulation the rudder should be dismounted. Measurement of the wake can be performed by using any suitable velocimetry technique. When using Pitot tube or Laser Doppler Velocimetry, ITTC procedures should be followed.
The simulated wake shall be documented to verify that the deviation from the target wake can be neglected.
Since, depending on its dimensions, the dummy hull model alone normally generates a wake peak, which is less pronounced than at full-scale, the scaling techniques described in section 4.1 must be regarded as counterproductive with respect to full-scale wake similarity. In spite of this fact an increased tunnel water speed (resulting in a higher model propeller speed) may be reasonable to achieve a high propeller Reynolds Number during the cavitation test as recommended by ITTC procedure 7.5-02-03-03.1, section 2.2.
8.5 New Concept of using ‘Smart Dummy’ Models
A so called ‘Smart Dummy’ concept to simulate the wake scale effect in cavitation tests was presented by Schuiling et al. (2011). The Smart Dummy is a geometrically non-similar ship model with full-scale wake field resemblance. The name ‘Smart Dummy’ originates from the dummies used in cavitation tunnels in which large geometrically similar models would not fit. Similar to conventional dummy models the stern above the propeller and the clearance between the hull and the propeller shaft are similar to full-scale. On the base of viscose flow calculations changes in the afterbody were made to obtain the predicted full-scale wake field (Figure 27). The Smart Dummy follows the ship scale wake accurately everywhere except in the bottom quarter of the propeller disc (Figure 28).
Figure 27: View from behind the Smart Dummy design (left), and the original geosim
hull (right)

The Specialist Committee on Scaling of Wake Field
412
Figure 28: Axial wake velocities of the Smart Dummy design (left) compared to those at ship
scale (right).
8.6 Limitations
In cases where no experimental wake scaling can be used in a cavitation experiment, one should at least be aware of the effects that this deficiency may cause
over prediction of suction side cavitation extent
inception of suction side cavitation at lower cavitation numbers already
under prediction of pressure side cavitation extent
over prediction of safety margin against face cavitation inception
over prediction of first harmonic hull pressure pulses
influence on higher harmonic pressure pulses in either direction.
While most of the above mentioned deviations lead to a full-scale prediction on the safe side, one should be particularly aware of the fact that higher harmonic pressure pulses as well as pressure side cavitation phenomena
might appear less critical in the experiment than in full-scale.
9. RECOMMENDATIONS TO THE CONFERENCE
The 26th ITTC Specialist Committee on Scaling of Wake Field recommends the adoption of the changes to the four existing procedures to reference the new guidelines:
7.5-02-03-03.1: Model-Scale Cavitation Test
7.5-02-03-03.3: Cavitation Induced Pressure Fluctuations Model Scale Experiments
7.5-02-03-03.5 Cavitation Induced Erosion on Propellers, Rudders and Appendages
7.5-02-03-03.6: Podded Propulsor Model-Scale Cavitation Test
and the acceptance of one new guideline, “Experimental Scaling of a Model Wake to a Target Wake.”
Additionally, the committee recommends that the ITTC:
1. Recognize the need for Validation Data and support efforts to fill this need, specifically the need for Full-Scale data and cavitation tunnel data over a wide speed range including at high Re.
2. Recommendation for ITTC Committees
That the Specialist Committee on CFD develops procedures for Simulating Model Scale and Full-Scale Nominal Wakes.
o and specifically focus on the use and validation of CFD methods for

413
Proceedings of 26th ITTC – Volume II
wake scaling and determination of nominal full-scale wakes
o and explores other techniques for direct numerical simulation of wakes (LES, DNS, SPH, etc).
That the Propulsion Committee examines and monitors other methods of target wake simulation, e.g. the “smart” dummy approach,
10. NOMENCLATURE
10.1 Data Reduction Equations
Froude Number V
FrgL
Reynolds Number VL
Re
Depth of wake peak max minw w w
10.2 Definition of Variables
g Gravity constant (m/s2)
k Three dimensional form factor of plate friction (-)
lshipl Length of ship [Normally LWL] (m)
lshortened model Length of shortened model (m)
n Rate of revolution (Hz)
t Thrust deduction fraction (-)
w Taylor wake fraction in general (-)
wTM Taylor wake fraction in model scale (-)
wTS Taylor wake fraction in ship scale (-)
AE Expanded blade area (m2)
A0 Disc area (m2)
CFM Frictional resistance coefficient of a corresponding plate ITTC 57 Model-Ship correlation line in model scale
CFS Frictional resistance coefficient ITTC 57 Model-Ship correlation line in ship scale
ˆpK Variation the size of cavitation volume (m)
L Representative Length [Normally LWL for Fr and Re] (m)
LPP Length between perpendiculars (m)
LWL Length on static waterline (m)
V Speed (m/s)
Vtunnel speed Tunnel Flow Speed (m/s)
T Propeller thrust (kN)
Z Number of propeller blades (-)
CF Roughness allowance (-) Scale ratio(-) Displacement of ship (m3)
11. REFERENCES & BIBLIOGRPAPHY
11.1 References
Abdel-Maksoud, M.; Heinke, H.-J., 2002; ”Use of CFD Tools to Assess Under-Water Signature” MECON Conference, Hamburg 2002
Abels, W., 2006, "Reliable Prognosis of Propeller Excited Pressure Pulses on the Ship Hull by Means of Correlation of Direct Calculations", Phd Thesis, Technical University Hamburg-Harburg, Germany, (in German)
Carlton, J. S., 2001, “The Propulsion of a Large Container Ship, a Note on the Propulsion Options,” Proceedings Symposium on Mega-Container Ship in Future, the Kansai Society of Naval Architects, Kobe, Japan
Chai et al., 1981, "Comparison and Analysis of the Wake Distribution of the Passenger Ship Hong Xing 514 and its Model", Proceedings of the 16th ITTC
Day, W. et al., 1980, "Full Scale Propeller disk Wake Survey and Boundary Layer Velocity Profile Measurements on the 154-Foot Ship R/V Athena", DTNSRDC Report 0833-01
Dyne, G., 1974, “A Study of Scale Effects on Wake, Propeller Cavitation and Vibratory Pressure at Hull of Two Tanker Models”. SNAME Annual Meeting, New York

The Specialist Committee on Scaling of Wake Field
414
Gad-el Hak, M.; Bandyopadhyay, P. R. 1989, “Reynolds Number Effects in Wall-Bounded Flows” Applied Mechanics Reviews, 47, pp. 307-365
García Gómez A. “Predicción y Análisis de la Configuracion de la Estela en Buques de una Hélice” PhD Thesis, Universidad Politénica de Madrid, 1989
García Gómez A. , “On the Form Factor Scale” Ocean Engineering January 2000 , 25th International Towing Tank Conference, The Specialist Committee on Powering Performance Prediction Report, Fukuoka, 2008
Han, J.-M., Kim, J.-J. et al., 2006, “Application of Flow Control Devices to Improve Propeller Cavitation Performances”, 9th Symposium on Practical Design on Ships and Other Floating Structures, PRADS2004, Lübeck-Travemünde
Han K-J., Larsson L., Regnstrom B., 2006, “Numerical Optimization of the Propeller Behind a Ship Hull at Full Scale,” 26th Symposium on Naval Hydrodynamics, p.12
Hanninen, S. and Mikkola, T., 2006, “Computation of Ship-Hull Flows at Model- and Full-Scale Reynolds Numbers”, Maritime Institute Seminar
Hoekstra H., “Prediction of Full ScaleFull-scale Wake Characteristics Based on Model Wake Survey”. International Shipbuilding Progress, Vol. 22, 1975
Huang, J.B., et al,2009, “CFD Study on Scale Effect of Nominal Wake,” Proceedings of the 9th National Congress on Hydrodynamics and 22nd National Conf. on Hydrodynamics (in Chinese)
Huse, E., 1972, “Pressure Fluctuations on the Hull Induced by Cavitating Propellers,” Norwegian Ship Model Experiment Tank Publ. No. 111
ITTC-Recommended Procedure 7.5 - 02 03 - 01.4: "1978 ITTC Performance Prediction Method", 1978
Johannsen, C., 1992, "Correlation Investigations on Cavitation, Pressure Pulses and Noise with Ship Models of Regular Length and Shortened Models in HYKAT", Part A: "Wake, Cavitation and Pressure Pulses", Report No. 1575, Hamburg Ship Model Basin (in German)
Johannsen, C., 2000, “Recent Considerations on Dealing with Propeller Induced Hull Pressure Pulses”, International Conference on ship and shipping research, NAV2000, Venice
Komura, T., Yamaguchi, H., and Kato, H., 1992, “Measurement of Full Scale Ship Wake by Tracer and Multi TV Camera System", Journal of Naval Architecture and Ocean Engineering, Vol. 30
Koronowicz T., Tuszkowska T., and Wacławczyk T., 2003, “A Computer Method for Prediction of the Velociy Field Behind a Full-Scale Ship Hull,” Polish Maritime Research, Vol. 1
Koronowicz T., Miller W., Bugalski T., 2003, “The Influence of the Scale and Propeller Operation on the Velocity Field Behind a Ship Hull”, 15th International Conference on Hydrodynamics in Ship Design, Safety and Operation, Gdansk, Poland
Kuiper et al., 2002, "Propeller Inflow at Full Scale during a Manoeuvre", 24th Symposium on Naval Hydrodynamics, Fukuoka, Japan
Kux, J., Niemeier, T., and Stöhrmann, H., 1982, "LDV Wake Measurements Onboard Sydney Express", Report No. 424, Shipbuilding Institute, University of Hamburg (in German)

415
Proceedings of 26th ITTC – Volume II
Kux, J. et al., 1985, "Correlation of Wake Measurements at Model and Full Scale Ship", 15th Symposium on Naval Hydrodynamics, Washington D.C., USA
Lammers, G., Laudan, J., and Stöhrmann, H., 1987, “Application of Laser Doppler Velocimetry to Marine Engineering Research”, Proc. of the 18th ITTC, Kobe
Lammers, G., Laudan, J., and Stöhrmann, H., 1989, “Correlation of Wake, Cavitation and its Con-sequences", Report No. 1565, Part A: "Wake”, Hamburg Ship Model Basin (in German)
Lau, 1975, “Development and Test of an Arrangement for Boundary Layer and Wake Measurement at the Fishery Research Vessel Prof. Siedlecki”, Report No. 996, Shipbuilding Institute, Berlin-Potsdam (in German)
Laudan, J., 1983, “Correlation of Wake Measurements in Model and Full Scale”, Report No. 1529, Hamburg Ship Model Basin (in German)
Larsson, L., Stern, F., and Bertram, V., 2003, “Benchmarking of Computational Fluid Dynamics for Ship Flows” The Gothenburg 2000 Workshop, Journal of Ship Research, 47, pp 63-81
Lübke, L., and Abdel-Maksoud, M., 2002, Berechnung des Nachstromfeldes der Großausführung, STG Sprechtag 2002, Hamburg, November
Mehlhorn, T. Verfahren zur Berücksichtigung des Maßstabseffekts auf den Nachstrom Internationales Schiffstechnisches Symposium, Rostock, Nov. 1983
Norris, C., 1984, “On the Use of Laser Velocimetry in the Full Scale Ship's Environment”, Proceedings of the 17th ITTC
Ogiwara, S., 1994, “Stern Flow Measurements for the Tanker Ryuko Maru in Model Scale, Intermediate Scale and Full Scale Ships”, Proc. of CFD Workshop, Tokyo
Sasajima, H. and Tanaka, I., 1966, “On the estimation of wakes of ships”. XI ITTC, Tokyo
Schuiling, B.; Lafeber, F. H.; van der Ploeg, A. van Wijngaarden, E., 2011, “The Influence of the Wake Scale Effect on the Prediction of Hull Pressures due to Cavitating Propellers”, Second International Symposium on Marine Propulsors, smp’11, Hamburg, Germany, June
Starke, B., Windt, J., and Raven, H. C., 2006, “Validation of Viscous Flow and Wake Field Predictions for Ships at Full-Scale”, 26th Symposium on Naval Hydrodynamics, Rome, Italy, 17-22 September 2006
Stöhrmann, H., 1983, “LDV Wake Measurements onboard St. Michaelis”, Report No. 433, Shipbuilding Institute, University of Hamburg (in German)
Stöhrmann, H., and Kux, J., 1983, “Measurements in the Velocity Field of the Wake of the Frigate F 122 'Bremen' Using a Laser-Doppler-Velocimeter”, Report No. 2336, Shipbuilding Institute, University of Hamburg (in German)
Takahashi, 1971, “Measurement of Velocity Distribution Ahead the Propeller Disk of the Ship”, Transactions of the West Japan Society of Naval Architects, No. 42, pp. 153-168
Tanaka I., 1979, “Scale Effects on Wake Distribution and Viscous Pressure Resistance of Ships”. Journal of Kansai SNAJ, n.146
Tanaka I., 1983, “Scale Effects on Wake Distribution of Ship with Bilge Keels”. Autumn Meeting of SNAJ, 1983

The Specialist Committee on Scaling of Wake Field
416
Tanaka, I., Suzuki, T., 1984, “Investigation of Scale Effects on Wake Distribution using Geosim Models”. J. of Kansai SNAJ, N. 192
Tanibayashi, H., 1990, “Full Scale LDV Measurements of Ship Stern Flow”, Group Discussion at the 19th ITTC, Madrid
Tanibayashi, H. et al., 1991, “Full-Scale LDV Measurements of Ship Stern Flow”, Osaka Colloquium
Nagamatsu Tetsuo, 1979, “A Method for Predicting Ship Wake from Model Wake,” Journal of the Society of Naval Architects of Japan, 日本造船学学論文集 (146), pp.43-52 19791200 The Japan Society of Naval Architects and Ocean Engineers
Visonneau, M., 2005, “A Step Towards the Numerical Simulation of Viscous Flows Around Ships at Full-Scale – Recent achievements within the European union project effort”, Marine CFD 2005, Southampton, UK
Ok, J.-P., 2004, “Numerical Investigations of Scale Effects of Schneekluth’s Duct”, Technische Universität Hamburg-Harburg, Bericht Nr. 628, October 2004, ISBN 3-89220-628-7
Schneekluth, H., 1986, “Wake Equalizing Ducts”, The Naval Architect
von der Stein, N., 1996, “12 Jahre Schneekluth-Zuströmdüse”, HANSA, Nr. 7
Wang, J.B. et al, 2010, “Numerical Simulation of Viscous Wake Field and Resistance Prediction Around Slow-Full Ships,” Journal of Hydrodynamics, Ser. A, 9, (in Chinese)
Weitendorf, E.-A., 1977, Der kavitierende Spitzenwirbel eines Propellers und die daraus resultierenden Druck-schwankungen Schiffstechnik 24
Wijngaarden, E. van, 2005, “Recent Developments in Predicting Propeller-Induced Hull Pressure Pulses”, Proc. of the 1st Int. Ship Noise & Vibration conf. 2005, June 20-21, London, UK
Xu, J., Zhou, L.D., and Gao, Q.X.,1998, “Numerical Simulation of Scale Effect on Nominal Wake,” Journal of Hydrodynamics (in Chinese), April
Yazaki, A., 1969, “A Diagram to Estimate the Wake Fraction for a Actual Ship from a Model Tank Test", 12th ITTC, Rome
11.2 Literature Survey
Chun, H.-H.; Park, J.-C.; Choi, H.-J.; Yoon, H.-S.; Kang, D.-H., 2004, “Numerical Study on Turbu-lent Flow around Ship Models Using a Large Eddy Simulation Technique”, 25th Symposium on Naval Hydrodynamics, St. John’s, NL, Canada, August 9, Vol. 2, pages 142 – 150
G.B. Deng, P. Queutey, M. Visonneau, 2006, “Computation of model and full-scale flows around fully-appended ships with an unstructured RANSE solver”, 26th Symposium on Naval Hydro-dynamics, Rome, Italy
Gorski, J. J.; Miller, R. W.; Colemann, R. M.: “An Investigation of Propeller Inflow for Naval Surface Combatants”, 2004, 25th Symposium on Naval Hydrodynamics, St. John’s, NL, Canada, August 9, Vol. 2, pages 151 – 166
Hally, D., “The Wakes of Idealized Propeller Shafts with Cross-flow and Rotation”,2004, 25th Symposium on Naval Hydrodynamics, St. John’s, NL, Canada, August 9, Vol. 2, pages 167 – 174
Hino, T., (2005 ed.), “Proceedings of CFD Workshop Tokyo 2005, NMRI report 2005

417
Proceedings of 26th ITTC – Volume II
ITTC Report of the Propulsion Committee, 2002, Proceedings of the 23rd ITTC, Volume I, Venice
Kim, W.J., Van, S.H. and Kim, D.H., 2001, “Measurement of Flows Around Modern Commercial Ship Models,” Exp. in Fluids, Vol. 31, pp 567-578
Ligtelijn, J. T., van Wijngaarden, H. C. J., Moulijn, J. C.; Verkuyl, J. B., 2004,. “Correlation of Cavitation Comparison of Full-Scale Data with Results of Model Tests and Computations”, SNAME annual meeting, Washington D.C.
Lillberg, E.; Svennberg, U.,2004, “Large Eddy Simulation of the Viscous Flow around a Ship Hull Including the Free Surface”, 25th Symposium on Naval Hydrodynamics, St. John’s, NL, Canada, August 9, Vol. 2, pages 64 – 74
Pittaluga, C., Avellino, G., Traverso, A., 2004, “Numerical and Experimental Analysis of the Viscous Flow around the Stern of a Fully-Appended RoRo Vessel”, 9th International Sympo-sium on Practical Design of Ships and other Floating Structures, Lübeck-Travemünde, September, Vol. 2, pages 833 – 839
D. Radosavljevic, S. Whitworth, 2010, “Advanced CFD techniques applied to practical ship problems”, LR TID.
Van, S.H., Kim, W.J., Yim, D.H., Kim, G.T., Lee, C.J., and Eom, J.Y., 1998, “Flow Measurement around a 300K VLCC Model,” Proceedings of the Annual Spring Meeting, SNAK, Ulsan, pp. 185-188
Van, S.H., Kim, W.J., Yim, G.T., Kim, D.H., and Lee, C.J., 1998, “Experimental Investigation of the Flow Characteristics Around Practical Hull Forms,” Proceedings 3rd Osaka Colloquium on Advanced CFD Applications to Ship Flow and Hull Form Design, Osaka, Japan
Van, S.H., Park, I.-R., Kim, J., Park, N.-J., Choj, Y.-B., 2004, “Hydrodynamic Performance Analysis for the Twin-Skeg Container Ship”, 9th International Symposium on Practical Design of Ships and other Floating Structures, Lübeck-Travemünde, September, Vol. 2, pages 1021 – 1026
Wang, J.B. et al, 2010 “Numerical Simulation of Viscous Wake Field and Resistance Prediction around Slow-Full Ships Considering Free Surface,” Symposium on ship hydrodynamics,Berchiche, N., Janson C-E., 2005, “Flow Simulation of a Propeller in Open Water Condition and Experimental Validation,” NuTTS.
Yoko K, Takahashi H et al. 1988, “Comparison of Wake Distributions between Ship and Model” Journal of Kansai SNAJ