Embed Size (px)
Citation preview

7/29/2019 10 Overall Equipment Effectiveness
http://slidepdf.com/reader/full/10-overall-equipment-effectiveness 1/25
Lean Six Sigma Operational - Delegate Workbook
SSG06101ENUK - OEE/Issue 1.1 / April 2008 1 ©The British Standards Institution 2008
Overall EquipmentEffectiveness
2
SSG06101ENUK – Delegate Slides/Issue 1.1/ April 2008
Industry has traditionally used Labour Efficiency to
set targets for Numbers produced per day andmeasure performance.
itemperTimeStd
timeShiftsizeCrew Target
××××====
This is appropriate for manual processes. Except that itinduces all kinds of bad behaviours.
Target
ProducedNo.Efficiency =
Manufacturing Losses

7/29/2019 10 Overall Equipment Effectiveness
http://slidepdf.com/reader/full/10-overall-equipment-effectiveness 2/25
Lean Six Sigma Operational - Delegate Workbook
SSG06101ENUK - OEE/Issue 1.1 / April 2008 2 ©The British Standards Institution 2008
3
SSG06101ENUK – Delegate Slides/Issue 1.1/ April 2008
Manufacturing Losses
• For machine based processes this efficiency
measure is inappropriate:
Emphasis is focused on Labour
The target becomes a quota; either easy, too hard or
occasionally just right
Machines breakdown or run at a particular speed
regardless of how many people are in attendance or
how hard they work
Machine downtime is lost once labour is redeployed
Overall EquipmentEffectiveness (OEE)A Better Metric

7/29/2019 10 Overall Equipment Effectiveness
http://slidepdf.com/reader/full/10-overall-equipment-effectiveness 3/25
Lean Six Sigma Operational - Delegate Workbook
SSG06101ENUK - OEE/Issue 1.1 / April 2008 3 ©The British Standards Institution 2008
5
SSG06101ENUK – Delegate Slides/Issue 1.1/ April 2008
• Developed By The Japanese Institute of Plant
Maintenance (JIPM) in 1971,to overcome
“Manufacturing Chaos” such as:
Plant Availability
Plant Performance (which includes people’s
performance if relevant)
Quality Levels
Overall Equipment Effectiveness (OEE)
6
SSG06101ENUK – Delegate Slides/Issue 1.1/ April 2008
What’s OEE for:
• Performance measurement
• Identifying and understanding losses
• To make us think about how to reduce losses
and ultimately eliminate losses
• Who?
• Production
• Engineering
• QA, Engineering, etc

7/29/2019 10 Overall Equipment Effectiveness
http://slidepdf.com/reader/full/10-overall-equipment-effectiveness 4/25
Lean Six Sigma Operational - Delegate Workbook
SSG06101ENUK - OEE/Issue 1.1 / April 2008 4 ©The British Standards Institution 2008
7
SSG06101ENUK – Delegate Slides/Issue 1.1/ April 2008
8
SSG06101ENUK – Delegate Slides/Issue 1.1/ April 2008
Who uses OEE?
• All the “Big Players” such as “Ford” use OEE as a
performance indicator, and it is generally
accepted that:
An OEE of 85% is a “World Class” Performance
• Companies working out their OEEs for the first
time are taken aback by 20-30% performance

7/29/2019 10 Overall Equipment Effectiveness
http://slidepdf.com/reader/full/10-overall-equipment-effectiveness 5/25
Lean Six Sigma Operational - Delegate Workbook
SSG06101ENUK - OEE/Issue 1.1 / April 2008 5 ©The British Standards Institution 2008
9
SSG06101ENUK – Delegate Slides/Issue 1.1/ April 2008
How does OEE drive improvement?
• Local Metric – its for the shop floor and productionsupervision to measure performance and look forimprovement opportunities
Keep Graph Overall and 3 contributors at Gemba – supportwith Cause and Effect Diagrams & Action lists. Part of aVisual Management System
Does the workforce get the most from the plant? Is a fairquestion
• Production Engineering often “own” the plant. What’s thebottle neck process? Can it be speeded up? Why does theplant produce defects? Why do minor stoppages occur?Often a big contributor - count them
10
SSG06101ENUK – Delegate Slides/Issue 1.1/ April 2008
How does OEE drive improvement?
• Maintenance – Spares holding and positioning.Fitter availability. Preventative maintenance.Change over time reduction (not frequencyreduction)
• SMED for change over:
External Activities get ready: materials, tools, parts,information
Internal – Speed up – quick release couplings etc
Write SOPs so people know what they are doing

7/29/2019 10 Overall Equipment Effectiveness
http://slidepdf.com/reader/full/10-overall-equipment-effectiveness 6/25
Lean Six Sigma Operational - Delegate Workbook
SSG06101ENUK - OEE/Issue 1.1 / April 2008 6 ©The British Standards Institution 2008
11
SSG06101ENUK – Delegate Slides/Issue 1.1/ April 2008
But
• Don’t forget schedule attainment – high OEE
making something a customer doesn’t want is
waste
• OEE plant wide is an average nonsense. Target
critical machines – Bottle necks then Pareto
• Don’t make OEE an end in itself, be sensible with
cost of improvements ie large cost vs small gainwould be counterproductive waste
12
SSG06101ENUK – Delegate Slides/Issue 1.1/ April 2008
Record OEE data over a period of several weeks (or days):
Week No Availability Performance Quality OEE
1 0.80 0.80 0.99 0.63
2 0.90 0.85 0.98 0.75
3 0.85 0.87 0.98 0.72
4 0.70 0.92 0.99 0.64
5 0.75 0.89 0.97 0.65
6 0.95 0.92 0.90 0.79
7 0.92 0.85 0.96 0.75
What target? Best of best
7/29/2019 10 Overall Equipment Effectiveness
http://slidepdf.com/reader/full/10-overall-equipment-effectiveness 7/25
Lean Six Sigma Operational - Delegate Workbook
SSG06101ENUK - OEE/Issue 1.1 / April 2008 7 ©The British Standards Institution 2008
13
SSG06101ENUK – Delegate Slides/Issue 1.1/ April 2008
Note the Best recording for “Availability”:
Week No Availability Performance Quality OEE
1 0.80 0.80 0.99 0.63
2 0.90 0.85 0.98 0.75
3 0.85 0.87 0.98 0.72
4 0.70 0.92 0.99 0.64
5 0.75 0.89 0.97 0.65
6 0.95 0.92 0.90 0.79
7 0.92 0.85 0.96 0.75
What target? Best of best
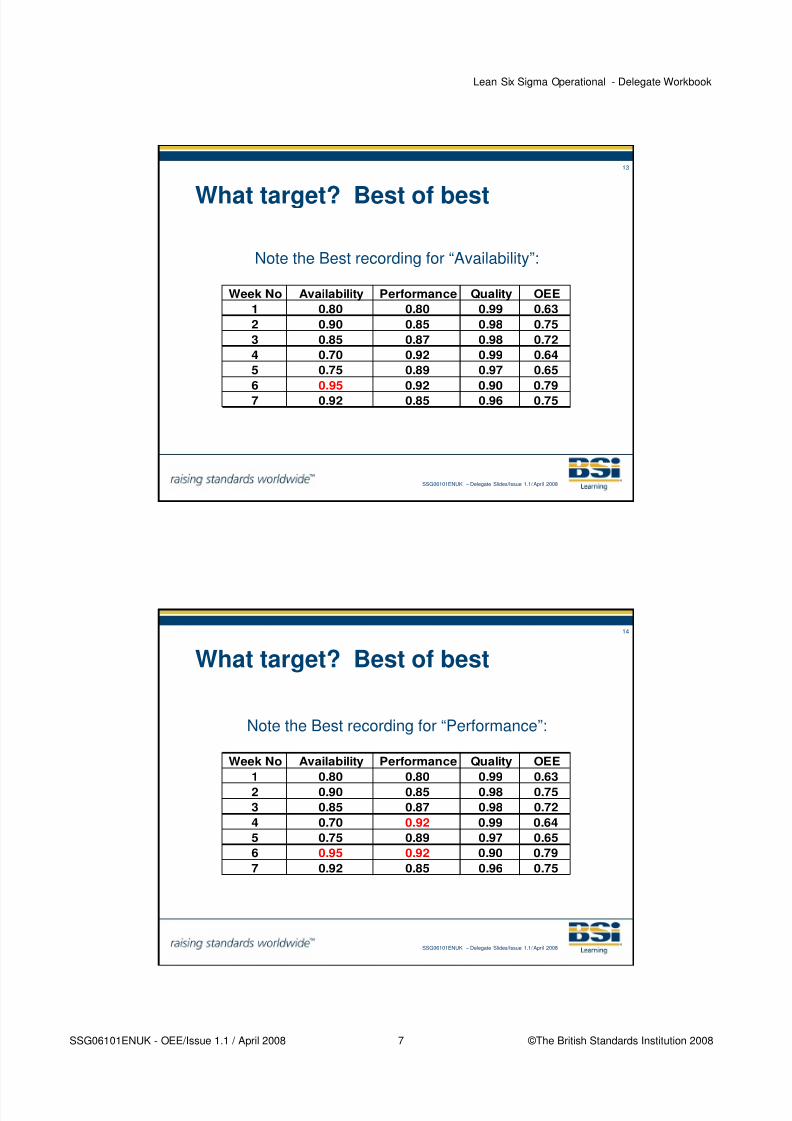
14
SSG06101ENUK – Delegate Slides/Issue 1.1/ April 2008
Note the Best recording for “Performance”:
Week No Availability Performance Quality OEE
1 0.80 0.80 0.99 0.63
2 0.90 0.85 0.98 0.75
3 0.85 0.87 0.98 0.72
4 0.70 0.92 0.99 0.64
5 0.75 0.89 0.97 0.65
6 0.95 0.92 0.90 0.79
7 0.92 0.85 0.96 0.75
What target? Best of best
7/29/2019 10 Overall Equipment Effectiveness
http://slidepdf.com/reader/full/10-overall-equipment-effectiveness 8/25
Lean Six Sigma Operational - Delegate Workbook
SSG06101ENUK - OEE/Issue 1.1 / April 2008 8 ©The British Standards Institution 2008
15
SSG06101ENUK – Delegate Slides/Issue 1.1/ April 2008
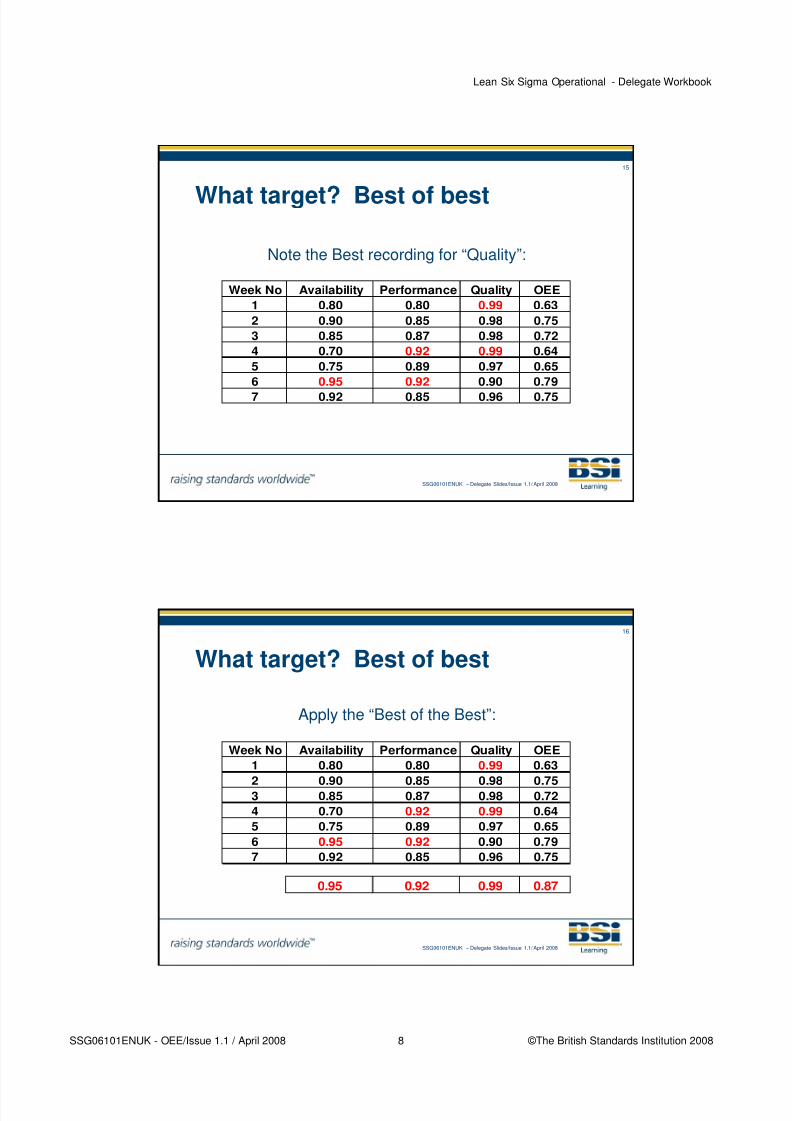
Note the Best recording for “Quality”:
Week No Availability Performance Quality OEE
1 0.80 0.80 0.99 0.63
2 0.90 0.85 0.98 0.75
3 0.85 0.87 0.98 0.72
4 0.70 0.92 0.99 0.64
5 0.75 0.89 0.97 0.65
6 0.95 0.92 0.90 0.79
7 0.92 0.85 0.96 0.75
What target? Best of best
16
SSG06101ENUK – Delegate Slides/Issue 1.1/ April 2008
Apply the “Best of the Best”:
Week No Availability Performance Quality OEE
1 0.80 0.80 0.99 0.63
2 0.90 0.85 0.98 0.753 0.85 0.87 0.98 0.72
4 0.70 0.92 0.99 0.64
5 0.75 0.89 0.97 0.65
6 0.95 0.92 0.90 0.79
7 0.92 0.85 0.96 0.75
0.95 0.92 0.99 0.87
What target? Best of best

7/29/2019 10 Overall Equipment Effectiveness
http://slidepdf.com/reader/full/10-overall-equipment-effectiveness 9/25
Lean Six Sigma Operational - Delegate Workbook
SSG06101ENUK - OEE/Issue 1.1 / April 2008 9 ©The British Standards Institution 2008
17
SSG06101ENUK – Delegate Slides/Issue 1.1/ April 2008
What target? Best of best
• The “Best of the Best” indicate what ispossible & the question asked is:
Why this OEE performance is not achieved all
the time?
The Best of Best can be a short term target but
if OEE is low we’ll need to get beyond this
Often - in the short term there is no target.OEE is a diagnostic Tool - we’ll see what weget - understand root causes and set targetsfor improvement
18
SSG06101ENUK – Delegate Slides/Issue 1.1/ April 2008
An example
• OEE at ……………….
• Consider the 3 components of OEE…….

7/29/2019 10 Overall Equipment Effectiveness
http://slidepdf.com/reader/full/10-overall-equipment-effectiveness 10/25
Lean Six Sigma Operational - Delegate Workbook
SSG06101ENUK - OEE/Issue 1.1 / April 2008 10 ©The British Standards Institution 2008
19
SSG06101ENUK – Delegate Slides/Issue 1.1/ April 2008
% Plant Availability = Planned Runtime - Downtime x 100Planned Runtime
Availability
20
SSG06101ENUK – Delegate Slides/Issue 1.1/ April 2008
Planned Run Time• Shift duration
days 07:15 - 17:00 = 9 hrs 45 mins
shifts 06:00 - 14:00; 14:00 - 22:00 = 8 hrs
add in Overtime
• Breaks
Tea Break 15 mins
Lunch Break 30 mins
• Down Time
Change Overs
Stoppages - more than 10mins
45 mins
We know that teammeetings,
walking to breaks,
washing, etc will eat intoOEE. Remember that
85% is a world class
auto factory wherelockers, canteen ,etc are
lineside.
If on shifts planned runtime is 7hrs 15mins.
435minutes

7/29/2019 10 Overall Equipment Effectiveness
http://slidepdf.com/reader/full/10-overall-equipment-effectiveness 11/25
Lean Six Sigma Operational - Delegate Workbook
SSG06101ENUK - OEE/Issue 1.1 / April 2008 11 ©The British Standards Institution 2008
21
SSG06101ENUK – Delegate Slides/Issue 1.1/ April 2008
Down Time
• The plant suffered:
• 3 minor breakdowns less than 10 minutes – these
are neglected ~(counted as performance)
• A major breakdown of 1 hour
22
SSG06101ENUK – Delegate Slides/Issue 1.1/ April 2008
Availability
%3.86100
435
60435
%100eRunningTim
DownTimeTimeRunning
====××××−−−−
====
××××−−−−
====
ty Availabili
ty Availabili

7/29/2019 10 Overall Equipment Effectiveness
http://slidepdf.com/reader/full/10-overall-equipment-effectiveness 12/25
Lean Six Sigma Operational - Delegate Workbook
SSG06101ENUK - OEE/Issue 1.1 / April 2008 12 ©The British Standards Institution 2008
23
SSG06101ENUK – Delegate Slides/Issue 1.1/ April 2008
Machine Run Rate
• Determine the “Machine Run Rate”………..
• Time the number of items produced by the machine in a minute…………...
• The plant has been timed at producing 8 off items per minute,therefore…………
Machine Run Rate = 1 minute / 8
Machine Run Rate = 0.125 minutes
• Remember: Full Speed – no allowances
24
SSG06101ENUK – Delegate Slides/Issue 1.1/ April 2008
Performance
• Suppose in the day we produced 1200 items
• % Performance = Machine Run rate x Processed Amount x 100
Operating Time
ie .125 mins / Unit x 1200 Units x 100
435-60 mins
% Performance = 56.25%

7/29/2019 10 Overall Equipment Effectiveness
http://slidepdf.com/reader/full/10-overall-equipment-effectiveness 13/25
Lean Six Sigma Operational - Delegate Workbook
SSG06101ENUK - OEE/Issue 1.1 / April 2008 13 ©The British Standards Institution 2008
25
SSG06101ENUK – Delegate Slides/Issue 1.1/ April 2008
Amount.Processed
100xAmountDefective-AmountProcessed====
ProductsTime
FirstRightof%
Quality - Right First Time
• Suppose 40 items (of the 800) failed inspection
and were scrapped:
%95800
100x40-800========
ProductsTimeFirstRightof%
26
SSG06101ENUK – Delegate Slides/Issue 1.1/ April 2008
Overall OEE
• Why did the breakdown occur?
• Why did it take an hour to fix?
Did the fitter turn up quickly? Did he have the part needed forrepair to hand?
• Did the crew take a break when the machine was down(rather than at the “appointed time” when it was back upagain)?
• What can be done to reduce a 5% scrap rate?
%12.46955625863.
%100
====××××××××====
××××××××××××====
. .OEE
Qualitye Performanc ty AvailabiliOEE

7/29/2019 10 Overall Equipment Effectiveness
http://slidepdf.com/reader/full/10-overall-equipment-effectiveness 14/25
Lean Six Sigma Operational - Delegate Workbook
SSG06101ENUK - OEE/Issue 1.1 / April 2008 14 ©The British Standards Institution 2008
27
SSG06101ENUK – Delegate Slides/Issue 1.1/ April 2008
Golden Rules
• OEE is about Machines NOT people
• OEE cannot exceed 100%
• 85% is World Class - Car Factory
• USE OEE to identify & correct Manufacturing
• “Weaknesses”
• Ask What if…
28
SSG06101ENUK – Delegate Slides/Issue 1.1/ April 2008
A Data Collection FormPLEASE PRINT ALL ENTRIESCLEARLY - THANK YOU. DAILY or SHIFT DATA CAPTURE FORM AND OEE CALCULATION
Date / Shift Store/Product Machine: Operation: Cell:
* Breaks (45 mins), PM, CI, D=B-A-C Minutes/Piece
A: Shift Start Time B: Shift EndTime C: Agree Down Time* D: Running Time (Mins) E:Machine Rate:
Type of
Event No. Spare Loss Comments/details of Breakdown Losses (including parts used)
(code) for codes E11, E12 & E 13.
G: Good RoundsPacked in Shift:D - F J divided by D x100 Ex (G+H) divided by J x 100 G divided by (G+H)
H: Rounds Scrapped J: Operating Time: Availability : Performance: Right First Time
Availability x Performance x Right First Time (As Decimals)
OEE :
LOSS CODES
A. 'Material & Tool Losses B. Labour Losses C. 'PlannedLosses E. 'Machine LossesSupplier Quality Headcount CI Activities Planned not to run Breakdown losses Idling & Minor StoppagesA 11P art s unus ab le B 11 N o Labour Av a il ab leC11 Cont inuous Improv emen t C41 5C / 5S A ct iv it ies E11S udden mechan ic al f a il ure * E41 B reak dow n of p rev ious mach ineA 12 Tooling unusable C12 Meeting C42 Pr oces s / Tool Change Over E12 S udden electric al failure * E42 Breakdow n of subs equent mac hine
C43 Clean down machine E13 PLCor software systemfai lure * E43 Component jamming / remove &resetDelivery D. ' MethodLosses Planned Maintenance ActivitieC44 Change process lubricant E14 Misc (please specify)A21 Waiting for material Duplication C21 Scheduled PPMactivities Start up Losses
A22 Wait ing for tool ing D11 Operation repeated De velopme nt Se t-up adjustment loss es E61 Machine not stable on start-upC51 Training E21 Setting / Adjustments
DurationStart Time
Downtime
End Time
F: Total Duration of Lost Time (mins)
7/29/2019 10 Overall Equipment Effectiveness
http://slidepdf.com/reader/full/10-overall-equipment-effectiveness 15/25
Lean Six Sigma Operational - Delegate Workbook
SSG06101ENUK - OEE/Issue 1.1 / April 2008 15 ©The British Standards Institution 2008
29
SSG06101ENUK – Delegate Slides/Issue 1.1/ April 2008
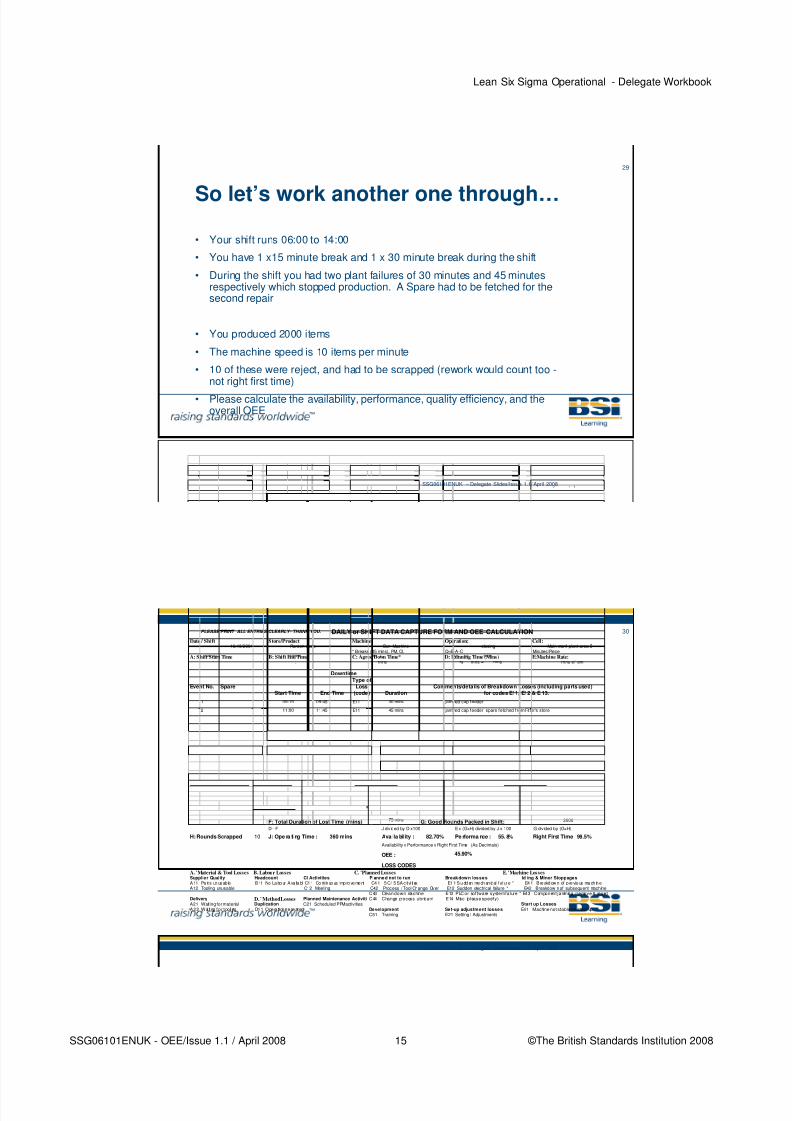
So let’s work another one through…
• Your shift runs 06:00 to 14:00
• You have 1 x15 minute break and 1 x 30 minute break during the shift
• During the shift you had two plant failures of 30 minutes and 45 minutesrespectively which stopped production. A Spare had to be fetched for thesecond repair
• You produced 2000 items
• The machine speed is 10 items per minute
• 10 of these were reject, and had to be scrapped (rework would count too -not right first time)
• Please calculate the availability, performance, quality efficiency, and theoverall OEE
30
SSG06101ENUK – Delegate Slides/Issue 1.1/ April 2008
PLEASE PRINT ALL ENTRIES CLEARLY - THANK YOU. DAILY or SHIFT DATA CAPTURE FORM AND OEE CALCULATION
Date / Shift Store/Product Machine: Operation: Cell:19/10/2004 Rarden case Our Machine closing Main manf plant area 5
* Breaks (45 mins), PM, CI, D=B-A-C Minutes/Piece
A: Shift Start Time B: Shift End Time C: Agree Down Time* D: Running Time (Mins) E:Machine Rate:: : mns rs mns = mns . mnu e/ em
Type ofEvent No. Spare Loss Comments/details of Breakdown Losses (including parts used)
(code) for codes E11, E12 & E 13.
1 09:45 E11 jammed cap feeder
2 11:45 E11 jammed cap feeder spare fetched fromFitter's store
G: Good Rounds Packed in Shift: 2000
D - F J divided by D x100 Ex (G+H) divided by J x 100 G divided by (G+H)
H: Rounds Scrapped 10 J: Ope ra ti ng Time : 360 mins Ava ila bility : 82.70% Pe rforma nce : 55. 8% Right First Time 99.5%
Availability x Performance x Right First Time (As Decimals)
OEE : 45.90%
LOSS CODES
A. 'Material & Tool Losses B. Labour Losses C. 'PlannedLosses E. 'Machine LossesSupplier Quality Headcount CI Activities Planned not to run Breakdown losses Idling & Minor StoppagesA 11 Part s unus ab le B 11 No Labour A va ilabl C11 Cont inuous Imp rovement C41 5C / 5S A c ti vi ti es E11S udden mechan ic al f ail ur e * E41 B reakdow n of p revious mach ineA12 Tooling unusable C12 Meeting C42 Process / Tool Change Over E12 Sudden electrical failure * E42 Breakdow n of subsequent machine
C43 Clean down machine E13 PLC or software systemfailure * E43 Component jamming / remove & resetDelivery D. ' MethodLosses Planned Maintenance Activiti C44 Change process lubricant E14 Misc (please specify)A21 Waiting for material Duplication C21 Scheduled PPMactivities Start up LossesA22 Wai ting for tooling D11 Operation repeated Development Set-up adjustment losses E61 Machine not stable on start-up
C51 Training E21 Setting / Adjustments
Downtime
End Time
F: Total Duration of Lost Time (mins)
09:15
11:00
Start Time Duration
30 mins
45 mins
75 mins

7/29/2019 10 Overall Equipment Effectiveness
http://slidepdf.com/reader/full/10-overall-equipment-effectiveness 16/25
Lean Six Sigma Operational - Delegate Workbook
SSG06101ENUK - OEE/Issue 1.1 / April 2008 16 ©The British Standards Institution 2008
31
SSG06101ENUK – Delegate Slides/Issue 1.1/ April 2008
PLEASE PRINT ALL ENTRIES CLEARLY - THANK YOU. DAILY or SHIFT DATA CAPTURE FORM AND OEE CALCULATION
Date / Shift Store/Product Machine: Operation: Cell: / / ar en case apper appng rp
rea s ( mns , , I, = - - nu es/ ece
A: Shift Start Time B: Shift End Time C: Agree Down Time* D: Running Time (Mins) E:Machine Rate:: : mns rs mns = mns . mnu e/case
Type of
Event No. Spare Loss Comments/details of Breakdown Losses (including parts used)
(code) for codes E11, E12 & E 13.
1 09:45 E11 jammed feeder
2 11:45 E11 jammed feeder spare fetched fromFitter's store
G: Good RoundsPa cked in Shift: 2000
D - F J divided by D x100 Ex (G+H) divided by J x 100 G divided by (G+H)
H: RoundsS crapped 10 J: Ope ra ti ng Ti me : 360 mi ns Ava il abi li ty : 82. 70% Pe rforma nce : 55. 8% Ri ght Fi rst Ti me 99. 5%
Availability x Performance x Right First Time (As Decimals)
OEE : 45.90%
LOSS CODES
A. 'Material & Tool Losses B. Labour Losses C. 'PlannedLosses E. 'Machine LossesSupplier Quality Headcount CI Activities Planned not to run Breakdown losses Idling & Minor StoppagesA 11 Part s unus ab le B 11 No Labour A va ilabl C11 Cont inuous Improvement C41 5C / 5S A c ti vi ti es E11S udden mechan ic al f ail ur e * E41 B reakdow n of p revious mach ineA12 Tooling unusable C12 Meeting C42 Process / Tool Change Over E12 Sudden electrical failure * E42 Breakdow n of subsequent machine
C43 Clean down machine E13 PLC or software systemfailure * E43 Component jamming / remove & resetDelivery D. ' MethodLosses Planned Maintenance Activiti C44 Change process lubricant E14 Misc (please specify)A21 Waiting for material Duplication C21 Scheduled PPMactivities Start up Losses
A22 Wai ting for tooling D11 Operation repeated Development Set-up adjustment losses E61 Machine not stable on start-upC51 Training E21 Setting / Adjustments
Downtime
End Time
F: Total Duration of Lost Time (mins)
09:15
11:00
Start Time Duration
30 mins
45 mins
75 mins
435 - 75 =360mins
32
SSG06101ENUK – Delegate Slides/Issue 1.1/ April 2008
PLEASE PRINT ALL ENTRIES CLEARLY - THANK YOU. DAILY or SHIFT DATA CAPTURE FORM AND OEE CALCULATION
Date / Shift Store/Product Machine: Operation: Cell:19/10/04 Rarden case ADL Capper Capping Grp 4
* Breaks (45 mins), PM, CI, D=B-A-C Minutes/PieceA: Shift Start Time B: Shift EndTime C: Agree Down Time* D: Running Time (Mins) E:Machine Rate:
06:00 14:00 45mins 7hrs 15 mins = 435 mins 0.1 minute/case
Type of
Event No. Spare Loss Comments/details of Breakdown Losses (including parts used)
(code) for codes E11, E12 & E 13.
1 09:45 E11 jammed cap feeder
2 11:45 E11 jammed cap feeder spare fetched from Fitter's store
G: Good Rounds Packed in Shift: 2000
D - F J divided by D x100 E x (G+H) divided by J x 100 G divided by (G+H)
H: Rounds Scrapped 10 J: Ope ra ting Time : 360 mins Ava ila bility : 82.70% Pe rforma nce : 55.8% Right First Ti me 99.5%
Availability x Perfor mance x Right First Time (As Decimals)
OEE : 45.90%
LOSS CODES
A. 'Material & Tool Losses B. Labour Losses C. 'Planned Losses E. 'Machine LossesSupplier Quality Headcount CI Activities Planned not to run Breakdown losses Idling & Minor StoppagesA 11 Part s unus ab le B 11 No Labou r A va il ab l C11 Cont inuous I mprovement C41 5C / 5S A ct iv it ies E11S udden mechan ic al f ail ur e * E41 Br eakdow n o f p revi ous mach ineA12 Tooling unusable C12 Meeting C42 Process / Tool Change Over E12 Sudden electrical f ailure * E42 Breakdow n of subsequent machine
C43 Clean down machine E13 PLC or software systemfailure * E43 Component jamming / remove & resetDelivery D. ' MethodLosses Planned Maintenance Activiti C44 Change process lubricant E14 Misc (please specify)A21 Waiting for material Duplication C21 Scheduled PPMactivities Start up LossesA22 Wai ting for tooling D11 Operation repeated Development Set-up adjustment losses E61 Machine not stable on start-up
C51 Training E21 Setting / Adjustments
Downtime
End Time
F: Total Duration of Lost Time (mins)
09:15
11:00
Start Time Duration
30 mins
45 mins
75 mins
360/435x100= 82.7%

7/29/2019 10 Overall Equipment Effectiveness
http://slidepdf.com/reader/full/10-overall-equipment-effectiveness 17/25
Lean Six Sigma Operational - Delegate Workbook
SSG06101ENUK - OEE/Issue 1.1 / April 2008 17 ©The British Standards Institution 2008
33
SSG06101ENUK – Delegate Slides/Issue 1.1/ April 2008
PLEASE PRINT ALL ENTRIES CLEARLY - THANK YOU. DAILY or SHIFT DATA CAPTURE FORM AND OEE CALCULATION
Date / Shift Store/Product Machine: Operation: Cell:19/10/04 Rarden case ADL Capper Capping Grp 4
* Breaks (45 mins), PM, CI, D=B-A-C Minutes/Piece
A: Shift Start Time B: Shift End Time C: Agree Down Time* D: Running Time (Mins) E:Machine Rate:06:00 14:00 45mins 7hrs 15 mins = 435 mins 0.1 minute/case
Type of
Event No. Spare Loss Comments/details of Breakdown Losses (including parts used)
(code) for codes E11, E12 & E 13.
1 09:45 E11 jammed cap feeder
2 11:45 E11 jammed cap feeder spare fetched fromFitter's store
G: Good Rounds Packed in Shift: 2000
D - F J divided by D x100 E x (G+H) divided by J x 100 G divided by (G+H)
H: Rounds Scrapped 10 J: Ope ra ting Time : 360 mi ns Ava ila bility : 82. 70% Pe rforma nce : 55.8% Right First Time 99.5%
Availab ility x Perfo rmance x Right First Time (As Decimals)
OEE :45.90%
LOSS CODES
A. 'Material & Tool Losses B. Labour Losses C. 'PlannedLosses E. 'Machine LossesSupplier Quality Headcount CI Activities Planned not to run Breakdown losses Idling & Minor StoppagesA 11 Part s unus ab le B 11 No Labou r Av ai labl C11 Cont inuous I mprovement C41 5C / 5S Ac ti vit ies E11S udden mechan ic al f ai lu re * E41 B reak dow n of p revious mach ineA12 Tooling unusable C12 Meeting C42 Process / Tool Change Over E12 Sudden electrical f ailure * E42 Breakdow n of subsequent machine
C43 Clean down machine E13 PLCor software system fai lure * E43 Component jamming / remove & resetDelivery D. ' MethodLosses Planned Maintenance ActivitieC44 Change process lubricant E14 Misc (please specify)A21 Waiting for material Duplication C21 Scheduled PPMactivities Start up LossesA22 Wai ting for tool ing D11 Operation repeated Development Set-up adjustment losses E61 Machine not stable on start-up
C51 Training E21 Setting / Adjustments
Downtime
End Time
F: Total Duration of Lost Time (mins)
09:15
11:00
Start Time Duration
30 mins
45 mins
75 mins
0.1x(2000+10)/360
x100 = 55.8%
34
SSG06101ENUK – Delegate Slides/Issue 1.1/ April 2008
PLEASE PRINT ALL ENTRIES CLEARLY - THANK YOU. DAILY or SHIFT DATA CAPTURE FORM AND OEE CALCULATION
Date / Shift Store/Product Machine: Operation: Cell: / / ar en case apper appng rp
rea s ( mns , , I, = - - nu es/ eceA: Shift Start Time B: Shift End Time C: Agree Down Time* D: Running Time (Mins) E:Machine Rate:
: : mns rs mns = mns . mnu e/case
Type of
Event No. Spare Loss Comments/details of Breakdown Losses (including parts used)
(code) for codes E11, E12 & E 13.
1 09:45 E11 jammed cap feeder
2 11:45 E11 jammed cap feeder spare fetched fromFitter's store
G: Good Rounds Packed in Shift: 2000
D - F J divided by D x100 E x (G+H) divided by J x 100 G divided by (G+H)
H: Rounds Scrapped 10 J: Ope ra ting Time : 360 mi ns Ava ila bility : 82. 70% Pe rforma nce : 55.8% Right First Time 99.5%
Availab ility x Perfo rmance x Right First Time (As Decimals)
OEE : 45.90%
LOSS CODES
A. 'Material & Tool Losses B. Labour Losses C. 'PlannedLosses E. 'Machine LossesSupplier Quality Headcount CI Activities Planned not to run Breakdown losses Idling & Minor Stoppages
A 11 Part s unus ab le B 11 No Labou r Av ai labl C11 Cont inuous I mprovement C41 5C / 5S Ac ti vit ies E11S udden mechan ic al f ai lu re * E41 B reak dow n of p revious mach ineA12 Tooling unusable C12 Meeting C42 Process / Tool Change Over E12 Sudden electrical f ailure * E42 Breakdow n of subsequent machine
C43 Clean down machine E13 PLCor software system fai lure * E43 Component jamming / remove & resetDelivery D. ' MethodLosses Planned Maintenance ActivitieC44 Change process lubricant E14 Misc (please specify)A21 Waiting for material Duplication C21 Scheduled PPMactivities Start up LossesA22 Wai ting for tool ing D11 Operation repeated Development Set-up adjustment losses E61 Machine not stable on start-up
C51 Training E21 Setting / Adjustments
Downtime
End Time
F: Total Duration of Lost Time (mins)
09:15
11:00
Start Time Duration
30 mins
45 mins
75 mins
2000/(2000+10)x100

7/29/2019 10 Overall Equipment Effectiveness
http://slidepdf.com/reader/full/10-overall-equipment-effectiveness 18/25
Lean Six Sigma Operational - Delegate Workbook
SSG06101ENUK - OEE/Issue 1.1 / April 2008 18 ©The British Standards Institution 2008
35
SSG06101ENUK – Delegate Slides/Issue 1.1/ April 2008
PLEASE PRINT ALL ENTRIES CLEARLY - THANK YOU. DAILY or SHIFT DATA CAPTURE FORM AND OEE CALCULATION
Date / Shift Store/Product Machine: Operation: Cell:19/10/04 Rarden case ADL Capper Capping Grp 4
* Breaks (45 mins), PM, CI, D=B-A-C Minutes/Piece
A: Shift Start Time B: Shift End Time C: Agree Down Time* D: Running Time (Mins) E:Machine Rate:06:00 14:00 45mins 7hrs 15 mins = 435 mins 0.1 minute/case
Type of
Event No. Spare Loss Comments/details of Breakdown Losses (including parts used)
(code) for codes E11, E12 & E 13.
1 09:45 E11 jammed cap feeder
2 11:45 E11 jammed cap feeder spare fetched fromFitter's store
G: Good Rounds Packed in Shift: 2000
D - F J divided by D x100 E x (G+H) divided by J x 100 G divided by (G+H)
H: Rounds Scrapped 10 J: Ope ra ting Time : 360 mi ns Ava ila bility : 82. 70% Pe rforma nce : 55.8% Right First Time 99.5%
Availab ility x Perfo rmance x Right First Time (As Decimals)
OEE : 45.90%
LOSS CODES
A. 'Material & Tool Losses B. Labour Losses C. 'PlannedLosses E. 'Machine LossesSupplier Quality Headcount CI Activities Planned not to run Breakdown losses Idling & Minor Stoppages
A 11 Part s unus ab le B 11 No Labou r Av ai labl C11 Cont inuous I mprovement C41 5C / 5S Ac ti vit ies E11S udden mechan ic al f ai lu re * E41 B reak dow n of p revious mach ineA12 Tooling unusable C12 Meeting C42 Process / Tool Change Over E12 Sudden electrical f ailure * E42 Breakdow n of subsequent machine
C43 Clean down machine E13 PLCor software system fai lure * E43 Component jamming / remove & resetDelivery D. ' MethodLosses Planned Maintenance ActivitieC44 Change process lubricant E14 Misc (please specify)A21 Waiting for material Duplication C21 Scheduled PPMactivities Start up LossesA22 Wai ting for tool ing D11 Operation repeated Development Set-up adjustment losses E61 Machine not stable on start-up
C51 Training E21 Setting / Adjustments
Downtime
End Time
F: Total Duration of Lost Time (mins)
09:15
11:00
Start Time Duration
30 mins
45 mins
75 mins
0.827x0.558x0.995x100=45.9%
36
SSG06101ENUK – Delegate Slides/Issue 1.1/ April 2008
A picture is worth a thousandwords
Our Plant OEE
0
20
40
60
80
100
0 10 20 30
Day
O E E
OEE
Availability
Performance
Quality
Plot The Result
on the board
supplied

7/29/2019 10 Overall Equipment Effectiveness
http://slidepdf.com/reader/full/10-overall-equipment-effectiveness 19/25
Lean Six Sigma Operational - Delegate Workbook
SSG06101ENUK - OEE/Issue 1.1 / April 2008 19 ©The British Standards Institution 2008
37
SSG06101ENUK – Delegate Slides/Issue 1.1/ April 2008
Store/Product: Machine: Month:
Day Availability % Performance % Right First Time % OEE %
1
2
3
4
5
6
7
8
9
10
11
Overall Equipment Effeciveness (OEE) Log Sheet
Maintain a log sheet to showdetail Whole day break
downs:Availability: 0
OEE= 0%(Provided we would have used plant
if it had been up.)
0 0
38
SSG06101ENUK – Delegate Slides/Issue 1.1/ April 2008
Store/Product: Machine: Month:
Day Availability % Performance % Right First Time % OEE %
1
2
3
4
5
6
7
8
9
10
11
Overall Equipment Effeciveness (OEE) Log Sheet
Maintain a log sheet to showdetail
To Office at Month End Please to includeAverage in KPI’s
-When we didn’t use it and we didn’twant to. I.e. Weekends with no O/T
planned
- -

7/29/2019 10 Overall Equipment Effectiveness
http://slidepdf.com/reader/full/10-overall-equipment-effectiveness 20/25
Lean Six Sigma Operational - Delegate Workbook
SSG06101ENUK - OEE/Issue 1.1 / April 2008 20 ©The British Standards Institution 2008
39
SSG06101ENUK – Delegate Slides/Issue 1.1/ April 2008
Golden Rule
• Cells will be encouraged to ask “What if”………….
• What if we did not have to wait for an Fitter?
• What if we did not have to wait for a spare part?
• What if we had a breakdown mid morning break and took
our break then rather than waiting for the right time?
• What if the plant is running and we took a break by splitting
the shift?
• What if we developed a Capital Case to replace the plant?
40
SSG06101ENUK – Delegate Slides/Issue 1.1/ April 2008
Let’s try to answer some of thesequestions• Let’s remove the some of the Unplanned
Downtime (waiting for Fitter 15 mins & waiting for
spare to be fetched 15 mins, total = 30 mins)
• Downtime is reduced to from 75 to 45 mins………
• And if we assume an extra 120 items could be
produced increasing our output from 2000 to
2120……………..

7/29/2019 10 Overall Equipment Effectiveness
http://slidepdf.com/reader/full/10-overall-equipment-effectiveness 21/25
Lean Six Sigma Operational - Delegate Workbook
SSG06101ENUK - OEE/Issue 1.1 / April 2008 21 ©The British Standards Institution 2008
41
SSG06101ENUK – Delegate Slides/Issue 1.1/ April 2008
PLEASE PRINT ALL ENTRIES CLEARLY - THANK YOU. DAILY or SHIFT DATA CAPTURE FORM AND OEE CALCULATION
Date / Shift Store/Product Machine: Operation: Cell: / / arden case our pan appng rp
* Breaks (45 mins), PM, CI, D=B-A-C Minutes/PieceA: Shift Start Time B: Shift End Time C: Agree Down Time* D: Running Time (Mins) E:Machine Rate:
06:00 14:00 45mins 7hrs 15 mins = 435 mins 0.1 minute/case
Type of
Event No. Spare Loss Comments/details of Breakdown Losses (including parts used)
(code) for codes E11, E12 & E 13.
1 09:30 E11 jammed feeder
2 11:30 E11 jammed feeder spare fetched from Fitter's store
G: Good RoundsP acked in Shift: 2120
D - F J divided by D x100 Ex (G+H) divided by J x 100 G divided by (G+H)
H: RoundsS crapped 10 J: Ope ra ti ng Ti me : 390 m ins Ava il abi li ty : 89 .70% Pe rfor ma nce : 54. 6% Ri ght Fi rst Ti me 99. 5%
Availab ility x Performance x Right First Time ( As Decimals)
OEE : 48.70%
LOSS CODES
A. 'Material & Tool Losses B. Labour Losses C. 'Planned Losses E. 'Machine Lossesupp er ua y ea coun c v es anne no o run rea own osses ng nor oppages
A11 Par ts unusable B11 No Labour Avai lableC11 Continuous Improvement C41 5C/ 5S Ac tivi ties E11 Sudden mechanical f a ilure * E41 Breakdown of prev ious machineoo ng unusa e ee ng rocess / oo ange ver udden e ec r ca fa ure * rea dow n of su sequen mac ne
C43 Clean down machine E13 PLC or software systemfailure * E43 Component jamming / remove & resete ve ry D. ' MethodLosses an ne a n e na nc e c v e ange pr oc es s u r c an sc ( pease s pec fy
a ng for maera Duplication c e du e d a c v e s Start up Lossesa n g for oo ng pera on repea ed eve opmen e -up a u s men osses a c n e n o s a e on s a r - up
ranng e ng / dusmens
Duration
15 mins
30 mins
45 mins
Start Time
Downtime
End Time
F: Total Duration of Lost Time (mins)
09:15
11:00
390/435x100= 89.7%
42
SSG06101ENUK – Delegate Slides/Issue 1.1/ April 2008
PLEASE PRINT ALL ENTRIES CLEARLY - THANK YOU. DAILY or SHIFT DATA CAPTURE FORM AND OEE C ALCULATION
Date / Shift Store/Product Machine: Operation: Cell:an / / arden case our p an appng p an
* Breaks (45 mins), PM, CI, D=B-A-C Minutes/PieceA: Shift Start Time B: Shift End Time C: Agree Down Time* D: Running Time (Mins) E:Machine Rate:
06:00 14:00 45mins 7hrs 15 mins = 435 mins 0.1 minute/item
Type of
Event No. Spare Loss Comments/details of Breakdown Losses (including parts used)
(code) for codes E11, E12 & E 13.
1 09:30 E11 jammed feeder
2 11:30 E11 jammed feeder spare fetched fromFitter's store
G: Good RoundsPacked in Shift: 2120
D - F J divided by D x100 Ex (G+H) divided by J x 100 G divided by (G+H)
H: RoundsScrapped 10 J: Op era ti ng Ti me : 39 0 m ins Ava il abi li ty : 89. 70 % P erfor ma nce : 54. 6% Ri gh t Fi rst T ime 99. 5%
Availability x Performance x Right First Time (As Decimals)
OEE : 48.70%
LOSS CODES
A. 'Material & Tool Losses B. Labour Losses C. 'Planned Losses E. 'Machine Lossesupp er ua y ea coun c v es anne no o run rea own osses ng nor oppages
A11 Par ts unusable B11 No Labour Avai lableC11 Continuous Improvement C41 5C/ 5S Ac tivi ties E11 Sudden mechanica l f a ilure * E41 Breakdown of prev ious machineA12 Tooling unusable C12 Meeting C42 Process / Tool Change Over E12 S udden electrical failure * E42 Breakdow n of subsequent mac hine
ean dow n mac ne or s of w a re s ys e mf a ure * omponen a mm ng / r emove r es eDelivery D. ' MethodLosse s Planned Maintenance ActivitieC44 Change process lubricant E14 Misc (please specify)
a ng for maera u p c a o n c e du e d a c v e s ar up osses
A22 W ai ting f or t oo ling D11 O perat ion repeat ed Development Set-up adjustment losses E61 Machine not stable on start-upranng e ng / dusmens
Duration
15 mins
30 mins
45 mins
Start Time
Downtime
End Time
F: Total Duration of Lost Time (mins)
09:15
11:00
0.827x0.558x0.995x100
=48.7%
7/29/2019 10 Overall Equipment Effectiveness
http://slidepdf.com/reader/full/10-overall-equipment-effectiveness 22/25
Lean Six Sigma Operational - Delegate Workbook
SSG06101ENUK - OEE/Issue 1.1 / April 2008 22 ©The British Standards Institution 2008
43
SSG06101ENUK – Delegate Slides/Issue 1.1/ April 2008
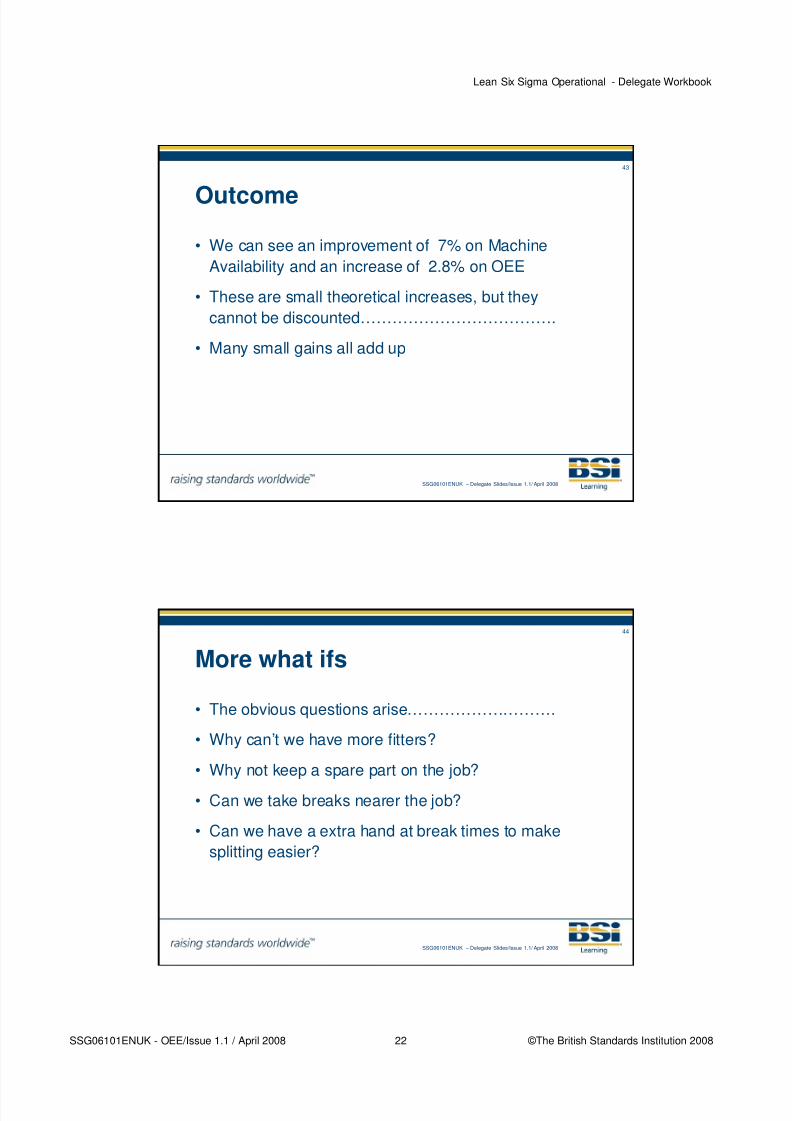
Outcome
• We can see an improvement of 7% on Machine
Availability and an increase of 2.8% on OEE
• These are small theoretical increases, but they
cannot be discounted……………………………….
• Many small gains all add up
44
SSG06101ENUK – Delegate Slides/Issue 1.1/ April 2008
More what ifs
• The obvious questions arise……………………….
• Why can’t we have more fitters?
• Why not keep a spare part on the job?
• Can we take breaks nearer the job?
• Can we have a extra hand at break times to make
splitting easier?

7/29/2019 10 Overall Equipment Effectiveness
http://slidepdf.com/reader/full/10-overall-equipment-effectiveness 23/25
Lean Six Sigma Operational - Delegate Workbook
SSG06101ENUK - OEE/Issue 1.1 / April 2008 23 ©The British Standards Institution 2008
45
SSG06101ENUK – Delegate Slides/Issue 1.1/ April 2008
What about a new Machine?
46
SSG06101ENUK – Delegate Slides/Issue 1.1/ April 2008
PLEASE PRINT ALL ENTRIES CLEARLY - THANK YOU. DAILY or SHIFT DATA CAPTURE FORM AND OEE CALCULATION
Date / Shift Store/Product Machine: Operation: Cell:19/10/04 Rarden case ADL Capper Capping Grp 4
* Breaks (45 mins), PM, CI, D=B-A-C Minutes/Piece
A: Shift Start Time B: Shift EndTime C: Agree Down Time* D: Running Time (Mins) E:Machine Rate:06:00 14:00 45mins 7hrs 15 mins = 435 mins 0.1 minute/case
Type of
Event No. Spare Loss Comments/details of Breakdown Losses (including parts used)
(code) for codes E11, E12 & E 13.
G: Good Rounds Packed in Shift: 2750
D - F J div ided by D x100 Ex (G+H) div ided by J x 100 G div ided by (G+H)
H: Rounds Scrapped 10 J: Operating Time: 435 Availability : 100.00% Pe rformance: 63.9% Right First Time 99.5%
Availability x Performance x Right First Time (As Decimals)
OEE : 63.50%
LOSS CODES
A. 'Material & Tool Losses B. Labour Losses C. 'PlannedLosses E. 'Machine LossesSupplier Quality Headcount CI Activities Planned not to run Breakdown losses Idling & Minor StoppagesA 11 Pa rt s un us ab le B 11 No L ab ou r Av ai la bl C 11 Co nt in uo us I mp ro ve me nt C4 1 5 C / 5S A ct iv it ie s E1 1 S u dd en me ch an ic al f ai lu re * E4 1 B re ak do w n of p r ev io us m ac hi neA12 Tooling unusable C12 Meeting C42 Proc ess / Tool Change Ov er E12 Sudden elec tric al failure * E42 Breakdow n of subs equent machine
ean dow n mac ne or s o w a re s ys e m a u re omponen amm ng / r emov e r es eDelivery D. ' MethodLosses Planned Maintenance Activiti C44 Change process lubricant E14 Misc (please specify)
A21 Waiting for material Duplication C21 Scheduled PPMact ivities Start up LossesA22 Wai ti ng for too li ng D11 Opera ti on repea ted Development Set-up adjustment losses E61 Machine not stable on start-up
C51 Training E21 Setting / Adjustments
Duration
0 mins
Start Time
Downtime
End Time
F: Total Duration of Lost Time (mins)
435/435x100= 100%

7/29/2019 10 Overall Equipment Effectiveness
http://slidepdf.com/reader/full/10-overall-equipment-effectiveness 24/25
Lean Six Sigma Operational - Delegate Workbook
SSG06101ENUK - OEE/Issue 1.1 / April 2008 24 ©The British Standards Institution 2008
47
SSG06101ENUK – Delegate Slides/Issue 1.1/ April 2008
PLEASE PRINT ALL ENTRIES CLEARLY - THANK YOU. DAILY or SHIFT DATA CAPTURE FORM AND OEE CALCULATION
ate t tore ro uct ac ne: perat on: e :19/10/04 Rarden case ADL Capper Capping Grp 4
* Breaks (45 mins), PM, CI, D=B-A-C Minutes/Piece
A: Shift Start Time B: Shift EndTime C: Agree Down Time* D: Running Time (Mins) E:Machine Rate:06:00 14:00 45mins 7hrs 15 mins = 435 mins 0.1 minute/case
Type of
Event No. Spare Loss Comments/details of Breakdown Losses (including parts used)
(code) for codes E11, E12 & E 13.
G: Good Rounds Packed in Shift: 2750
D - F J div ided by D x100 Ex (G+H) div ided by J x 100 G div ided by (G+H)
H: Rounds Scrapped 10 J: Operating Time: 435 Availability : 100.00% Pe rformance: 63.9% Right First Time 99.5%
Availability x Performance x Right First Time (As Decimals)
OEE :63.50%
LOSS CODES
A. 'Material & Tool Losses B. Labour Losses C. 'PlannedLosses E. 'Machine LossesSupplier Quality Headcount CI Activities Planned not to run Breakdown losses Idling & Minor Stoppages
A 11 Pa rt s un us ab le B 11 No L ab ou r Av ai la bl C 11 Co nt in uo us I mp ro ve me nt C4 1 5 C / 5S A ct iv it ie s E1 1 S u dd en me ch an ic al f ai lu re * E4 1 B re ak do w n of p r ev io us m ac hi neA12 Tooling unusable C12 Meeting C42 Proc ess / Tool Change Ov er E12 Sudden elec tric al failure * E42 Breakdow n of subs equent machine
ean dow n mac ne or s o w a re s ys e m a u re omponen amm ng / r emov e r es eDelivery D. ' MethodLosses Planned Maintenance Activiti C44 Change process lubricant E14 Misc (please specify)
A21 Waiting for material Duplication C21 Scheduled PPMact ivities Start up LossesA22 Wai ti ng for too li ng D11 Opera ti on repea ted Development Set-up adjustment losses E61 Machine not stable on start-up
C51 Training E21 Setting / Adjustments
Duration
0 mins
Start Time
Downtime
End Time
F: Total Duration of Lost Time (mins)
Record shift
48
SSG06101ENUK – Delegate Slides/Issue 1.1/ April 2008
PLEASE PRINT ALL ENTRIES CLEARLY - THANK YOU. DAILY or SHIFT DATA CAPTURE FORM AND OEE CALCULATION
Date / Shift Store/Product Machine: Operation: Cell:19/10/04 Rarden case ADL Capper Capping Grp 4
rea s ( mns , , I, = - - nu es/ ece
A: Shift Start Time B: Shift EndTime C: Agree Down Time* D: Running Time (Mins) E:Machine Rate:06:00 14:00 45mins 7hrs 15 mins = 435 mins 0.1 minute/case
Type of
Event No. Spare Loss Comments/details of Breakdown Losses (including parts used)
(code) for codes E11, E12 & E 13.
G: Good Rounds Packed in Shift: 2750
D - F J div ided by D x100 Ex (G+H) div ided by J x 100 G div ided by (G+H)
H: Rounds Scrapped 10 J: Operating Time: 435 Availability : 100.00% Pe rformance: 63.9% Right First Time 99.5%
Availability x Performance x Right First Time (As Decimals)
OEE : 63.50%
LOSS CODES
A. 'Material & Tool Losses B. Labour Losses C. 'PlannedLosses E. 'Machine LossesSupplier Quality Headcount CI Activities Planned not to run Breakdown losses Idling & Minor StoppagesA 11 Pa rt s un us ab le B 11 No L ab ou r Av ai la bl C 11 Co nt in uo us I mp ro ve me nt C4 1 5 C / 5S A ct iv it ie s E1 1 S u dd en me ch an ic al f ai lu re * E4 1 B re ak do w n of p r ev io us m ac hi neA12 Tooling unusable C12 Meeting C42 Proc ess / Tool Change Ov er E12 Sudden elec tric al failure * E42 Breakdow n of subs equent machine
C43 Clean down machine E13 PLC or software systemfai lure * E43 Component jamming / remove & resete v ery D. ' MethodLosses anne an enance c v C44 Change process lubricant E14 Misc (please specify)
A21 Waiting for material up ca o n C21 Scheduled PPMact ivities ar up osses
a ng or oong pera on repea ed eve opmen e -up a u s men osses a c n e n o s a e on s a r - upC51 Training E21 Setting / Adjustments
Duration
0 mins
Start Time
Downtime
End Time
F: Total Duration of Lost Time (mins)
0.1x(2750+10)/435x100
= 63.9%

7/29/2019 10 Overall Equipment Effectiveness
http://slidepdf.com/reader/full/10-overall-equipment-effectiveness 25/25
Lean Six Sigma Operational - Delegate Workbook
49
SSG06101ENUK – Delegate Slides/Issue 1.1/ April 2008
What about a new machine?
• We can see an improvement of 17% on Machine
Availability and an increase of 18% on OEE
• We would break manufacturing records:
Allow delivery to customer to promise
make better use of Labour
watching a broken machine has to be unfulfilling as well as a
waste
• There would be a payback for the capital investment
• First we need some data show how bad things are
50
SSG06101ENUK – Delegate Slides/Issue 1.1/ April 2008
OEE is:
• A tool for Cells to record and then identify wheretheir Manufacturing weaknesses are, and torectify these by CI Meetings, seeking assistancefrom Engineering, QA and Finance or other
departments where necessary.