Embed Size (px)
Citation preview
1010Chapt
er
Chapt
er The Valuation and
Characteristics of SharesThe Valuation and
Characteristics of Shares
Slides Developed by:
Terry FegartySeneca College

© 2006 by Nelson, a division of Thomson Canada Limited 2
Chapter 10: Outline (1)
• Common Shares The Return on an Investment in Common Shares The Basis of Share Value Comparison of Cash Flows from Shares and Bonds
The Intrinsic (Calculated) value and Share Price
• Growth Models of Common Share Valuation Developing Growth-Based Models Working with Growth Rates Dividend Valuation Models Constant Normal Growth—The Gordon Model
© 2006 by Nelson, a division of Thomson Canada Limited 3
Chapter 10: Outline (2)
The Expected Return Two-Stage Growth Practical Limitations of Pricing Models
• Some Institutional Characteristics of Common Shares
• Preferred Shares Valuation of Preferred Shares Characteristics of Preferred Shares
• Securities Analysis

© 2006 by Nelson, a division of Thomson Canada Limited 4
Common Shares
• Common shares—evidence of ownership Common shareholders own firm Common shareholders elect Board of Directors
• Common shares—form of long-term equity financing for firm
• Common shares often called a residual security Value represents whatever assets are left after all
prior claims against assets have been settled.

© 2006 by Nelson, a division of Thomson Canada Limited 5
Common Shares
• Background Common shareholders own corporation, but
share ownership often spread among large number of people• Most shareholders aren’t interested in role as
owners
Most equity investors are only interested in how much money they will receive as shareholders
© 2006 by Nelson, a division of Thomson Canada Limited 6
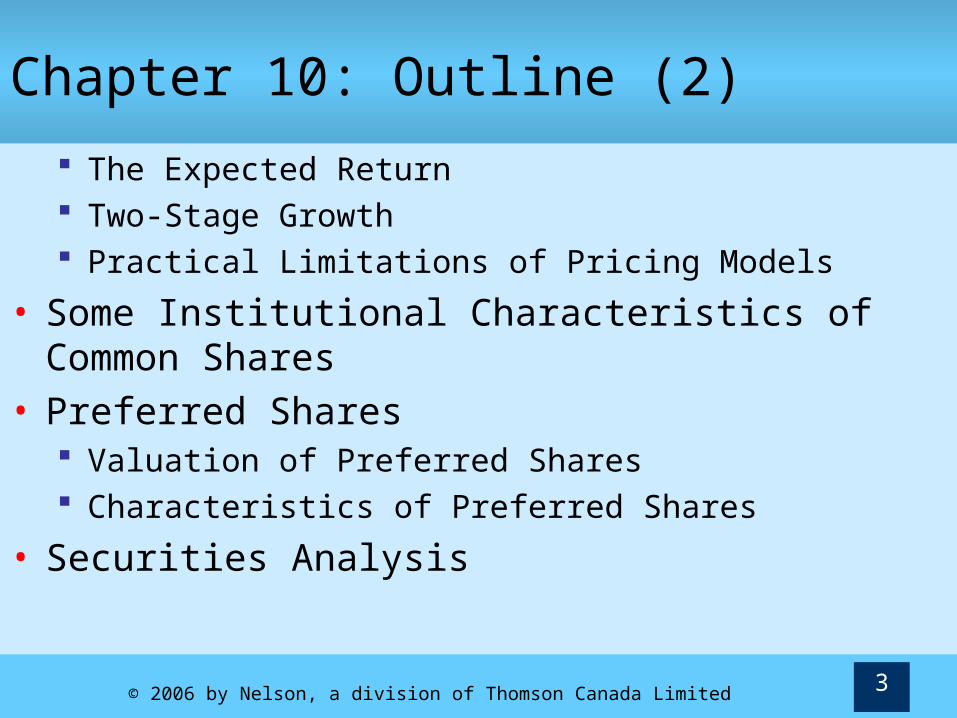
The Return on an Investment in Common Shares• Future cash flows from share ownership consist of
Dividends Eventual selling price of shares
• If you buy a share for price P0, hold it for one year during which time you receive a dividend of D1, then sell it for a price P1, your return, k, would be:
1 1 0
0
1 01
0 0
dividend yield capital gains yield
D + P -Pk =
P
or
P -PDk = +
P P
A capital gain (loss) occurs if you sell the shares for a price greater (lower) than
you paid for it.

© 2006 by Nelson, a division of Thomson Canada Limited 7
The Return on an Investment in Common Shares• Solve previous equation for P0, share’s price today:
0 1 1 0
0 0 1 1
0 1 1
1 10
kP
P kP
1 P
P1
D P P
D P
k D P
D P
k
• Return on our share investment is interest rate that equates present value of investment’s expected future cash flows to amount invested today, the price, P0
© 2006 by Nelson, a division of Thomson Canada Limited 8
The Basis of Share Value
• Cash flows attributable to a common share accrue from:
Dividend stream (while owning the shares) Sale price
The market value of a common share is equal to the present value of its
expected future cash flows!

© 2006 by Nelson, a division of Thomson Canada Limited 9
Comparison of Cash Flows from Shares and Bonds
Bonds Shares
Interest payments are guaranteed Dividends on common shares are not guaranteed
Interest payments are fixed Dividends on common shares may increase, decrease or stop at discretion of management
Maturity value is fixed Shareholder sells shares at prevailing market price
On maturity, investor receives par or face value from issuing company
Shares are sold to another investor

© 2006 by Nelson, a division of Thomson Canada Limited 10
The Basis of Share Value
• Basis for share value is present value of expected cash inflows even though dividends and share prices are difficult to forecast Must make assumptions about what future dividends
and selling price will be• Discount these assumptions at an appropriate interest rate
0 1 k,1 2 k,2 n k,n n k,nP = D PVF D PVF D PVF P PVF

© 2006 by Nelson, a division of Thomson Canada Limited 11
Figure 10.1: Cash Flow Timeline for Share Valuation
© 2006 by Nelson, a division of Thomson Canada Limited 12
Example 10.1: The Basis of Value
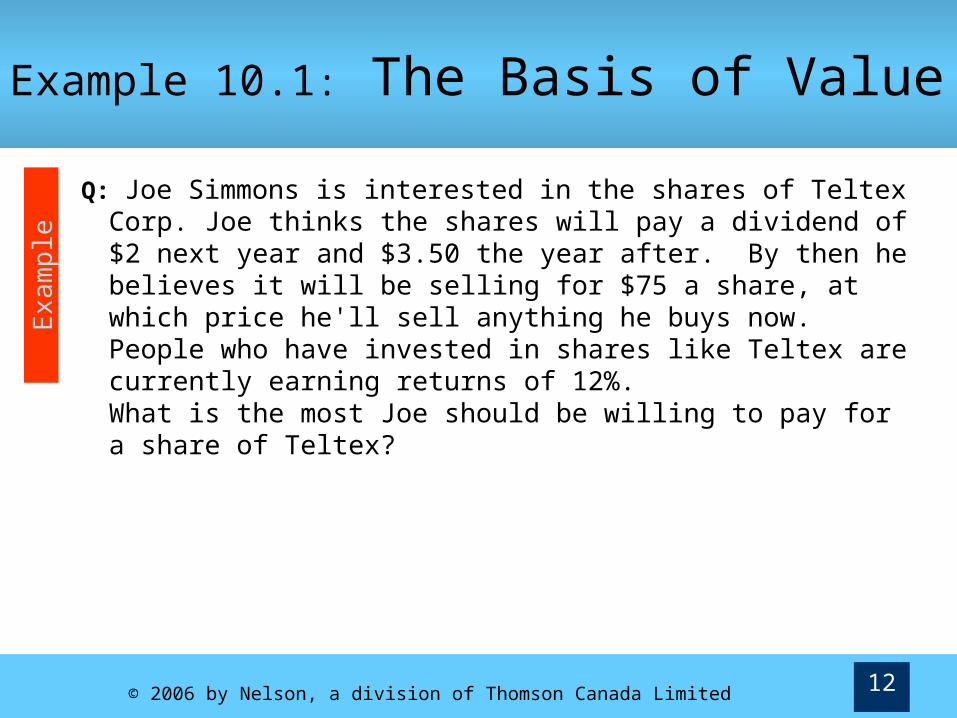
Q: Joe Simmons is interested in the shares of Teltex Corp. Joe thinks the shares will pay a dividend of $2 next year and $3.50 the year after. By then he believes it will be selling for $75 a share, at which price he'll sell anything he buys now. People who have invested in shares like Teltex are currently earning returns of 12%. What is the most Joe should be willing to pay for a share of Teltex?
Exa
mpl
e
© 2006 by Nelson, a division of Thomson Canada Limited 13
Example 10.1: The Basis of Value
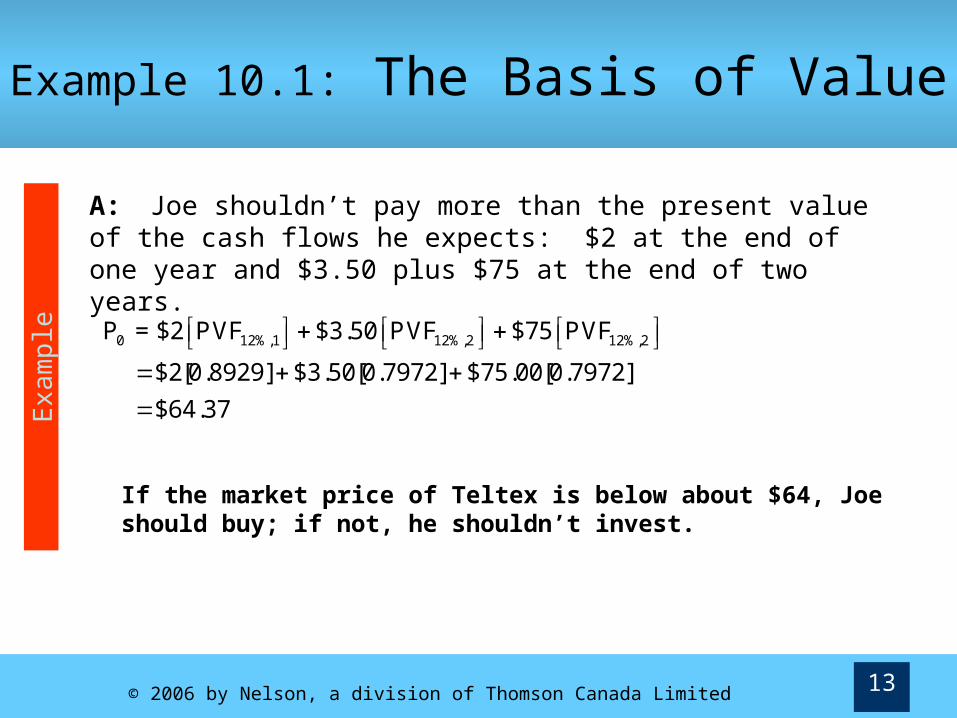
A: Joe shouldn’t pay more than the present value of the cash flows he expects: $2 at the end of one year and $3.50 plus $75 at the end of two years.
0 12%,1 12%,2 12%,2P = $2 PVF $3.50 PVF $75 PVF
$2[0.8929] $3.50[0.7972] $75.00[0.7972]
$64.37
E
xam
ple
If the market price of Teltex is below about $64, Joe should buy; if not, he shouldn’t invest.

© 2006 by Nelson, a division of Thomson Canada Limited 14
The Intrinsic (Calculated) Value and Market Price• Share’s intrinsic value is based on assumptions
made by potential investor Must estimate future expected cash flows
• Needs to perform fundamental analysis of firm and industry
• Different investors with different cash flow estimates will develop different intrinsic values
• Fundamental analysis: Developing intrinsic values and comparing them to market prices
© 2006 by Nelson, a division of Thomson Canada Limited 15
Growth Models of Common Share Valuation
• Realistically most people tend to forecast growth rates rather than cash flows Because forecasting exact future prices and
dividends is very difficult
© 2006 by Nelson, a division of Thomson Canada Limited 16
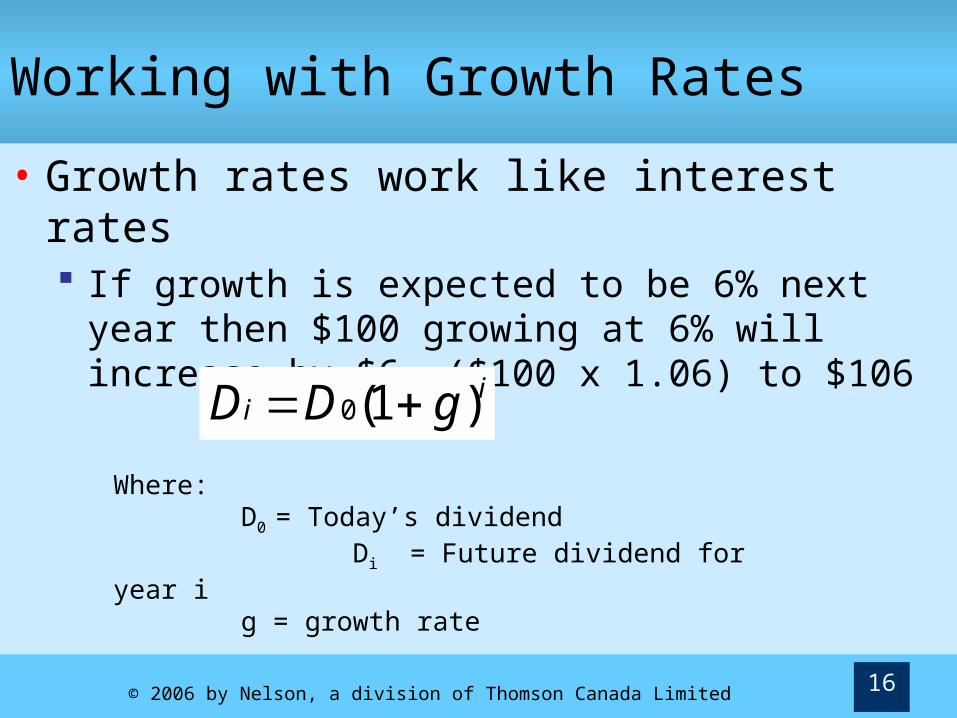
Working with Growth Rates
• Growth rates work like interest rates If growth is expected to be 6% next year then
$100 growing at 6% will increase by $6, ($100 x 1.06) to $106
0(1 )iiD D g Where:
D0 = Today’s dividend Di = Future dividend for year i
g = growth rate
© 2006 by Nelson, a division of Thomson Canada Limited 17
Example 10.2: Growth RatesE
xam
ple
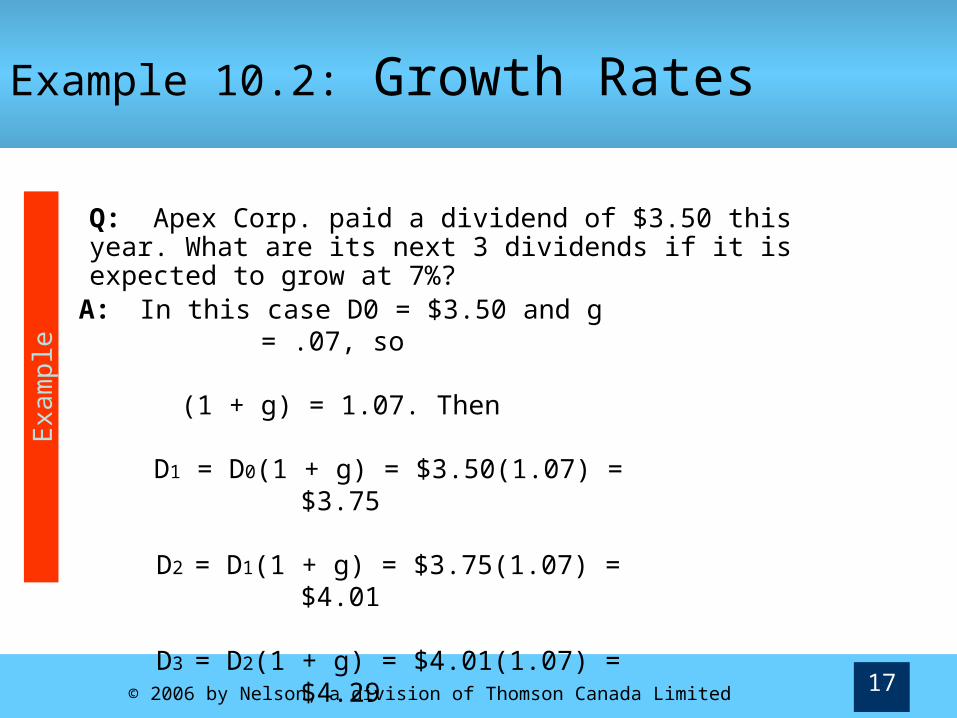
Q: Apex Corp. paid a dividend of $3.50 this year. What are its next 3 dividends if it is expected to grow at 7%?
A: In this case D0 = $3.50 and g = .07, so
(1 + g) = 1.07. Then
D1 = D0(1 + g) = $3.50(1.07) = $3.75
D2 = D1(1 + g) = $3.75(1.07) = $4.01
D3 = D2(1 + g) = $4.01(1.07) = $4.29

© 2006 by Nelson, a division of Thomson Canada Limited 18
Dividend Valuation Models
• Constant growth model • Zero growth model• Two-stage growth model

© 2006 by Nelson, a division of Thomson Canada Limited 19
Developing Growth-Based Models
• A person who buys shares at time n will hold it until period m and then sell it Their valuation will look like this:
n + 1 m m
n m - n m - n
D D PP = +…+ +
1 + k 1 + k 1 + k
Repeating this process until infinity results in:
i
0 ii=1
DP
1 + k
Conceptually it’s possible to replace the final selling price
with an infinite series of dividends
© 2006 by Nelson, a division of Thomson Canada Limited 20
Constant Normal Growth—The Gordon Model
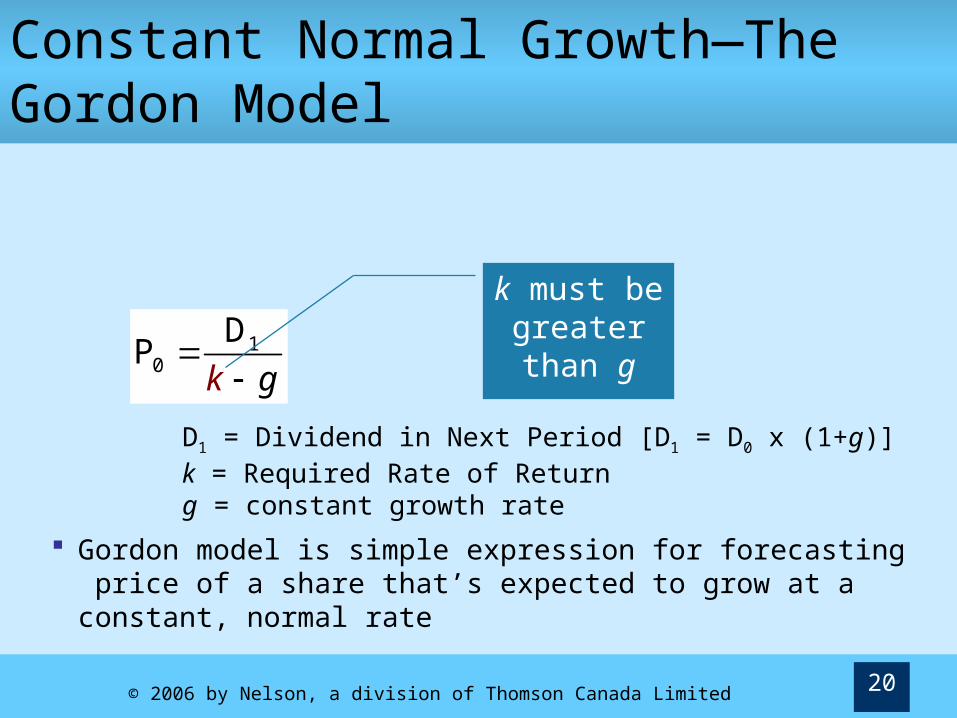
10
DP
gk
k must be greater than g
Gordon model is simple expression for forecasting price of a share that’s expected to grow at a constant, normal rate
D1 = Dividend in Next Period [D1 = D0 x (1+g)]k = Required Rate of Returng = constant growth rate

© 2006 by Nelson, a division of Thomson Canada Limited 21
Example 10.3: Constant Normal Growth—The Gordon Model
Q: Atlas Motors is expected to grow at a constant rate of 6% a year into the indefinite future. It recently paid a dividends of $2.25 a share. The rate of return on shares similar to Atlas is about 11%. What should a share of Atlas Motors sell for today?
A:
Exa
mpl
e 10
DP
k - g
$2.25 (1.06)
.11 - .06$47.70

© 2006 by Nelson, a division of Thomson Canada Limited 22
The Zero Growth Rate Case—A Constant Dividend• If share is expected to pay constant, non-
growing dividend, each dollar dividend is the same
• Gordon model simplifies to:
0
DP
k
• Zero growth share is a perpetuity to the investor
D = Dividendk = Required Rate of Return
© 2006 by Nelson, a division of Thomson Canada Limited 23
Zero Growth: Example
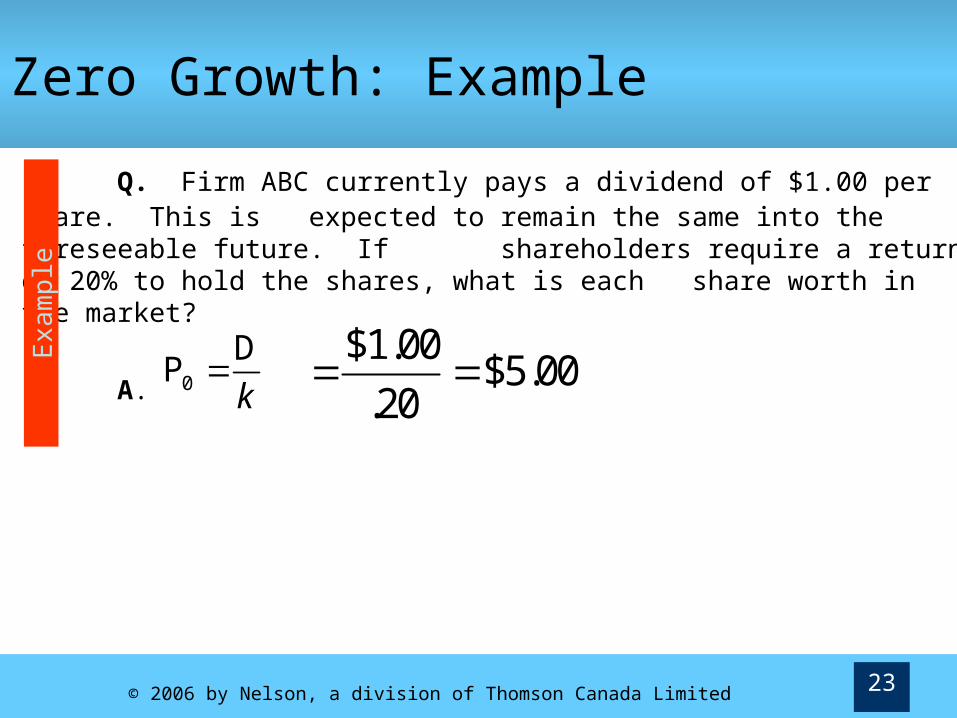
Q. Firm ABC currently pays a dividend of $1.00 per share. This is expected to remain the same into the foreseeable future. If
shareholders require a return of 20% to hold the shares, what is each share worth in the market?
A. 0
DP
k
$1.00$5.00
.20
Exa
mpl
e

© 2006 by Nelson, a division of Thomson Canada Limited 24
The Expected Return
• Can recast Gordon model to focus on return (ke) implied by the constant growth assumption
• Expected return reflects investors’ knowledge of a company If we know D0 (most recent dividend paid) and
P0 (current actual share price), investors’ expectations are input via growth rate assumption
1
0eD
k gP

© 2006 by Nelson, a division of Thomson Canada Limited 25
Two-Stage Growth
• At times, we may expect that firm’s future growth will not be constant
For example, new product may lead to temporary high growth
• Two-stage growth model allows us to value share that is expected to grow at unusual rate for limited time
1. Use the Gordon model to value constant portion2. Find the present value of non-constant growth
periods

© 2006 by Nelson, a division of Thomson Canada Limited 26
Figure 10.2: Two-Stage Growth Model

© 2006 by Nelson, a division of Thomson Canada Limited 27
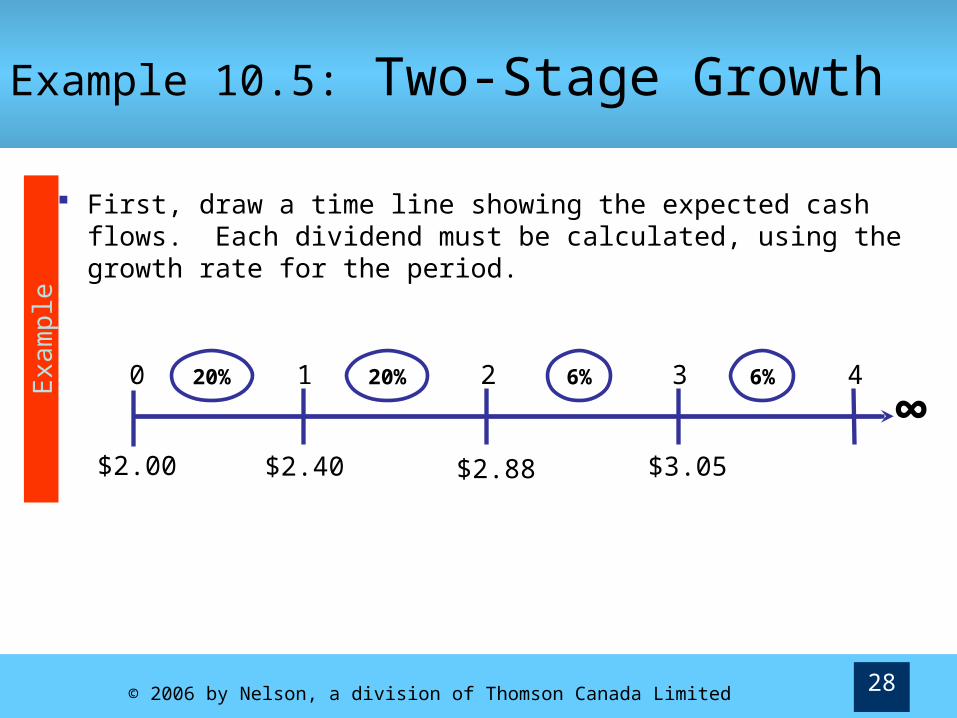
Q: Zylon Corporation’s shares are selling for $48. The firm will make an exciting new product announcement next week. We’ve concluded that this new product will support an overall company growth rate of 20% for about two years. After that, growth will level off at about 6%. The firm currently pays an annual dividend of $2.00, which can be expected to grow with the company. The rate of return on shares like Zylon is approximately 10%. Is Zylon a good buy at $48?
A: We’ll estimate what we think Zylon should be worth given our expectations about growth.
Exa
mpl
e
Example 10.5: Two-Stage Growth
© 2006 by Nelson, a division of Thomson Canada Limited 28
Example 10.5: Two-Stage Growth
First, draw a time line showing the expected cash flows. Each dividend must be calculated, using the growth rate for the period.
0 4321
∞$2.00 $2.40 $2.88 $3.05
20% 20% 6% 6%Exa
mpl
e
© 2006 by Nelson, a division of Thomson Canada Limited 29
Example 10.5: Two-Stage Growth
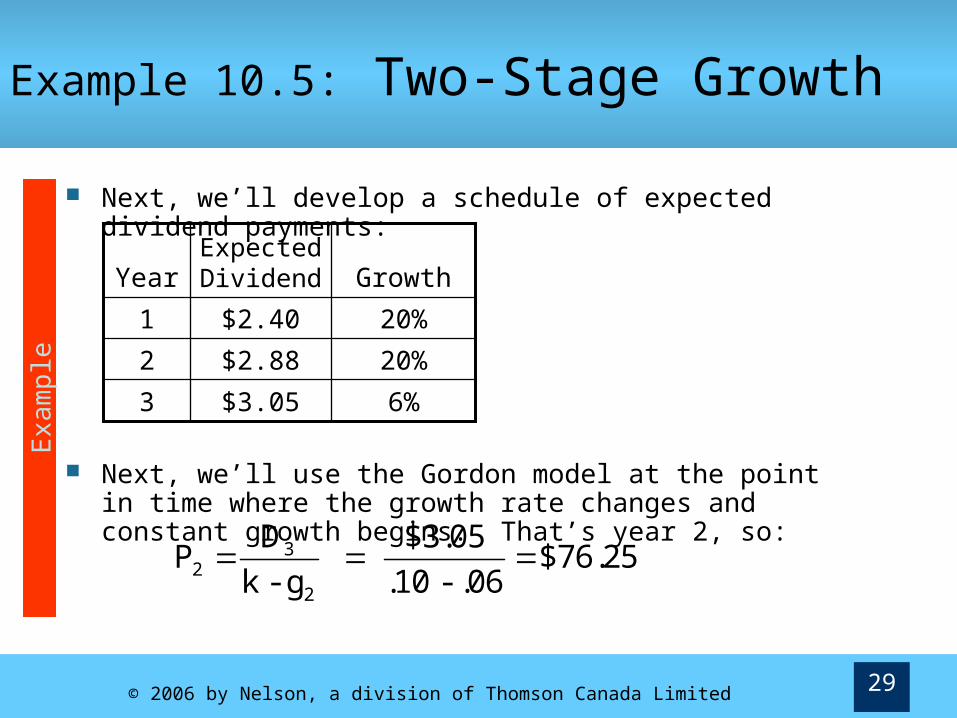
Next, we’ll develop a schedule of expected dividend payments:
Next, we’ll use the Gordon model at the point in time where the growth rate changes and constant growth begins. That’s year 2, so:
Exa
mpl
e
32
2
D $3.05P $76.25
k - g .10 - .06
6%$3.053
20%$2.882
20%$2.401
GrowthExpected DividendYear

© 2006 by Nelson, a division of Thomson Canada Limited 30
Example 10.5: Two-Stage Growth
Then we take the present value of D1, D2 and P2:
Exa
mpl
e
0 1 k, 1 2 k, 2 2 k, 2
10, 1 10, 2 10, 2
P D PVF + D PVF + P PVF
$2.40 PVF + $2.88 PVF + $76.25 PVF
$2.40 0.9091 + $2.88 0.8264 + $76.25 0.8264
$67.57
Compare $67.57 to the listed price of $48.00. If we are correct in our assumptions, Zylon should be worth about $20 more than it is selling for in the market, so we should buy
Zylon’s shares.
© 2006 by Nelson, a division of Thomson Canada Limited 31
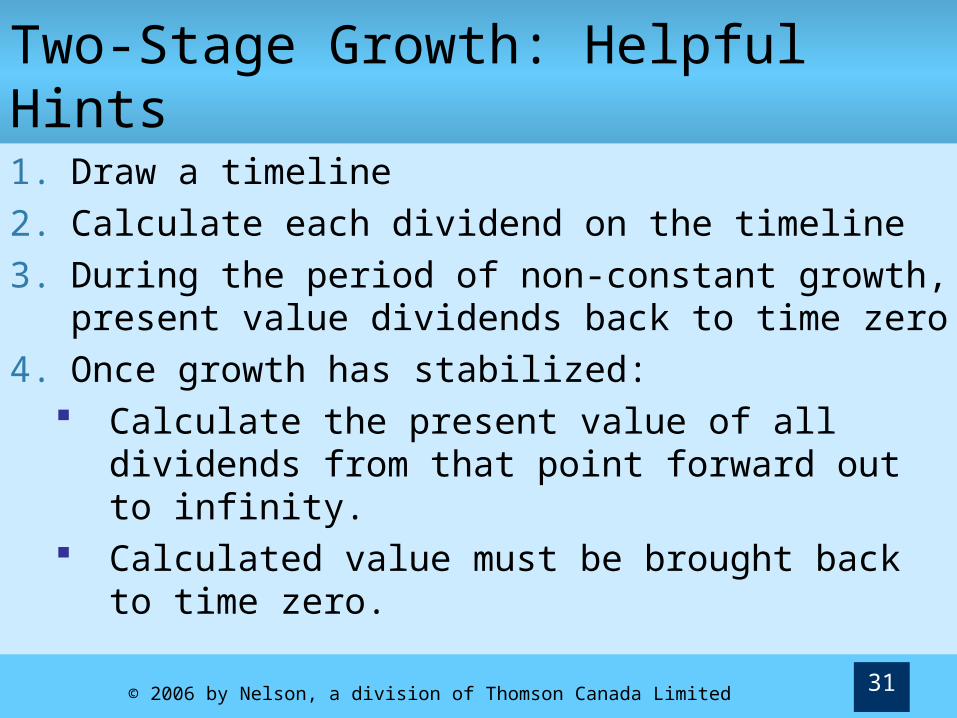
Two-Stage Growth: Helpful Hints
1. Draw a timeline2. Calculate each dividend on the timeline3. During the period of non-constant growth,
present value dividends back to time zero4. Once growth has stabilized:
Calculate the present value of all dividends from that point forward out to infinity.
Calculated value must be brought back to time zero.

© 2006 by Nelson, a division of Thomson Canada Limited 32
Practical Limitations of Pricing Models• Share valuation models give approximate results
because inputs are approximations of reality Bond valuation is precise because inputs are exact
• With bonds, future cash flows are contractually guaranteed in amount and time
• Actual growth rate and interest rate can be VERY different from predicted rates Even if rates differ only slightly, it can make big difference in
our decision So, it’s best to allow margin for error in estimations
© 2006 by Nelson, a division of Thomson Canada Limited 33
Practical Limitations of Pricing Models• Shares That Don’t Pay Dividends
Some firms don’t pay dividends even if they are profitable
Many companies claim they never intend to pay dividends
• These firms can still have a substantial share price Firms of this type typically are growing and are using
profits to finance growth• However rapid growth won’t last forever• When growth slows, the firm will begin paying dividends
• It’s these distant dividends that impart value

© 2006 by Nelson, a division of Thomson Canada Limited 34
Some Institutional Characteristics of Common Shares• Common Shareholder Rights
Right to vote at shareholder meetings Right to share in profits (either as a dividend
or as reinvested profits) Right to share in residual assets after all
other stakeholder (i.e. governments, creditors, employees) claims are satisfied
Preemptive Rights: If a firm issues new shares, existing shareholders may have right to purchase pro rata share of new issue

© 2006 by Nelson, a division of Thomson Canada Limited 35
Some Institutional Characteristics of Common Shares• Corporate Organization and Control
Controlled by Board of Directors (elected by shareholders)
Board appoints top management who then appoint middle/lower management
Board consists of: top management and outside members (major shareholders, top executives at other firms, former presidents, etc.)
In widely held corporations, top management is effectively in control of firm because no shareholder group has enough power to remove it
© 2006 by Nelson, a division of Thomson Canada Limited 36
Some Institutional Characteristics of Common Shares
• Voting Rights and Issues Shareholders may assign their voting rights
to someone else (proxy) Management actively solicits proxies Dissent shareholder group may try to solicit
proxies to wrest control away from management
Proxy fight occurs if parties with conflicting interests solicit proxies at same time

© 2006 by Nelson, a division of Thomson Canada Limited 37
Some Institutional Characteristics of Common Shares• Voting for the Board of Directors • Majority voting
Each share carries one vote Requires more than 50% of votes to elect a director Gives control of the company to the larger group
• Cumulative voting Each share carries as many votes as there are
directors to be elected Shareholders may cast all votes for one candidate Gives minority interest a chance at some
representation on the board

© 2006 by Nelson, a division of Thomson Canada Limited 38
Some Institutional Characteristics of Common Shares
• Shares With Different Voting Rights Different classes of shares can be issued with
different rights• Some shares may be issued with limited or no
voting rights
© 2006 by Nelson, a division of Thomson Canada Limited 39
Some Institutional Characteristics of Common Shares• Shareholders’ Claim on Income And Assets
Common shareholders have a residual claim on the firm’s net income and assets
• Common shareholders are last in line to receive income or assets, after creditors and preferred shareholders
• Bear more risk than other investors
• However, residual interest is large when firm does well
• Residual income is paid out as dividends or retained (retained earnings) for investment in new projects
• Leads to future growth

© 2006 by Nelson, a division of Thomson Canada Limited 40
Preferred Shares
• Form of equity financing • Intermediate position between common
shares and long-term debt No maturity date (like common shares) Fixed dividend payment (similar to bond
interest payment)

© 2006 by Nelson, a division of Thomson Canada Limited 41
Valuation of Preferred Shares
• Value of preferred share is present value of all its future expected dividends.
• No growth rate in preferred share dividends, so growth rate equals 0
• Preferred shares are valued as a perpetuity
D = Dividend k = Required Rate of Return
pp
p
DP
k

© 2006 by Nelson, a division of Thomson Canada Limited 42
Example 10.6: Preferred Shares
Q: Roman Industries’ $6 preferred originally sold for $50. Interest rates on similar issues are now 9%. What should Roman’s preferred sell for today?
A: Just substitute the new market interest rate into the preferred share valuation model to determine today’s price:
0
$6 $66.67P
.09
Exa
mpl
e

© 2006 by Nelson, a division of Thomson Canada Limited 43
Characteristics of Preferred Shares
• Cumulative Feature Common dividends can’t be paid unless
dividends on cumulative preferred are current

© 2006 by Nelson, a division of Thomson Canada Limited 44
Characteristics of Preferred Shares
Preferred Common Bonds
Payments to Investors
Dividends are constant
Dividends are discretionary
Interest is constant
Maturity and Return of Principal
Issuing firm does not return principal. Holder must sell in market
Issuing firm does not return principal. Holder must sell in market
Issuing firm returns principal on maturity date
Assurance of Payment
Dividends can be passed but are cumulative
Dividends can be passed indefinitely
Interest must be paid or bondholders can put into bankruptcy

© 2006 by Nelson, a division of Thomson Canada Limited 45
Characteristics of Preferred Shares
Preferred Common BondsPriority in Bankruptcy
Shareholders have claim on company assets after bondholders
Shareholders have last claim on company assets
Bondholders have first claim on company assets
Voting Rights None Right to vote None
Tax Deductibility of Payments
Dividends not deductible
Dividends not deductible
Interest payments are deductible
Risk to Investor Middle Highest Lowest

© 2006 by Nelson, a division of Thomson Canada Limited 46
Securities Analysis
• Securities analysis—the art and science of selecting investments
• Fundamental analysis looks at company and its business to forecast value
• Technical analysis bases value on pattern of past share prices and volumes
• Efficient Market Hypothesis says information moves so rapidly in financial markets that price changes occur immediately, so it is impossible to consistently beat the market to bargains