Embed Size (px)
Citation preview
Romanian Journal of Economic Forecasting – XIX (2) 2016 152
COMMON STOCHASTIC TRENDS IN
EUROPEAN MORTALITY LEVELS: TESTING AND CONSEQUENCES FOR MODELING LONGEVITY RISK IN
INSURANCE
Dorina LAZAR1 Anuta BUIGA2
Adela DEACONU3
Abstract
This paper highlights the long-term trends of general mortality levels in the European countries, investigates the existence of some common stochastic trends determining the mortality of the elderly population, and proposes to forecast the mortality rates taking into account these common stochastic trends. As a first step, a method for regionalization is used in order to provide homogeneous contiguous clusters. The tests for cointegration detect the number of common stochastic trends determining the mortality indices, derived from the Lee-Carter model, for countries from a homogeneous cluster; forecasts are generated by the vector error correction model. Based on out-of-sample forecasts, this approach leads to estimates of life expectancy near those provided by the Lee Carter model. In addition, using the VEC approach, the common stochastic trends, developed by the long-term mortality experience for countries from a cluster are preserved in the long run.
Keywords: longevity risk, forecasts, spatial clusters, cointegration, Lee-Carter model JEL Classification: C21, C53, G22, J11
1 Corresponding author. Faculty of Economics and Business Administration, Babes-Bolyai
University of Cluj-Napoca. E-mail: [email protected]. 2 Faculty of Economics and Business Administration, Babes-Bolyai University of Cluj-Napoca. E-
mail: [email protected]. 3 Faculty of Economics and Business Administration, Babes-Bolyai University of Cluj-Napoca. E-
mail: [email protected].
10.
Common Stochastic Trends in European Mortality Levels
Romanian Journal of Economic Forecasting – XIX (2) 2016 153
I. Introduction
I.1. Motivation and context The European countries have experienced a downward trend in mortality during the second half of the 20th century. The long-term mortality forecasts are an important input for the private or public retirement systems, annuity providers, health and elderly care systems, and more generally for all the components of a social security system. Life insurance business or pension schemes require accurate long-term mortality projections, in order to avoid systematic losses and to adopt appropriate risk management actions. The national mortality levels are driven by a set of common determinants. Understanding, extracting and modeling the common trends driving the mortality patterns for a group of countries can improve the national long-term mortality forecasts. As Li and Lee (2005) point out, the convergence in mortality levels for closely related populations can lead to improper mortality forecasts, if the forecasts for individual populations are obtained in isolation from one another. The historical similarities in long-run mortality patterns are likely to continue in the future, if the main determinants of mortality, such as the socio-economic, environmental or behavioral factors, will have similar trends. Meanwhile, short-term country-specific deviations should be expected. Pension plans and annuity providers are exposed to a significant long-term longevity risk, which is likely to cause large aggregate losses. Since this risk is non-diversifiable, the solutions for managing it imply a risk transfer. The topic of transferring longevity risk from pension providers to the financial markets has been a matter of increased attention over the recent years.4 Academic research and the pension industry have proposed some capital market solutions, such as longevity bonds, mortality swaps, mortality futures or mortality options. Pricing of hedging products and the valuation of pension provider’s exposure out into the future require accurate estimates of the future mortality rates. The innovations from the Life Markets started in the early 2000’s and have become increasingly important in recent years. The Life Markets trade longevity-linked assets and liabilities (Blake et al., 2011). Accurate forecasts for mortality should contribute to the development of a credible market for the standardized products used to hedge longevity risk in the capital markets. On the other hand, in the context of pricing the mortality-linked securities the concept of basis risk arises, which is related to a mismatch between the exposed population and the hedging population. In a recent paper, Li and Hardy (2011) debate the topic of measuring basis risk in longevity hedges. If there is a long-run dependence between the mortality experiences of the associated populations, then the population basis risk will be acceptably low. Therefore, it is important to investigate whether the mortality experiences of the associated populations are driven by a common stochastic trend (are cointegrated), and to develop a joint stochastic model that forecasts mortality simultaneously.
4 The Life and Longevity Markets Association (LLMA) promotes a new trading market in longevity
and mortality-related risk, developing standardized longevity products and longevity trading indices. LLMA took also ownership of J.P. Morgan’s LifeMetrics Index.
Institute for Economic Forecasting
Romanian Journal of Economic Forecasting – XIX (2) 2016 154
From another point of view, testing for common stochastic trends driving the national mortality levels may add useful information in the framework of longevity risk diversification across countries. If the mortality levels for a group of countries share common long-term movements, implying a tendency to move together in the long-term, the mortality level of any one country from the group will be representative for this group. The benefits from international diversification of longevity risk are diminished, since the mortality levels of the countries share common stochastic trends. Therefore, the investigation of cointegration property for national mortality levels has important implications for long-term horizon investors on the Life Markets. The presence of common trends implies the absence of some long-run diversification opportunities.
I.2 Stochastic mortality models for related populations It is common to use extrapolative time series methods to forecast mortality. Using such a procedure, the separate forecasts for related populations lead to increasing divergence in life expectancy in the long run (Li and Lee, 2005). To avoid the long-run diverging projections, and consequently to improve the national mortality forecasts, it is useful to forecast mortality for a country by incorporating the information on the mortality experiences of the other countries with similar experience. The methodology proposed by Li and Lee (2005), which can be used to obtain coherent mortality forecasts for a group of populations, is developed within the well-known Lee-Carter model. For each population from the group, the change over time in mortality is described by a common factor model, estimated by applying the Lee-Carter method to the aggregate age-specific mortality rates for the whole group. The country-specific deviations from this trend are also allowed. A number of recent papers apply this methodology or develop other appropriate methods to obtain coherent mortality forecasts for a group of related populations. Hyndman, Booth, and Yasmeen (2013) develop a product-ratio functional method, based on functional principal components models. The ratios among forecast subpopulation rates may evolve over time, allowing more flexibility. Börger and Köhler (2011) propose a methodology allowing coherent projections for several populations simultaneously. The mortality improvements are specified as a linear combination of age, period, and cohort effects. Jarner and Kryger (2011) develop a methodology for robust forecasting of small population mortality, based on the mortality experience observed in a larger population sharing the same long-term trend as the small population of interest. Forecasting life expectancy in an international context, Oeppen and Vaupel (2002) forecast the life expectancy by considering the gap between the country specific life expectancy and the best-practice level. This paper aims to highlight the long-term trends of general mortality levels in the European countries, and to investigate the common stochastic trends driving the mortality levels. The procedure involves two steps. The first step focuses on spatial clustering of European countries into homogeneous contiguous clusters, according to a set of indicator variables for the similarities in historic and projected mortality levels of the countries. The concept of related populations, often used in the previous studies, is considered in terms of geographical proximity of the populations. The countries with similar socio-economic and environmental conditions, similar progress in health
Common Stochastic Trends in European Mortality Levels
Romanian Journal of Economic Forecasting – XIX (2) 2016 155
improvement, medical treatments, nutrition improvement or healthy lifestyle, are expected to exhibit long-trend common trends in the mortality level. In the second part, we propose to apply a multivariate time series technique to test for common stochastic trends in the mortality dynamics of the countries from a spatial cluster. The common trend topic is approached in a multivariate time series framework. For each country, the mortality index from the well-known model of Lee and Carter (1992) is proposed as a benchmark for the long-term general pattern of mortality dynamics over time. The Johansen cointegration tests detect the number of common stochastic trends driving the general mortality levels of the countries from a homogeneous cluster, and forecasts for the mortality indices are generated from the vector error correction model. These projections are incorporated into the Lee-Carter equation, in order to forecast the age-specific death rates, and also the life expectancy. In the short term, the estimates for life expectancy generated by the projection of mortality index from the random walk model, and from the VEC model, respectively, are similar. Compared to the classic Lee Carter model, using the VEC approach, the common stochastic trends are preserved in the long-run, developed by the long-term mortality experience, from the general levels of mortality. The results revealed by this approach can be useful in the framework of mortality forecasting in an international context, and also for international diversification of the longevity risk.
II. Methodology
II.1. Spatial clusters of the European countries When investigating the common stochastic trends driving the mortality levels for the European countries we encounter the problem of heterogeneity. The cluster analysis isusually applied to classify countries into homogeneous groups. For example, Dinu et al. (2012) apply cluster analysis to the European countries in order to analyze the degree of synchronization between the business cycles. We suggest that the convergence of mortality levels is more likely to occur for the countries located in the same geographic area. A number of studies have revealed the neighborhood effects on economic growth (which is closely related to the evolution of its mortality level), such as Easterly and Levine (1997), among others. The geography favors the international trade with neighboring countries, the infrastructure development and the labor migration. In the same line, the empirical results of Keller (2002) suggest that the international diffusion of technologies, including medical ones, is geographically localized. Like economic and financial contagion across neighboring countries, the environmental and safety regulations, the infectious diseases or epidemics cross the country borders, requiring coordinated regional health programs to be managed. Labor migration also influences the educational and cultural achievements, the human behavior and the lifestyle. Assuncao et al. (2006) propose an efficient regionalization procedure, based on a minimum spanning tree, which is useful to divide a set of spatial objects into contiguous clusters that have maximum internal homogeneity. The experiments conducted by the authors show that the proposed algorithm, denoted by SKATER (Spatial Kluster Analysis by Tree Edge Removal), produces high quality results, being a good alternative
Institute for Economic Forecasting
Romanian Journal of Economic Forecasting – XIX (2) 2016 156
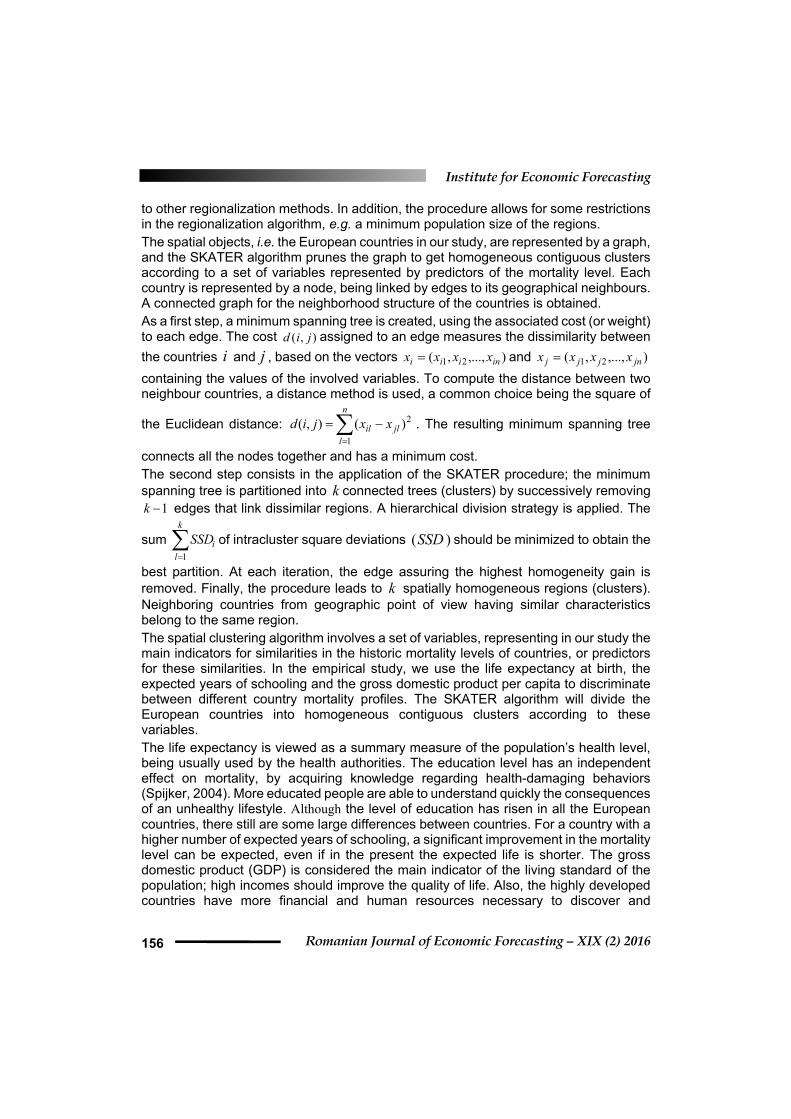
to other regionalization methods. In addition, the procedure allows for some restrictions in the regionalization algorithm, e.g. a minimum population size of the regions. The spatial objects, i.e. the European countries in our study, are represented by a graph, and the SKATER algorithm prunes the graph to get homogeneous contiguous clusters according to a set of variables represented by predictors of the mortality level. Each country is represented by a node, being linked by edges to its geographical neighbours. A connected graph for the neighborhood structure of the countries is obtained. As a first step, a minimum spanning tree is created, using the associated cost (or weight) to each edge. The cost ),( jid assigned to an edge measures the dissimilarity between
the countries i and j , based on the vectors ),...,,( 21 iniii xxxx and ),...,,( 21 jnjjj xxxx
containing the values of the involved variables. To compute the distance between two neighbour countries, a distance method is used, a common choice being the square of
the Euclidean distance:
n
ljlil xxjid
1
2)(),( . The resulting minimum spanning tree
connects all the nodes together and has a minimum cost. The second step consists in the application of the SKATER procedure; the minimum spanning tree is partitioned into k connected trees (clusters) by successively removing
1k edges that link dissimilar regions. A hierarchical division strategy is applied. The
sum
k
liSSD
1
of intracluster square deviations )(SSD should be minimized to obtain the
best partition. At each iteration, the edge assuring the highest homogeneity gain is removed. Finally, the procedure leads to k spatially homogeneous regions (clusters). Neighboring countries from geographic point of view having similar characteristics belong to the same region. The spatial clustering algorithm involves a set of variables, representing in our study the main indicators for similarities in the historic mortality levels of countries, or predictors for these similarities. In the empirical study, we use the life expectancy at birth, the expected years of schooling and the gross domestic product per capita to discriminate between different country mortality profiles. The SKATER algorithm will divide the European countries into homogeneous contiguous clusters according to these variables. The life expectancy is viewed as a summary measure of the population’s health level, being usually used by the health authorities. The education level has an independent effect on mortality, by acquiring knowledge regarding health-damaging behaviors (Spijker, 2004). More educated people are able to understand quickly the consequences of an unhealthy lifestyle. Although the level of education has risen in all the European countries, there still are some large differences between countries. For a country with a higher number of expected years of schooling, a significant improvement in the mortality level can be expected, even if in the present the expected life is shorter. The gross domestic product (GDP) is considered the main indicator of the living standard of the population; high incomes should improve the quality of life. Also, the highly developed countries have more financial and human resources necessary to discover and
Common Stochastic Trends in European Mortality Levels
Romanian Journal of Economic Forecasting – XIX (2) 2016 157
implement new technologies and health-enhancing knowledge, new drugs and medical treatments. We have settled on the above three socio-economic variables, according to their relevance and variation across space, but the research on finding the best set of predictor variables of historic and future mortality level should continue.
II.2 The Lee-Carter mortality index The model proposed by Lee and Carter (1992) has become one of the standard benchmark models for long-term mortality forecasting. The original method or closely related approaches and extensions have been widely applied to the mortality rates of various countries (Booth et al., 2006; Shang, Booth, and Hyndman, 2011).
Let xtm denote the log of central death rate at age x in year t. The Lee-Carter model
decomposes the log death rate xtm as:
xttxxxt km
where: x and x reflect age-specific effects, tk is a time-varying component reflecting
the general level of mortality, and xt is a set of age and time specific random effects
not captured by the model. The mortality index tk reflects the general pattern of
mortality dynamics, being often modeled as a random walk with drift. Otherwise, the
latent variable tk is the common stochastic trend driving the vector of log-death rates
),...,,( 21 ntttt mmmm , as Lazar and Denuit (2009) point out.
The mortality index tk will be used as a benchmark for the general pattern of mortality
dynamics over time, being a summary of the mortality dynamics for all ages.
II.3. Testing for common stochastic trends in a spatial cluster of countries
The Lee-Carter mortality index reflects the general improvement in mortality level over time, for one country. For a group of n countries with similar long term mortality patterns, the time series of Lee-Carter mortality indices ),...,,( 21 ntttt kkkK exhibit a tendency to
move together on long term, and thus may be expected to share some common stochastic trends.
The mortality indices from the vector time series tK are non-stationary time series,
showing a decreasing tendency as a result of the long-term mortality changes. In most of the empirical studies applying the Lee-Carter model, the dynamics of mortality index is adequately described by a random walk with drift. If the Lee-Carter mortality indices are cointegrated, there are certain linear combinations of them which are stationary; these combinations hold together the mortality indices ),...,,( 21 nttt kkk , representing those
relations towards which the system is adjusting. A vector of the n time series that are cointegrated, with the cointegrating rank r, can be decomposed into a linear combination of rn number of common trends (random walks with drift) plus a transitory stationary vector; the common trends are the forces driving the cointegrated system.
Institute for Economic Forecasting
Romanian Journal of Economic Forecasting – XIX (2) 2016 158
Determination of the number of common trends in the n -dimensional vector tK of
mortality indices is an important step in the empirical analysis. The Johansen maximum likelihood methodology is a powerful technique useful to determine the number of common trends (Johansen, 1995). The vector autoregression representation VAR(p) of the Lee-Carter mortality indices vector tK can be written in an equivalent form, known
as the vector error correction (VEC) representation of a cointegrated vector. The likelihood ratio tests, the Johansen trace test and the maximum eigenvalue test can be used to determine the number of cointegration relationships.
The VEC model incorporates both the short run and long run interrelated dynamics of the Lee-Carter mortality indices, and can be used to generate point and interval forecasts. Such a framework has the advantage to preserve into the future the long-term equilibrium relationships from the vector of mortality indices, developed by the long-term experience. The resulting forecasts of the mortality index can then be introduced into the country specific Lee-Carter model, to generate forecasts for the age-specific death rates. We mention that the existence of common stochastic trends driving a vector of nonstationary variables significantly affects their forecasts, since some linear combinations remain “linked”, whereas others drift apart (Hendry and Juselius, 2001). Therefore, the existence of one or more common stochastic trends driving the mortality indices of countries from a spatial cluster affects their forecasts. By forecasting the mortality indices in a vector error correction model, the mortality indices of countries from a spatial cluster will continue to share the same common stochastic trends. This procedure allows us to obtain long-term mortality projections for all countries from a cluster, including the small populations, in line with the common patterns and interdependencies detected in the long-run mortality experiences of the countries.
III. Empirical results
This section highlights the long-term trends for general mortality levels in the European countries, conducts an empirical procedure of testing for common stochastic trends in the vector of general mortality levels, and forecasts the mortality rates taking into account these common stochastic trends.
III.1. The spatial clusters of the European countries As a first step, we obtain homogenous spatial clusters according to relevant predictor variables of historic and future mortality level. The SKATER algorithm has been performed to group the countries into homogeneous contiguous regions according to the following indicator variables: the life expectancy at birth, the expected years of schooling and the gross domestic product per capita.5
5 The values recorded in 2010, available from the Human Development Reports database, at
http://hdr.undp.org/, were considered.
Common Stochastic Trends in European Mortality Levels
Romanian Journal of Economic Forecasting – XIX (2) 2016 159
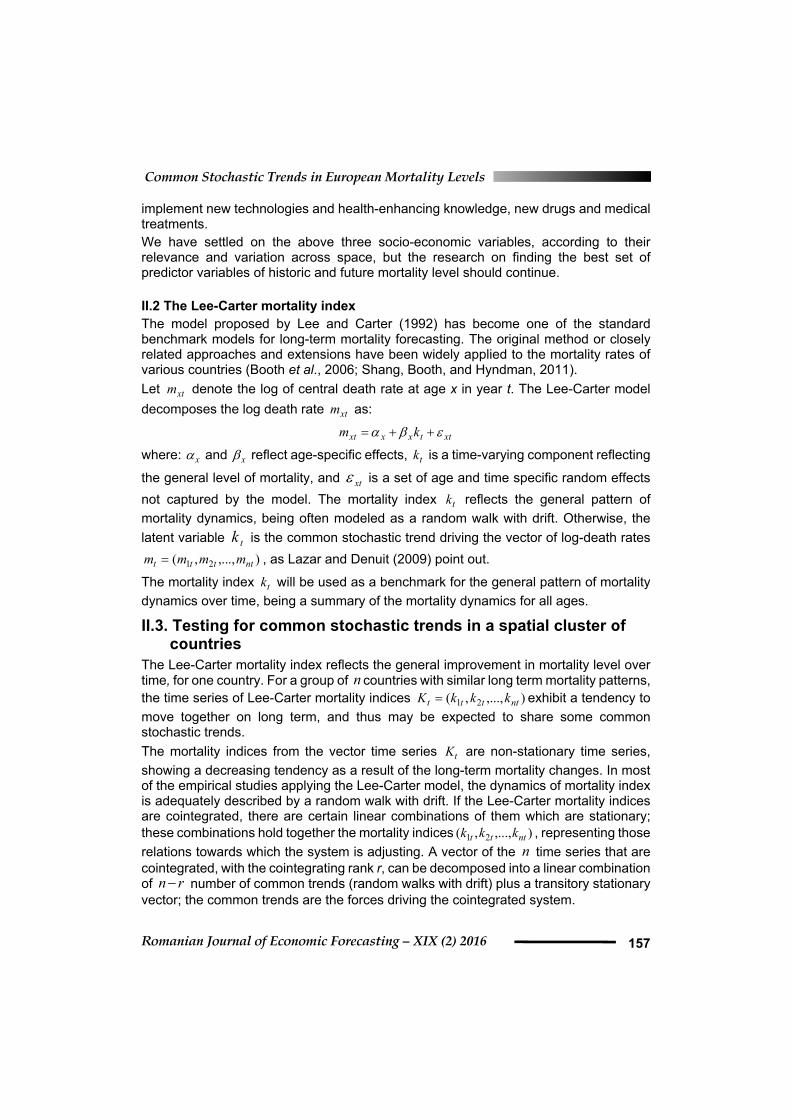
The SKATER procedure6 provides seven spatially homogenous clusters for Europe, starting from a number of 43 European countries. The spatial representation of clusters arrangement and the minimum spanning tree are displayed in Figure 1, using a different shade of gray for each cluster.
Figure 1
Spatial representation of clusters arrangement, the minimum spanning tree
A restriction to the regionalization procedure was added by establishing a minimum value of 20 million inhabitants, in a resulting cluster. This restriction allows for avoiding clusters with a small number of inhabitants. Without such a restriction, a small country like Luxembourg could not be assigned to a cluster, mainly because it did not show similarity regarding the gross domestic product per capita, with a contiguous cluster group. Table 1 summarizes the members of the seven spatial clusters detected.7
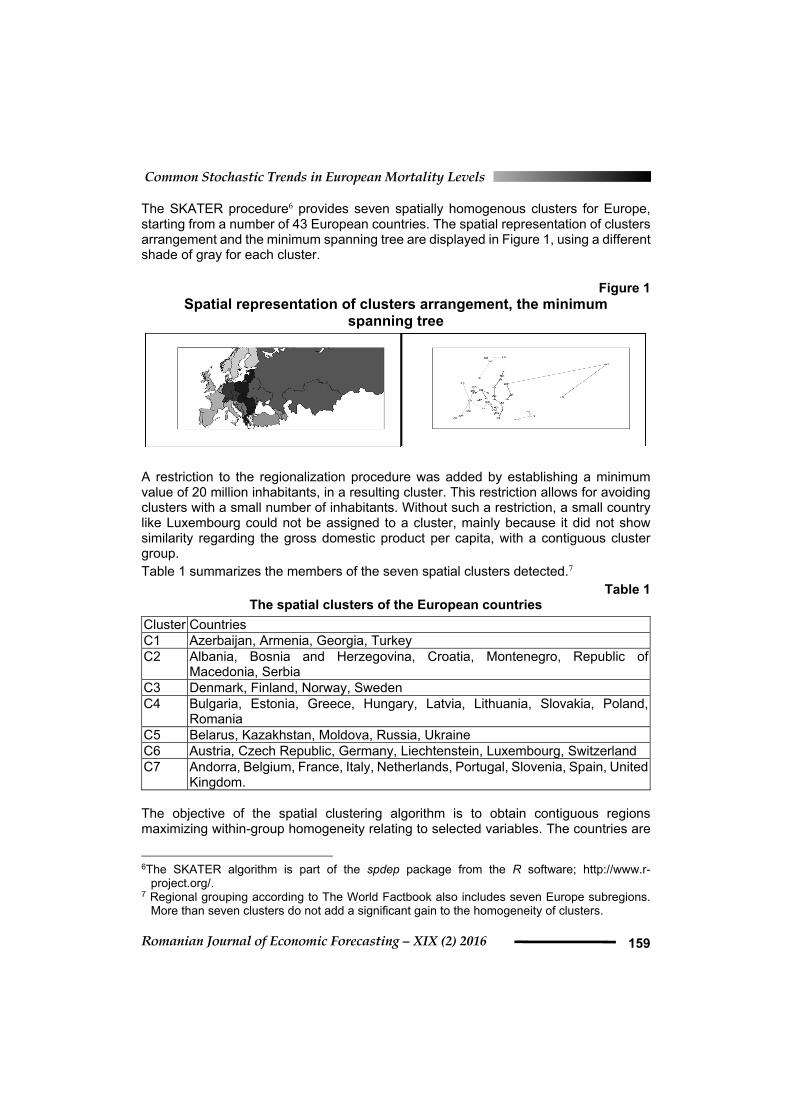
Table 1 The spatial clusters of the European countries
Cluster Countries C1 Azerbaijan, Armenia, Georgia, Turkey C2 Albania, Bosnia and Herzegovina, Croatia, Montenegro, Republic of
Macedonia, Serbia C3 Denmark, Finland, Norway, Sweden C4 Bulgaria, Estonia, Greece, Hungary, Latvia, Lithuania, Slovakia, Poland,
Romania C5 Belarus, Kazakhstan, Moldova, Russia, Ukraine C6 Austria, Czech Republic, Germany, Liechtenstein, Luxembourg, Switzerland C7 Andorra, Belgium, France, Italy, Netherlands, Portugal, Slovenia, Spain, United
Kingdom. The objective of the spatial clustering algorithm is to obtain contiguous regions maximizing within-group homogeneity relating to selected variables. The countries are
6The SKATER algorithm is part of the spdep package from the R software; http://www.r-
project.org/. 7 Regional grouping according to The World Factbook also includes seven Europe subregions.
More than seven clusters do not add a significant gain to the homogeneity of clusters.

Institute for Economic Forecasting
Romanian Journal of Economic Forecasting – XIX (2) 2016 160
grouped according to geographical proximity (Figure 1) and levels of the selected variables. This approach can be used as a rigorous method to generate groups of related populations, as homogeneous spatial clusters. By using a spatial clustering algorithm, we avoid an ad-hoc grouping of the countries expected to record similar improvements in mortality. III.2 The Lee-Carter mortality indices across European countries The age-specific death rates have been obtained from the Human Mortality Database8. The second step of our investigation consists in testing for common stochastic trends in mortality dynamics of countries from each spatially homogenous cluster, described in Table 1. Exploring the data availability for each cluster, we conduct the empirical analysis for the countries and time periods indicated in Table 2; the same period should be considered for all the countries from a cluster.
The Lee-Carter model is estimated based on log of gross death rates xtm for female,
and for ages ...,,61,60x . The dynamics of mortality for the elderly population is an
important task for the annuity providers, private or public retirement systems. However, as expected, the above interval age restriction can lead to a better fit for the Lee-Carter model. An analysis for the entire spectrum of ages would follow the same lines. We have restricted the ages up to 90 years old, in order to avoid excessive fluctuation beyond this age. The estimation is carried on using the lca function from the demography package, implemented in the R software. Except for the countries from cluster C5, the percentage variation explained by the Lee-Carter model is higher than 85%.
Table 2 Mortality data sets (Human Mortality Database, 2010)
Cluster Countries Period C3 Denmark, Finland, Norway, Sweden 1878-2008 C4 Bulgaria, Estonia, Hungary, Latvia, Lithuania, Slovakia, Poland 1959-2009 C5 Belarus, Russia, Ukraine 1959-2006 C6 Austria, Czech Republic, Germany, Switzerland 1956-2007 C7 Belgium, France, Italy, Netherlands, Portugal, Spain, United
Kingdom. 1940-2008
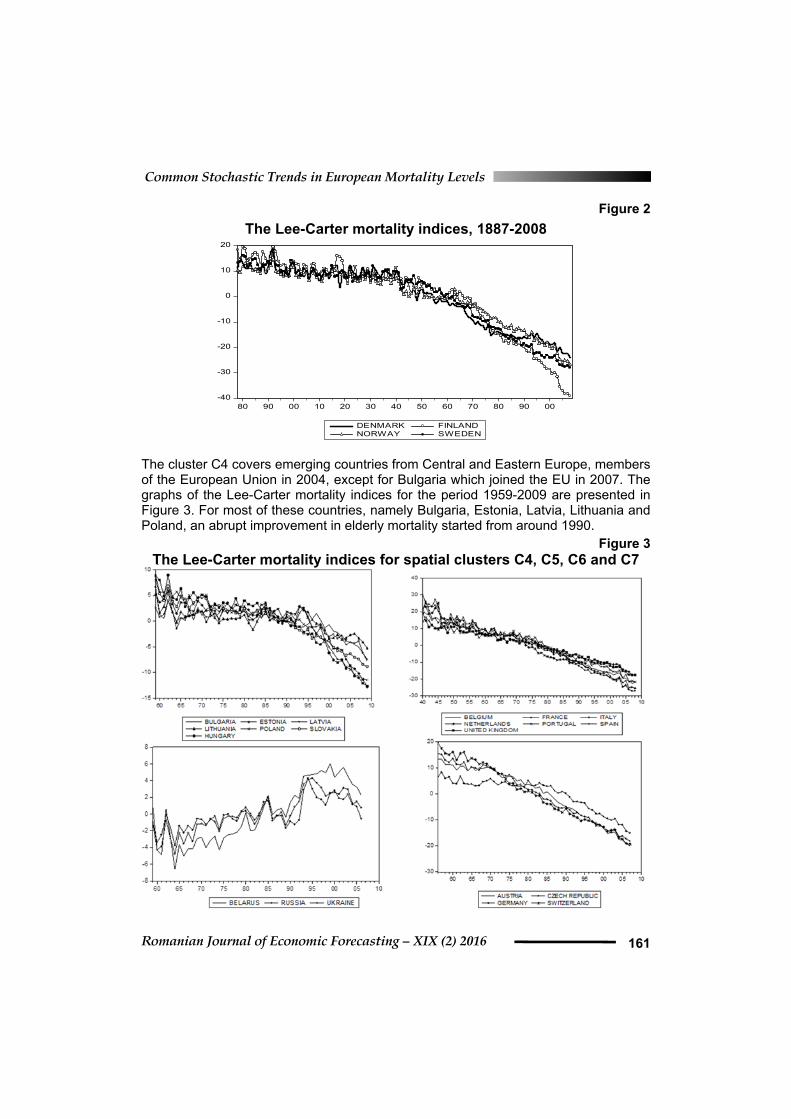
The time series for death rates are available for all the countries from cluster C3, containing countries from the Northern Europe: Denmark, Finland, Norway and Sweden. Figure 2 indicating the graphs of the Lee-Carter mortality indices over the period 1887-2008 suggests a similar trend of the elderly mortality evolution. This common feature may be expected to continue into the long run. The trend of the mortality indices, indicating the dominant pattern of mortality dynamics, has been more abrupt since 1945, for all the countries. Denmark has experienced a period of relative stagnation between 1970 and 1995.
8 Human Mortality Database, http://www.mortality.org/.
Common Stochastic Trends in European Mortality Levels
Romanian Journal of Economic Forecasting – XIX (2) 2016 161
Figure 2
The Lee-Carter mortality indices, 1887-2008
The cluster C4 covers emerging countries from Central and Eastern Europe, members of the European Union in 2004, except for Bulgaria which joined the EU in 2007. The graphs of the Lee-Carter mortality indices for the period 1959-2009 are presented in Figure 3. For most of these countries, namely Bulgaria, Estonia, Latvia, Lithuania and Poland, an abrupt improvement in elderly mortality started from around 1990.
Figure 3 The Lee-Carter mortality indices for spatial clusters C4, C5, C6 and C7
-40
-30
-20
-10
0
10
20
80 90 00 10 20 30 40 50 60 70 80 90 00
DENMARK FINLANDNORWAY SWEDEN
Institute for Economic Forecasting
Romanian Journal of Economic Forecasting – XIX (2) 2016 162
In Hungary and Slovakia, an abrupt downward trend began earlier, from around 1980. During the last ten years, Hungary, Poland and Estonia recorded the lowest general levels of mortality. The former Soviet Republics Belarus, Russia, and Ukraine seem to share a common trend, as Figure 3 suggests. A slight improvement in the general levels of mortality, at ages over 60, started later, around 1995. Before 1995, these countries recorded a slightly upward trend in the general levels of mortality. These results should be regarded with caution, as the percentage of variance explained by the Lee-Carter model is low; the model explains 65% of the variation in the data. A downward trend in mortality should be observed for more developed countries geographically placed in Central Europe, namely Austria, the Czech Republic, Germany and Switzerland. Switzerland has recorded a continuous, linear improvement in mortality, and starting in 1975 it has recorded the lowest level of the general level of mortality for the elderly population. For Austria and Germany, the trend is more abrupt starting in 1970. The general levels of mortality for the elderly population in Austria and Germany are very similar. In the Czech Republic, the mortality changes started later, around 1985. The cluster C7 groups developed countries located in Western and Southern Europe. These countries have recorded comparable levels for the mortality rates, and experienced a similar evolution of mortality in the long run, although some country specific patterns could be observed. During the 1985-2005 period, the general level of mortality for older population in the Netherlands did not record a significant improvement. France, Italy and Spain experienced the most abrupt downward trend, while in the Netherlands and the United Kingdom the general level of mortality was highest during the last twenty years.
III.3 Testing for common trends in the European mortality A visual inspection of Figure 2 and Figure 3, depicting the evolution of the Lee-Carter mortality indices for the countries grouped in a spatial cluster, suggests the possibility of common trends. A rigorous statistical procedure to test for the presence of common stochastic trends driving the Lee-Carter mortality indices is required. There may be one or more common trends (up to 1n common trends in a n -dimensional vector) driving the vector of indices. The presence of r cointegration relationships in a n -dimensional vector time series implies the existence of rn common stochastic trends. In order to determine the number of common trends driving the vector of mortality indices we perform the Johansen cointegration test. The Johansen methodology is implemented following the steps recommended by Harris and Sollis (2003): (a) testing for unit roots in order to determine the integration order, for each mortality index from the n -dimensional vector; (b) setting an adequate value for the lag length in the vector autoregressive representation; (c) testing for the cointegrating rank and specifying whether deterministic variables should enter into the VEC model and cointegration relationships; (d) estimating the VEC model and generating forecasts.
Common Stochastic Trends in European Mortality Levels
Romanian Journal of Economic Forecasting – XIX (2) 2016 163
These steps are illustrated for detecting the number of common trends driving the 4-dimensional vector of Lee-Carter mortality indices ),,,( 4321 ttttt kkkkK
corresponding
to the countries from cluster C3, namely Denmark, Finland, Norway and Sweden. The mortality indices seem to be nonstationary, as one may see in Figure 2. The time component tk
from the Lee-Carter model is described by a random walk with drift
model, this assumption providing satisfactory results in many empirical studies. The conventional ADF, KPSS and ERS unit root tests indicate that the mortality indices have a single unit root. The procedure usually used to set the lag length resorts to the estimation of the unrestricted vector autoregressive model, and selection of the optimal lag by an information criterion; the AIC information Criterion suggests 2 lags. We perform the Johansen trace test, with the purpose to determine the number of cointegrating vectors. As a general rule, we incorporate a deterministic time trend in the testing procedure if it has a significant coefficient in the VEC representation. The Johansen trace test, conducted under the assumption of an intercept and trend in the VEC representation, indicates one cointegrating relationship, or equivalently 3 common stochastic trends.9 It may be expected that this long-run relationship among the general levels of mortality of Denmark, Finland, Norway and Sweden will be preserved in the future.
Figure 4 Point forecasts for Lee-Carter mortality indices, 2009-2040
The point forecasts obtained for the mortality index can then be introduced into the country specific Lee-Carter model, to generate forecasts for age-specific death rates. Such an approach accounts for the long-term equilibrium relationships among the Lee-Carter mortality indices, which will be preserved in the future. The general levels of mortality for countries from a spatial cluster will remain linked through the cointegration relationships, developed by the long-term mortality experience.
9 The Johansen cointegration tests detect a cointegration equation, with or without linear trend in
cointegration equation and/or VEC. Therefore, 1r is well supported by data.
-50
-40
-30
-20
-10
0
10
20
80 90 00 10 20 30 40 50 60 70 80 90 00 10 20 30 40
DENMARK FINLANDNORWAY SWEDEN
Institute for Economic Forecasting
Romanian Journal of Economic Forecasting – XIX (2) 2016 164
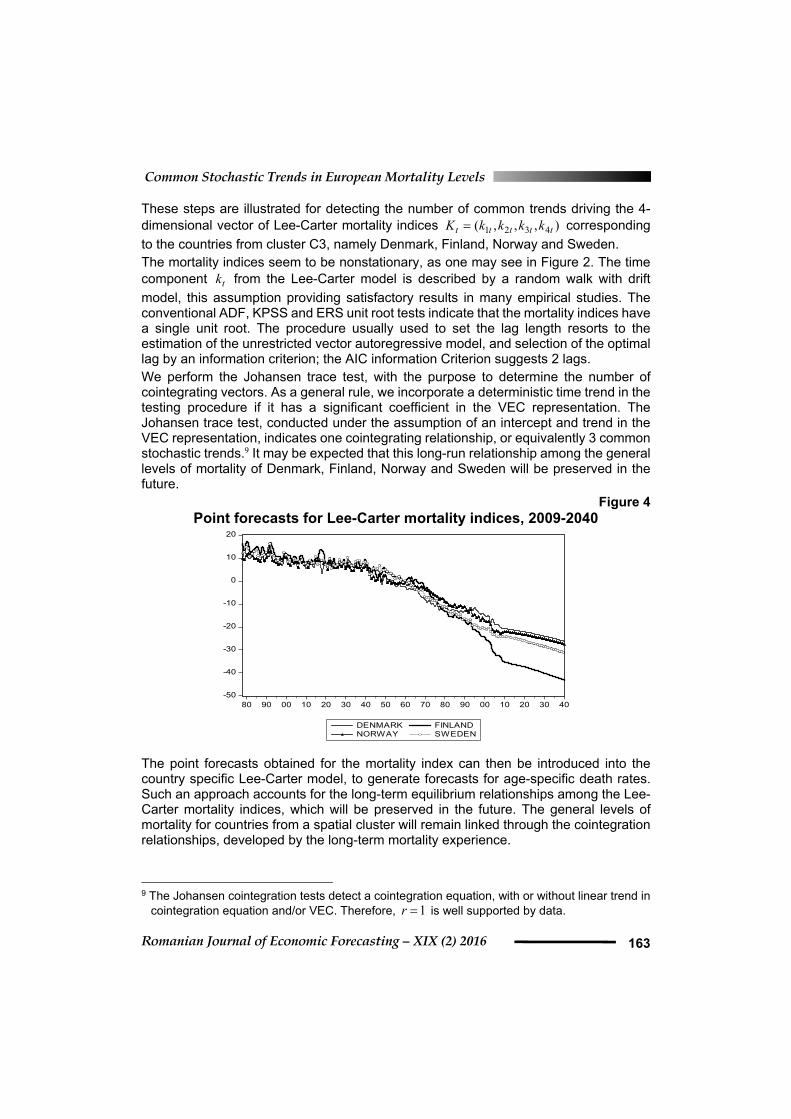
A similar testing procedure was conducted for the other four spatial clusters, revealing the presence of some common trends driving the vectors of mortality indices. The final results can be summarized as follows:10 (a) the mortality indices corresponding to the clusters denoted by C4, C5, C6, and C7 share four, two, three, and five common stochastic trends, respectively; (b) the used lag length was one for C4, C5 and C7, and two for cluster C6; (c) a deterministic linear trend was included in the VEC representation when the trace test was applied to cluster C4 and C6 (where the data shows a quadratic deterministic trend); in cluster C7 the cointegration space contains a linear deterministic trend, while in cluster C3 no deterministic trend is included in the cointegration space or the VEC representation.11 Indeed, the mortality indices for clusters C5 and C7 seem to have a deterministic linear trend (in addition to a stochastic one).
Figure 5 Point and interval forecasts for mortality indices, 2009-2040
To conclude, the Johansen cointegration test detects several long-run relationships between mortality indices in each cluster. The long-term projections for the Lee-Carter mortality indices can be generated from the VEC model, as it was done for the countries from cluster C3. This section approaches the concept of common trends in mortality, used in previous studies, in a multivariate time series framework. A natural approach to generate long-
10 The tests were conducted at a 5% significant level. 11 Detailed results can be provided by the authors upon request.
-40
-30
-20
-10
0
10
20
1900 1925 1950 1975 2000 2025
DENMARK ± 2 S.E.
-60
-40
-20
0
20
1900 1925 1950 1975 2000 2025
FINLAND ± 2 S.E.
-40
-30
-20
-10
0
10
20
1900 1925 1950 1975 2000 2025
NORWAY ± 2 S.E.
-50
-40
-30
-20
-10
0
10
20
1900 1925 1950 1975 2000 2025
SWEDEN ± 2 S.E.

Common Stochastic Trends in European Mortality Levels
Romanian Journal of Economic Forecasting – XIX (2) 2016 165
term projections of national age-specific mortality rates is suggested, taking account of the mortality experience of the other populations with a similar experience.
III.4. Comparison of life expectancies: Actual data, Lee-Carter forecasts, VEC forecasts
Pension providers and social security systems are more interested in long-term projections of the aggregate mortality indicators. Therefore we compare the forecasts for an aggregate indicator, typically used in measuring the longevity risk, like life expectancy at age 60. For each year t of the 2009-2014 period a life table covering the
ages 90...,,61,60x is obtained, using the survival probability xtp based on actual data
(available at Human Mortality Database), and on projections provided by the Lee-Carter model, and by the VEC approach, respectively, for the age-specific central death rate
xtm . The survival probability xtp is derived from the central death rate as: ))5.01/((11 xtxtxtxt mmqp .
From the life tables the life expectancies at age 60 are then computed, given by:
30
160 )(
kxtk pte , where xtk p is the survival probability for year t.
The forecasts for the age-specific death rates xtm are generated by the Lee-Carter
model: xttxxxt km , where the point forecasts tk for the mortality index are
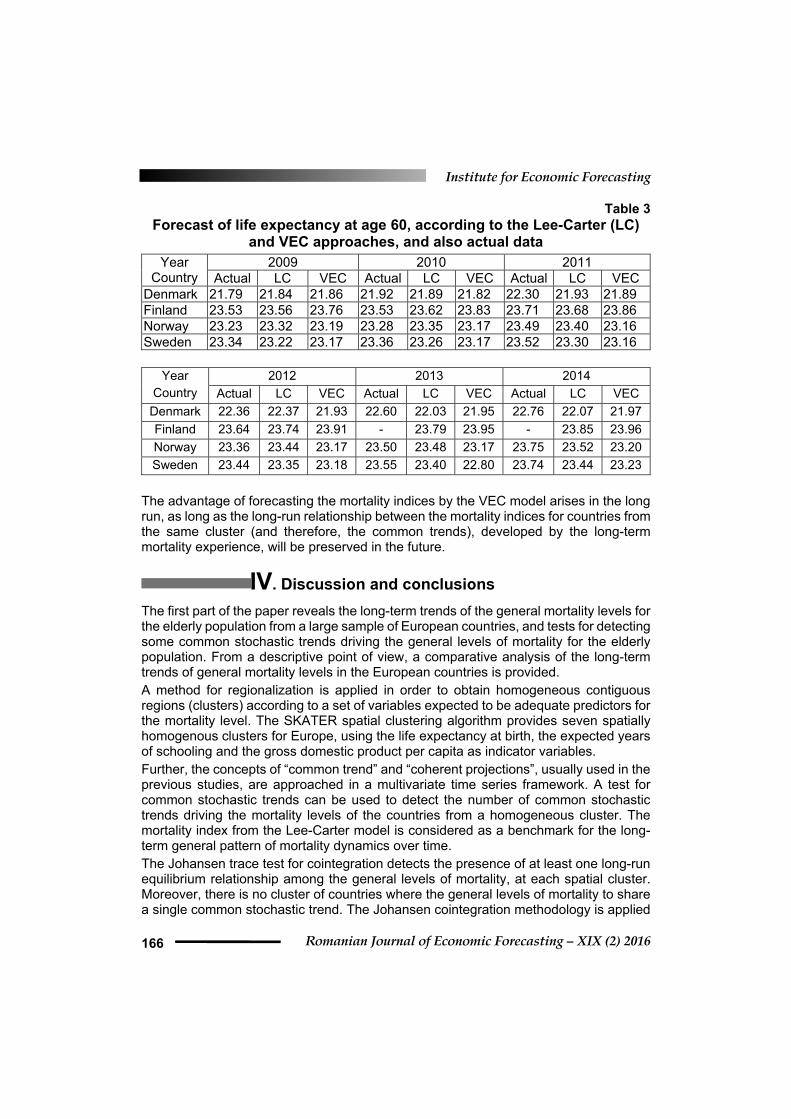
given by the random walk with drift model in the traditional Lee-Carter model12, and by the VEC model in the proposed approach, respectively. Table 3 displays the derived life expectancy at age 60 for countries from cluster C3, containing countries from Northern Europe: Denmark, Finland, Norway and Sweden. We mention that the Lee-Carter model and the VEC model were estimated using age-specific central death rates from the 1878-2008 period, female, ages 90...,,61,60x .
For Finland, the actual age-specific death rates are not yet available for 2013 and 2014. The projections for age-specific death rates, generated by Lee-Carter model and also by the VEC approach, by which the aggregate life expectancy were computed, can be provided by the authors, upon request. In the short term, the two approaches used to forecast the mortality rates, projection of mortality index from a random walk model, and from the VEC model, respectively, provide similar values for life expectancy. These point estimates are also close to life expectancy computed from available data, for the period 2009-2014.
12 The projections for death rates provided by the Lee-Carter model are obtained using the
forecast function, from the demography package, implemented in the R software.
Institute for Economic Forecasting
Romanian Journal of Economic Forecasting – XIX (2) 2016 166
Table 3 Forecast of life expectancy at age 60, according to the Lee-Carter (LC)
and VEC approaches, and also actual data Year
Country 2009 2010 2011
Actual LC VEC Actual LC VEC Actual LC VEC Denmark 21.79 21.84 21.86 21.92 21.89 21.82 22.30 21.93 21.89 Finland 23.53 23.56 23.76 23.53 23.62 23.83 23.71 23.68 23.86 Norway 23.23 23.32 23.19 23.28 23.35 23.17 23.49 23.40 23.16 Sweden 23.34 23.22 23.17 23.36 23.26 23.17 23.52 23.30 23.16
Year Country
2012 2013 2014
Actual LC VEC Actual LC VEC Actual LC VEC
Denmark 22.36 22.37 21.93 22.60 22.03 21.95 22.76 22.07 21.97
Finland 23.64 23.74 23.91 - 23.79 23.95 - 23.85 23.96
Norway 23.36 23.44 23.17 23.50 23.48 23.17 23.75 23.52 23.20
Sweden 23.44 23.35 23.18 23.55 23.40 22.80 23.74 23.44 23.23
The advantage of forecasting the mortality indices by the VEC model arises in the long run, as long as the long-run relationship between the mortality indices for countries from the same cluster (and therefore, the common trends), developed by the long-term mortality experience, will be preserved in the future.
IV. Discussion and conclusions
The first part of the paper reveals the long-term trends of the general mortality levels for the elderly population from a large sample of European countries, and tests for detecting some common stochastic trends driving the general levels of mortality for the elderly population. From a descriptive point of view, a comparative analysis of the long-term trends of general mortality levels in the European countries is provided. A method for regionalization is applied in order to obtain homogeneous contiguous regions (clusters) according to a set of variables expected to be adequate predictors for the mortality level. The SKATER spatial clustering algorithm provides seven spatially homogenous clusters for Europe, using the life expectancy at birth, the expected years of schooling and the gross domestic product per capita as indicator variables. Further, the concepts of “common trend” and “coherent projections”, usually used in the previous studies, are approached in a multivariate time series framework. A test for common stochastic trends can be used to detect the number of common stochastic trends driving the mortality levels of the countries from a homogeneous cluster. The mortality index from the Lee-Carter model is considered as a benchmark for the long-term general pattern of mortality dynamics over time. The Johansen trace test for cointegration detects the presence of at least one long-run equilibrium relationship among the general levels of mortality, at each spatial cluster. Moreover, there is no cluster of countries where the general levels of mortality to share a single common stochastic trend. The Johansen cointegration methodology is applied
Common Stochastic Trends in European Mortality Levels
Romanian Journal of Economic Forecasting – XIX (2) 2016 167
to project the mortality indices into a vector error correction model. This part is illustrated for the cluster of Nordic countries, namely Denmark, Finland, Norway and Sweden. As a next step, the resulting forecasts for a mortality index can be introduced into the country specific Lee-Carter model, to generate forecasts for national age-specific death rates. The projections for age-specific death rates generated by the Lee-Carter model and also by the VEC approach were used to compute the life expectancy at age 60. In the short run, the point estimates for life expectancy generated by projection of mortality index from the random walk model, and from the VEC model, respectively, are similar. The estimates obtained from both approaches are close to the life expectancy computed from available data. Compared to the classic Lee Carter model, using the VEC approach, they preserved on long-run the common stochastic trends, developed by the long-term mortality experience, from the general levels of mortality (measured by the mortality indices), for countries from a cluster. Private or public retirement systems, health and elderly care systems, management of the components of social security systems affected by mortality trend, or pricing of the mortality-linked securities require accurate estimates for future mortality rates. Incorporating the common trends driving the mortality patterns for a group of countries into the forecasting model ensures that the long-term equilibrium relationships between the national mortality indices will be preserved in the future. On the other hand, a cointegration analysis of the national mortality levels has important implications for long-term horizon investors on the Life Markets. When the general levels of mortality move together in the long-run (are highly correlated) there are limited long-term gains from international diversification of the longevity risk. Additionally, a multivariate time series procedure allows for improving the long-term mortality projections for small populations from a cluster. The projections for the Lee-Carter mortality index of a small population will be coherent with the common patterns detected in the long-run mortality experiences of the countries from cluster containing it. For small population, the forecasts based on past trends are problematic and very sensitive to the fitting period, as Jarner and Kryger (2011) point out. The cointegration methods can also be applied to generate coherent forecasts for regions within the same country. This approach ensures that the interdependences between mortality in some regions remain in line with observed historic long-term patterns.
References
Assuncao, R.M., Neves, M.C., Camara, G. and Freitas, C.D.C., 2006. Efficient regionalization techniques for socio-economic geographical units using minimum spanning trees. International Journal of Geographical Information Science, 20, pp. 797–811.
Blake, D., Courbage, C. MacMinn, R. and Sherris, M., 2011. Longevity Risk and Capital Markets: The 2010–2011 Update. Geneva Papers on Risk and Insurance-Issues and Practice, 36, pp. 489–500.
Institute for Economic Forecasting
Romanian Journal of Economic Forecasting – XIX (2) 2016 168
Booth, H., Hyndman, R., Tickle, L. and De Jong, P., 2006. Lee-Carter mortality forecasting: A multi-country comparison of variants and extensions. Demographic Research, 15(9), pp. 289-310.
Börger, M. and Köhler, M.C., 2011. Coherent Projections of Age, Period, and Cohort Dependent Mortality Improvement, Fakultät für Mathematik und Wirtschaftswissenschaften, Universität Ulm, Germany, Preprint Series: 2011-05.
Dinu, M., Marinas, M. C., Socol, C. and Socol, A. G., 2012. Clusterization, Persistence, Dependency and Volatility of Business Cycles in an Enlarged Euro Area. Romanian Journal of Economic Forecasting, 15(2), pp. 5-23.
Easterly, W. and Levine, R.., 1997. Africa’s Growth Tragedy: Policies and Ethnic Divisions. Quarterly Journal of Economics, 112, pp. 1203-1250.
Harris, R. and Sollis, R., 2003. Applied Time Series Modeling and Forecasting. Chichester: John Wiley and Sons Ltd.
Hendry, D.F. and Juselius, K., 2001. Explaining cointegration analysis: Parts II. Energy Journal, 22, pp. 75–120.
Hyndman, R.J., Booth, H. and Yasmeen, F, 2013. Coherent Mortality Forecasting: The Product-ratio Method with Functional Time Series Models. Demography, 50(1), pp. 261-283.
Jarner, S.F. and Kryger, E.M., 2011. Modelling Adult Mortality in Small Populations. ASTIN Bulletin, 41(2), pp. 377-418.
Johansen, S., 1995. Likelihood-based inference in cointegrated vector autoregressive models. Oxford: Oxford University Press.
Keller, W., 2002. Geographic Localization of International Technology Diffusion. American Economic Review, 92(1), pp. 120-142.
Lazar, D. and Denuit, M., 2009. A multivariate time series approach to projected life tables. Applied Stochastic Models in Business and Industry, 25(6), pp. 806–823.
Lee, R. D. and Carter, L. R., 1992. Modelling and forecasting U.S. mortality. Journal of the American Statistical Association, 87(419), pp. 659–671.
Li, N. and Lee, R., 2005. Coherent mortality forecasts for a group of populations: an extension of the Lee-Carter method. Demography, 42(3), pp. 575-594.
Li, J.S.H. and Hardy, M.R., 2011. Measuring Basis Risk in Longevity Hedges. North American Actuarial Journal, 15(2), pp. 177–200.
Oeppen, J. and Vaupel, J.W., 2002. Broken Limits to Life Expectancy. Science, 296(5570), pp.1029–1031.
Shang, HL, Booth, H. and Hyndman, R., 2011. Point and interval forecasts of mortality rates and life expectancy: a comparison of ten principal component methods. Demographic Research, 25(5), pp. 173-214.
Spijker, J.J.A., 2004. Socioeconomic determinants of regional mortality differences in Europe. Amsterdam: Dutch University Press.