Embed Size (px)
Citation preview
45
10. Agricultural Imports-Exports and the Minnesota Connection
OverviewIn this activity, students shall develop their abilities to connect and integrate knowledge from all disciplines into their own knowledge bases.
Grade Levels: 6 & 8Time: Two to three 50 minute class periods.------------------------------------------------------------------------------------------------------------------------------------------
Minnesota State Standards: Geography
GRADE 6Benchmark: 6.2.4.5.1
Describe the movement of goods and services, resources and money through markets in a market-based economy.
Benchmark: 6.3.1.1.1
Create and use various kinds of maps, including overlaying thematic maps, of places in Minnesota; incorporate the “TODALSS” map basics, as well as points, lines and colored areas to display spatial information.
Benchmark: 6.4.4.23.2
Identify the major Minnesota political figures, ideas and industries that have shaped or continue to shape Minnesota and the United States today. (The United States in a New Global Age: 1980-present)
------------------------------------------------------------------------------------------------------------------------------------------
GRADE 8Benchmark: 8.2.1.1.1
Apply reasoned decision-making techniques in making choices; explain why different governments faced with the same alternatives might make different choices.
Benchmark: 8.3.1.1.1
Obtain and analyze geographic information from a variety of print and electronic sources to investigate places or answer specific geographic questions; provide rationale for its use.
Benchmark: 8.2.3.4.1
Identify factors which affect economic growth (percentage changes in Gross Domestic Product – GDP – and lead to a different standard of living in different countries.
Benchmark: 8.3.3.10.1
Explain how the changing patterns of industrialization and trade between the United States, and Canada or Mexico, have resulted in close connections between the countries in terms of manufacturing, energy and finance.
Benchmark: 8.3.3.10.3
Describe the changing role of Latin America in global trade networks.
------------------------------------------------------------------------------------------------------------------------------------------
Key words• International trade, USDA, imports, exports, agriculture commodity, retail, wholesale, law of supply and demand,
NAFTA, The Uruguay Round, KORUS
46
ObjectivesThe student will:
• demonstrate map reading skills.
• define international trade based on the import/export system.
• identify geographic and climatic reasons for trade.
• become familiar with basic agricultural crops grown in the United States and Minnesota.
Materials• World Map
• U.S. Map
• A variety of Food for Thought maps from www.mda.state.mn.us/fft
• Lesson Links for additional resources at www.mda.state.mn.us/fft
Minnesota Ag Export Profile
USDA State Fact Sheets
USDA State Export Data
USDA Trade Data
USDA Census Data – State and County Profiles
USDA Value of Food Imports
BackgroundFarmers produce and sell an abundance of agricultural products through a variety of marketing channels. Some products are sold directly to the consumer at roadside stands or small retailers. However, most goods are sold to wholesalers who then sell them to processors to manufacture a variety of goods. These products are then distributed by wholesalers and retailers to the consumer. Exporters sell commodities to other countries; importers bring merchandise into the United States. Farmers use large amounts of machinery, farm supplies and other products from domestic as well as foreign producers. In this manner, agriculture is an interdependent global economic system. Nations rely on each other for a variety of products because of varied climates, resources and specializations. Supply and demand for agricultural products is greatly influenced by worldwide economic conditions. Agricultural trade continues to be one of the strongest areas for the total trade effort in the United States. USDA recently released its final tally for agricultural exports in Fiscal year 2013, showing a new record of $140.9 billion! These export markets are crucial to the economic well-being of American farmers.
• Twenty percent of U.S. agricultural production is exported, with over half of many key commodities (ex. wheat, soybeans, cotton, corn, and rice) exported.
• The top 10 exporting states are California, Iowa, Illinois, Minnesota, Nebraska, Texas, Kansas, Indiana, North Dakota, and Ohio.
• In 2012, China imported $25.9 billion in U.S. agricultural goods, surpassing Canada’s total of $20.6 billion. Together with Mexico and Japan, these nations bought over 50 percent of U.S. agricultural exports.
• Job-Creating High Value Exports at Record Levels…Every $1 billion of U.S. agricultural exports in 2012 required 6,577 American jobs throughout the economy.
U.S. farm productivity will more than outpace U.S. consumer demands in the future. Opening of international markets will provide American farmers with the opportunity to sell their commodities to other countries. New international trade agreements such as; North American Free Trade Agreement (NAFTA), The Uruguay Round, and the Korean-North American Trade Agreement (KORUS) would create new markets for U.S. products.
**NAFTA involves the United, States, Mexico and Canada. The Uruguay Round involves the U.S. and the European Community (EC). KORUS involves U.S. and South Korea.
47
Fast Facts About Agriculture• 2.2 million farms dot America’s rural landscape. About 97 percent of U.S. farms are operated by families –
individuals, family partnerships or family corporations.
• Farm and ranch families comprise just 2 percent of the U.S. population.
• More than 21 million American workers (15 percent of the total U.S. workforce) produce, process and sell the nation’s food and fiber.
• Today’s farmers produce 262 percent more food with 2 percent fewer inputs (labor, seeds, feed, fertilizer, etc.), compared with 1950.
• In 2010, $115 billion worth of American agricultural products were exported around the world. The United States sells more food and fiber to world markets than we import, creating a positive agricultural trade balance.
• One in three U.S. farm acres is planted for export.
• 31 percent of U.S. gross farm income comes directly from exports.
• About 23 percent of raw U.S. farm products are exported each year.
• Farmers and ranchers receive only 16 cents out of every dollar spent on food at home and away from home. The rest goes for costs beyond the farm gate: wages and materials for production, processing, marketing, transportation and distribution. In 1980, farmers and ranchers received 31 cents.
• U.S. farm programs typically cost each American just pennies per meal and account for less than one-half of 1 percent of the total U.S. budget. The major budget component of the Farm Bill is nutrition/food assistance (80%).
Procedure1. Display a map of the world. Ask students:
Have you ever wondered where cocoa is grown for your favorite candy bar? (Brazil, West Africa).
What about the cinnamon on your breakfast toast? (Brazil, Sri Lanka)
And what about the vanilla used to flavor your favorite dessert? (India, Jamaica)
What about the wool for your favorite winter coat? (Spain, Australia, New Zealand)
Grapes and other fruits? (Chile)
Tell students that if they have ever thought about this, then they were thinking about international trade. Have students locate the countries listed in #1 on the world map.
2. Next, help students understand the concepts of trade by explaining that just as the word “trade” implies countries EXPORT (sell) basic COMMODITIES (raw products) and then IMPORT (buy) other basic products. The need for a country to participate in INTERNATIONAL TRADE can be determined by the geographic terrain, location and climate.
Examples:• Look at Japan on the map. Why would this country need to import beef and wheat? (not enough land, wrong
climate)
• Saudi Arabia will not receive rain for years in some parts of the country. How would this affect agriculture?
• Customers in Manitoba, Canada, ask for seedless grapes. Why would they need to import fruit and what countries would be a source?
3. List the agricultural imports listed below under “U.S. Farmers’ Best Customers” on the whiteboard to facilitate discussion. Possible Discussion Questions:
• Why do these countries import U.S. agricultural products?
• Do you think the U.S. imports products from China, Canada, Mexico, Japan and South Korea? Why or why not?
• What factors cause a country to import or export? Why do some countries enter into trade agreements and others do not?
48
U.S. Farmers’ Best Customers:
China: imports U.S. soybeans and cotton
Canada: imports U.S. beef
Mexico: imports U.S. feed grains, soybeans and soy products
Japan: imports U.S. wheat, feed grains, beef, pork, soybeans
South Korea: imports U.S. feed grains
4. Write the statements and questions listed below on the whiteboard. Have students copy these on a sheet of paper to be turned in at the end of class.
World Relies on U.S. Agricultural Exports
• What are the United States’ top crop and livestock exports? To which countries do they go? Why?
• How are these products used by other countries?
Top U.S. Agricultural Exports
• Which of the top U.S. agricultural exports may have been produced by Minnesota farmers?
• Where in Minnesota would these crops/animals grow?
Agricultural Products We Buy Abroad
• Identify the products that would be impossible to grow or raise in the U.S. (or Minnesota climate).
• From whom would the U.S. purchase these products or imports?
Ask students to discuss the questions and record their thoughts. Information from the United states Department of Agriculture (USDA) and Minnesota Department of Agriculture (MDA) on agricultural imports and exports can also be used by the students. Links to the following information can be found under the Lesson Links for Lesson 10 at http://www.mda.state.mn.us/fft
USDA State Fact Sheets
USDA State Export Data
USDA trade Data
USDA Census Data - State and County Profiles
USDA Value of Food Imports
Have students turn in their written responses to the questions for assessment.
5. Conclude the lesson with the “Minnesota Connections” worksheet activity.
AssessmentsStudents’ knowledge can be assessed by successful completion of the maps and by their applications of what they learn about international trade to U.S. and Minnesota agriculture. Students verbalize the contributions of U.S. agriculture to the world food supply.
49
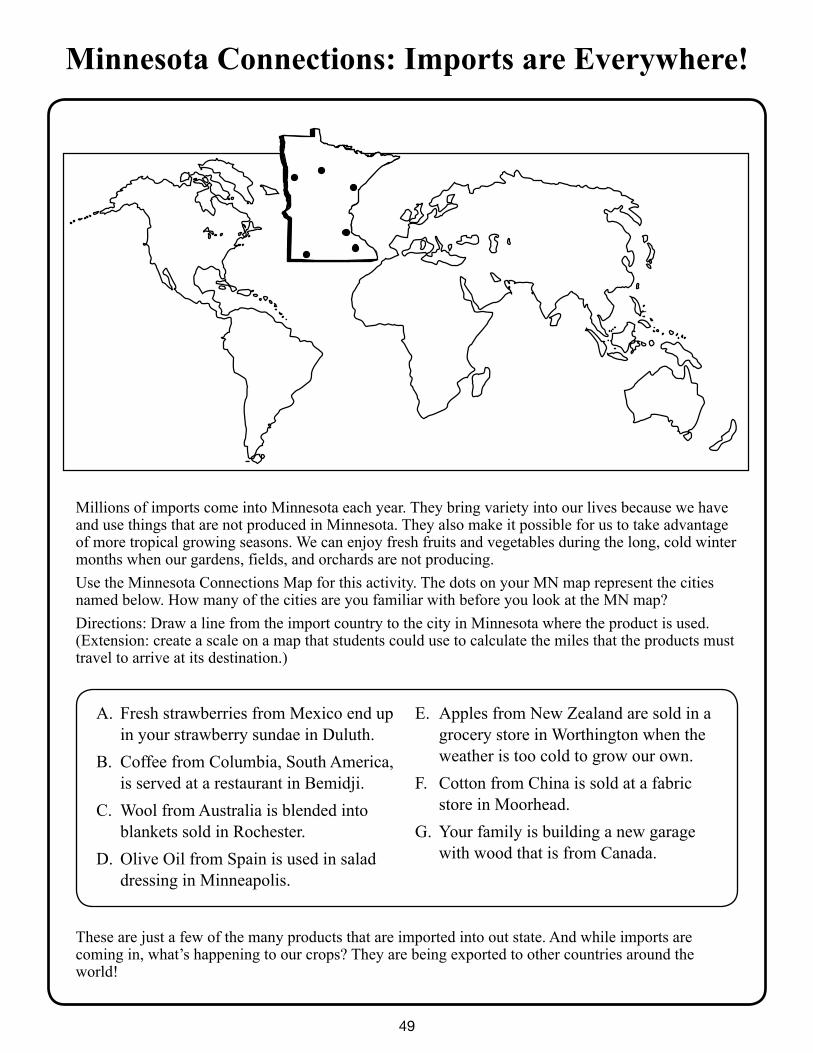
Millions of imports come into Minnesota each year. They bring variety into our lives because we have and use things that are not produced in Minnesota. They also make it possible for us to take advantage of more tropical growing seasons. We can enjoy fresh fruits and vegetables during the long, cold winter months when our gardens, fields, and orchards are not producing.Use the Minnesota Connections Map for this activity. The dots on your MN map represent the cities named below. How many of the cities are you familiar with before you look at the MN map? Directions: Draw a line from the import country to the city in Minnesota where the product is used. (Extension: create a scale on a map that students could use to calculate the miles that the products must travel to arrive at its destination.)
These are just a few of the many products that are imported into out state. And while imports are coming in, what’s happening to our crops? They are being exported to other countries around the world!
What is your favorite food that is imported into Minnesota from another country?_____________________________Where does it come from?___________________
Minnesota Connections: Imports are Everywhere!
A. Fresh strawberries from Mexico end up in your strawberry sundae in Duluth.
B. Coffee from Columbia, South America, is served at a restaurant in Bemidji.
C. Wool from Australia is blended into blankets sold in Rochester.
D. Olive Oil from Spain is used in salad dressing in Minneapolis.
E. Apples from New Zealand are sold in a grocery store in Worthington when the weather is too cold to grow our own.
F. Cotton from China is sold at a fabric store in Moorhead.
G. Your family is building a new garage with wood that is from Canada.