Embed Size (px)
Citation preview
J. Environ. Res. Develop.Journal of Environmental Research And Development Vol. 7 No. 1A, July-September 2012
484
*Author for correspondence
A FUZZY INFERENCE SYSTEM FOR AIR QUALITYIN USING MATLAB, CHENNAI, INDIA
Kumaravel R.*1 and Vallinayagam V.1. SRM University, Career Development Centre, Kattankulathur, Chennai (INDIA)2. Department of Mathematics, St.Joseph’s College of Engineering, Chennai (INDIA)
Received April 25, 2012 Accepted August 05, 2012
ABSTRACTAir quality is an important issue of relevance in the context of present times. The proposed model isdesigned to predict Air Quality Index (AQI) for Chennai in Tamil Nadu, India. A Fuzzy InferenceSystem (FIS) simplifies and speed up the computation of AQI as compared to the currently existingstandards. In this paper, the proposed model is compared with Indian Air Quality Index (IAQI) and itis found that the designed model results in accurate prediction. The earth’s atmosphere is a mixtureof gases and particulate-phase substances. The most abundant of these, Nitrogen(N2) and Oxygen(O2),comprise approximately 78% and 21% respectively, of atmosphere mass and volume. Air quality canbe defined qualitively. It is poor when cause a reduction in visibility, soil building surfaces anddamage materials, damage crops and other plants, cause adverse health effects. It is deemed goodwhen the sky appears clean and no adverse environmental effects are evident.
Key Words : Air Quality Index (AGI), Fuzzy logic, Fuzzy Inference System (FES), MATLAB
INTROUDCTIONThe atmosphere that surrounds the plant earth isone of the factors that makes our plant hospitabletowards life. The average human makes use ofabout 30 pounds of air each day, using it to oxidizefood for energy and warmth. A number of tracegases make up the remaining 1% averageconcentration1 in Table 1.
Table 1 : Percentage and volume withdifferent gases
Gases Percentage of volumeNitrogen 78.03Oxygen 20.99Argon 0.94Carbon di oxide 0.03Balance* 0.01
*Includes hydrogen, helium , neon, krypton, xenon and vari-ous pollutants
Contamination or pollution of the atmosphereoccurs as a consequences of natural process aswell as human activity ( the letter are called
anthropogenic). Anthropogenic air pollution asbeen continues to be viewed as a seriousenvironmental and public health problem. Itsseriousness lies in the fact that elevated pollutantlevels are produced in environments where harmto human health2 and welfare is more likely.The quality of air is our communities, country sideand even remote locations changes form hour tohour, day to day and over longer time scales. Airquality3 can be defined qualitively. It is poor whencause a reduction in visibility, soil building surfacesand damage materials, damage crops and otherplants, cause adverse health effects. It is deemedgood when the sky appears clean and no adverseenvironmental effects are evident.The AQI is used to report daily air qualities inmetropolitan areas for four pollutionsO3,PM(PM10 and PM2.5), CO, SO2 and NO2.Chennai, the fourth largest city in India, capital ofthe state Tamil Nadu and is located on the easternsea- coast of the sub-continent at an latitude3 of13’04" North and a longitude of 80’15" East. It islocated at the center of an extensive network ofsurface, sea and air transportation facilitiesserving South India and is well connected to the
485
J. Environ. Res. Develop.Journal of Environmental Research And Development Vol. 7 No. 1A, July-September 2012
Fig. 2 (a) : Anna nagar map Fig. 2(b) : Kilpauk map
rest of India. The Chennai Metropolitan Area(CMA) comprises of the city of Chennai and itsoutlying urban and rural areas.Chennai has a tropical climate with a mean annualtemperature of over 30oC and it varies from 20oCto 45oC. Humidity ranges from 50% to 90%, withthe highest prevailing during monsoon. Cool seabreezes blows almost throughout the yearproviding relief from the normally hightemperature. The experiences an average rainfallof about 110 cm , mostly during the north eastmonsoon period between October and December.The south west monsoon occurs between Juneand September, during which period also the citygets some rainfall. Rise in population and growth
in economic activity have led to increase inpollution in Chennai. With good infrastructurefacilities, the city has become a major center forcommerce, industry and education. At the sametime, the civic amenities have not kept pace andthe unabated migration of floating population hascompounded the problem. The land useregulations are not strictly followed as theawareness among the public is lacking.
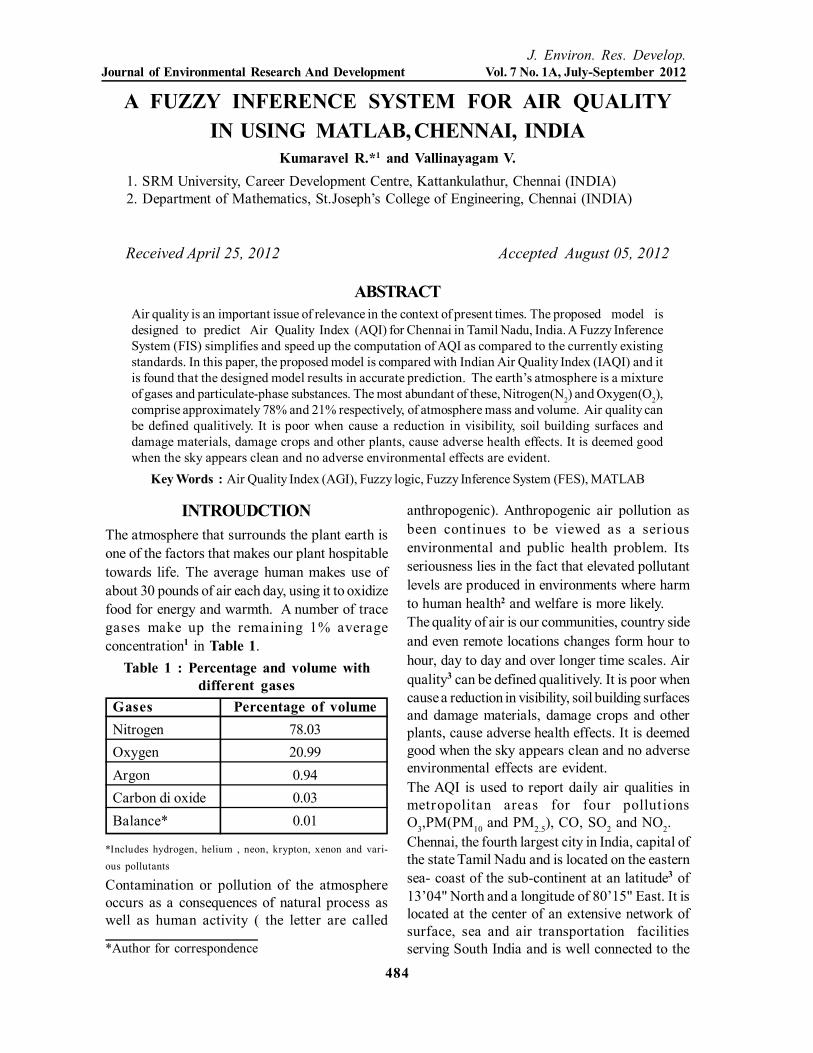
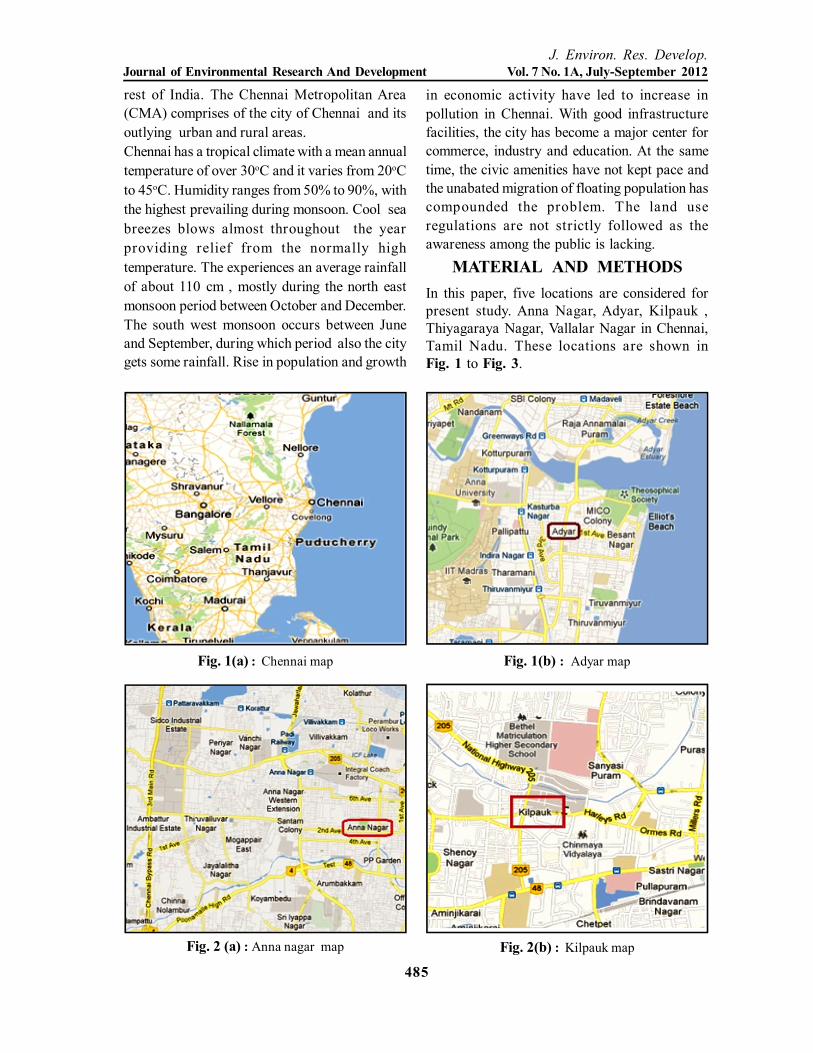
MATERIAL AND METHODSIn this paper, five locations are considered forpresent study. Anna Nagar, Adyar, Kilpauk ,Thiyagaraya Nagar, Vallalar Nagar in Chennai,Tamil Nadu. These locations are shown inFig. 1 to Fig. 3.
Fig. 1(a) : Chennai map Fig. 1(b) : Adyar map
J. Environ. Res. Develop.Journal of Environmental Research And Development Vol. 7 No. 1A, July-September 2012
486
Fig. 3(a) : Thiyagaraya nagar map Fig. 3(b) : Vallalar nagar map
Fuzzy logicThe fuzzy logic set was introduced in 1965 asmathematical way to represent linguisticvagueness(Zadeh)4. According to the fuzzy logicconcept, factors and criteria can be classifiedwithout certain limits. Fuzzy logic is very usefulfor addressing real-world problems, which usuallyinvolve a degree of uncertainty. Fuzzy logic usesvariables like low, medium and high in place, oftrue/false or yes/no variables. Fuzzy sets aredetermined by membership functions. Themembership function of a fuzzy set is expressedas SO2 and membership degree of its fuzzy set isdetermined as a number between 0 and 1.The structure of a fuzzy rule based system is thefuzzy algorithm the fundamental concepts of whichare derived is the fuzzy algorithm the fundamental
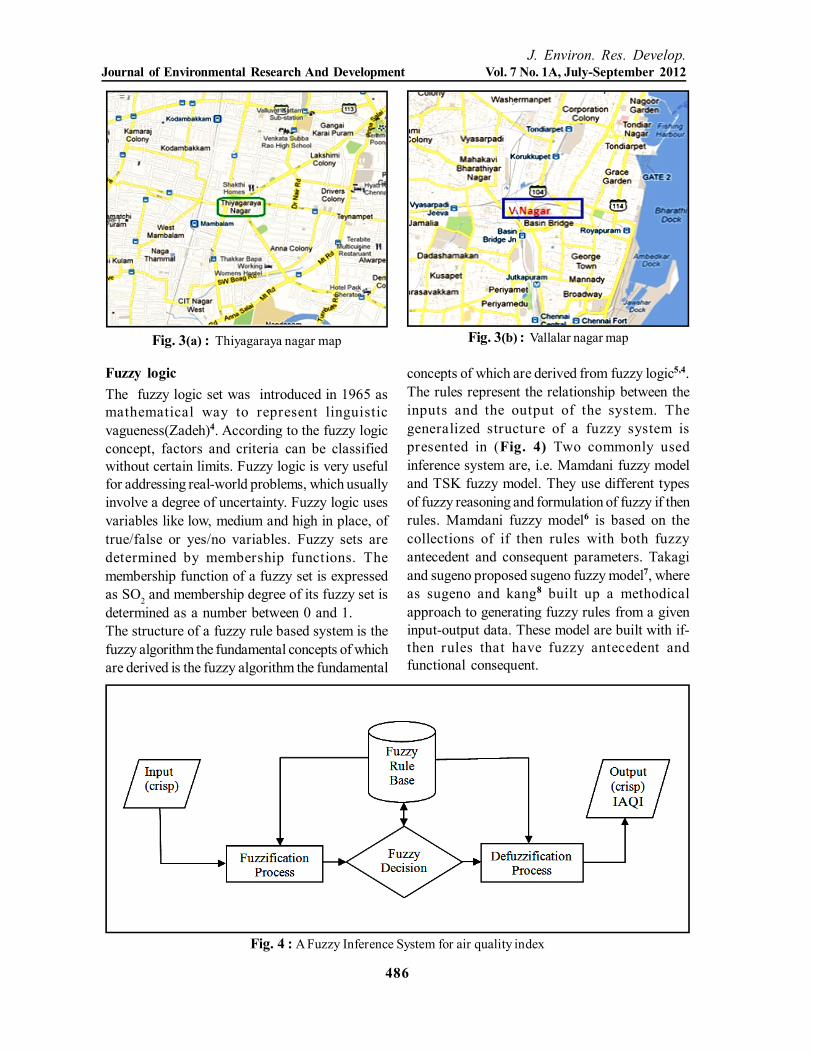
concepts of which are derived from fuzzy logic5,4.The rules represent the relationship between theinputs and the output of the system. Thegeneralized structure of a fuzzy system ispresented in (Fig. 4) Two commonly usedinference system are, i.e. Mamdani fuzzy modeland TSK fuzzy model. They use different typesof fuzzy reasoning and formulation of fuzzy if thenrules. Mamdani fuzzy model6 is based on thecollections of if then rules with both fuzzyantecedent and consequent parameters. Takagiand sugeno proposed sugeno fuzzy model7, whereas sugeno and kang8 built up a methodicalapproach to generating fuzzy rules from a giveninput-output data. These model are built with if-then rules that have fuzzy antecedent andfunctional consequent.
Fig. 4 : A Fuzzy Inference System for air quality index
487
J. Environ. Res. Develop.Journal of Environmental Research And Development Vol. 7 No. 1A, July-September 2012
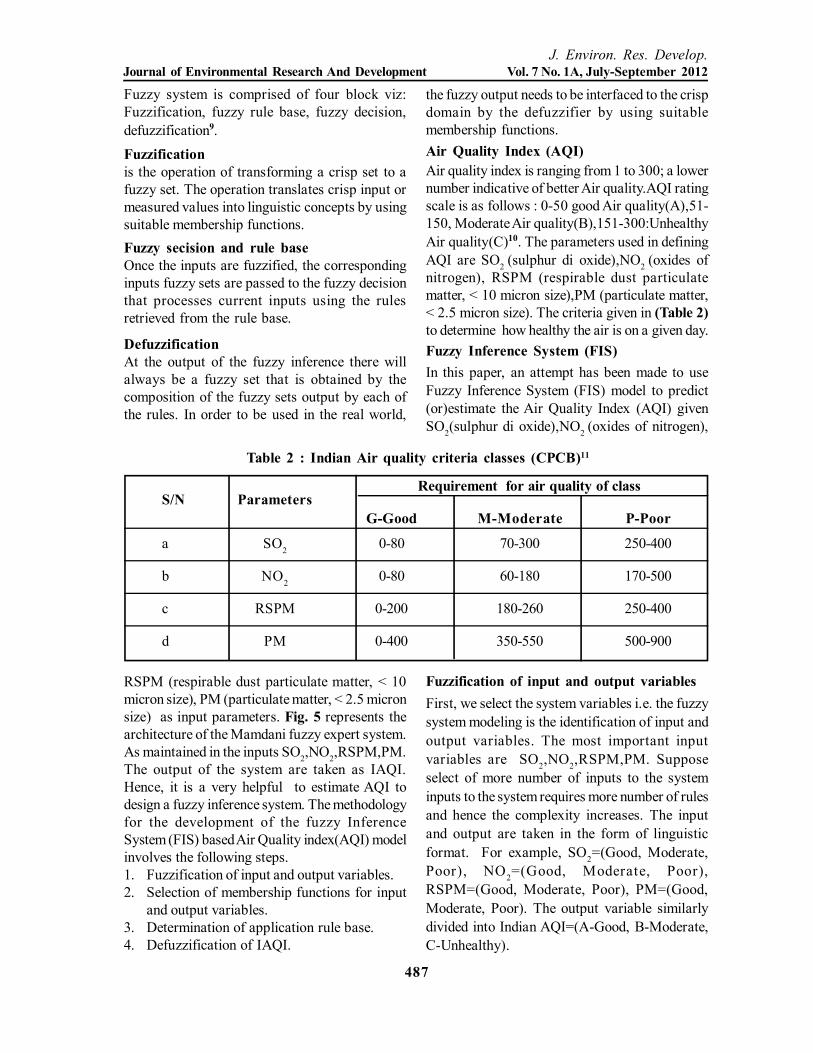
Table 2 : Indian Air quality criteria classes (CPCB)11
Requirement for air quality of classS/N Parameters
G-Good M-Moderate P-Poor
a SO2 0-80 70-300 250-400
b NO2 0-80 60-180 170-500
c RSPM 0-200 180-260 250-400
d PM 0-400 350-550 500-900
Fuzzy system is comprised of four block viz:Fuzzification, fuzzy rule base, fuzzy decision,defuzzification9.Fuzzificationis the operation of transforming a crisp set to afuzzy set. The operation translates crisp input ormeasured values into linguistic concepts by usingsuitable membership functions.Fuzzy secision and rule baseOnce the inputs are fuzzified, the correspondinginputs fuzzy sets are passed to the fuzzy decisionthat processes current inputs using the rulesretrieved from the rule base.
DefuzzificationAt the output of the fuzzy inference there willalways be a fuzzy set that is obtained by thecomposition of the fuzzy sets output by each ofthe rules. In order to be used in the real world,
the fuzzy output needs to be interfaced to the crispdomain by the defuzzifier by using suitablemembership functions.Air Quality Index (AQI)Air quality index is ranging from 1 to 300; a lowernumber indicative of better Air quality.AQI ratingscale is as follows : 0-50 good Air quality(A),51-150, Moderate Air quality(B),151-300:UnhealthyAir quality(C)10. The parameters used in definingAQI are SO2 (sulphur di oxide),NO2 (oxides ofnitrogen), RSPM (respirable dust particulatematter, < 10 micron size),PM (particulate matter,< 2.5 micron size). The criteria given in (Table 2)to determine how healthy the air is on a given day.Fuzzy Inference System (FIS)In this paper, an attempt has been made to useFuzzy Inference System (FIS) model to predict(or)estimate the Air Quality Index (AQI) givenSO2(sulphur di oxide),NO2 (oxides of nitrogen),
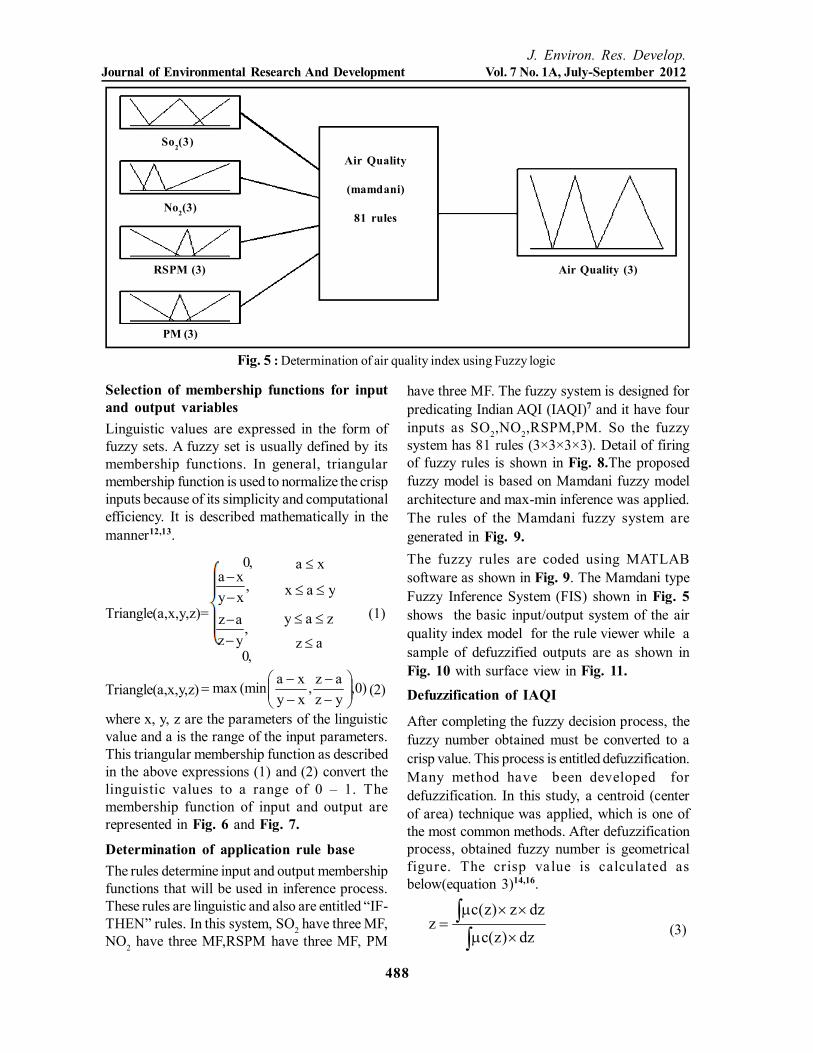
RSPM (respirable dust particulate matter, < 10micron size), PM (particulate matter, < 2.5 micronsize) as input parameters. Fig. 5 represents thearchitecture of the Mamdani fuzzy expert system.As maintained in the inputs SO2,NO2,RSPM,PM.The output of the system are taken as IAQI.Hence, it is a very helpful to estimate AQI todesign a fuzzy inference system. The methodologyfor the development of the fuzzy InferenceSystem (FIS) based Air Quality index(AQI) modelinvolves the following steps.1. Fuzzification of input and output variables.2. Selection of membership functions for input
and output variables.3. Determination of application rule base.4. Defuzzification of IAQI.
Fuzzification of input and output variablesFirst, we select the system variables i.e. the fuzzysystem modeling is the identification of input andoutput variables. The most important inputvariables are SO2,NO2,RSPM,PM. Supposeselect of more number of inputs to the systeminputs to the system requires more number of rulesand hence the complexity increases. The inputand output are taken in the form of linguisticformat. For example, SO2=(Good, Moderate,Poor), NO2=(Good, Moderate, Poor),RSPM=(Good, Moderate, Poor), PM=(Good,Moderate, Poor). The output variable similarlydivided into Indian AQI=(A-Good, B-Moderate,C-Unhealthy).
J. Environ. Res. Develop.Journal of Environmental Research And Development Vol. 7 No. 1A, July-September 2012
488
Fig. 5 : Determination of air quality index using Fuzzy logic
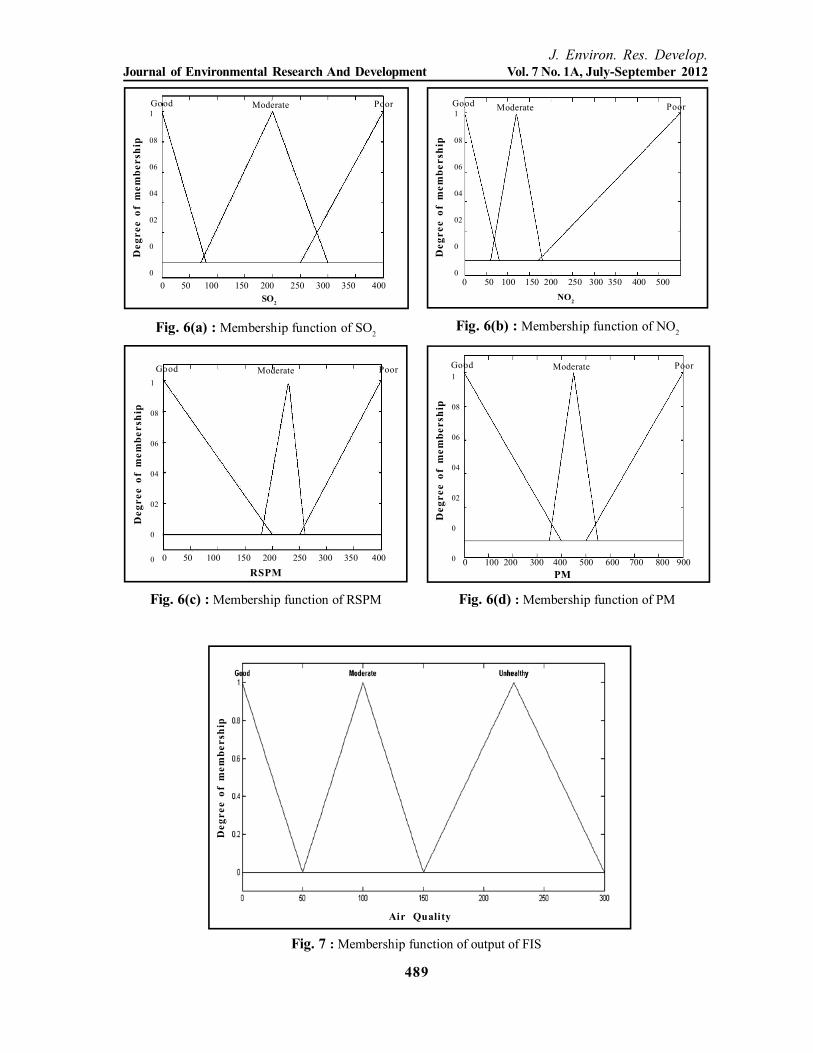
Selection of membership functions for inputand output variablesLinguistic values are expressed in the form offuzzy sets. A fuzzy set is usually defined by itsmembership functions. In general, triangularmembership function is used to normalize the crispinputs because of its simplicity and computationalefficiency. It is described mathematically in themanner12,13.
Triangle(a,x,y,z)= (1)
Triangle(a,x,y,z) )0,yzaz,
xyxa(minmax
(2)
where x, y, z are the parameters of the linguisticvalue and a is the range of the input parameters.This triangular membership function as describedin the above expressions (1) and (2) convert thelinguistic values to a range of 0 – 1. Themembership function of input and output arerepresented in Fig. 6 and Fig. 7.
Determination of application rule baseThe rules determine input and output membershipfunctions that will be used in inference process.These rules are linguistic and also are entitled “IF-THEN” rules. In this system, SO2 have three MF,NO2 have three MF,RSPM have three MF, PM
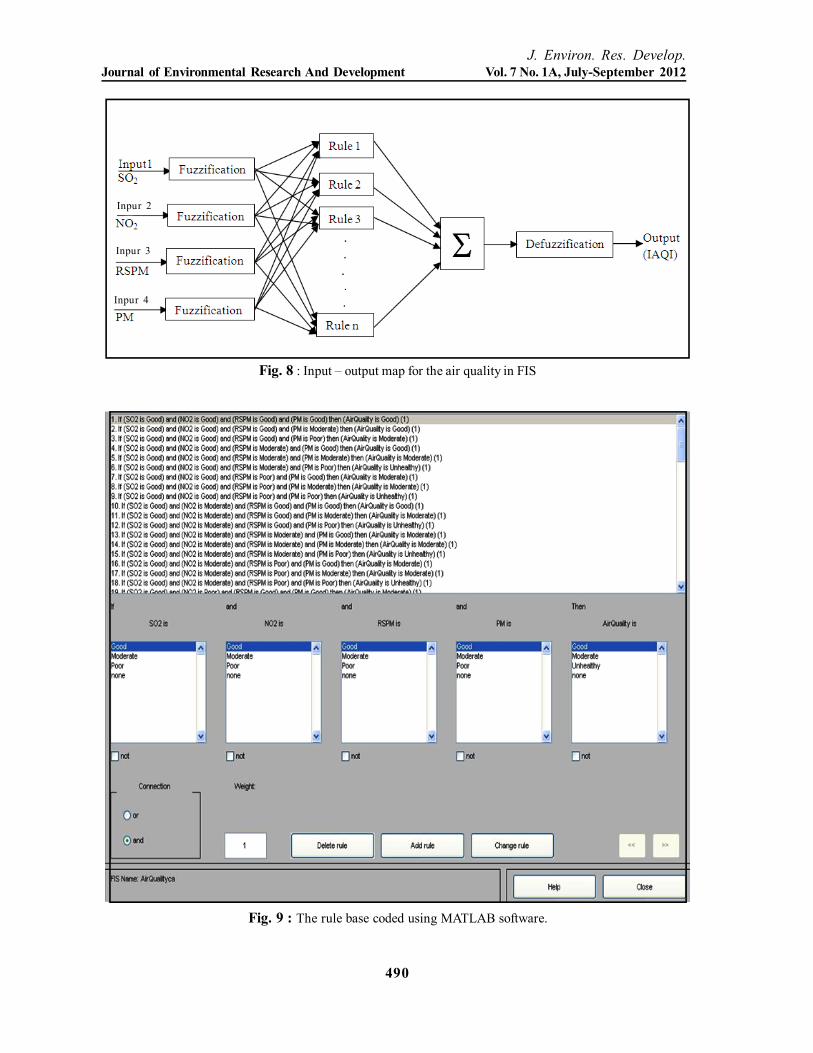
have three MF. The fuzzy system is designed forpredicating Indian AQI (IAQI)7 and it have fourinputs as SO2,NO2,RSPM,PM. So the fuzzysystem has 81 rules (3×3×3×3). Detail of firingof fuzzy rules is shown in Fig. 8.The proposedfuzzy model is based on Mamdani fuzzy modelarchitecture and max-min inference was applied.The rules of the Mamdani fuzzy system aregenerated in Fig. 9.The fuzzy rules are coded using MATLABsoftware as shown in Fig. 9. The Mamdani typeFuzzy Inference System (FIS) shown in Fig. 5shows the basic input/output system of the airquality index model for the rule viewer while asample of defuzzified outputs are as shown inFig. 10 with surface view in Fig. 11.Defuzzification of IAQI
After completing the fuzzy decision process, thefuzzy number obtained must be converted to acrisp value. This process is entitled defuzzification.Many method have been developed fordefuzzification. In this study, a centroid (centerof area) technique was applied, which is one ofthe most common methods. After defuzzificationprocess, obtained fuzzy number is geometricalfigure. The crisp value is calculated asbelow(equation 3)14,16.
dz)z(c
dzz)z(cz (3)
So2(3)
No2(3)
RSPM (3)
PM (3)
Air Quality
(mamdani)
81 rules
Air Quality (3)
,xyxa
,yzaz
0,
0,
xa
yax
zay
az
489
J. Environ. Res. Develop.Journal of Environmental Research And Development Vol. 7 No. 1A, July-September 2012
Fig. 7 : Membership function of output of FIS
Fig. 6(d) : Membership function of PM
PM
Deg
ree
of m
embe
rshi
p
Deg
ree
of m
embe
rshi
p
Air Quality
Fig. 6(b) : Membership function of NO2
Fig. 6(c) : Membership function of RSPM
Deg
ree
of m
embe
rshi
p
RSPM
Deg
ree
of m
embe
rshi
p
Fig. 6(a) : Membership function of SO2
Deg
ree
of m
embe
rshi
p
Good Moderate Poor1
08
06
04
02
0
00 50 100 150 200 250 300 350 400
SO2
1
08
06
04
02
0
00 50 100 150 200 250 300 350 400 500
Good Moderate Poor
NO2
1
08
06
04
02
0
0 0 50 100 150 200 250 300 350 400
1
08
06
04
02
0
0
Good Moderate Poor Good Moderate Poor
0 100 200 300 400 500 600 700 800 900
J. Environ. Res. Develop.Journal of Environmental Research And Development Vol. 7 No. 1A, July-September 2012
490
Fig. 9 : The rule base coded using MATLAB software.
Fig. 8 : Input – output map for the air quality in FIS
Inpur 2
Inpur 3
Inpur 4
491
J. Environ. Res. Develop.Journal of Environmental Research And Development Vol. 7 No. 1A, July-September 2012
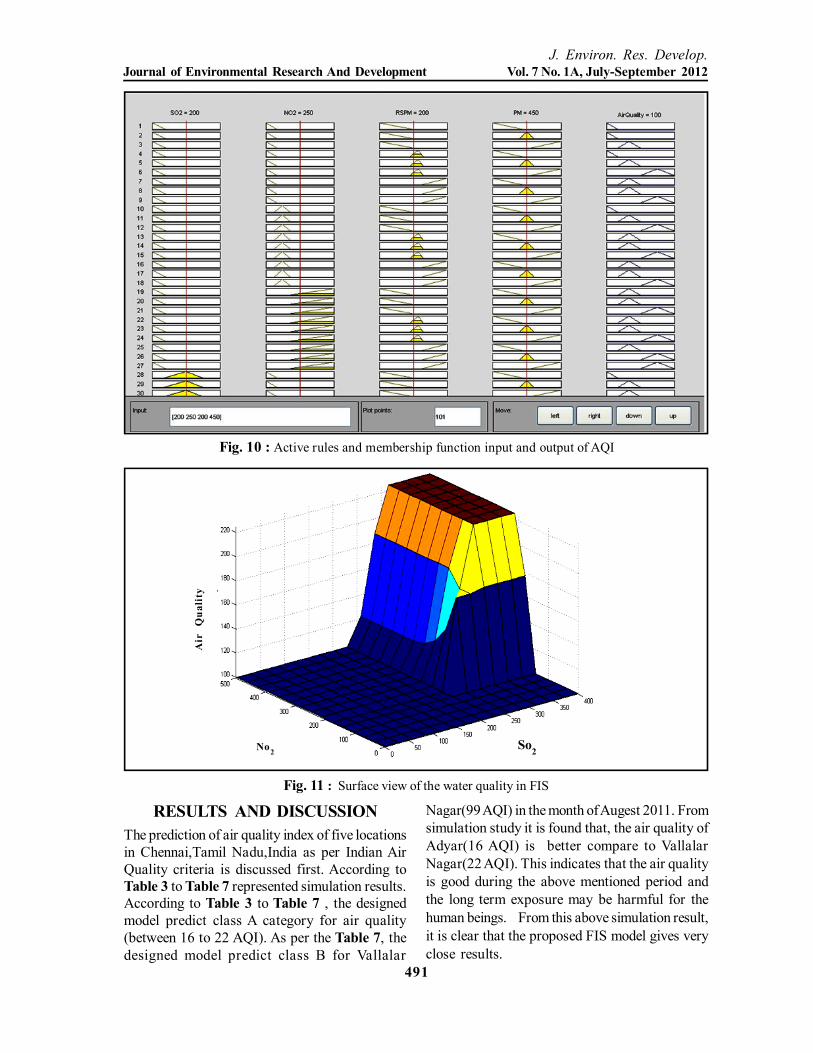
Fig. 10 : Active rules and membership function input and output of AQI
RESULTS AND DISCUSSIONThe prediction of air quality index of five locationsin Chennai,Tamil Nadu,India as per Indian AirQuality criteria is discussed first. According toTable 3 to Table 7 represented simulation results.According to Table 3 to Table 7 , the designedmodel predict class A category for air quality(between 16 to 22 AQI). As per the Table 7, thedesigned model predict class B for Vallalar
Nagar(99 AQI) in the month of Augest 2011. Fromsimulation study it is found that, the air quality ofAdyar(16 AQI) is better compare to VallalarNagar(22 AQI). This indicates that the air qualityis good during the above mentioned period andthe long term exposure may be harmful for thehuman beings. From this above simulation result,it is clear that the proposed FIS model gives veryclose results.
Fig. 11 : Surface view of the water quality in FIS
Air
Qua
lity
No2So2
J. Environ. Res. Develop.Journal of Environmental Research And Development Vol. 7 No. 1A, July-September 2012
492
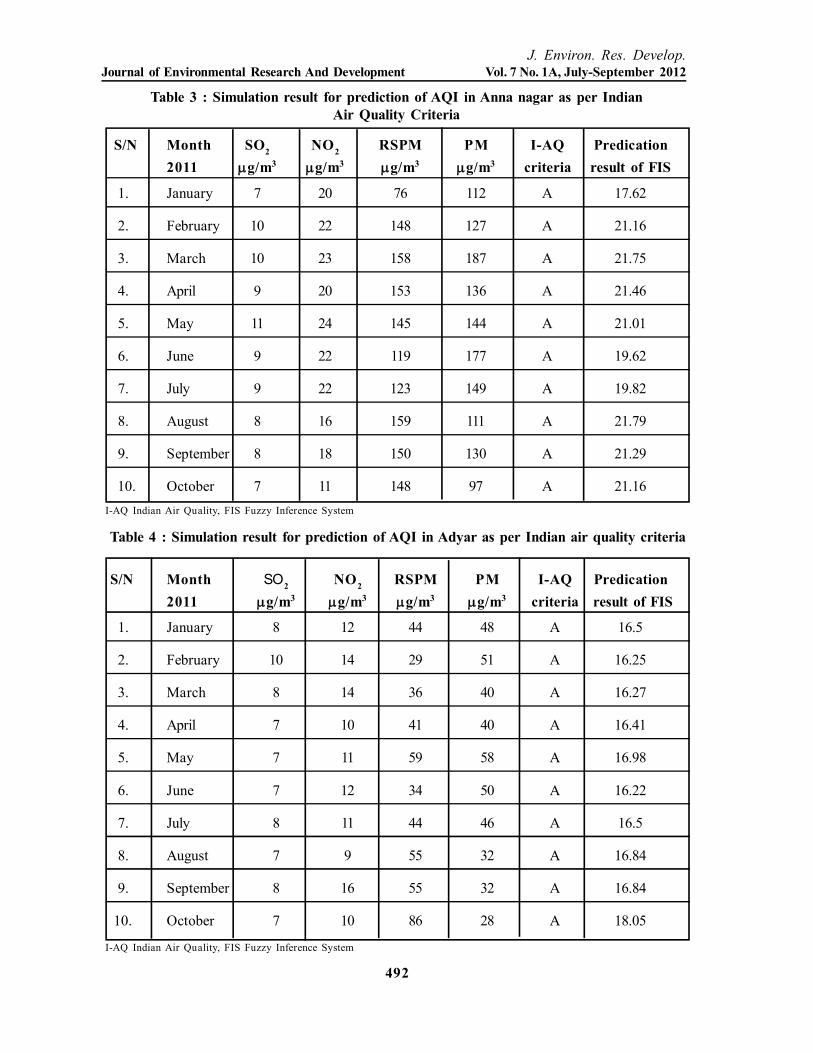
Table 3 : Simulation result for prediction of AQI in Anna nagar as per IndianAir Quality Criteria
S/N Month SO2 NO2 RSPM PM I-AQ Predication2011 g/m3 g/m3 g/m3 g/m3 criteria result of FIS
1. January 8 12 44 48 A 16.5
2. February 10 14 29 51 A 16.25
3. March 8 14 36 40 A 16.27
4. April 7 10 41 40 A 16.41
5. May 7 11 59 58 A 16.98
6. June 7 12 34 50 A 16.22
7. July 8 11 44 46 A 16.5
8. August 7 9 55 32 A 16.84
9. September 8 16 55 32 A 16.84
10. October 7 10 86 28 A 18.05
Table 4 : Simulation result for prediction of AQI in Adyar as per Indian air quality criteria
S/N Month SO2 NO2 RSPM PM I-AQ Predication2011 g/m3 g/m3 g/m3 g/m3 criteria result of FIS
1. January 7 20 76 112 A 17.62
2. February 10 22 148 127 A 21.16
3. March 10 23 158 187 A 21.75
4. April 9 20 153 136 A 21.46
5. May 11 24 145 144 A 21.01
6. June 9 22 119 177 A 19.62
7. July 9 22 123 149 A 19.82
8. August 8 16 159 111 A 21.79
9. September 8 18 150 130 A 21.29
10. October 7 11 148 97 A 21.16I-AQ Indian Air Quality, FIS Fuzzy Inference System
I-AQ Indian Air Quality, FIS Fuzzy Inference System
493
J. Environ. Res. Develop.Journal of Environmental Research And Development Vol. 7 No. 1A, July-September 2012
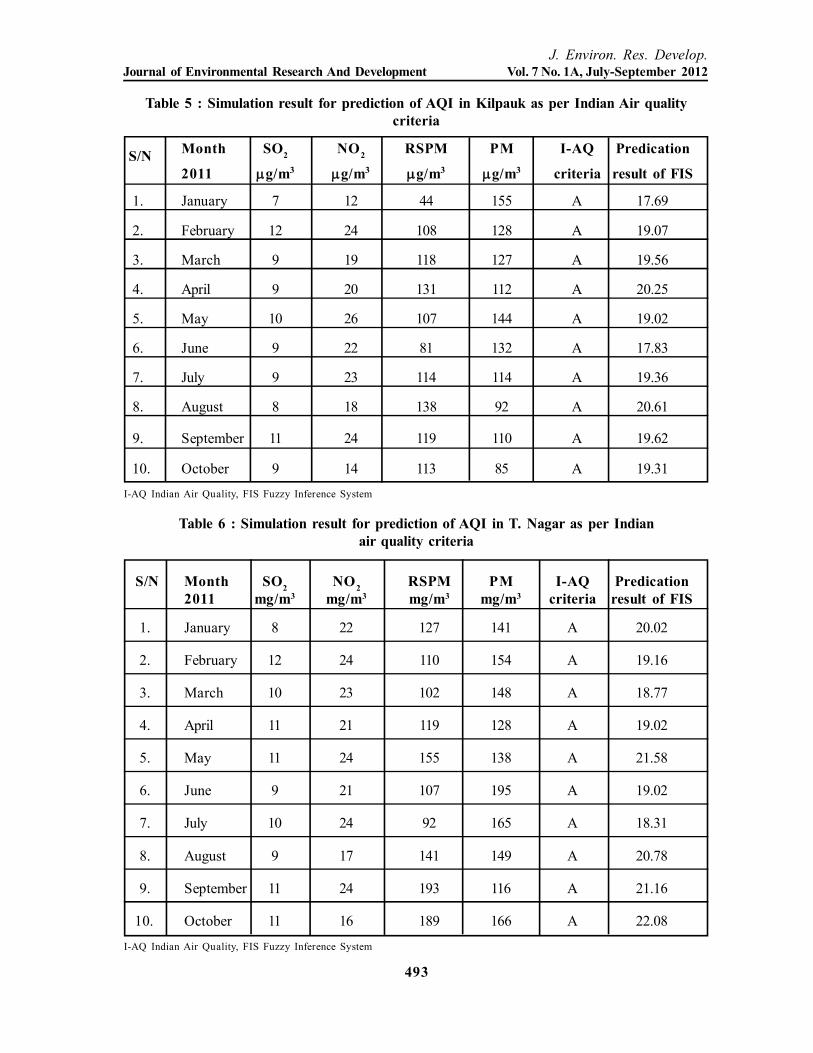
Table 5 : Simulation result for prediction of AQI in Kilpauk as per Indian Air qualitycriteria
S/N Month SO2 NO2 RSPM PM I-AQ Predication2011 mg/m3 mg/m3 mg/m3 mg/m3 criteria result of FIS
1. January 8 22 127 141 A 20.02
2. February 12 24 110 154 A 19.16
3. March 10 23 102 148 A 18.77
4. April 11 21 119 128 A 19.02
5. May 11 24 155 138 A 21.58
6. June 9 21 107 195 A 19.02
7. July 10 24 92 165 A 18.31
8. August 9 17 141 149 A 20.78
9. September 11 24 193 116 A 21.16
10. October 11 16 189 166 A 22.08
Table 6 : Simulation result for prediction of AQI in T. Nagar as per Indianair quality criteria
S/N Month SO2 NO2 RSPM PM I-AQ Predication
2011 g/m3 g/m3 g/m3 g/m3 criteria result of FIS
1. January 7 12 44 155 A 17.69
2. February 12 24 108 128 A 19.07
3. March 9 19 118 127 A 19.56
4. April 9 20 131 112 A 20.25
5. May 10 26 107 144 A 19.02
6. June 9 22 81 132 A 17.83
7. July 9 23 114 114 A 19.36
8. August 8 18 138 92 A 20.61
9. September 11 24 119 110 A 19.62
10. October 9 14 113 85 A 19.31I-AQ Indian Air Quality, FIS Fuzzy Inference System
I-AQ Indian Air Quality, FIS Fuzzy Inference System
J. Environ. Res. Develop.Journal of Environmental Research And Development Vol. 7 No. 1A, July-September 2012
494
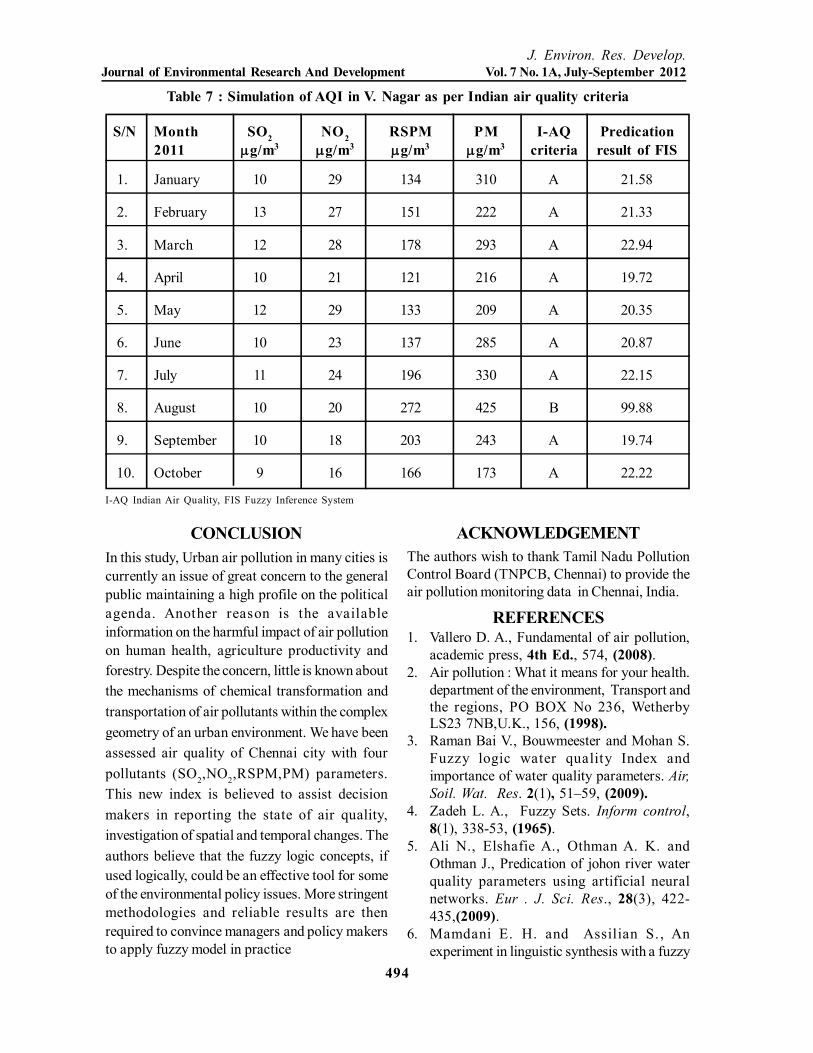
S/N Month SO2 NO2 RSPM PM I-AQ Predication2011 g/m3 g/m3 g/m3 g/m3 criteria result of FIS
1. January 10 29 134 310 A 21.58
2. February 13 27 151 222 A 21.33
3. March 12 28 178 293 A 22.94
4. April 10 21 121 216 A 19.72
5. May 12 29 133 209 A 20.35
6. June 10 23 137 285 A 20.87
7. July 11 24 196 330 A 22.15
8. August 10 20 272 425 B 99.88
9. September 10 18 203 243 A 19.74
10. October 9 16 166 173 A 22.22
CONCLUSIONIn this study, Urban air pollution in many cities iscurrently an issue of great concern to the generalpublic maintaining a high profile on the politicalagenda. Another reason is the availableinformation on the harmful impact of air pollutionon human health, agriculture productivity andforestry. Despite the concern, little is known aboutthe mechanisms of chemical transformation andtransportation of air pollutants within the complexgeometry of an urban environment. We have beenassessed air quality of Chennai city with fourpollutants (SO2,NO2,RSPM,PM) parameters.This new index is believed to assist decisionmakers in reporting the state of air quality,investigation of spatial and temporal changes. Theauthors believe that the fuzzy logic concepts, ifused logically, could be an effective tool for someof the environmental policy issues. More stringentmethodologies and reliable results are thenrequired to convince managers and policy makersto apply fuzzy model in practice
ACKNOWLEDGEMENTThe authors wish to thank Tamil Nadu PollutionControl Board (TNPCB, Chennai) to provide theair pollution monitoring data in Chennai, India.
REFERENCES1. Vallero D. A., Fundamental of air pollution,
academic press, 4th Ed., 574, (2008).2. Air pollution : What it means for your health.
department of the environment, Transport andthe regions, PO BOX No 236, WetherbyLS23 7NB,U.K., 156, (1998).
3. Raman Bai V., Bouwmeester and Mohan S.Fuzzy logic water quality Index andimportance of water quality parameters. Air,Soil. Wat. Res. 2(1), 51–59, (2009).
4. Zadeh L. A., Fuzzy Sets. Inform control,8(1), 338-53, (1965).
5. Ali N., Elshafie A., Othman A. K. andOthman J., Predication of johon river waterquality parameters using artificial neuralnetworks. Eur . J. Sci. Res., 28(3), 422-435,(2009).
6. Mamdani E. H. and Assilian S. , Anexperiment in linguistic synthesis with a fuzzy
Table 7 : Simulation of AQI in V. Nagar as per Indian air quality criteria
I-AQ Indian Air Quality, FIS Fuzzy Inference System

495
J. Environ. Res. Develop.Journal of Environmental Research And Development Vol. 7 No. 1A, July-September 2012
logic controller, Int. J. Man-mach stud.7(1),1-13, (1975).
7. Takagi T. and Sugeno M. ,Fuzzy identificationof systems and its application to modeling andControl. IEEE Trans. Syst. Man. cybernet;15(1), 116-32,(1985).
8. Sugeno M. and Kang G.T., Structureidentification of fuzzy model, Fuzzy sets. Syst.28(1),15-33, (1988).
9. Cox E.A., Fuzzy Fundamentals IEEESpectrum, 19(10), 58-61(1992).
10. http://home.iitk.ac.in/~mukesh/air-quality/BASIS.html (2011).
11. http://www.cpcb.nic.in12. Jang J. S. R., Sun C. T. and Mizutan E.,
Neuro-fuzzy and soft computing. New Delhi;Prentice, Hall of India Private Limited, 360,(2005).
13. Mahapatra S.S., Nanda S. K. and PanigrahyK., A cascaded fuzzy inference system forIndian river water quality prediction, Advancesin engineering software, Elsevier, 42(1),787-796, (2011).
14. Nandusekar P.P., Wagchaure V.M. andMahajan Y.S., Measurement of Ambient AirQuality (AAQ) at ISPAT industries ltd.,J. Environ. Res. Develop. 3(3), 773-781,(2009).
15. Ray Soni A.U. and Li Wen W., Health impactsof traffic related air pollution, J. Environ. Res.Develop. 4(2), 421-429, (2009).
16. Balashanmugan P., Ramanathan A.R., ElangoE. and Nehrukumar V., Study of ambient airquality of Chidambaram, Tamilnadu, India, J.Environ. Res. Develop., 6(2), 365-371,(2009).
This fight against drilling in the Arctic Refuge is a fight about our principles. It’sabout standing up for our environment, our families and our future, and I won’t giveup this fight.
Senator John Kerry