Embed Size (px)
Citation preview
8/3/2019 10-11 PS7 SARC pub 11-12
http://slidepdf.com/reader/full/10-11-ps7-sarc-pub-11-12 1/13
Executive SummarySchool Accountability Report Card2010–11
For St. HOPE Public School 7 (PS7)
Address: 5201 Strawberry Ln., Sacramento, CA, 95820-4815 Phone: (916) 649-7850
Principal:Principal Audria Johnson (k-5th grade)
Principal Kristin Coates (6-8th grade)Grade Span: K-8
This executive summary of the School Accountability Report Card (SARC) is intended to provide parents and community memberswith a quick snapshot of information related to individual public schools. Most data presented in this report are reported for the2010–11 school year. School finances and school completion data are reported for the 2009–10 school year. Contact information,facilities, curriculum and instructional materials, and select teacher data are reported for the 2011–12 school year. For additionalinformation about the school, parents and community members should review the entire SARC or contact the school principal or thedistrict office.
About This SchoolPublic School 7 (PS7) is a K-8, modified year-round charter school committed to providing students the skills and trainingnecessary to become contributing members of their school, family, and community. PS7 is a learning environment where students,faculty and parents embrace a standard of excellence in academic achievement, ethics, and citizenship. Students participate in acollege preparatory program with low student-teacher ratios during an extended instructional schedule.
Our ultimate goal is to graduate self-motivated, industrious, critically-thinking students who are passionate about learning andcommitted to service. PS7 students will be well-prepared for high school, higher education, employment and acceptance of theirrights and responsibilities as citizens in a democratic society.
PS7 is a public charter school founded on 5 pillars:
High Expectations
Choice and Commitment
More Time
Focus on Results
Student EnrollmentGroup Enrollment
Number of students 440
Black or African American 81.4%
American Indian or Alaska Native 0.5%
Asian 1.8%
Filipino 0.9%
Hispanic or Latino 10.7%
Native Hawaiian or Pacific Islander 0.0%
White 2.7%
Two or More Races 2.0%
Socioeconomically Disadvantaged 71.8%
English Learners 4.5%
Students w ith Disabilities 4.3%
Student Performance
SubjectStudents Proficient
and Above on STAR*Program Results
English-Language Arts 77%
Mathematics 86%
Science 90%
History-Social Science 70%
*Standardized Testing and Reporting Program assessments
used for accountability purposes include the California
Standards Tests, the California Modified Assessment, and the
California Alternate Performance Assessment
8/3/2019 10-11 PS7 SARC pub 11-12
http://slidepdf.com/reader/full/10-11-ps7-sarc-pub-11-12 2/13
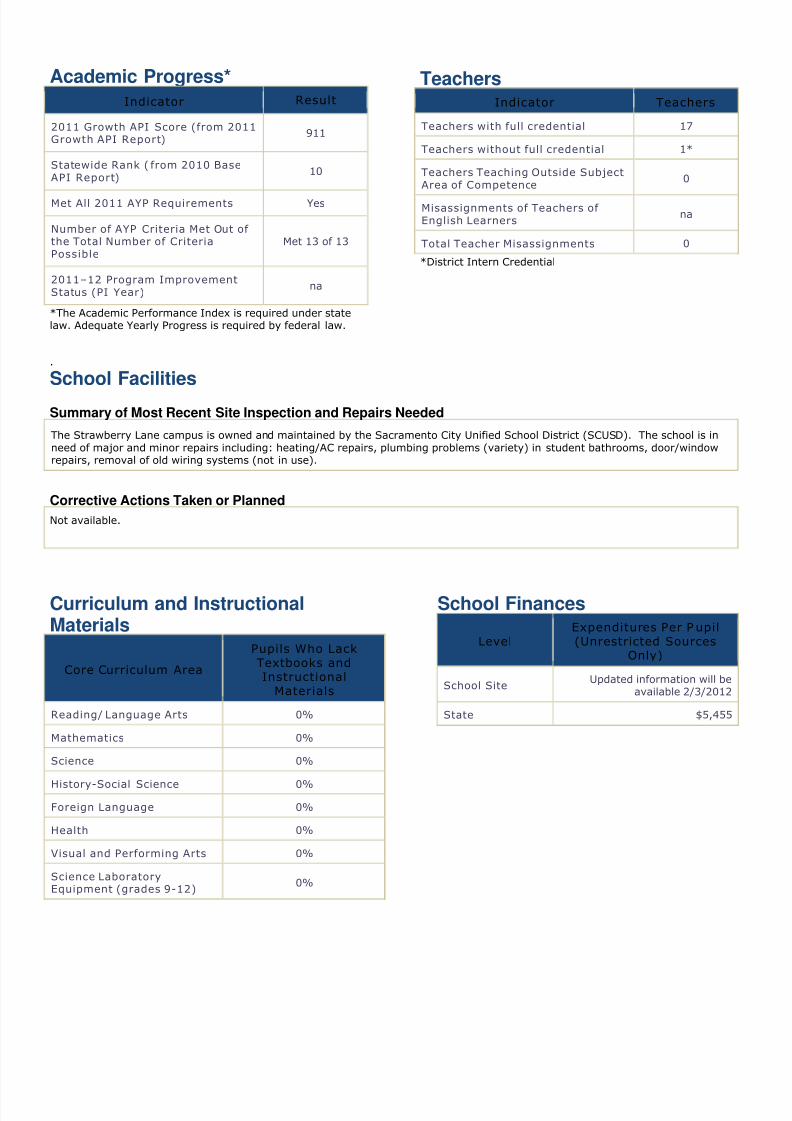
Academic Progress*
Indicator Result
2011 Growth API Score (from 2011Growth API Report)
911
Statewide Rank ( from 2010 BaseAPI Report)
10
Met All 2011 AYP Requirements Yes
Number of AYP Criteria Met Out of the Total Number of CriteriaPossible
Met 13 of 13
2011–12 Program ImprovementStatus (PI Year)
na
*The Academic Performance Index is required under statelaw. Adequate Yearly Progress is required by federal law.
TeachersIndicator Teachers
Teachers with full credential 17
Teachers without full credential 1*
Teachers Teaching Outside SubjectArea of Competence
0
Misassignments of Teachers of English Learners
na
Total Teacher Misassignments 0
*District Intern Credential
.
School Facilities
Summary of Most Recent Site Inspection and Repairs Needed
The Strawberry Lane campus is owned and maintained by the Sacramento City Unified School District (SCUSD). The school is inneed of major and minor repairs including: heating/AC repairs, plumbing problems (variety) in student bathrooms, door/windowrepairs, removal of old wiring systems (not in use).
Corrective Actions Taken or Planned
Not available.
Curriculum and InstructionalMaterials
Core Curriculum Area
Pupils Who LackTextbooks andInstructional
Materials
Reading/ Language Arts 0%
Mathematics 0%
Science 0%
History-Social Science 0%
Foreign Language 0%
Health 0%
Visual and Performing Arts 0%
Science LaboratoryEquipment (grades 9-12)
0%
School Finances
LevelExpenditures Per P upil(Unrestricted Sources
Only)
School SiteUpdated information will be
available 2/3/2012
State $5,455
8/3/2019 10-11 PS7 SARC pub 11-12
http://slidepdf.com/reader/full/10-11-ps7-sarc-pub-11-12 3/13
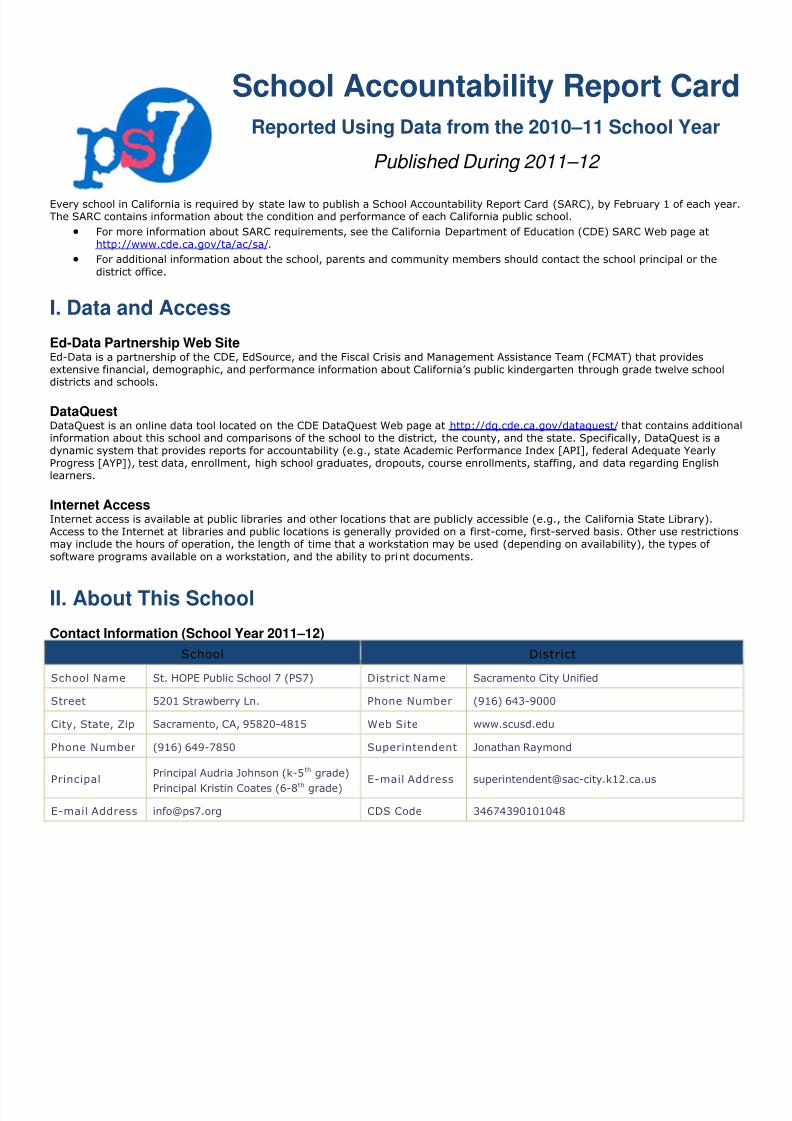
School Accountability Report CardReported Using Data from the 2010–11 School Year
Published During 2011–12
Every school in California is required by state law to publish a School Accountability Report Card (SARC), by February 1 of each year.The SARC contains information about the condition and performance of each California public school.
For more information about SARC requirements, see the California Department of Education (CDE) SARC Web page athttp://www.cde.ca.gov/ta/ac/sa/.
For additional information about the school, parents and community members should contact the school principal or thedistrict office.
I. Data and Access
Ed-Data Partnership Web SiteEd-Data is a partnership of the CDE, EdSource, and the Fiscal Crisis and Management Assistance Team (FCMAT) that providesextensive financial, demographic, and performance information about California’s public kindergarten through grade twelve schooldistricts and schools.
DataQuestDataQuest is an online data tool located on the CDE DataQuest Web page at http://dq.cde.ca.gov/dataquest/ that contains additionainformation about this school and comparisons of the school to the district, the county, and the state. Specifically, DataQuest is adynamic system that provides reports for accountability (e.g., state Academic Performance Index [API], federal Adequate YearlyProgress [AYP]), test data, enrollment, high school graduates, dropouts, course enrollments, staffing, and data regarding Englishlearners.
Internet AccessInternet access is available at public libraries and other locations that are publicly accessible (e.g., the California State Library).Access to the Internet at libraries and public locations is generally provided on a first-come, first-served basis. Other use restrictionsmay include the hours of operation, the length of time that a workstation may be used (depending on availability), the types of software programs available on a workstation, and the ability to print documents.
II. About This School
Contact Information (School Year 2011–12)
School District
School Name St. HOPE Public School 7 (PS7) District Name Sacramento City Unified
Street 5201 Strawberry Ln. Phone Number (916) 643-9000
City, State, Zip Sacramento, CA, 95820-4815 Web Site www.scusd.edu
Phone Number (916) 649-7850 Superintendent Jonathan Raymond
PrincipalPrincipal Audria Johnson (k-5th grade)
Principal Kristin Coates (6-8th grade)E-mail Address [email protected]
E-mail Address [email protected] CDS Code 34674390101048
8/3/2019 10-11 PS7 SARC pub 11-12
http://slidepdf.com/reader/full/10-11-ps7-sarc-pub-11-12 4/13
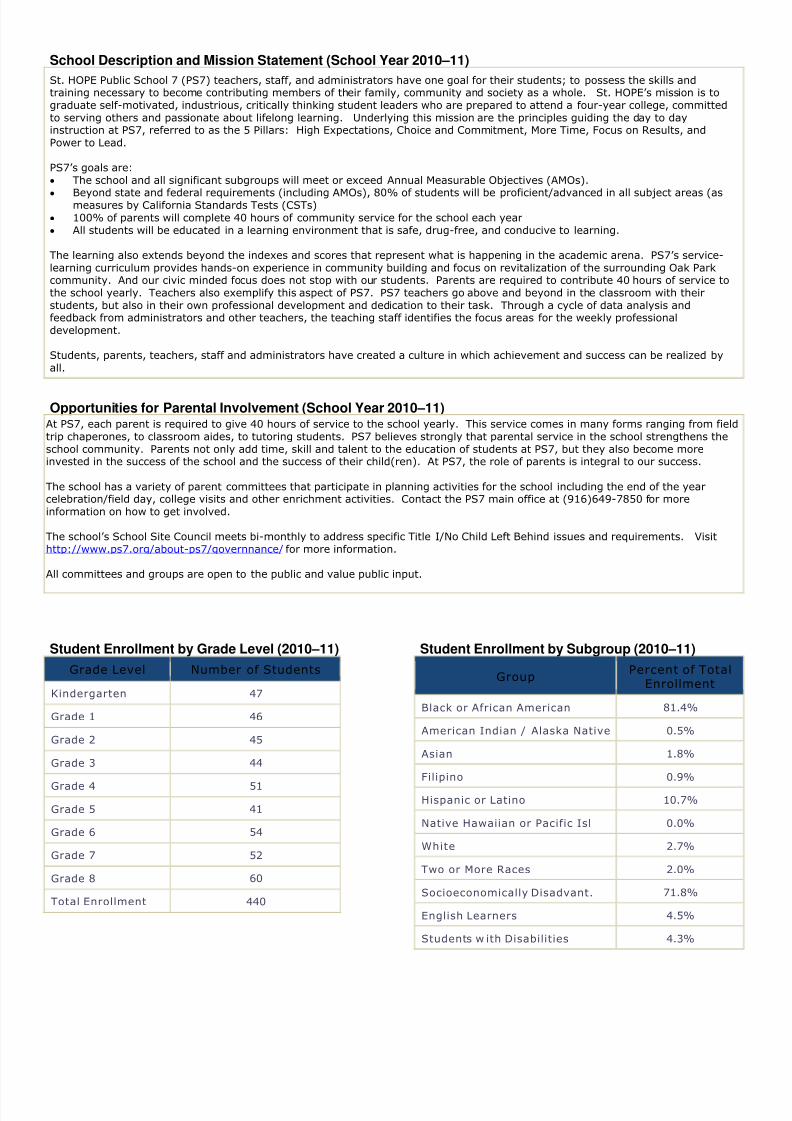
School Description and Mission Statement (School Year 2010–11)
St. HOPE Public School 7 (PS7) teachers, staff, and administrators have one goal for their students; to possess the skills andtraining necessary to become contributing members of their family, community and society as a whole. St. HOPE’s mission is tograduate self-motivated, industrious, critically thinking student leaders who are prepared to attend a four-year college, committedto serving others and passionate about lifelong learning. Underlying this mission are the principles guiding the day to dayinstruction at PS7, referred to as the 5 Pillars: High Expectations, Choice and Commitment, More Time, Focus on Results, andPower to Lead.
PS7’s goals are: The school and all significant subgroups will meet or exceed Annual Measurable Objectives (AMOs).
Beyond state and federal requirements (including AMOs), 80% of students will be proficient/advanced in all subject areas (asmeasures by California Standards Tests (CSTs) 100% of parents will complete 40 hours of community service for the school each year All students will be educated in a learning environment that is safe, drug-free, and conducive to learning.
The learning also extends beyond the indexes and scores that represent what is happening in the academic arena. PS7’s service-learning curriculum provides hands-on experience in community building and focus on revitalization of the surrounding Oak Parkcommunity. And our civic minded focus does not stop with our students. Parents are required to contribute 40 hours of service tothe school yearly. Teachers also exemplify this aspect of PS7. PS7 teachers go above and beyond in the classroom with theirstudents, but also in their own professional development and dedication to their task. Through a cycle of data analysis andfeedback from administrators and other teachers, the teaching staff identifies the focus areas for the weekly professionaldevelopment.
Students, parents, teachers, staff and administrators have created a culture in which achievement and success can be realized byall.
Opportunities for Parental Involvement (School Year 2010–11)At PS7, each parent is required to give 40 hours of service to the school yearly. This service comes in many forms ranging from fieldtrip chaperones, to classroom aides, to tutoring students. PS7 believes strongly that parental service in the school strengthens theschool community. Parents not only add time, skill and talent to the education of students at PS7, but they also become moreinvested in the success of the school and the success of their child(ren). At PS7, the role of parents is integral to our success.
The school has a variety of parent committees that participate in planning activities for the school including the end of the yearcelebration/field day, college visits and other enrichment activities. Contact the PS7 main office at (916)649-7850 for moreinformation on how to get involved.
The school’s School Site Council meets bi-monthly to address specific Title I/No Child Left Behind issues and requirements. Visithttp://www.ps7.org/about-ps7/governnance/ for more information.
All committees and groups are open to the public and value public input.
Student Enrollment by Grade Level (2010–11)
Grade Level Number of Students
Kindergarten 47
Grade 1 46
Grade 2 45
Grade 3 44
Grade 4 51
Grade 5 41
Grade 6 54
Grade 7 52
Grade 8 60
Total Enrollment 440
Student Enrollment by Subgroup (2010–11)
GroupPercent of Total
Enrollment
Black or African American 81.4%
American Indian / Alaska Native 0.5%
Asian 1.8%
Filipino 0.9%
Hispanic or Latino 10.7%
Native Hawaiian or Pacific Isl 0.0%
White 2.7%
Two or More Races 2.0%
Socioeconomically Disadvant. 71.8%
English Learners 4.5%
Students w ith Disabilities 4.3%
8/3/2019 10-11 PS7 SARC pub 11-12
http://slidepdf.com/reader/full/10-11-ps7-sarc-pub-11-12 5/13
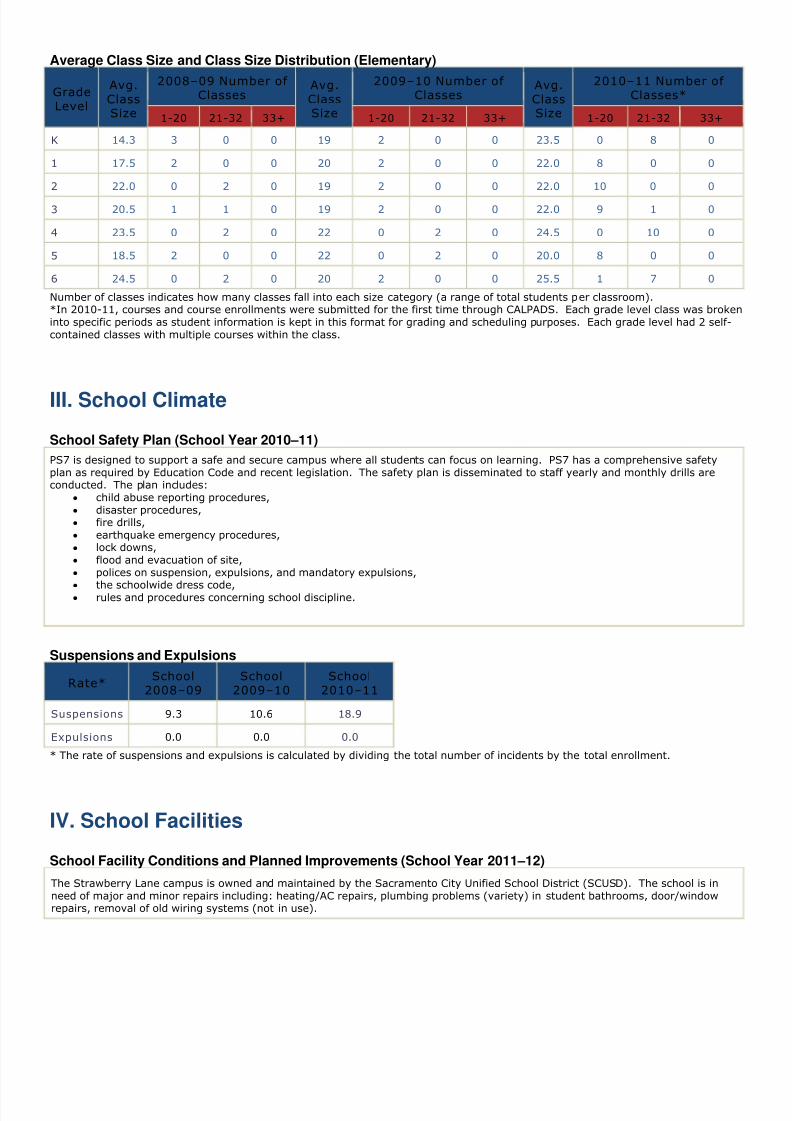
Average Class Size and Class Size Distribution (Elementary)
GradeLevel
Avg.ClassSize
2008–09 Number of Classes
Avg.ClassSize
2009–10 Number of Classes
Avg.ClassSize
2010–11 Number of Classes*
1-20 21-32 33+ 1-20 21-32 33+ 1-20 21-32 33+
K 14.3 3 0 0 19 2 0 0 23.5 0 8 0
1 17.5 2 0 0 20 2 0 0 22.0 8 0 0
2 22.0 0 2 0 19 2 0 0 22.0 10 0 0
3 20.5 1 1 0 19 2 0 0 22.0 9 1 0
4 23.5 0 2 0 22 0 2 0 24.5 0 10 0
5 18.5 2 0 0 22 0 2 0 20.0 8 0 0
6 24.5 0 2 0 20 2 0 0 25.5 1 7 0
Number of classes indicates how many classes fall into each size category (a range of total students per classroom).*In 2010-11, courses and course enrollments were submitted for the first time through CALPADS. Each grade level class was brokeninto specific periods as student information is kept in this format for grading and scheduling purposes. Each grade level had 2 self-contained classes with multiple courses within the class.
III. School Climate
School Safety Plan (School Year 2010–11)
PS7 is designed to support a safe and secure campus where all students can focus on learning. PS7 has a comprehensive safetyplan as required by Education Code and recent legislation. The safety plan is disseminated to staff yearly and monthly drills areconducted. The plan includes:
child abuse reporting procedures, disaster procedures, fire drills, earthquake emergency procedures, lock downs, flood and evacuation of site, polices on suspension, expulsions, and mandatory expulsions,
the schoolwide dress code, rules and procedures concerning school discipline.
Suspensions and Expulsions
Rate*School
2008–09School
2009–10School
2010–11
Suspensions 9.3 10.6 18.9
Expulsions 0.0 0.0 0.0
* The rate of suspensions and expulsions is calculated by dividing the total number of incidents by the total enrollment.
IV. School Facilities
School Facility Conditions and Planned Improvements (School Year 2011–12)
The Strawberry Lane campus is owned and maintained by the Sacramento City Unified School District (SCUSD). The school is inneed of major and minor repairs including: heating/AC repairs, plumbing problems (variety) in student bathrooms, door/windowrepairs, removal of old wiring systems (not in use).
8/3/2019 10-11 PS7 SARC pub 11-12
http://slidepdf.com/reader/full/10-11-ps7-sarc-pub-11-12 6/13
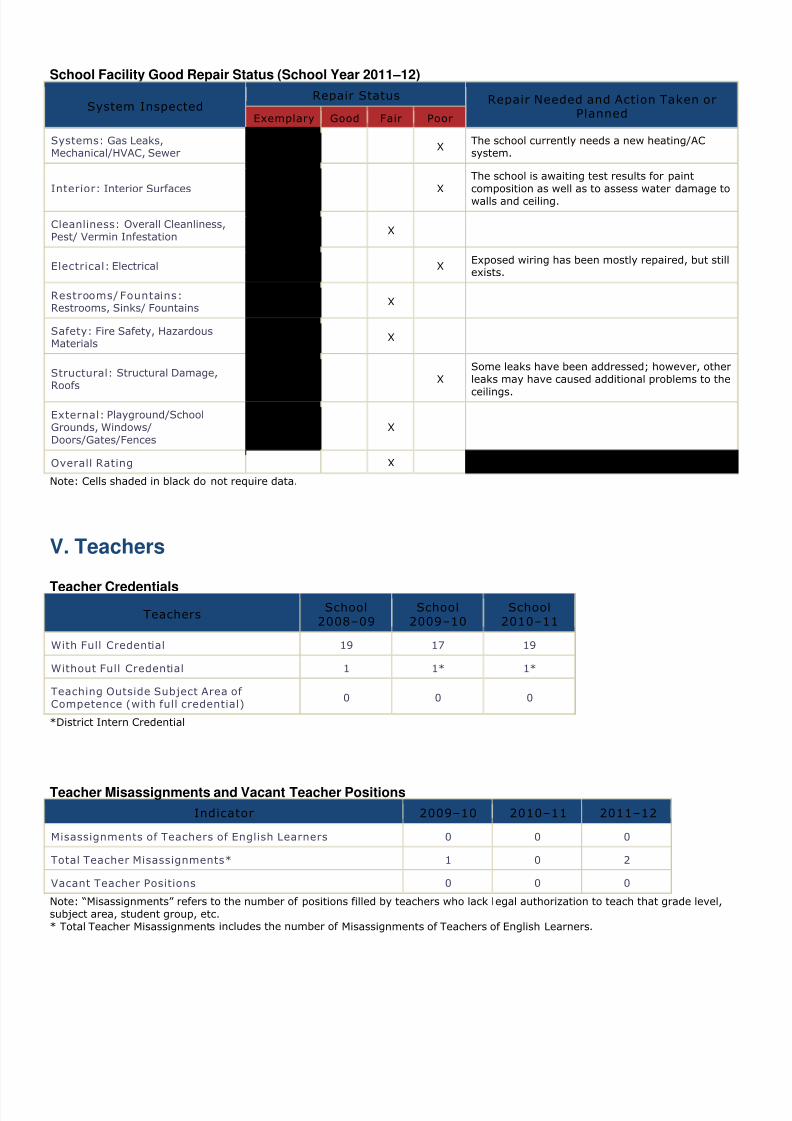
School Facility Good Repair Status (School Year 2011–12)
System InspectedRepair Status Repair Needed and Action Taken or
PlannedExemplary Good Fair Poor
Systems: Gas Leaks,Mechanical/HVAC, Sewer
XThe school currently needs a new heating/ACsystem.
Interior: Interior Surfaces XThe school is awaiting test results for paintcomposition as well as to assess water damage towalls and ceiling.
Cleanliness: Overall Cleanliness,Pest/ Vermin Infestation
X
Electrical: Electrical XExposed wiring has been mostly repaired, but stillexists.
Restrooms/ Fountains:Restrooms, Sinks/ Fountains
X
Safety: Fire Safety, HazardousMaterials
X
Structural: Structural Damage,Roofs
XSome leaks have been addressed; however, otherleaks may have caused additional problems to the
ceilings.
External: Playground/SchoolGrounds, Windows/Doors/Gates/Fences
X
Overall Rating X
Note: Cells shaded in black do not require data.
V. Teachers
Teacher Credentials
TeachersSchool
2008–09School
2009–10School
2010–11
With Full Credential 19 17 19
Without Full Credential 1 1* 1*
Teaching Outside Subject Area of Competence (with full credential)
0 0 0
*District Intern Credential
Teacher Misassignments and Vacant Teacher Positions
Indicator 2009–10 2010–11 2011–12
Misassignments of Teachers of English Learners 0 0 0
Total Teacher Misassignments* 1 0 2
Vacant Teacher Positions 0 0 0
Note: “Misassignments” refers to the number of positions filled by teachers who lack legal authorization to teach that grade level,subject area, student group, etc.* Total Teacher Misassignments includes the number of Misassignments of Teachers of English Learners.
8/3/2019 10-11 PS7 SARC pub 11-12
http://slidepdf.com/reader/full/10-11-ps7-sarc-pub-11-12 7/13
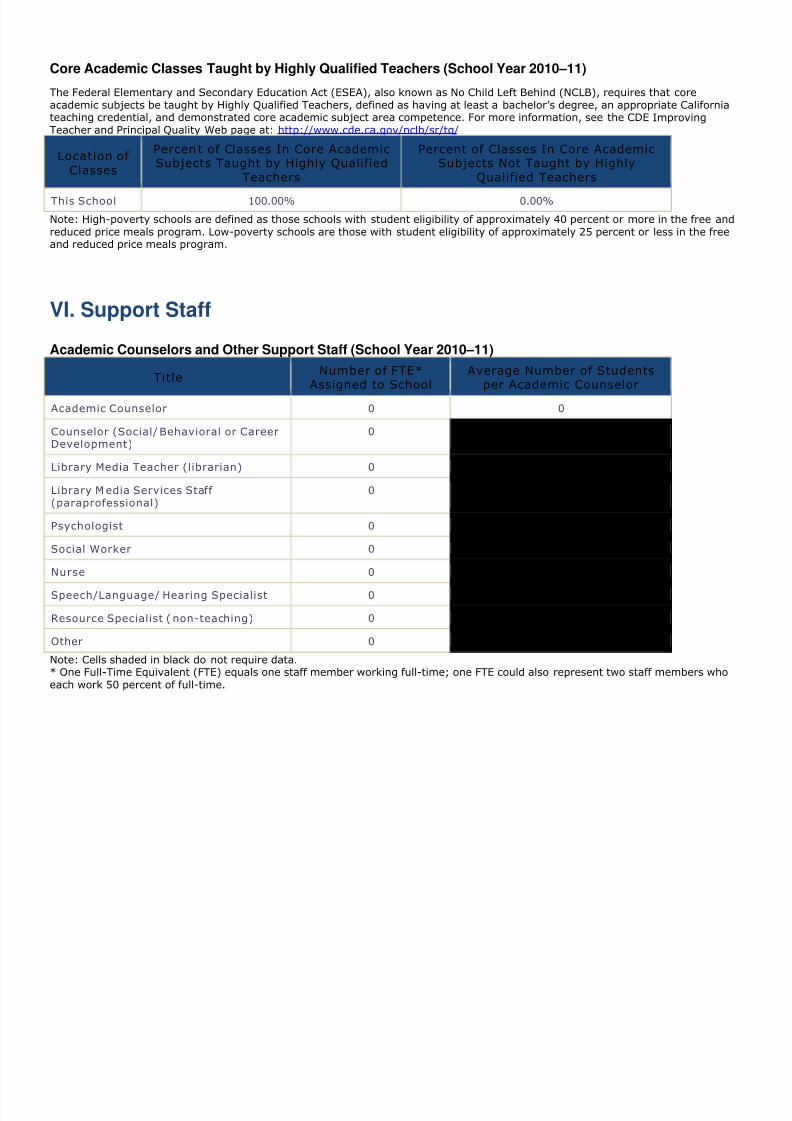
Core Academic Classes Taught by Highly Qualified Teachers (School Year 2010–11)
The Federal Elementary and Secondary Education Act (ESEA), also known as No Child Left Behind (NCLB), requires that coreacademic subjects be taught by Highly Qualified Teachers, defined as having at least a bachelor’s degree, an appropriate Californiateaching credential, and demonstrated core academic subject area competence. For more information, see the CDE ImprovingTeacher and Principal Quality Web page at: http://www.cde.ca.gov/nclb/sr/tq/
Location of Classes
Percent of Classes In Core AcademicSubjects Taught by Highly Qualified
Teachers
Percent of Classes In Core AcademicSubjects Not Taught by Highly
Qualified Teachers
This School 100.00% 0.00%
Note: High-poverty schools are defined as those schools with student eligibility of approximately 40 percent or more in the free andreduced price meals program. Low-poverty schools are those with student eligibility of approximately 25 percent or less in the freeand reduced price meals program.
VI. Support Staff
Academic Counselors and Other Support Staff (School Year 2010–11)
TitleNumber of FTE*
Assigned to SchoolAverage Number of Students
per Academic Counselor
Academic Counselor 0 0 Counselor (Social/ Behavioral or CareerDevelopment)
0
Library Media Teacher (librarian) 0
Library Media Services Staff (paraprofessional)
0
Psychologist 0
Social Worker 0
Nurse 0
Speech/Language/ Hearing Specialist 0
Resource Specialist ( non-teaching) 0
Other 0
Note: Cells shaded in black do not require data.* One Full-Time Equivalent (FTE) equals one staff member working full-time; one FTE could also represent two staff members whoeach work 50 percent of full-time.
8/3/2019 10-11 PS7 SARC pub 11-12
http://slidepdf.com/reader/full/10-11-ps7-sarc-pub-11-12 8/13
VII. Curriculum and Instructional Materials
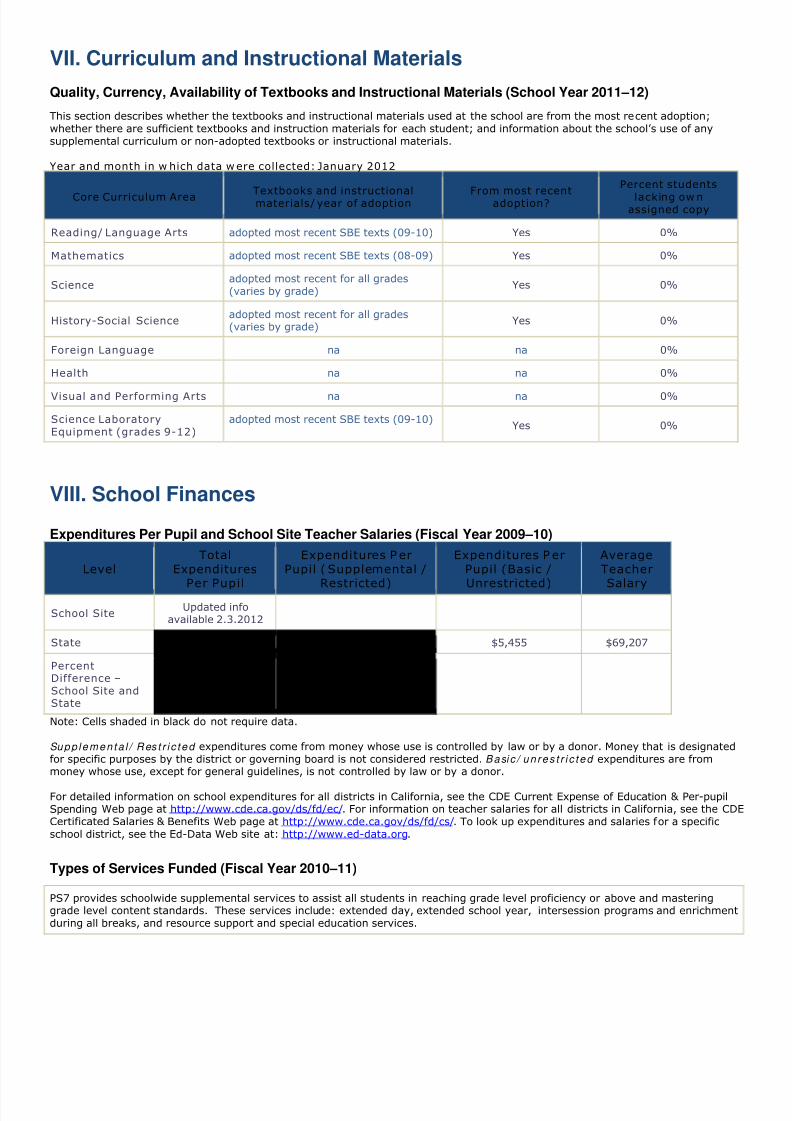
Quality, Currency, Availability of Textbooks and Instructional Materials (School Year 2011–12)
This section describes whether the textbooks and instructional materials used at the school are from the most recent adoption;whether there are sufficient textbooks and instruction materials for each student; and information about the school’s use of anysupplemental curriculum or non-adopted textbooks or instructional materials.
Year and month in w hich data were collected: January 2012
Core Curriculum Area Textbooks and instructionalmaterials/ year of adoption From most recentadoption?
Percent students
lacking ow nassigned copy
Reading/ Language Arts adopted most recent SBE texts (09-10) Yes 0%
Mathematics adopted most recent SBE texts (08-09) Yes 0%
Scienceadopted most recent for all grades(varies by grade)
Yes 0%
History-Social Scienceadopted most recent for all grades(varies by grade)
Yes 0%
Foreign Language na na 0%
Health na na 0%
Visual and Performing Arts na na 0%
Science LaboratoryEquipment (grades 9-12)
adopted most recent SBE texts (09-10)Yes 0%
VIII. School Finances
Expenditures Per Pupil and School Site Teacher Salaries (Fiscal Year 2009–10)
LevelTotal
Expenditures
Per Pupil
Expenditures P erPupil (Supplemental /
Restricted)
Expenditures P erPupil (Basic /
Unrestricted)
AverageTeacher
Salary
School SiteUpdated info
available 2.3.2012
State $5,455 $69,207
PercentDifference –School Site andState
Note: Cells shaded in black do not require data.
Supp lem en t a l / Res t r i c t ed expenditures come from money whose use is controlled by law or by a donor. Money that is designatedfor specific purposes by the district or governing board is not considered restricted. Basic / un res t r i c t ed expenditures are frommoney whose use, except for general guidelines, is not controlled by law or by a donor.
For detailed information on school expenditures for all districts in California, see the CDE Current Expense of Education & Per-pupilSpending Web page at http://www.cde.ca.gov/ds/fd/ec/. For information on teacher salaries for all districts in California, see the CDECertificated Salaries & Benefits Web page at http://www.cde.ca.gov/ds/fd/cs/. To look up expenditures and salaries for a specificschool district, see the Ed-Data Web site at: http://www.ed-data.org.
Types of Services Funded (Fiscal Year 2010–11)
PS7 provides schoolwide supplemental services to assist all students in reaching grade level proficiency or above and masteringgrade level content standards. These services include: extended day, extended school year, intersession programs and enrichmentduring all breaks, and resource support and special education services.
8/3/2019 10-11 PS7 SARC pub 11-12
http://slidepdf.com/reader/full/10-11-ps7-sarc-pub-11-12 9/13
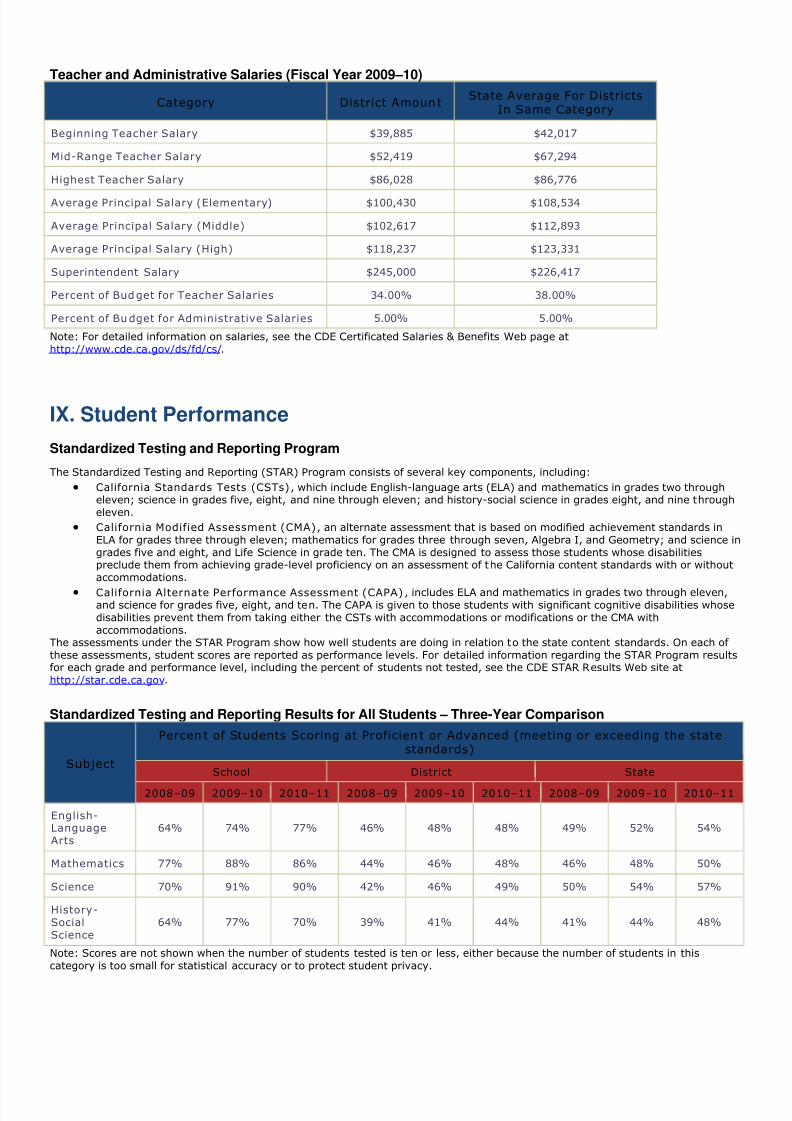
Teacher and Administrative Salaries (Fiscal Year 2009–10)
Category District AmountState Average For Districts
In Same Category
Beginning Teacher Salary $39,885 $42,017
Mid-Range Teacher Salary $52,419 $67,294
Highest Teacher Salary $86,028 $86,776
Average Principal Salary (Elementary) $100,430 $108,534
Average Principal Salary (Middle) $102,617 $112,893
Average Principal Salary (High) $118,237 $123,331
Superintendent Salary $245,000 $226,417
Percent of Budget for Teacher Salaries 34.00% 38.00%
Percent of Budget for Administrative Salaries 5.00% 5.00%
Note: For detailed information on salaries, see the CDE Certificated Salaries & Benefits Web page athttp://www.cde.ca.gov/ds/fd/cs/.
IX. Student Performance
Standardized Testing and Reporting Program
The Standardized Testing and Reporting (STAR) Program consists of several key components, including:
California Standards Tests (CSTs), which include English-language arts (ELA) and mathematics in grades two througheleven; science in grades five, eight, and nine through eleven; and history-social science in grades eight, and nine througheleven.
California Modified Assessment (CMA), an alternate assessment that is based on modified achievement standards inELA for grades three through eleven; mathematics for grades three through seven, Algebra I, and Geometry; and science ingrades five and eight, and Life Science in grade ten. The CMA is designed to assess those students whose disabilitiespreclude them from achieving grade-level proficiency on an assessment of the California content standards with or withoutaccommodations.
California Alternate Performance Assessment (CAPA), includes ELA and mathematics in grades two through eleven,and science for grades five, eight, and ten. The CAPA is given to those students with significant cognitive disabilities whosedisabilities prevent them from taking either the CSTs with accommodations or modifications or the CMA withaccommodations.
The assessments under the STAR Program show how well students are doing in relation to the state content standards. On each of these assessments, student scores are reported as performance levels. For detailed information regarding the STAR Program resultsfor each grade and performance level, including the percent of students not tested, see the CDE STAR Results Web site athttp://star.cde.ca.gov.
Standardized Testing and Reporting Results for All Students – Three-Year Comparison
Subject
Percent of Students Scoring at Proficien t or Advanced (meeting or exceeding the statestandards)
School District State
2008–09 2009–10 2010–11 2008–09 2009–10 2010–11 2008–09 2009–10 2010–11
English-LanguageArts
64% 74% 77% 46% 48% 48% 49% 52% 54%
Mathematics 77% 88% 86% 44% 46% 48% 46% 48% 50%
Science 70% 91% 90% 42% 46% 49% 50% 54% 57%
History-SocialScience
64% 77% 70% 39% 41% 44% 41% 44% 48%
Note: Scores are not shown when the number of students tested is ten or less, either because the number of students in thiscategory is too small for statistical accuracy or to protect student privacy.
8/3/2019 10-11 PS7 SARC pub 11-12
http://slidepdf.com/reader/full/10-11-ps7-sarc-pub-11-12 10/13
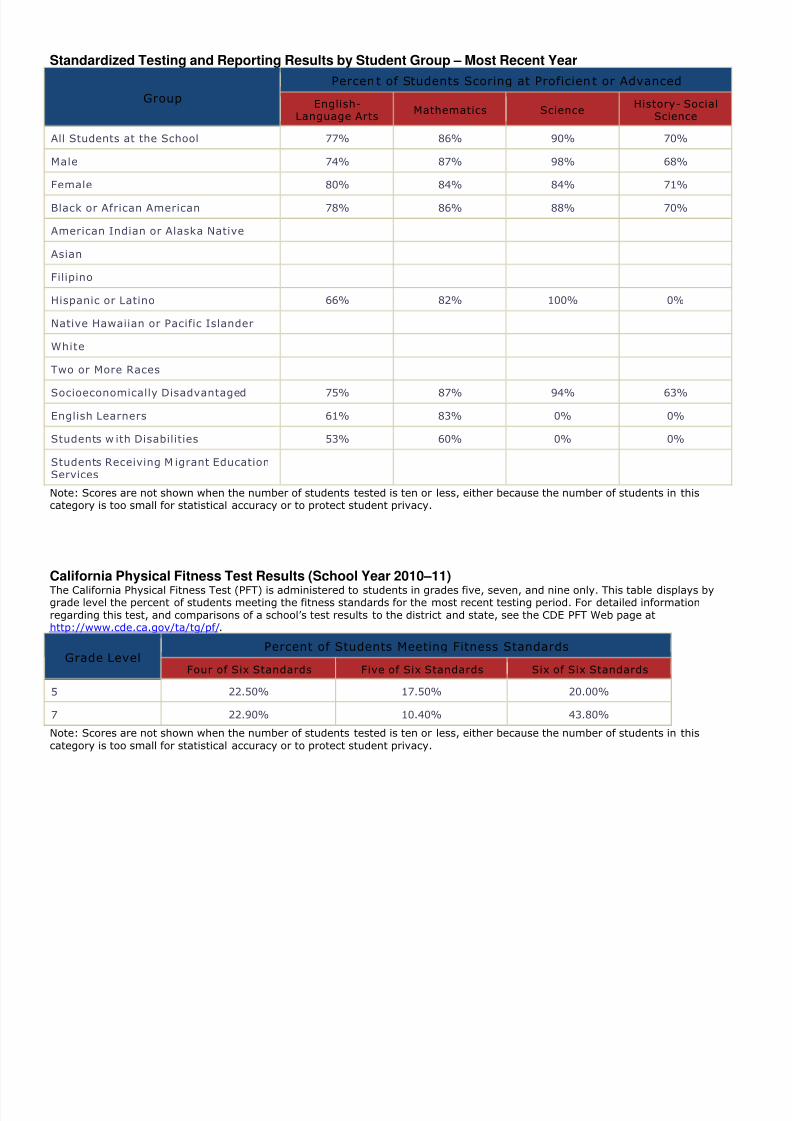
Standardized Testing and Reporting Results by Student Group – Most Recent Year
Group
Percent of Students Scoring at Proficien t or Advanced
English-Language Arts
Mathematics ScienceHistory- Social
Science
All Students at the School 77% 86% 90% 70%
Male 74% 87% 98% 68%
Female 80% 84% 84% 71%
Black or African American 78% 86% 88% 70%
American Indian or Alaska Native
Asian
Filipino
Hispanic or Latino 66% 82% 100% 0%
Native Hawaiian or Pacific Islander
White
Two or More Races
Socioeconomically Disadvantaged 75% 87% 94% 63%
English Learners 61% 83% 0% 0%
Students w ith Disabilities 53% 60% 0% 0%
Students Receiving M igrant EducationServices
Note: Scores are not shown when the number of students tested is ten or less, either because the number of students in thiscategory is too small for statistical accuracy or to protect student privacy.
California Physical Fitness Test Results (School Year 2010–11)
The California Physical Fitness Test (PFT) is administered to students in grades five, seven, and nine only. This table displays bygrade level the percent of students meeting the fitness standards for the most recent testing period. For detailed informationregarding this test, and comparisons of a school’s test results to the district and state, see the CDE PFT Web page athttp://www.cde.ca.gov/ta/tg/pf/.
Grade LevelPercent of Students Meeting Fitness Standards
Four of Six Standards Five of Six Standards Six of Six Standards
5 22.50% 17.50% 20.00%
7 22.90% 10.40% 43.80%
Note: Scores are not shown when the number of students tested is ten or less, either because the number of students in thiscategory is too small for statistical accuracy or to protect student privacy.
8/3/2019 10-11 PS7 SARC pub 11-12
http://slidepdf.com/reader/full/10-11-ps7-sarc-pub-11-12 11/13
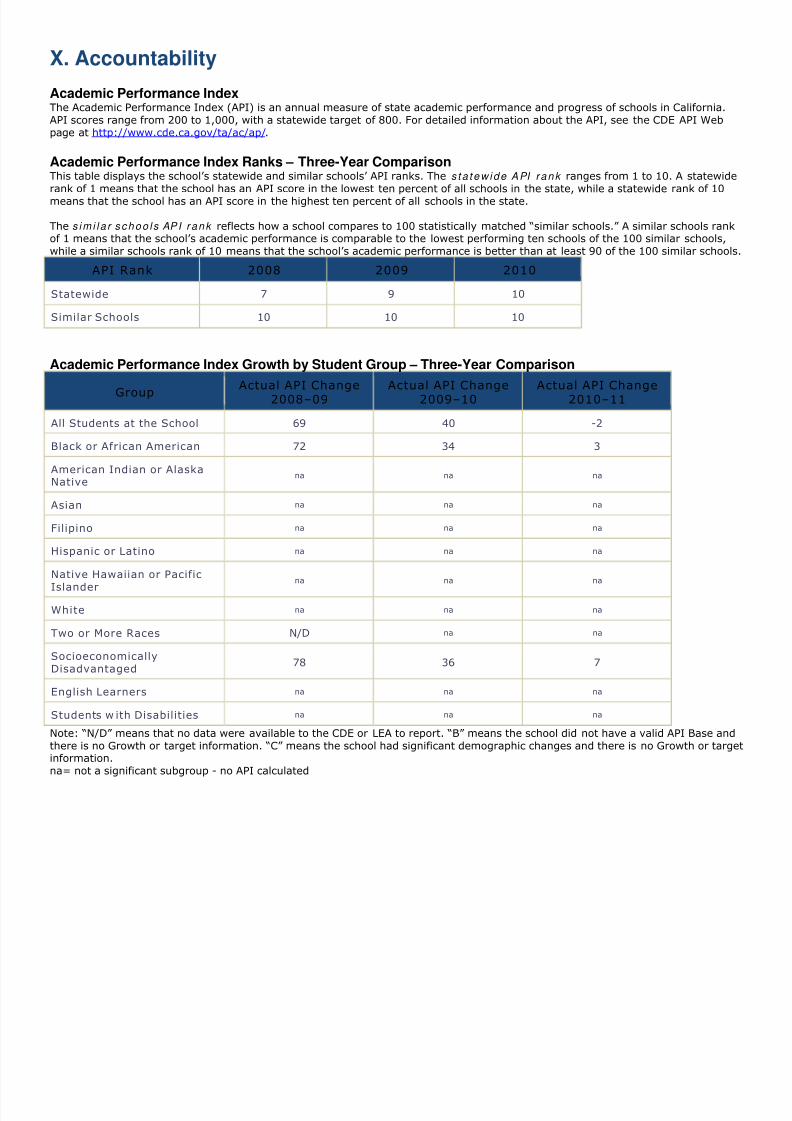
X. Accountability
Academic Performance IndexThe Academic Performance Index (API) is an annual measure of state academic performance and progress of schools in California.API scores range from 200 to 1,000, with a statewide target of 800. For detailed information about the API, see the CDE API Webpage at http://www.cde.ca.gov/ta/ac/ap/.
Academic Performance Index Ranks – Three-Year ComparisonThis table displays the school’s statewide and similar schools’ API ranks. The s t a t ew ide API r ank ranges from 1 to 10. A statewiderank of 1 means that the school has an API score in the lowest ten percent of all schools in the state, while a statewide rank of 10means that the school has an API score in the highest ten percent of all schools in the state.
The s im i l a r s choo ls AP I r ank reflects how a school compares to 100 statistically matched “similar schools.” A similar schools rankof 1 means that the school’s academic performance is comparable to the lowest performing ten schools of the 100 similar schools,while a similar schools rank of 10 means that the school’s academic performance is better than at least 90 of the 100 similar schools
API Rank 2008 2009 2010
Statewide 7 9 10
Similar Schools 10 10 10
Academic Performance Index Growth by Student Group – Three-Year Comparison
GroupActual API Change
2008–09Actual API Change
2009–10Actual API Change
2010–11
All Students at the School 69 40 -2
Black or African American 72 34 3
American Indian or AlaskaNative
na na na
Asian na na na
Filipino na na na
Hispanic or Latino na na na
Native Hawaiian or Pacific
Islander
na na na
White na na na
Two or More Races N/D na na
SocioeconomicallyDisadvantaged
78 36 7
English Learners na na na
Students w ith Disabilities na na na
Note: “N/D” means that no data were available to the CDE or LEA to report. “B” means the school did not have a valid API Base andthere is no Growth or target information. “C” means the school had significant demographic changes and there is no Growth or targeinformation.na= not a significant subgroup - no API calculated
8/3/2019 10-11 PS7 SARC pub 11-12
http://slidepdf.com/reader/full/10-11-ps7-sarc-pub-11-12 12/13
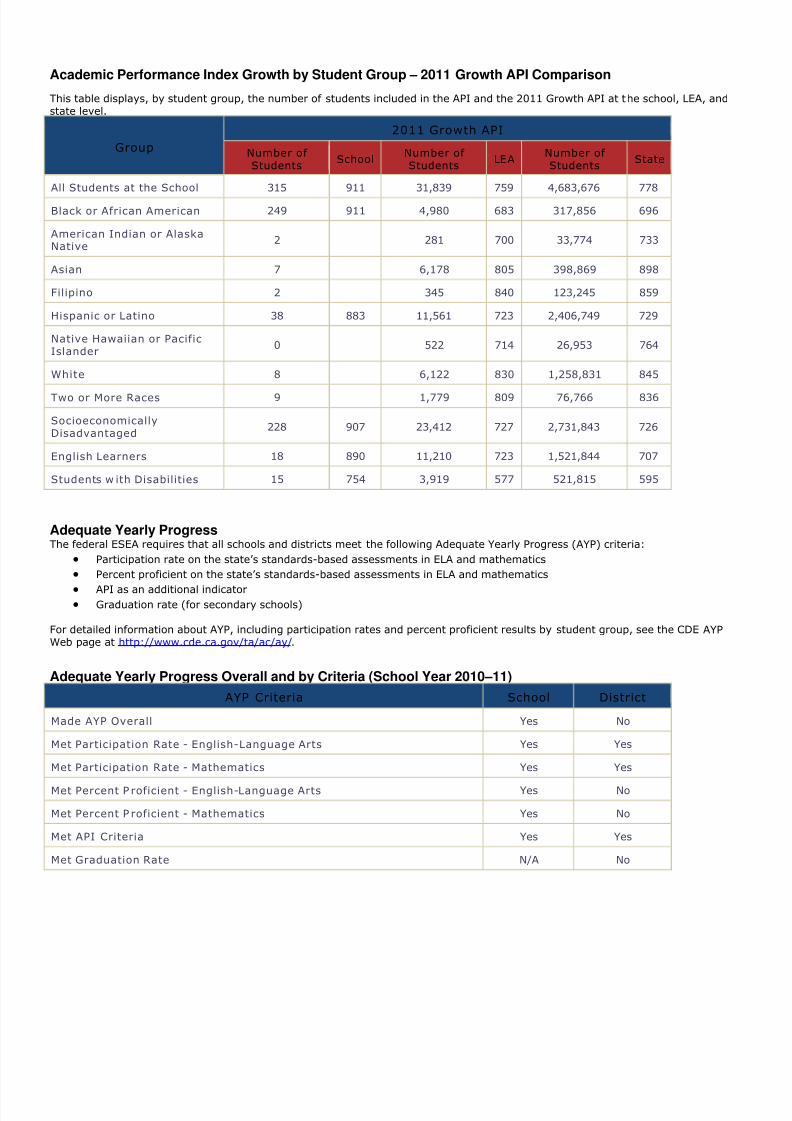
Academic Performance Index Growth by Student Group – 2011 Growth API Comparison
This table displays, by student group, the number of students included in the API and the 2011 Growth API at the school, LEA, andstate level.
Group
2011 Growth API
Number of Students
SchoolNumber of Students
LEANumber of Students
State
All Students at the School 315 911 31,839 759 4,683,676 778
Black or African American 249 911 4,980 683 317,856 696
American Indian or AlaskaNative
2 281 700 33,774 733
Asian 7 6,178 805 398,869 898
Filipino 2 345 840 123,245 859
Hispanic or Latino 38 883 11,561 723 2,406,749 729
Native Hawaiian or PacificIslander
0 522 714 26,953 764
White 8 6,122 830 1,258,831 845
Two or More Races 9 1,779 809 76,766 836
SocioeconomicallyDisadvantaged
228 907 23,412 727 2,731,843 726
English Learners 18 890 11,210 723 1,521,844 707
Students w ith Disabilities 15 754 3,919 577 521,815 595
Adequate Yearly ProgressThe federal ESEA requires that all schools and districts meet the following Adequate Yearly Progress (AYP) criteria:
Participation rate on the state’s standards-based assessments in ELA and mathematics
Percent proficient on the state’s standards-based assessments in ELA and mathematics
API as an additional indicator Graduation rate (for secondary schools)
For detailed information about AYP, including participation rates and percent proficient results by student group, see the CDE AYP Web page at http://www.cde.ca.gov/ta/ac/ay/.
Adequate Yearly Progress Overall and by Criteria (School Year 2010–11)
AYP Criteria School District
Made AYP Overall Yes No
Met Participation Rate - English-Language Arts Yes Yes
Met Participation Rate - Mathematics Yes Yes
Met Percent P roficient - English-Language Arts Yes No
Met Percent P roficient - Mathematics Yes No
Met API Criteria Yes Yes
Met Graduation Rate N/A No
8/3/2019 10-11 PS7 SARC pub 11-12
http://slidepdf.com/reader/full/10-11-ps7-sarc-pub-11-12 13/13
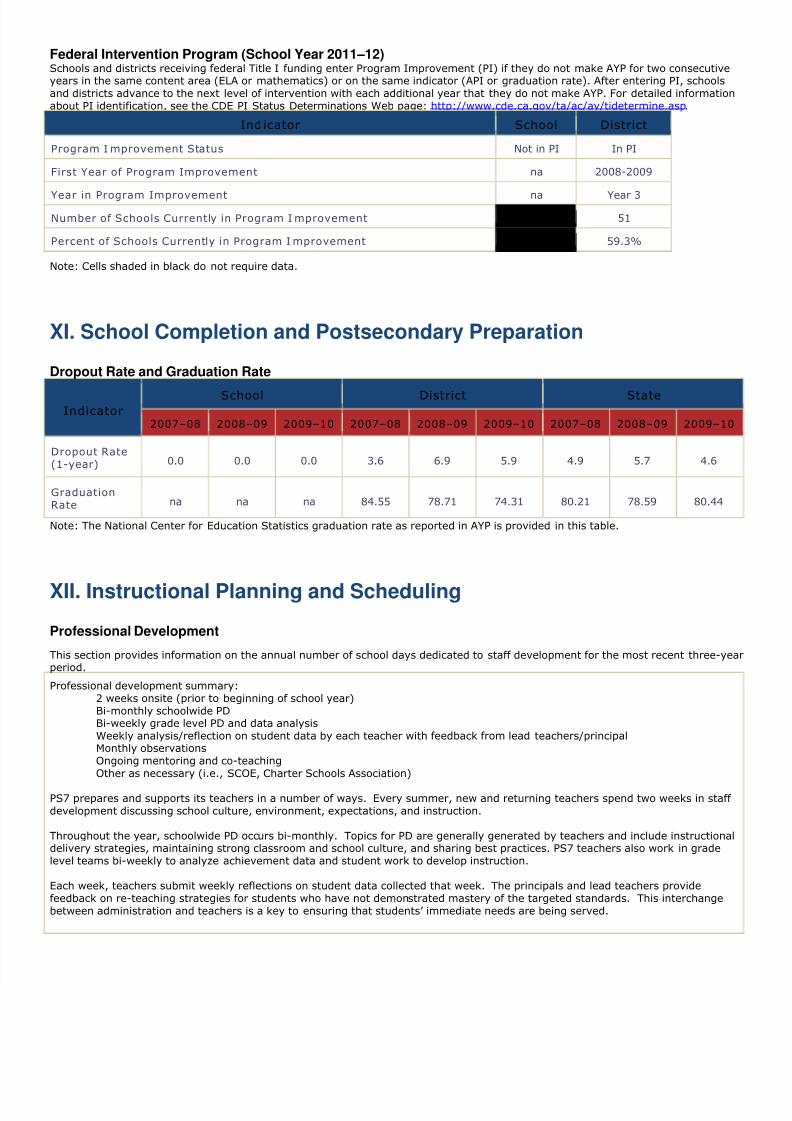
Federal Intervention Program (School Year 2011–12)Schools and districts receiving federal Title I funding enter Program Improvement (PI) if they do not make AYP for two consecutiveyears in the same content area (ELA or mathematics) or on the same indicator (API or graduation rate). After entering PI, schoolsand districts advance to the next level of intervention with each additional year that they do not make AYP. For detailed informationabout PI identification, see the CDE PI Status Determinations Web page: http://www.cde.ca.gov/ta/ac/ay/tidetermine.asp.
Ind icator School District
Program I mprovement Status Not in PI In PI
First Year of Program Improvement na 2008-2009
Year in Program Improvement na Year 3
Number of Schools Currently in Program I mprovement 51
Percent of Schools Currently in Program I mprovement 59.3%
Note: Cells shaded in black do not require data.
XI. School Completion and Postsecondary Preparation
Dropout Rate and Graduation Rate
IndicatorSchool District State
2007–08 2008–09 2009–10 2007–08 2008–09 2009–10 2007–08 2008–09 2009–10
Dropout Rate(1-year) 0.0 0.0 0.0 3.6 6.9 5.9 4.9 5.7 4.6
GraduationRate na na na 84.55 78.71 74.31 80.21 78.59 80.44
Note: The National Center for Education Statistics graduation rate as reported in AYP is provided in this table.
XII. Instructional Planning and Scheduling
Professional Development
This section provides information on the annual number of school days dedicated to staff development for the most recent three-yeaperiod.
Professional development summary:2 weeks onsite (prior to beginning of school year)Bi-monthly schoolwide PDBi-weekly grade level PD and data analysisWeekly analysis/reflection on student data by each teacher with feedback from lead teachers/principalMonthly observationsOngoing mentoring and co-teachingOther as necessary (i.e., SCOE, Charter Schools Association)
PS7 prepares and supports its teachers in a number of ways. Every summer, new and returning teachers spend two weeks in staff development discussing school culture, environment, expectations, and instruction.
Throughout the year, schoolwide PD occurs bi-monthly. Topics for PD are generally generated by teachers and include instructionaldelivery strategies, maintaining strong classroom and school culture, and sharing best practices. PS7 teachers also work in gradelevel teams bi-weekly to analyze achievement data and student work to develop instruction.
Each week, teachers submit weekly reflections on student data collected that week. The principals and lead teachers providefeedback on re-teaching strategies for students who have not demonstrated mastery of the targeted standards. This interchangebetween administration and teachers is a key to ensuring that students’ immediate needs are being served.