Embed Size (px)
Citation preview
10 - 1
Corporate Valuation and Value-Based Management
Corporate ValuationValue-Based ManagementCorporate Governance
10 - 2
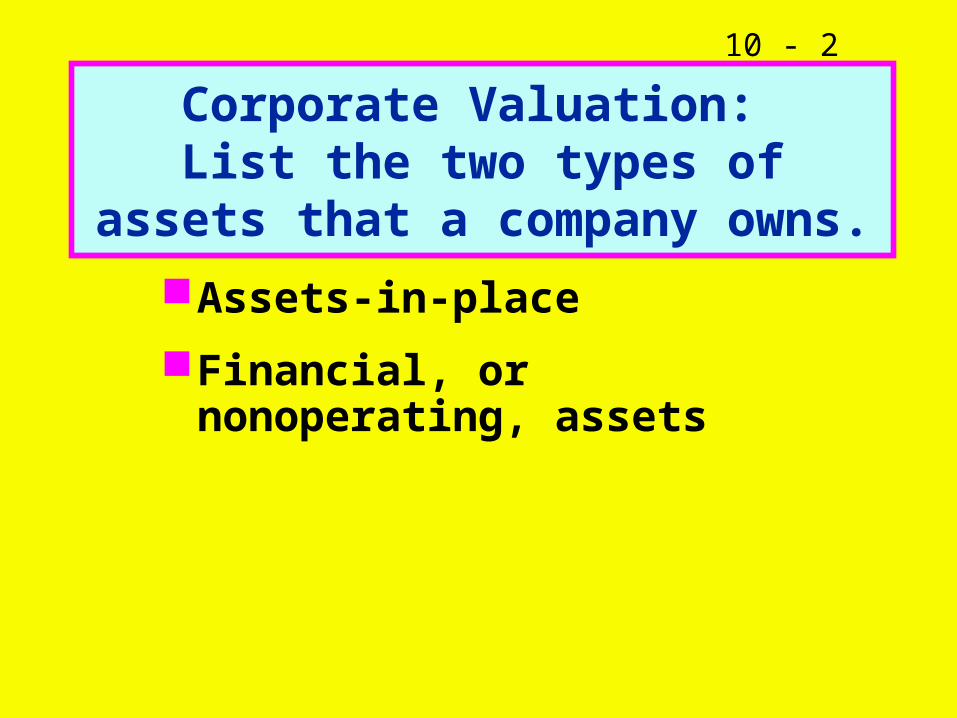
Corporate Valuation: List the two types of assets that a
company owns.
Assets-in-place
Financial, or nonoperating, assets
10 - 3
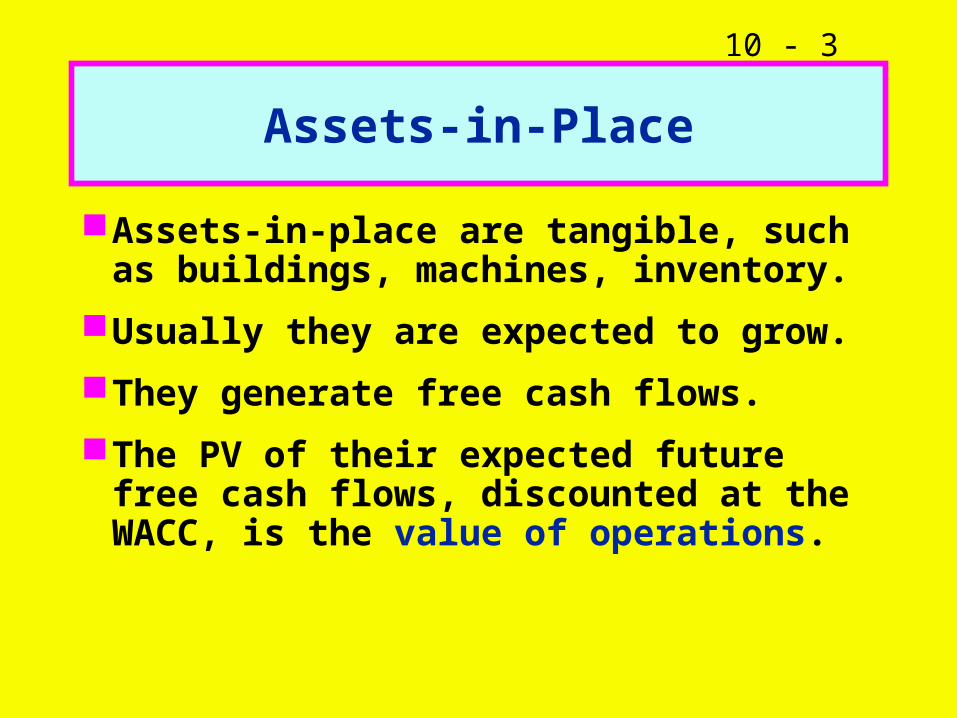
Assets-in-Place
Assets-in-place are tangible, such as buildings, machines, inventory.
Usually they are expected to grow.
They generate free cash flows.
The PV of their expected future free cash flows, discounted at the WACC, is the value of operations.
10 - 4
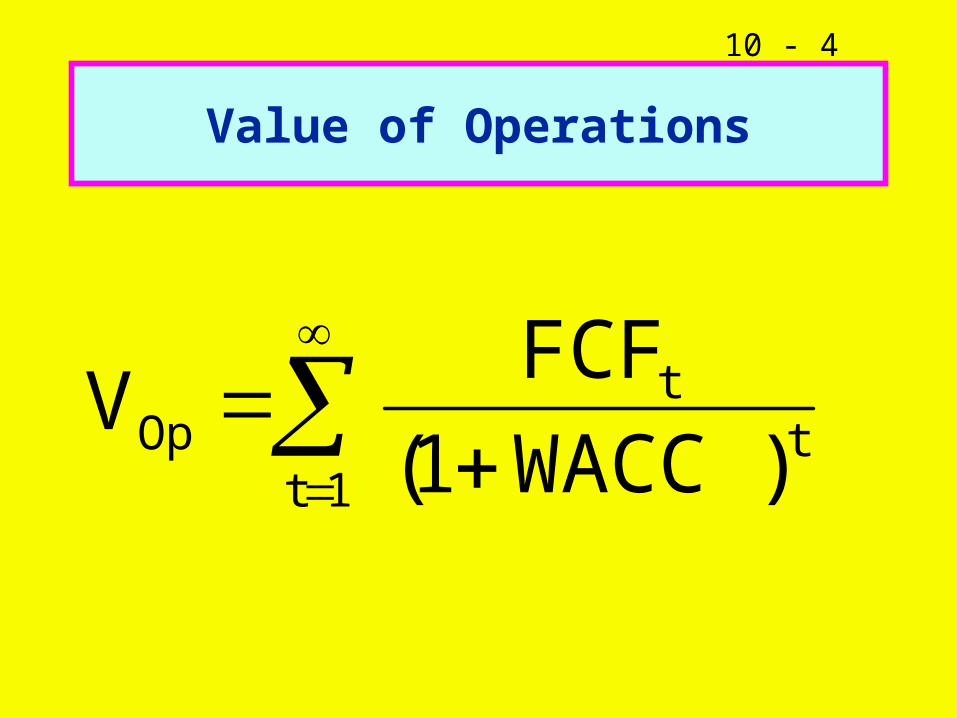
Value of Operations
1tt
tOp )WACC1(
FCFV
10 - 5
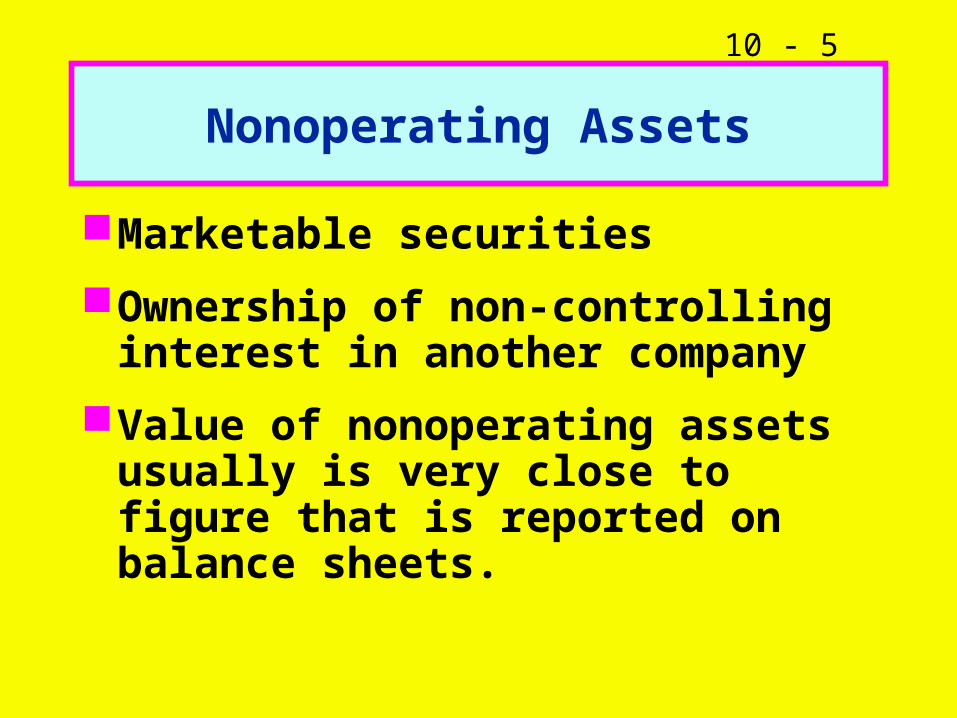
Nonoperating Assets
Marketable securities
Ownership of non-controlling interest in another company
Value of nonoperating assets usually is very close to figure that is reported on balance sheets.
10 - 6
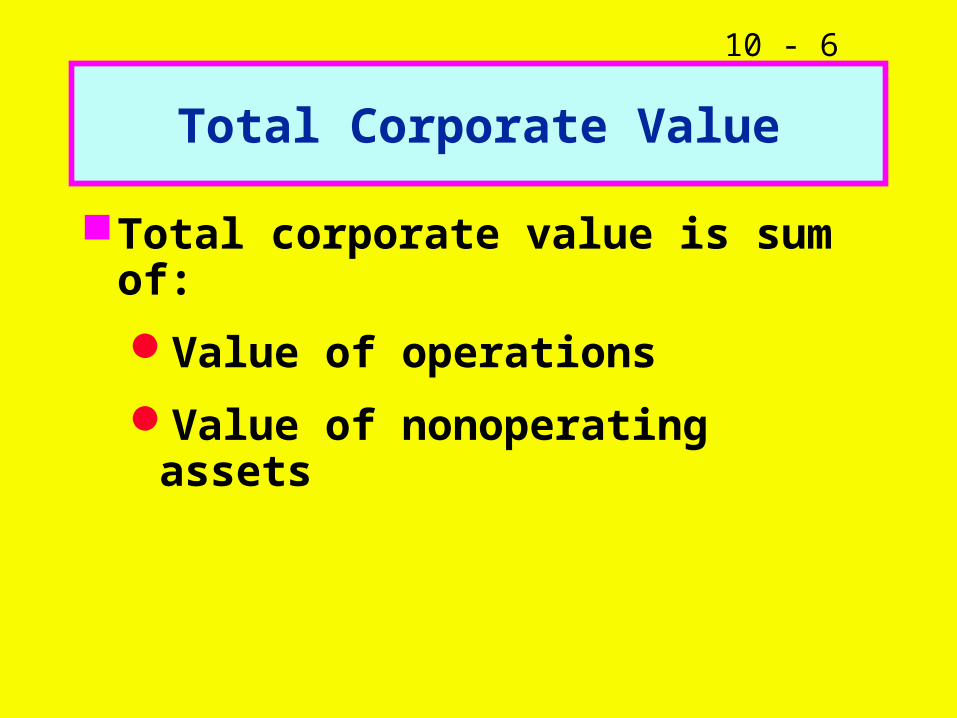
Total Corporate Value
Total corporate value is sum of:
Value of operations
Value of nonoperating assets

10 - 7
Claims on Corporate Value
Debtholders have first claim.
Preferred stockholders have the next claim.
Any remaining value belongs to stockholders.
10 - 8
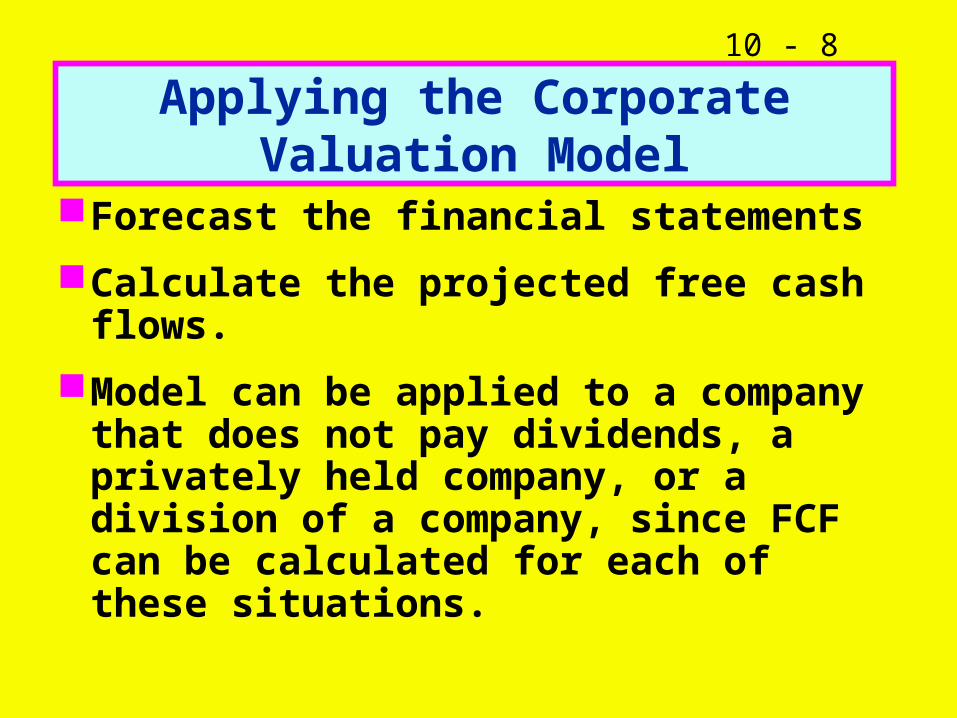
Applying the Corporate Valuation Model
Forecast the financial statements
Calculate the projected free cash flows.
Model can be applied to a company that does not pay dividends, a privately held company, or a division of a company, since FCF can be calculated for each of these situations.
10 - 9
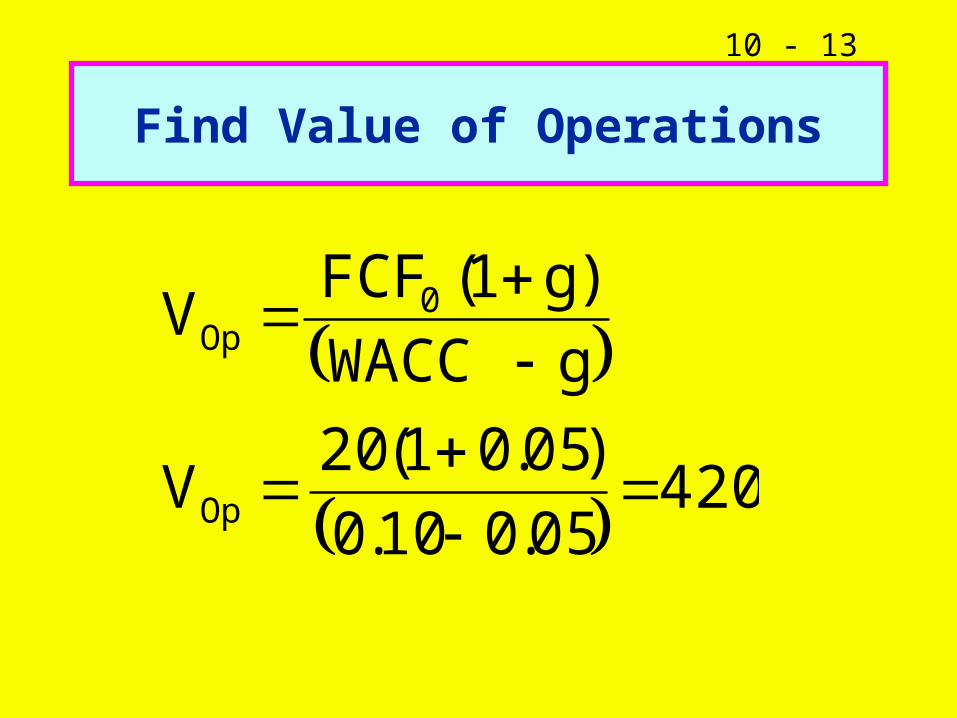
Data for Valuation
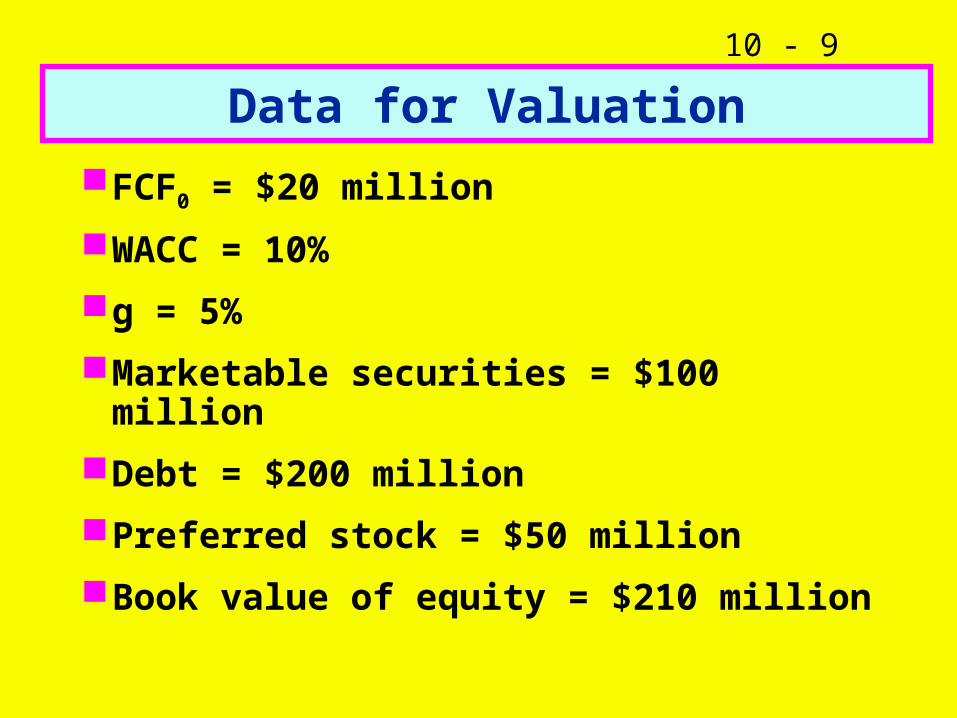
FCF0 = $20 million
WACC = 10%
g = 5%
Marketable securities = $100 million
Debt = $200 million
Preferred stock = $50 million
Book value of equity = $210 million
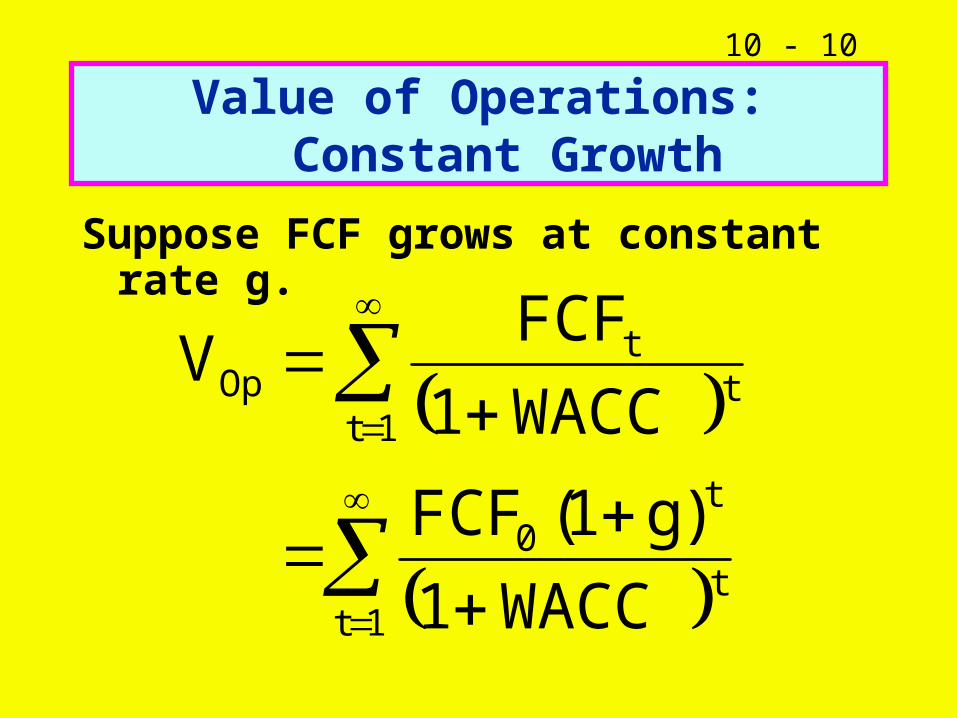
10 - 10
Value of Operations: Constant Growth
Suppose FCF grows at constant rate g.
1tt
t0
1tt
tOp
WACC1
)g1(FCF
WACC1
FCFV
10 - 11
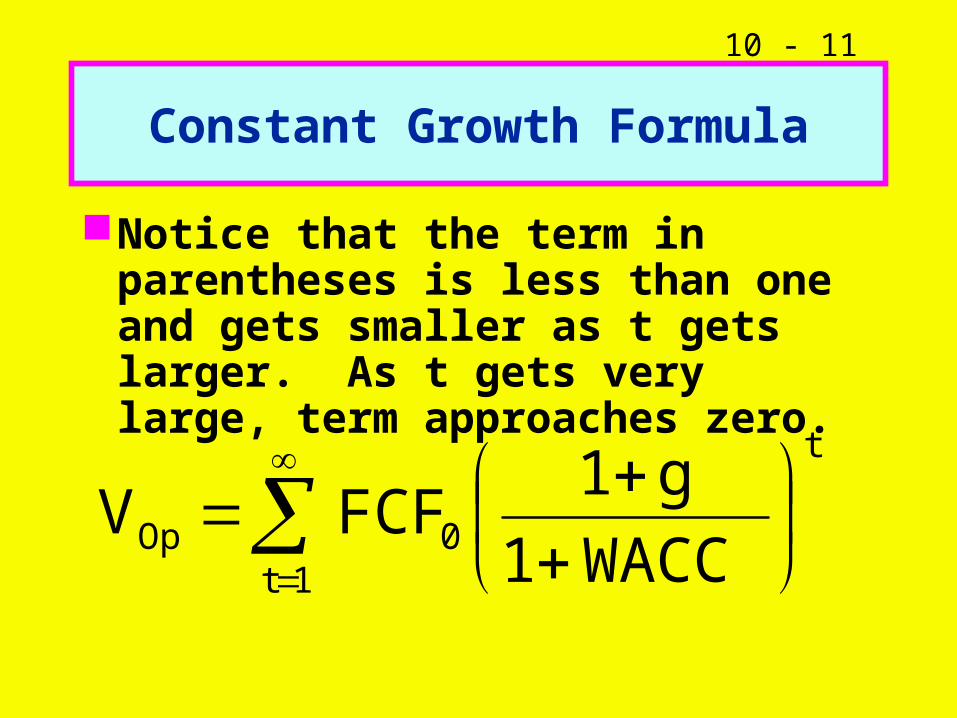
Constant Growth Formula
Notice that the term in parentheses is less than one and gets smaller as t gets larger. As t gets very large, term approaches zero.
1t
t
0Op WACC1
g1FCFV
10 - 12
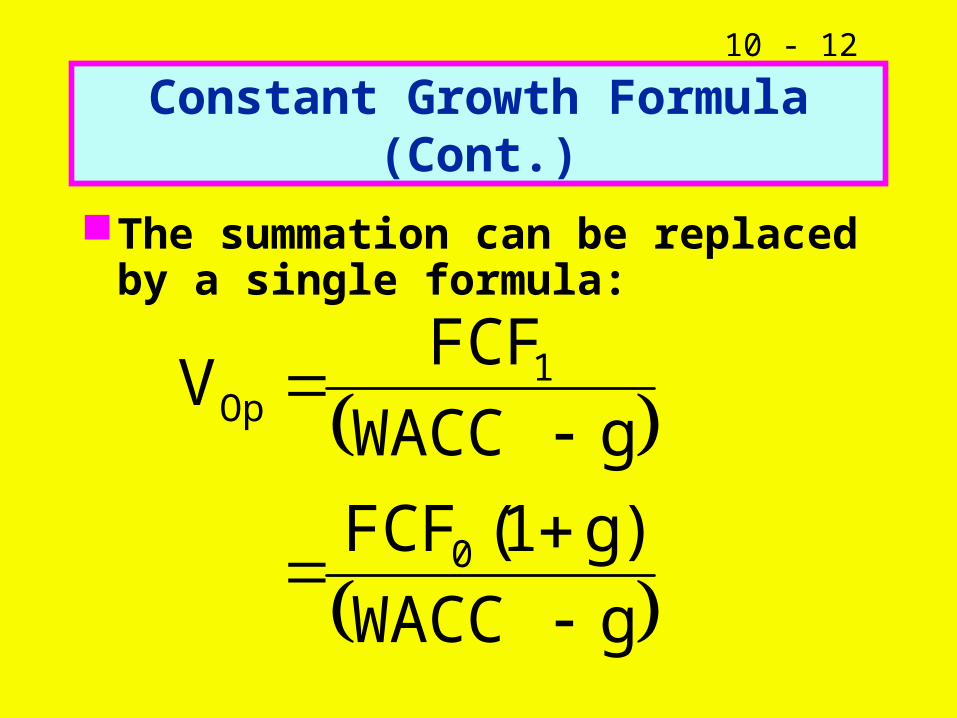
Constant Growth Formula (Cont.)
The summation can be replaced by a single formula:
gWACC
)g1(FCF
gWACC
FCFV
0
1Op
10 - 13
Find Value of Operations
42005.010.0
)05.01(20V
gWACC
)g1(FCFV
Op
0Op
10 - 14
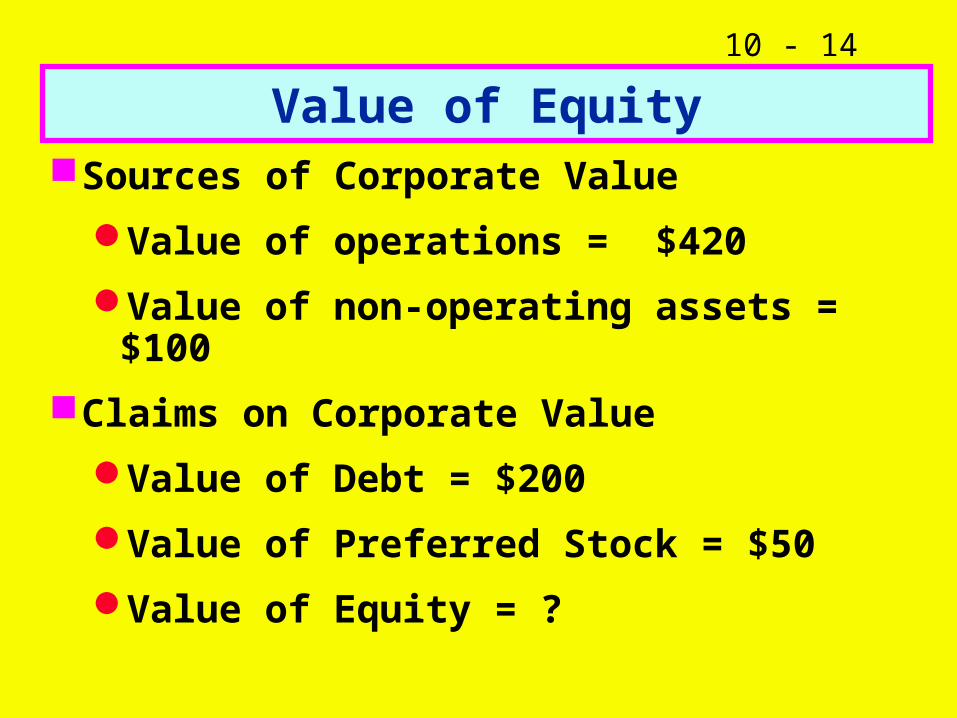
Value of EquitySources of Corporate Value
Value of operations = $420
Value of non-operating assets = $100
Claims on Corporate Value
Value of Debt = $200
Value of Preferred Stock = $50
Value of Equity = ?
10 - 15
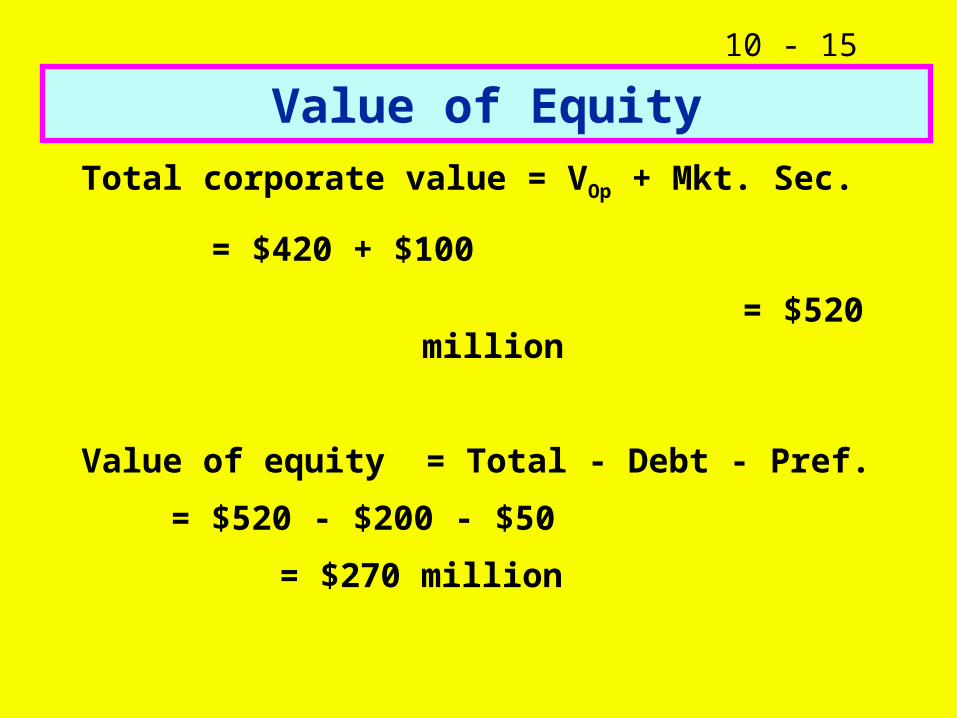
Value of Equity
Total corporate value = VOp + Mkt. Sec.
= $420 + $100
= $520 million
Value of equity = Total - Debt - Pref.
= $520 - $200 - $50
= $270 million
10 - 16
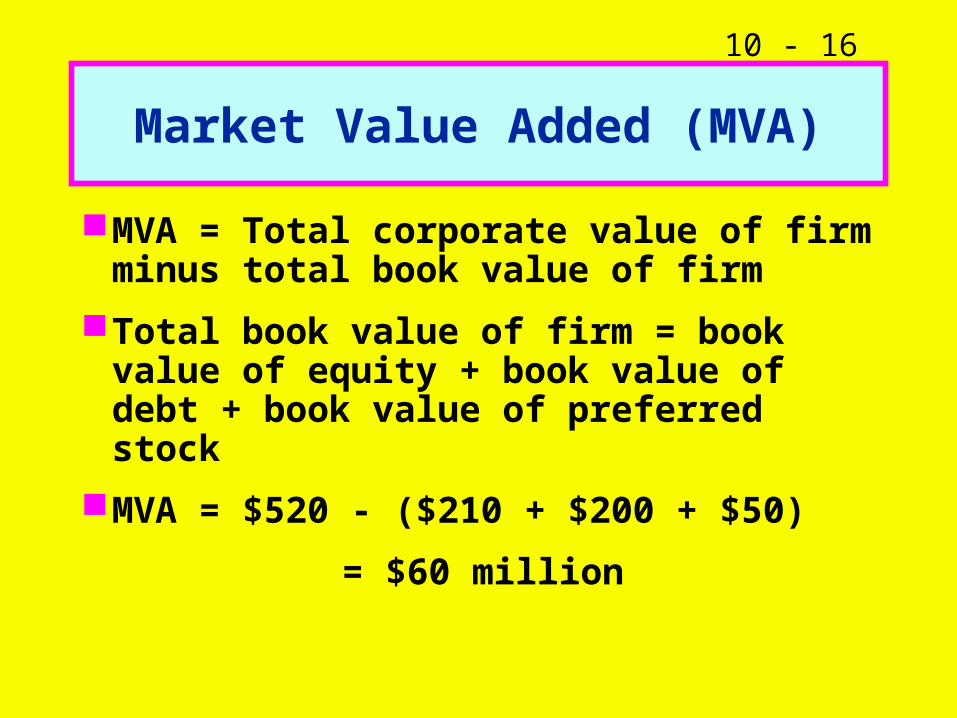
Market Value Added (MVA)
MVA = Total corporate value of firm minus total book value of firm
Total book value of firm = book value of equity + book value of debt + book value of preferred stock
MVA = $520 - ($210 + $200 + $50)
= $60 million
10 - 17
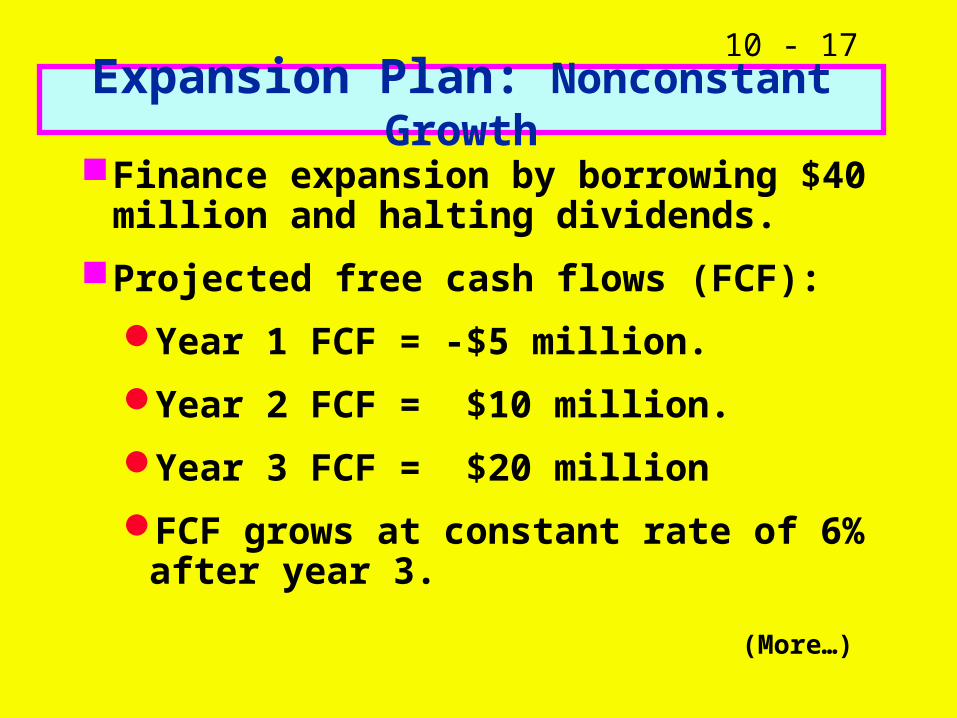
Expansion Plan: Nonconstant Growth
Finance expansion by borrowing $40 million and halting dividends.
Projected free cash flows (FCF):
Year 1 FCF = -$5 million.
Year 2 FCF = $10 million.
Year 3 FCF = $20 million
FCF grows at constant rate of 6% after year 3.
(More…)
10 - 18
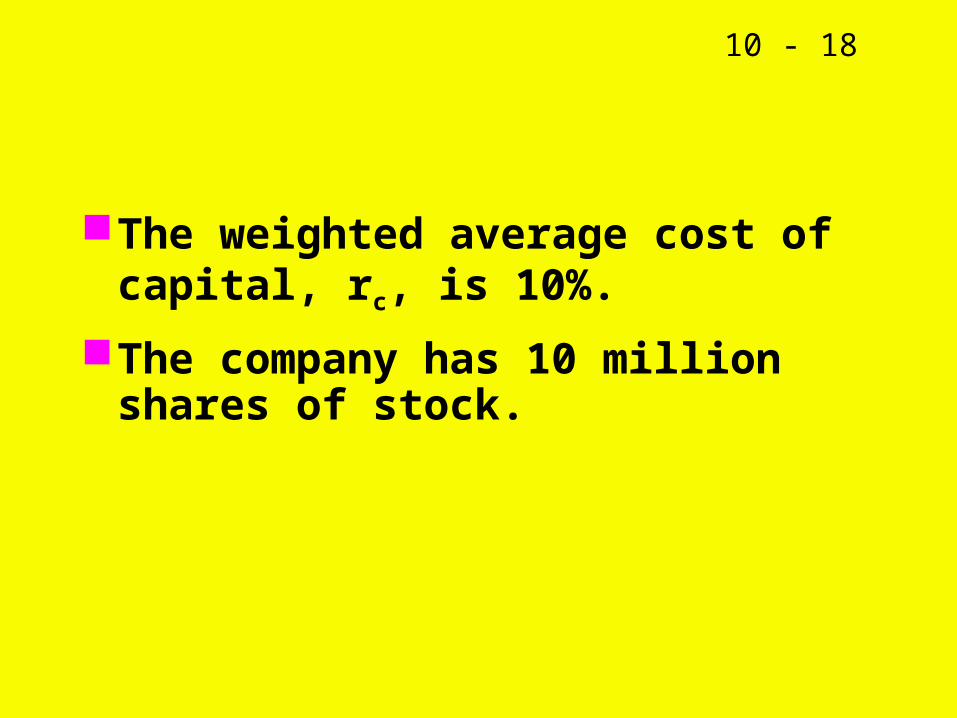
The weighted average cost of capital, rc, is 10%.
The company has 10 million shares of stock.
10 - 19
Horizon Value
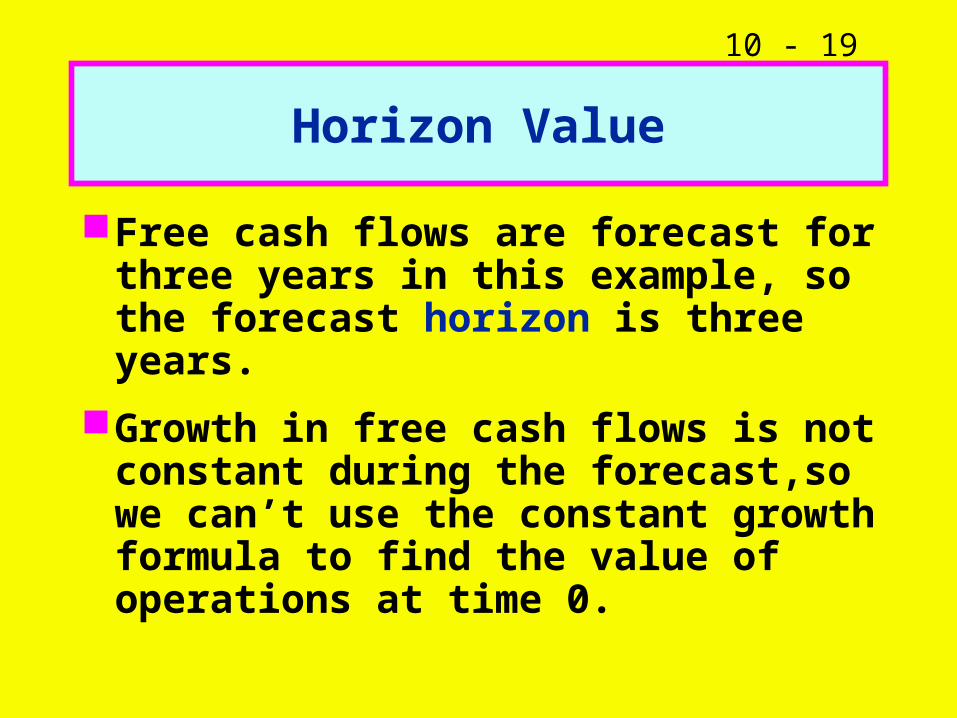
Free cash flows are forecast for three years in this example, so the forecast horizon is three years.
Growth in free cash flows is not constant during the forecast,so we can’t use the constant growth formula to find the value of operations at time 0.
10 - 20
Horizon Value (Cont.)
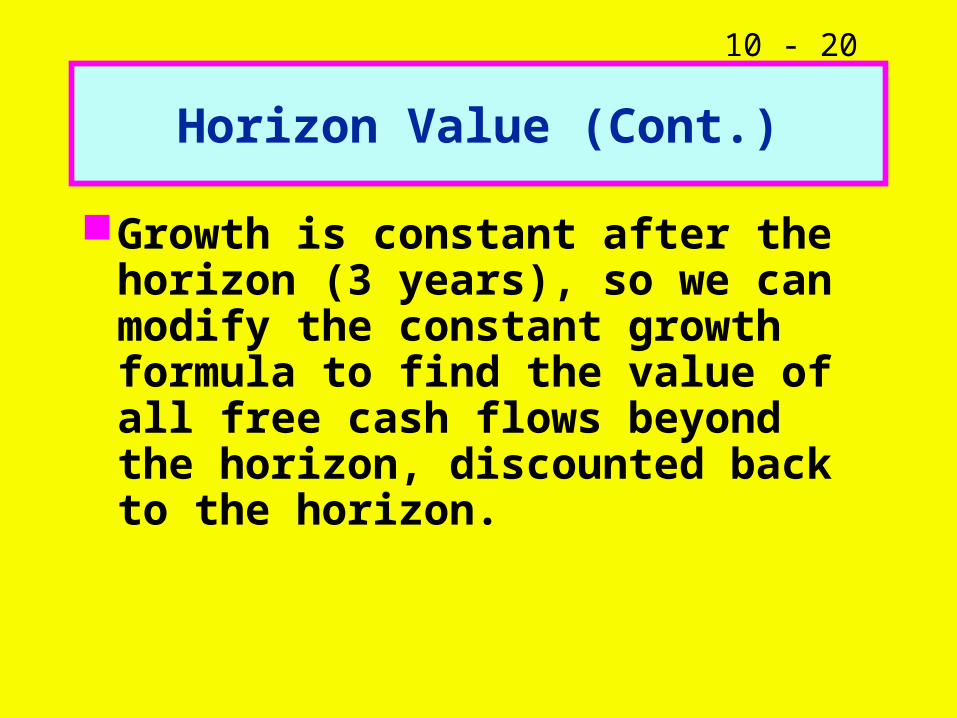
Growth is constant after the horizon (3 years), so we can modify the constant growth formula to find the value of all free cash flows beyond the horizon, discounted back to the horizon.
10 - 21
Horizon Value Formula
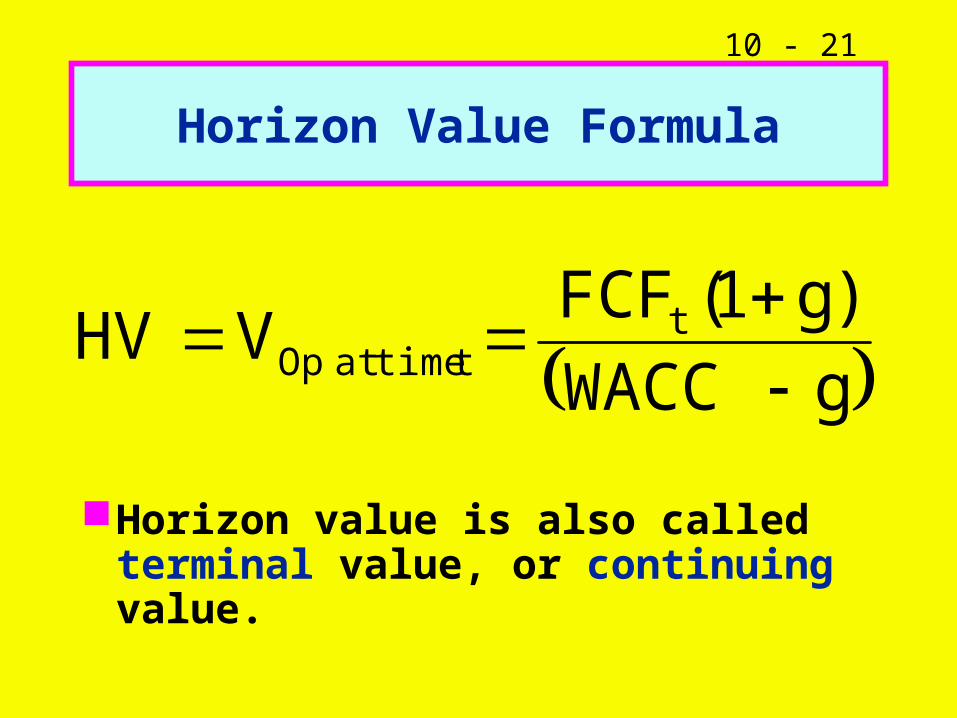
Horizon value is also called terminal value, or continuing value.
gWACC
)g1(FCFVHV t
ttimeatOp
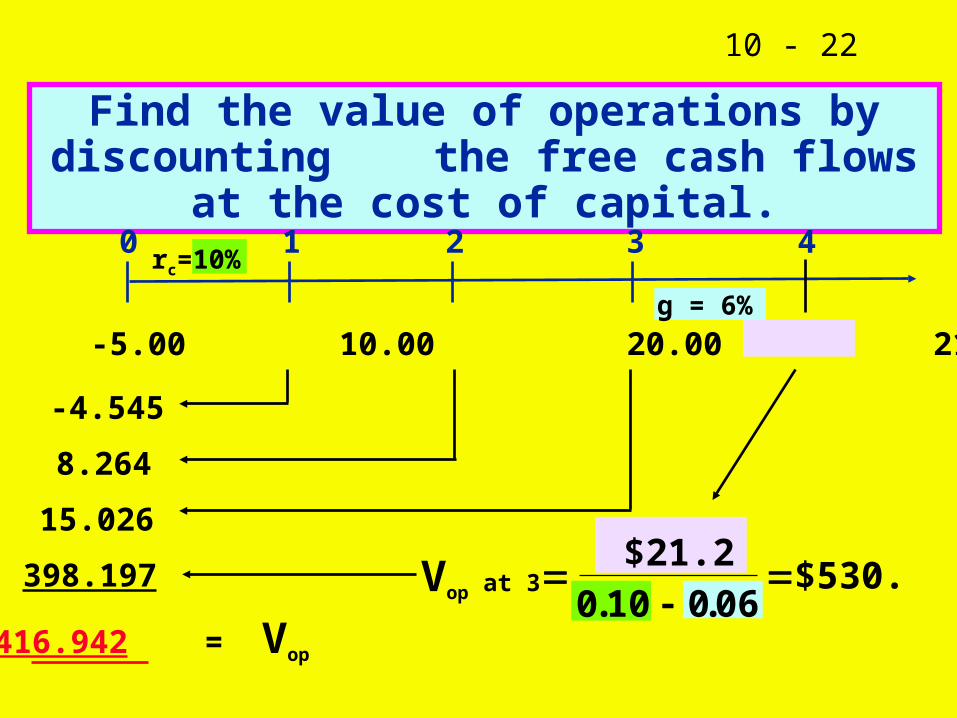
10 - 22
Vop at 3
Find the value of operations by discounting the free cash flows at the cost of capital.
0
-4.545
8.264
15.026
398.197
1 2 3 4rc=10%
416.942 = Vop
g = 6%
FCF= -5.00 10.00 20.00 21.2
$21.2. .
$530.10 0 06
0
10 - 23
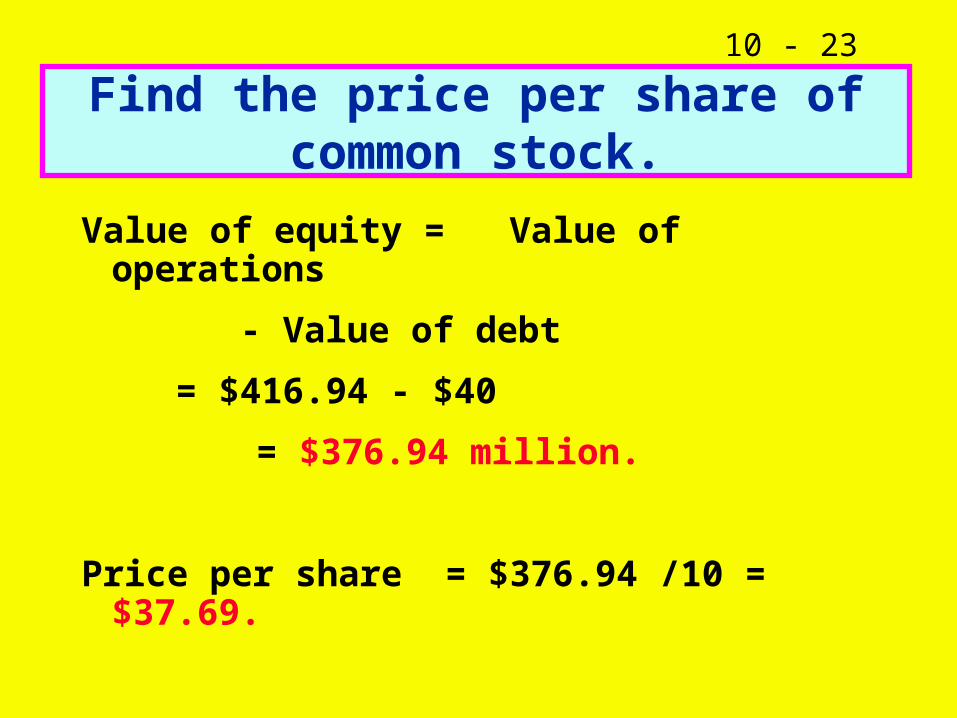
Find the price per share of common stock.
Value of equity = Value of operations
- Value of debt
= $416.94 - $40
= $376.94 million.
Price per share = $376.94 /10 = $37.69.
10 - 24
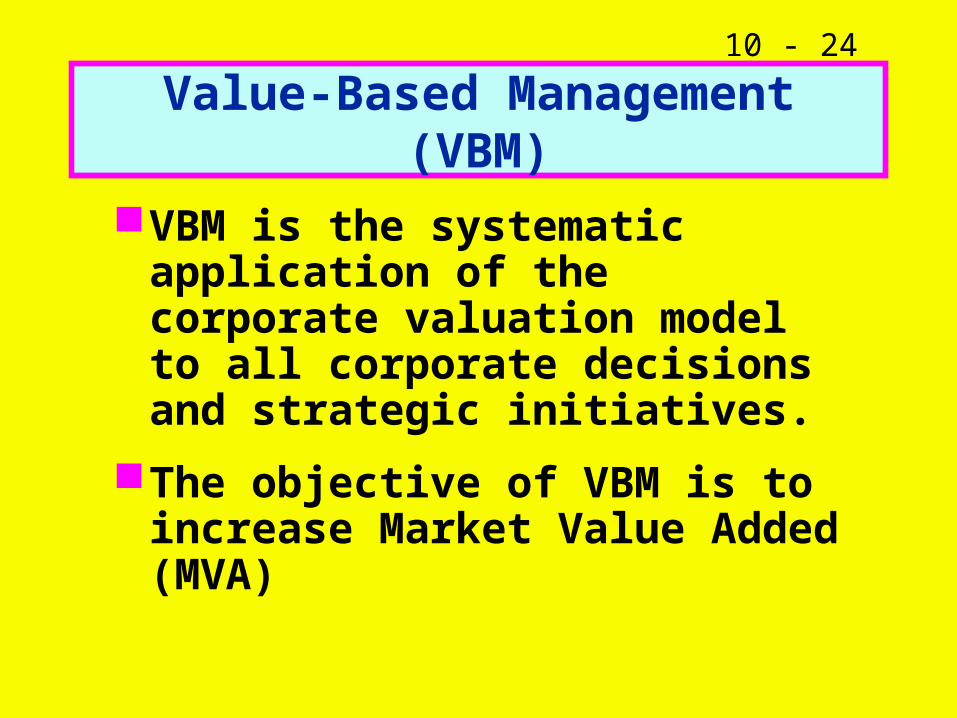
Value-Based Management (VBM)
VBM is the systematic application of the corporate valuation model to all corporate decisions and strategic initiatives.
The objective of VBM is to increase Market Value Added (MVA)
10 - 25
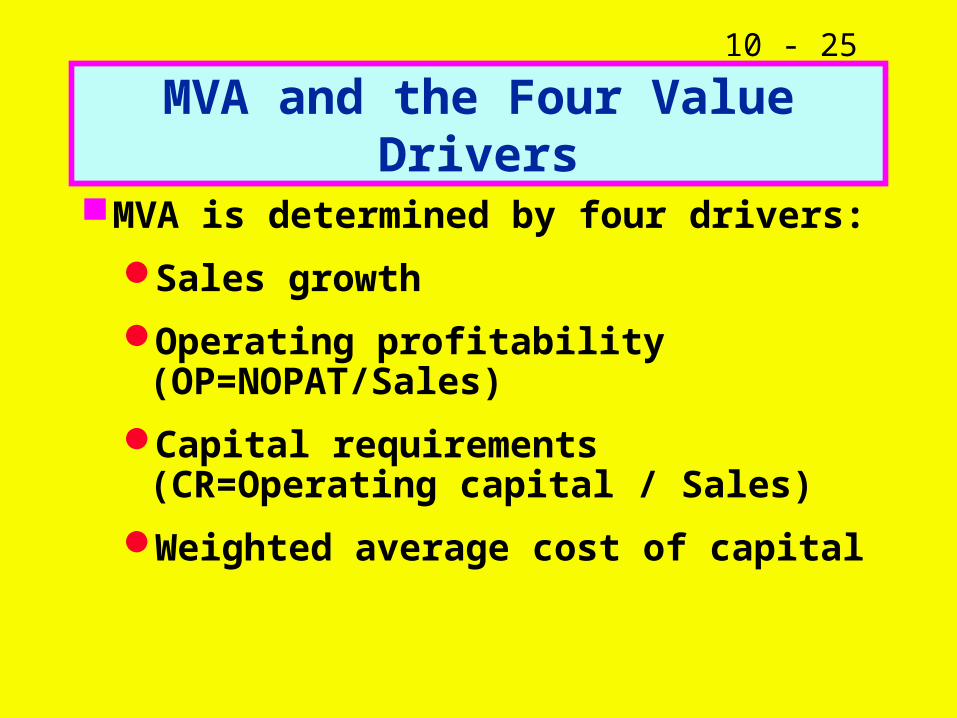
MVA and the Four Value Drivers
MVA is determined by four drivers:
Sales growth
Operating profitability (OP=NOPAT/Sales)
Capital requirements (CR=Operating capital / Sales)
Weighted average cost of capital
10 - 26
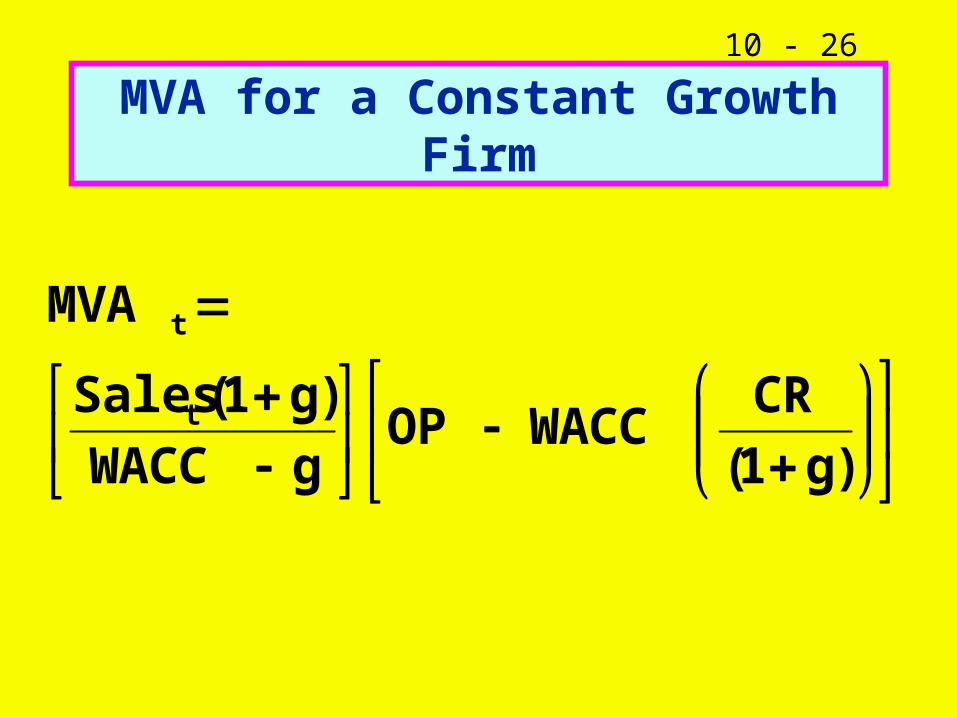
MVA for a Constant Growth Firm
)g1(
CRWACCOP
gWACC
)g1(Sales
MVA
t
t
10 - 27
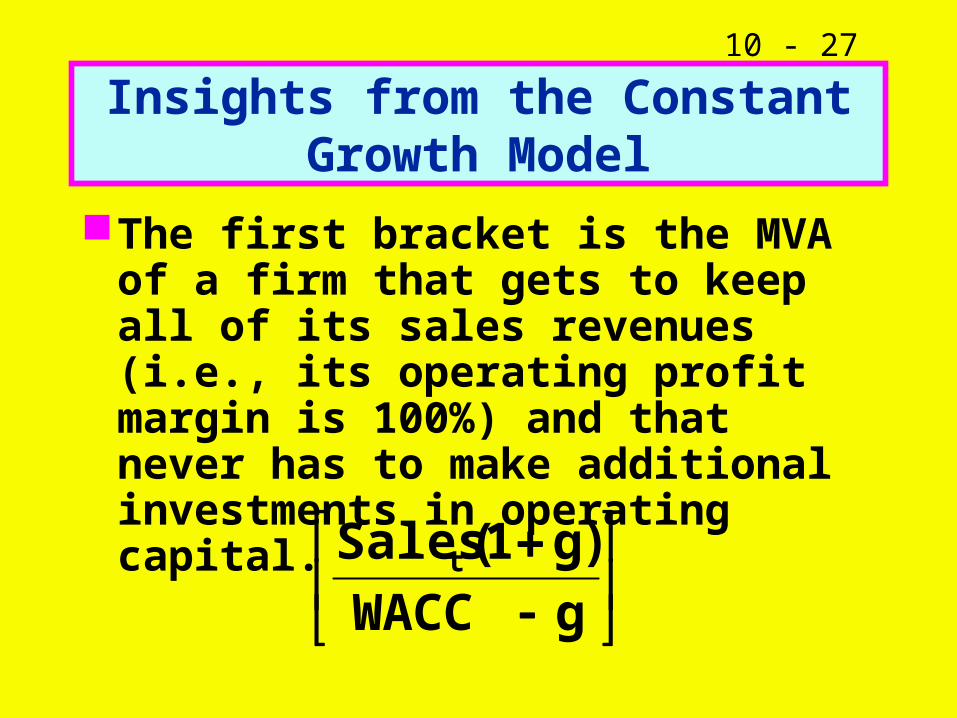
Insights from the Constant Growth Model
The first bracket is the MVA of a firm that gets to keep all of its sales revenues (i.e., its operating profit margin is 100%) and that never has to make additional investments in operating capital.
gWACC
)g1(Salest
10 - 28
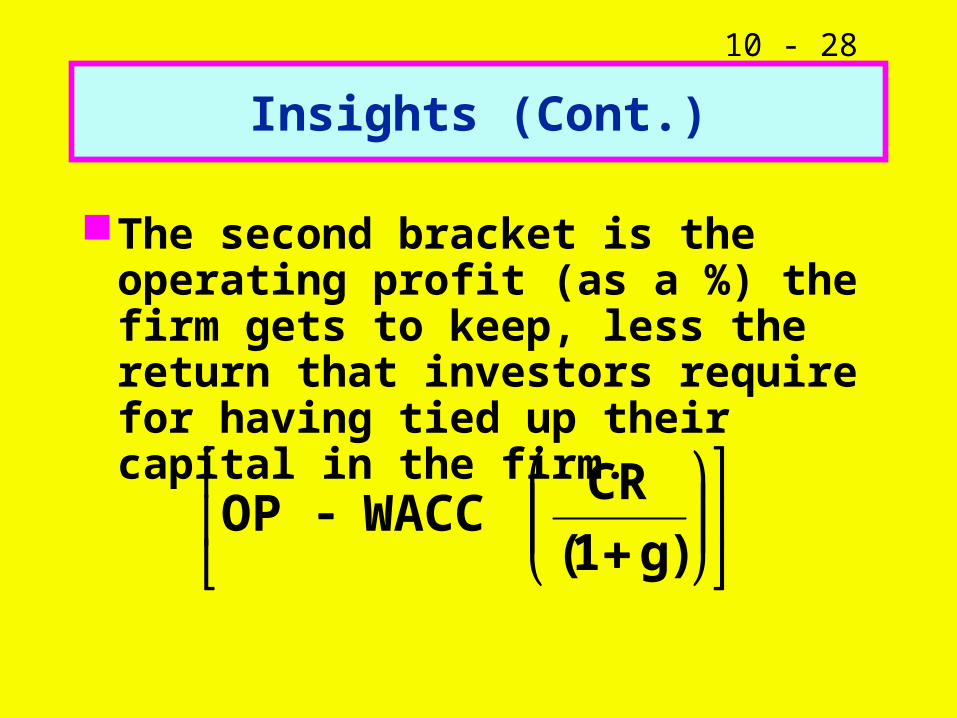
Insights (Cont.)
The second bracket is the operating profit (as a %) the firm gets to keep, less the return that investors require for having tied up their capital in the firm.
)g1(
CRWACCOP
10 - 29
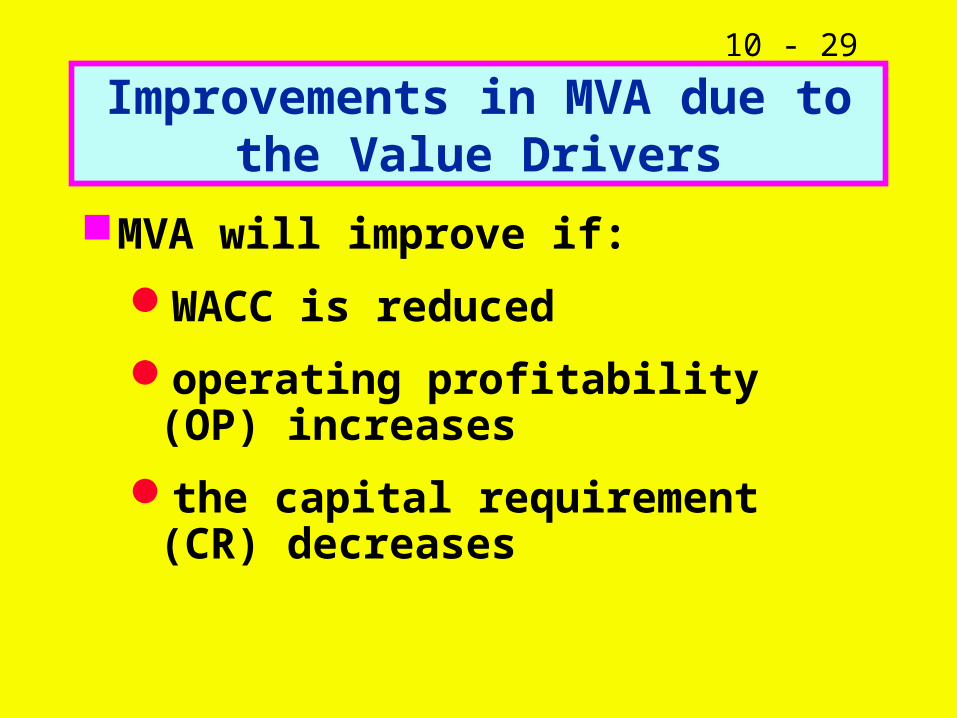
Improvements in MVA due to the Value Drivers
MVA will improve if:
WACC is reduced
operating profitability (OP) increases
the capital requirement (CR) decreases
10 - 30
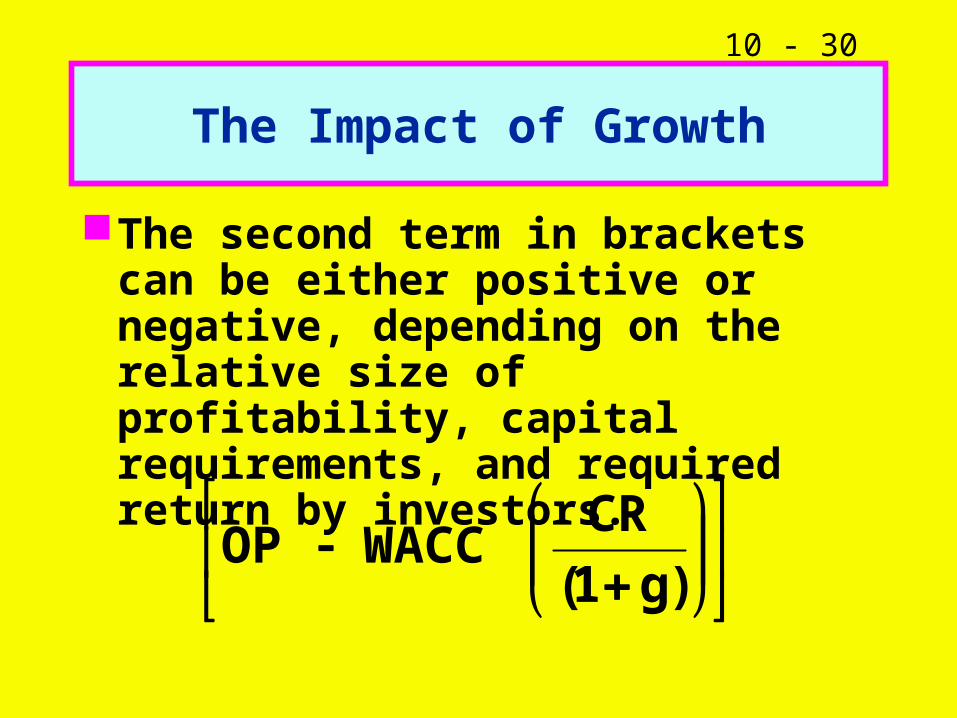
The Impact of Growth
The second term in brackets can be either positive or negative, depending on the relative size of profitability, capital requirements, and required return by investors.
)g1(
CRWACCOP
10 - 31
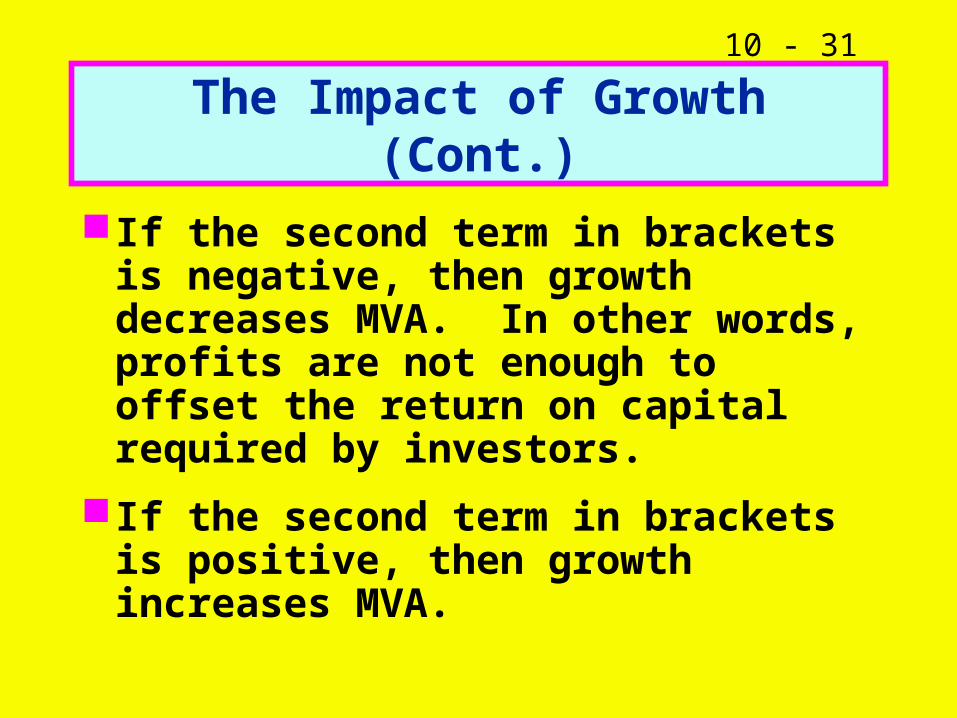
The Impact of Growth (Cont.)
If the second term in brackets is negative, then growth decreases MVA. In other words, profits are not enough to offset the return on capital required by investors.
If the second term in brackets is positive, then growth increases MVA.
10 - 32
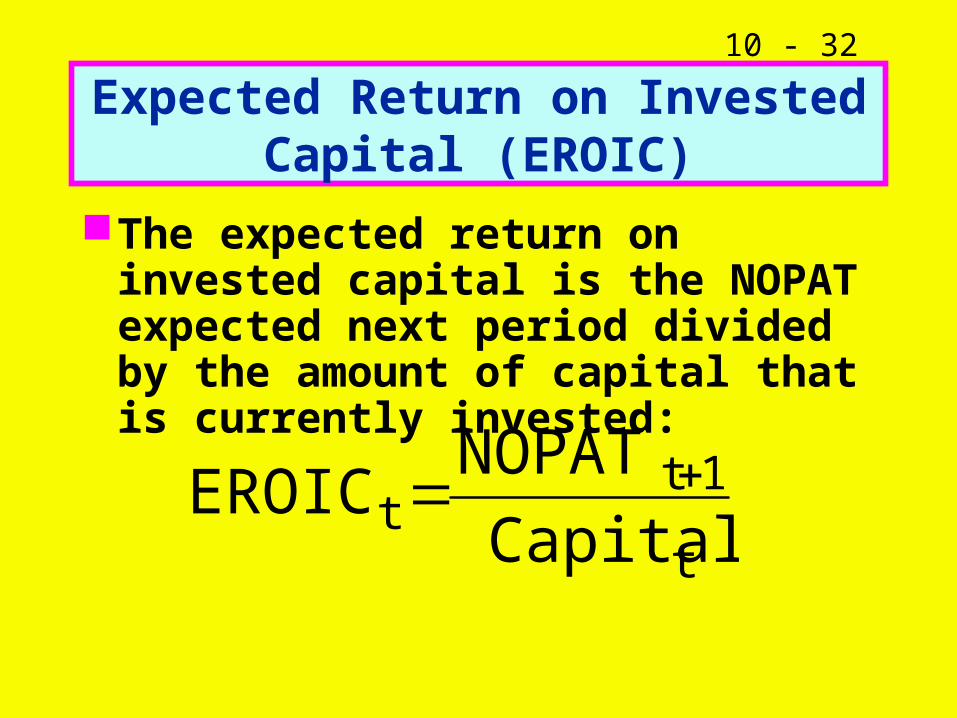
Expected Return on Invested Capital (EROIC)
The expected return on invested capital is the NOPAT expected next period divided by the amount of capital that is currently invested:
t
1tt Capital
NOPATEROIC
10 - 33
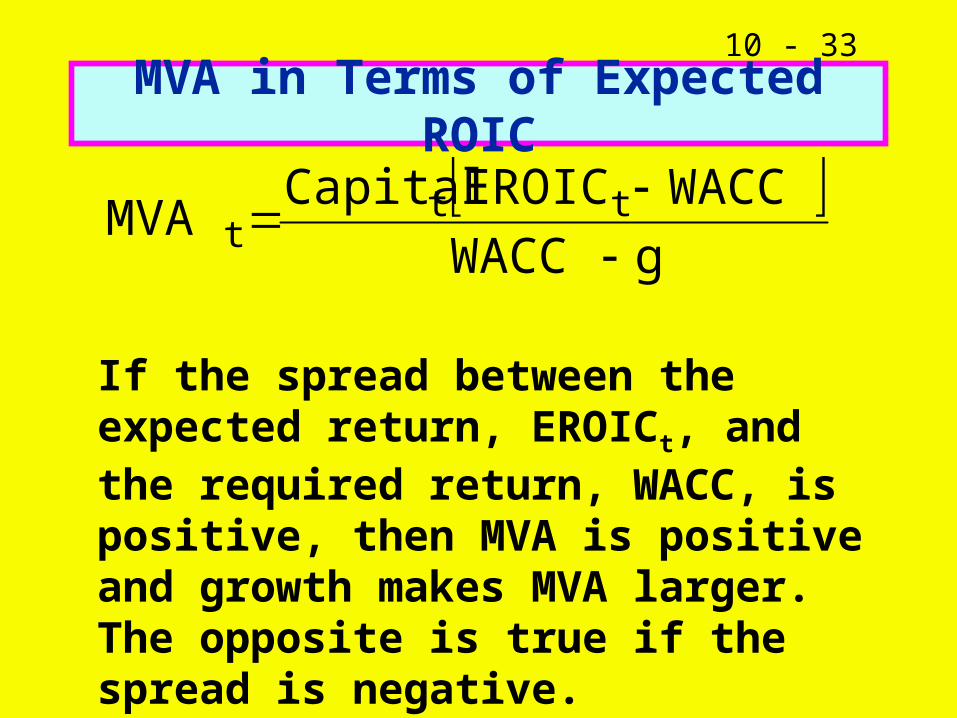
MVA in Terms of Expected ROIC
gWACC
WACCEROICCapitalMVA tt
t
If the spread between the expected return, EROICt, and the required return, WACC, is positive, then MVA is positive and growth makes MVA larger. The opposite is true if the spread is negative.
10 - 34
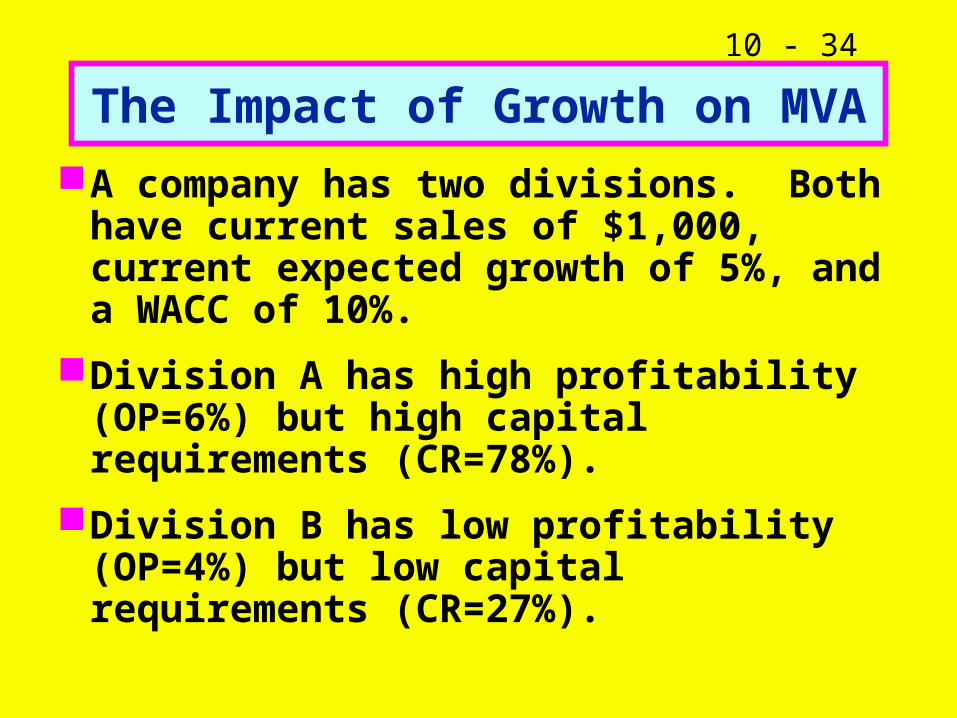
The Impact of Growth on MVA
A company has two divisions. Both have current sales of $1,000, current expected growth of 5%, and a WACC of 10%.
Division A has high profitability (OP=6%) but high capital requirements (CR=78%).
Division B has low profitability (OP=4%) but low capital requirements (CR=27%).
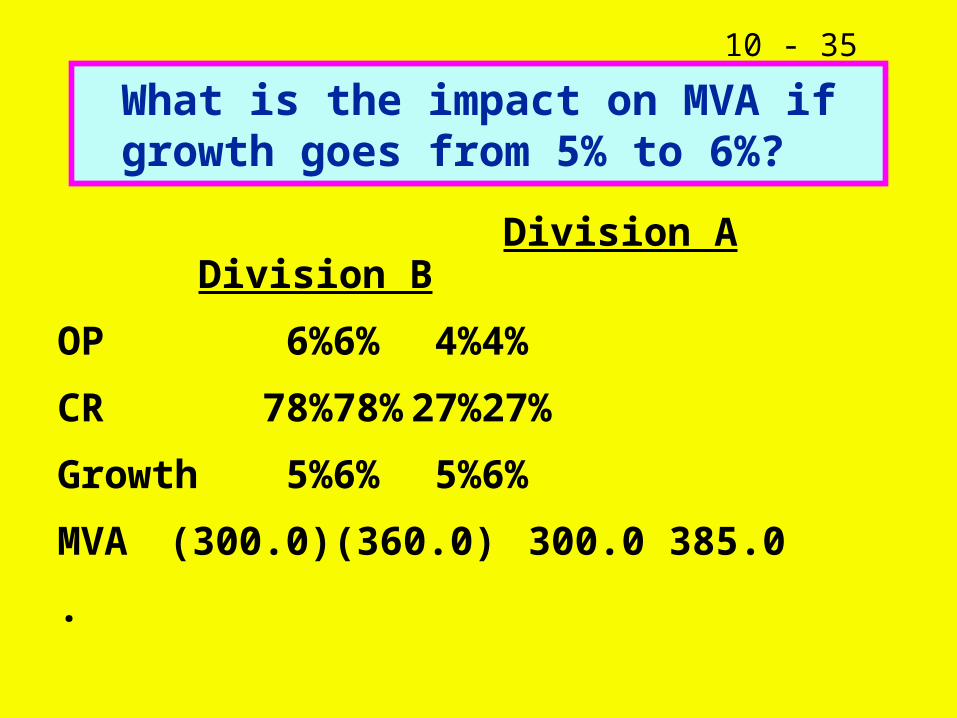
10 - 35
What is the impact on MVA if growth goes from 5% to 6%?
Division A Division B
OP 6% 6% 4% 4%
CR 78% 78% 27% 27%
Growth 5% 6% 5% 6%
MVA (300.0) (360.0) 300.0 385.0
.
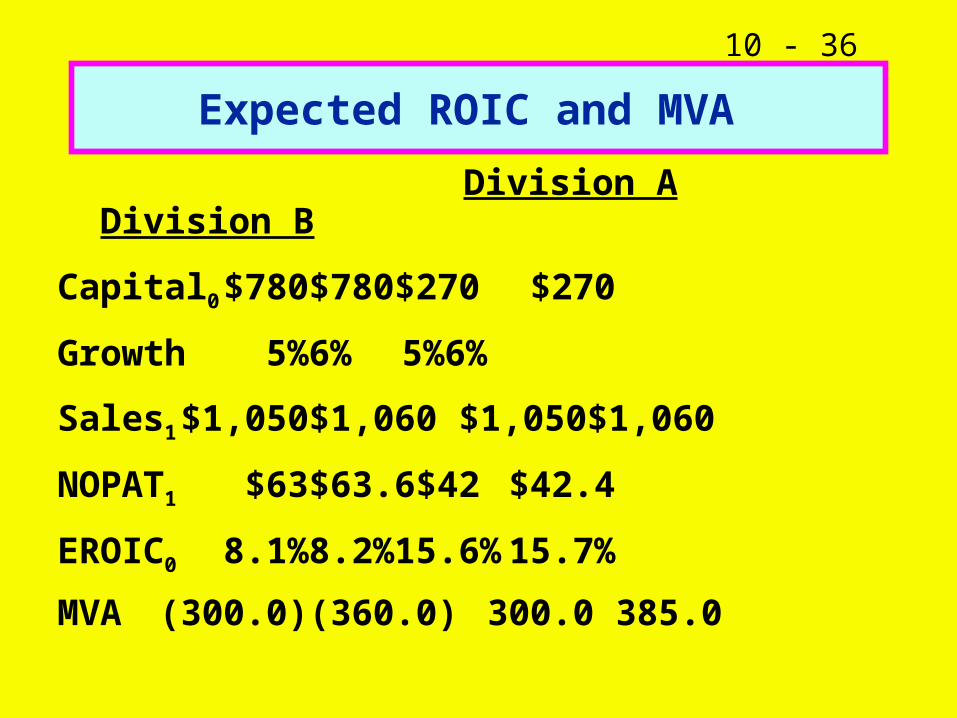
10 - 36
Expected ROIC and MVA
Division A Division B
Capital0 $780 $780 $270 $270
Growth 5% 6% 5% 6%
Sales1 $1,050 $1,060 $1,050 $1,060
NOPAT1 $63 $63.6 $42 $42.4
EROIC0 8.1% 8.2% 15.6% 15.7%
MVA (300.0) (360.0) 300.0 385.0
10 - 37
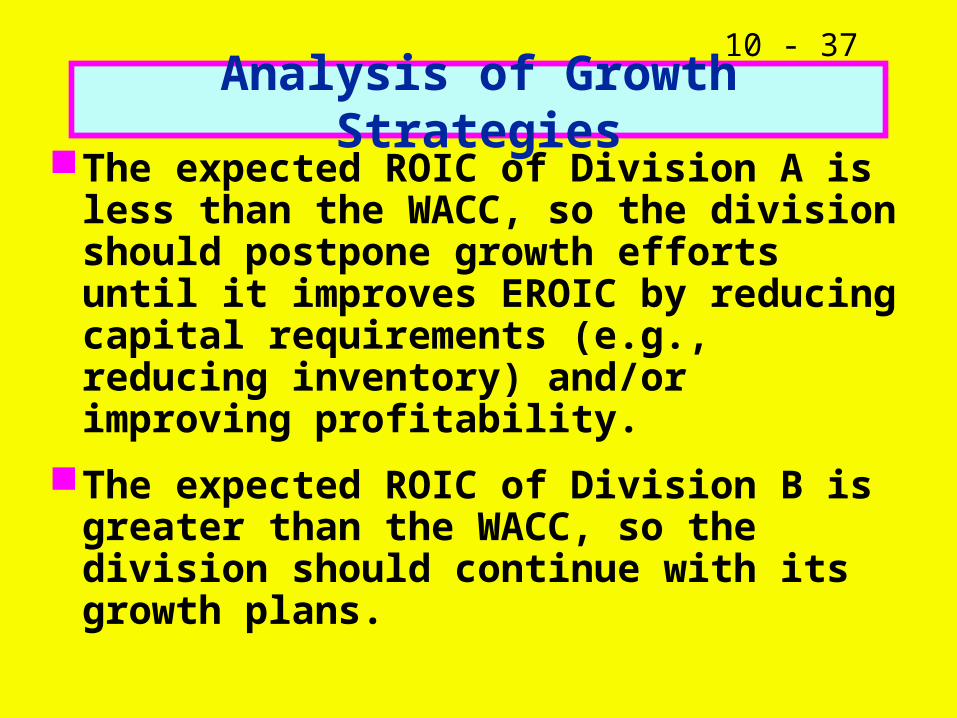
Analysis of Growth StrategiesThe expected ROIC of Division A is less
than the WACC, so the division should postpone growth efforts until it improves EROIC by reducing capital requirements (e.g., reducing inventory) and/or improving profitability.
The expected ROIC of Division B is greater than the WACC, so the division should continue with its growth plans.
10 - 38
Forecast 3-7 years
The explicit forecast horizon needs to be at least 3 years
You may want to forecast a full or mini IS and a full or mini BS to develop your cash flow forecast
The next page shows a summary forecast.
10 - 39
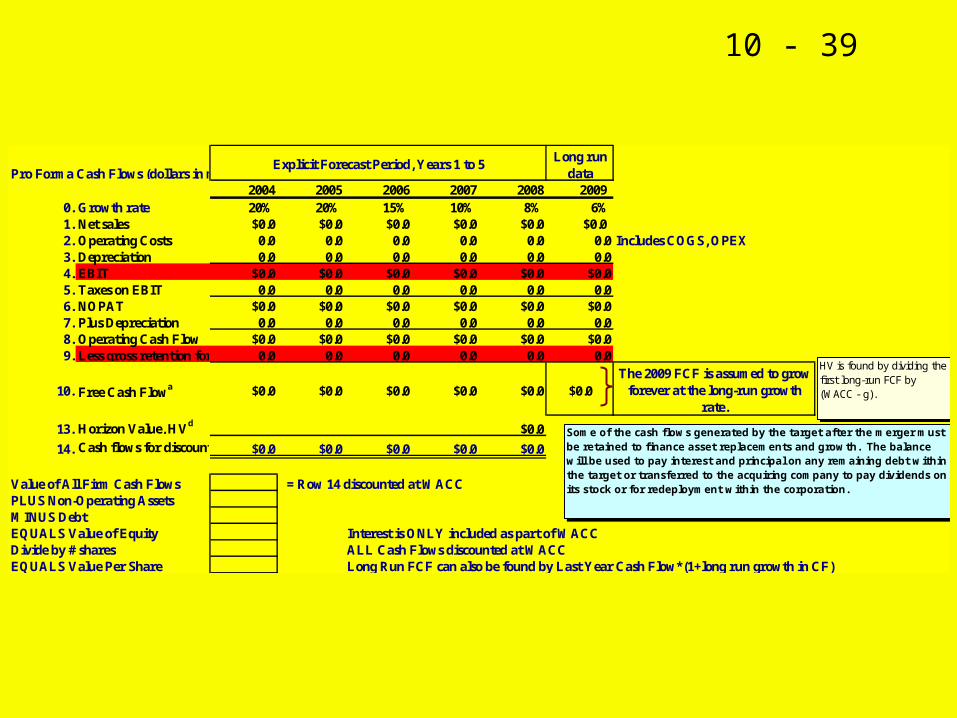
Pro Forma Cash Flows (dollars in millions)Long run
data2004 2005 2006 2007 2008 2009
0. Growth rate 20% 20% 15% 10% 8% 6%1. Net sales $0.0 $0.0 $0.0 $0.0 $0.0 $0.02. Operating Costs 0.0 0.0 0.0 0.0 0.0 0.0 Includes COGS, OPEX3. Depreciation 0.0 0.0 0.0 0.0 0.0 0.04. EBIT $0.0 $0.0 $0.0 $0.0 $0.0 $0.05. Taxes on EBIT 0.0 0.0 0.0 0.0 0.0 0.06. NOPAT $0.0 $0.0 $0.0 $0.0 $0.0 $0.07. Plus Depreciation 0.0 0.0 0.0 0.0 0.0 0.08. Operating Cash Flow $0.0 $0.0 $0.0 $0.0 $0.0 $0.09. Less gross retention for growth 0.0 0.0 0.0 0.0 0.0 0.0
10. Free Cash Flowa $0.0 $0.0 $0.0 $0.0 $0.0 $0.0
13. Horizon Value, HVd $0.0
14. Cash flows for discountinge$0.0 $0.0 $0.0 $0.0 $0.0
Value of All Firm Cash Flows = Row 14 discounted at WACCPLUS Non-Operating AssetsMINUS DebtEQUALS Value of Equity Interest is ONLY included as part of WACCDivide by # shares ALL Cash Flows discounted at WACCEQUALS Value Per Share Long Run FCF can also be found by Last Year Cash Flow*(1+long run growth in CF)
Explicit Forecast Period, Years 1 to 5
The 2009 FCF is assumed to grow forever at the long-run growth
rate.
Some of the cash flows generated by the target after the merger must be retained to finance asset replacements and growth. The balance will be used to pay interest and principal on any remaining debt within the target or transferred to the acquiring company to pay dividends on its stock or for redeployment within the corporation.
HV is found by dividing the first long-run FCF by (WACC - g).