Embed Size (px)
Citation preview
10 - 1
Chapter 10: The Basics of Capital Budgeting:
Evaluating Cash FlowsOverview and “vocabulary”Methods
Payback, discounted paybackNPVIRR, MIRRProfitability Index
Unequal livesEconomic life
10 - 2
MINICASE 10
10 - 3
What is capital budgeting?
Analysis of potential projects.Long-term decisions; involve large
expenditures.Very important to firm’s future.
10 - 4
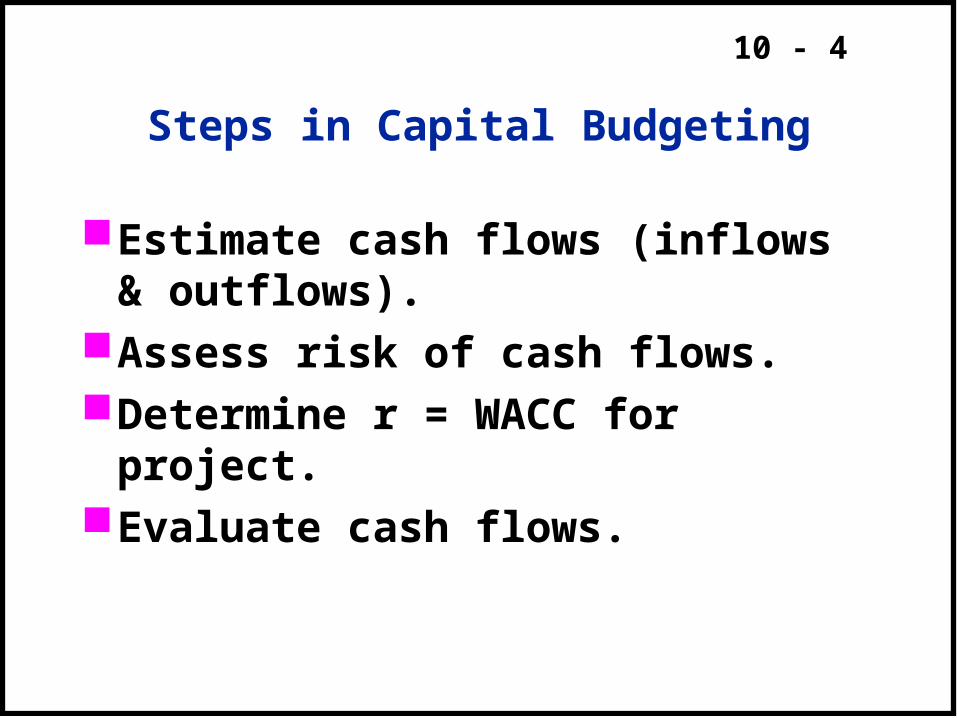
Steps in Capital Budgeting
Estimate cash flows (inflows & outflows).
Assess risk of cash flows.Determine r = WACC for project.Evaluate cash flows.
10 - 5
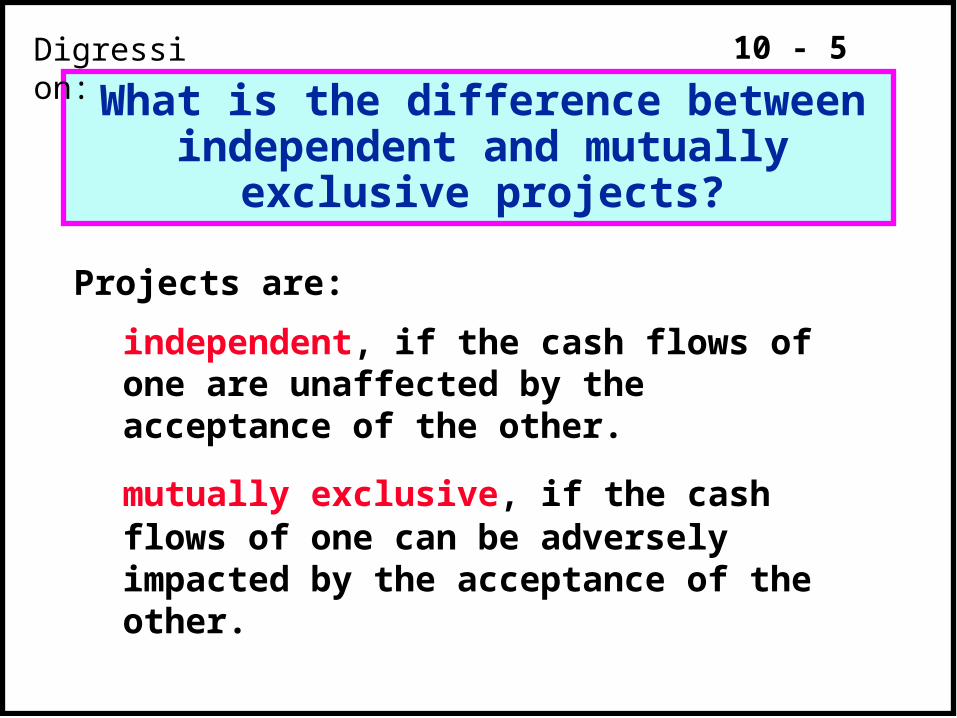
What is the difference between independent and mutually exclusive
projects?
Projects are:
independent, if the cash flows of one are unaffected by the acceptance of the other.
mutually exclusive, if the cash flows of one can be adversely impacted by the acceptance of the other.
Digression:

10 - 6
An Example of Mutually Exclusive Projects
BRIDGE VS. BOAT TO GET PRODUCTS ACROSS A RIVER.
10 - 7
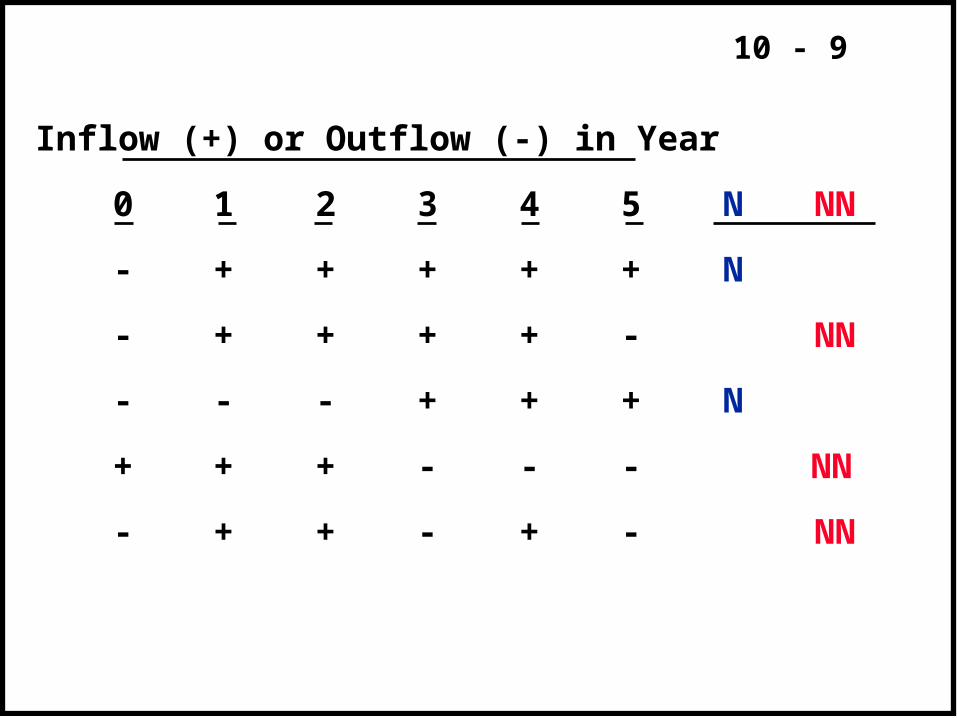
Normal Project
Nonnormal Project
10 - 8
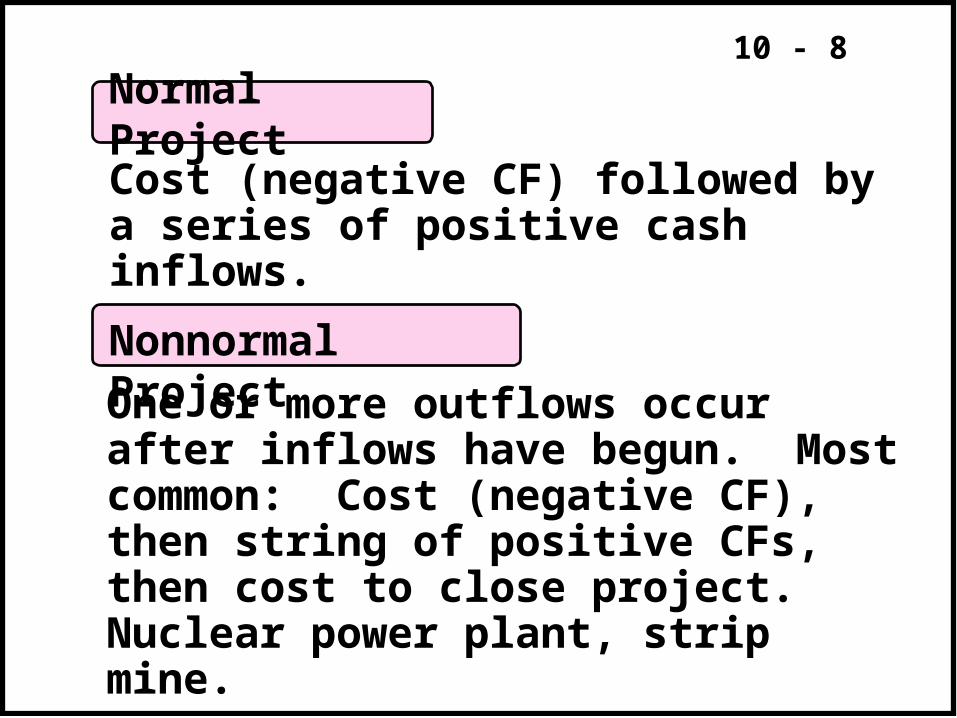
Normal Project
Cost (negative CF) followed by a series of positive cash inflows.
Nonnormal Project
One or more outflows occur after inflows have begun. Most common: Cost (negative CF), then string of positive CFs, then cost to close project. Nuclear power plant, strip mine.
10 - 9
Inflow (+) or Outflow (-) in Year
0 1 2 3 4 5 N NN
- + + + + + N
- + + + + - NN
- - - + + + N
+ + + - - - NN
- + + - + - NN
10 - 10
c(1). What is the payback period?
10 - 11
What is the payback period?
The number of years required to recover a project’s cost,
or how long does it take to get our money back?
10 - 12
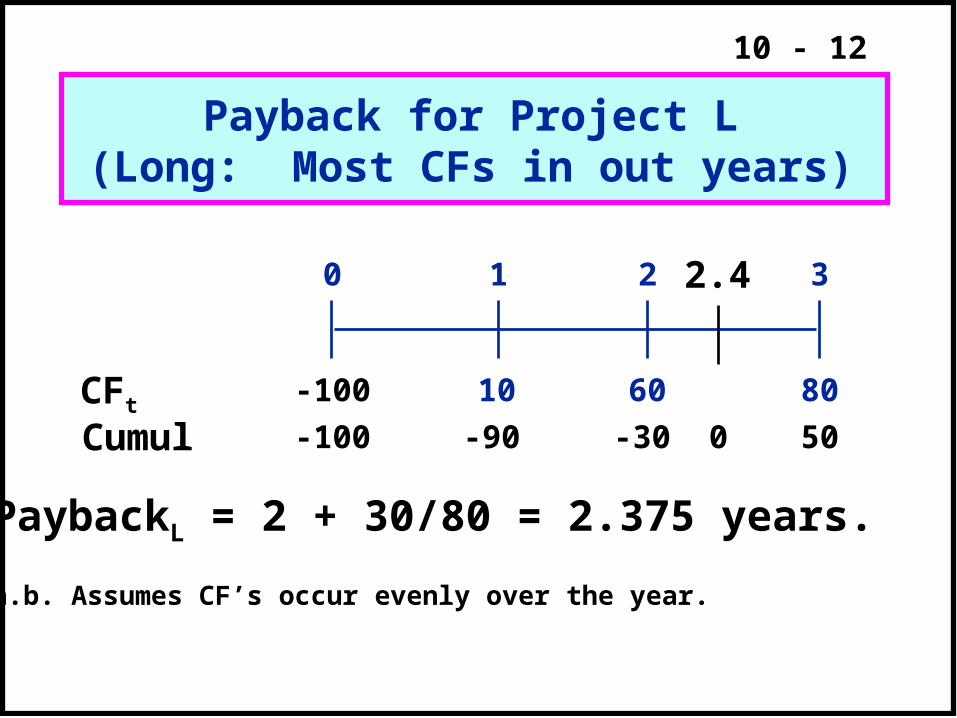
Payback for Project L(Long: Most CFs in out years)
10 8060
0 1 2 3
-100CFt
Cumul -100 -90 -30 50
PaybackL = 2 + 30/80 = 2.375 years.
n.b. Assumes CF’s occur evenly over the year.
0
2.4
10 - 13
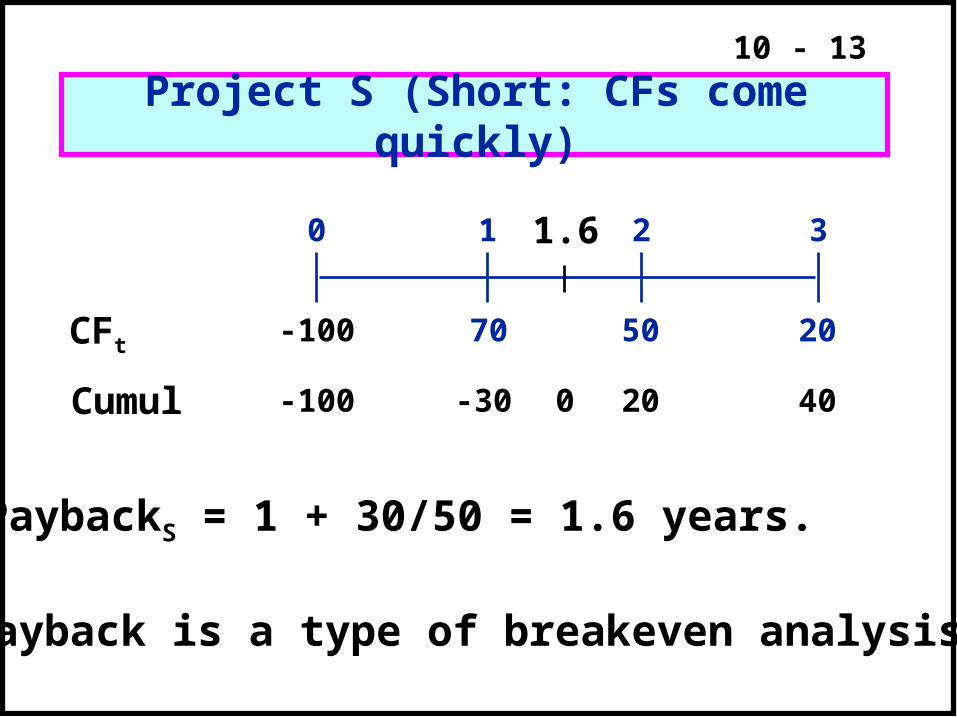
CFt
Cumul -100 -30 20 40
PaybackS = 1 + 30/50 = 1.6 years.
70 2050
0 1 2 3
Project S (Short: CFs come quickly)
-100
0
1.6
Payback is a type of breakeven analysis.
10 - 14
Weaknesses of Payback
Strengths of Payback
10 - 15
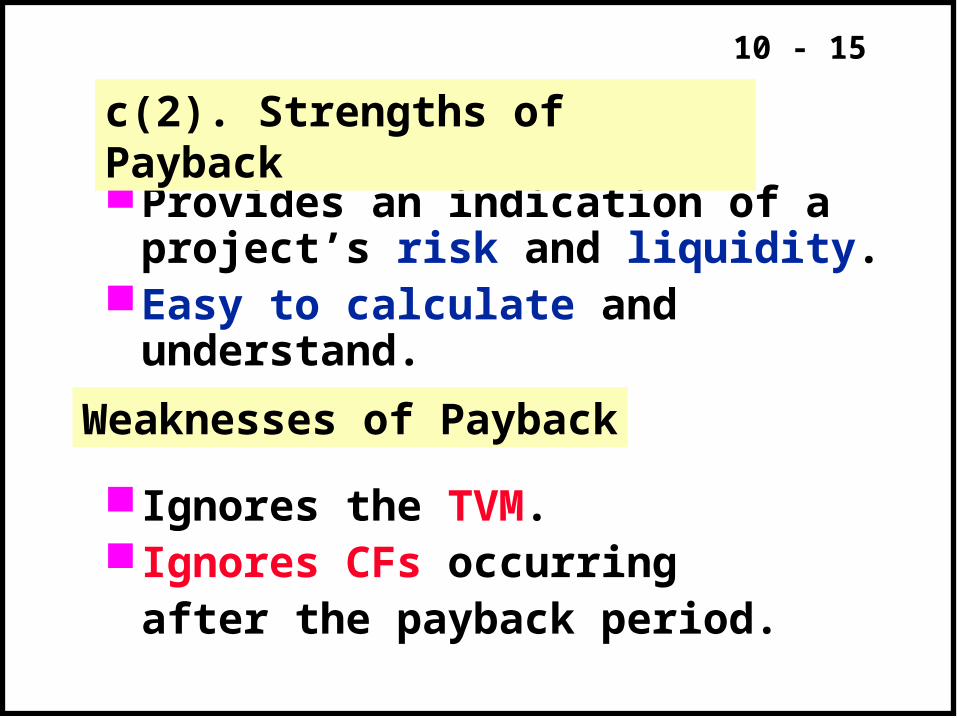
Ignores the TVM. Ignores CFs occurring
after the payback period.
Provides an indication of a project’s risk and liquidity.
Easy to calculate and understand.
Weaknesses of Payback
c(2). Strengths of Payback
10 - 16
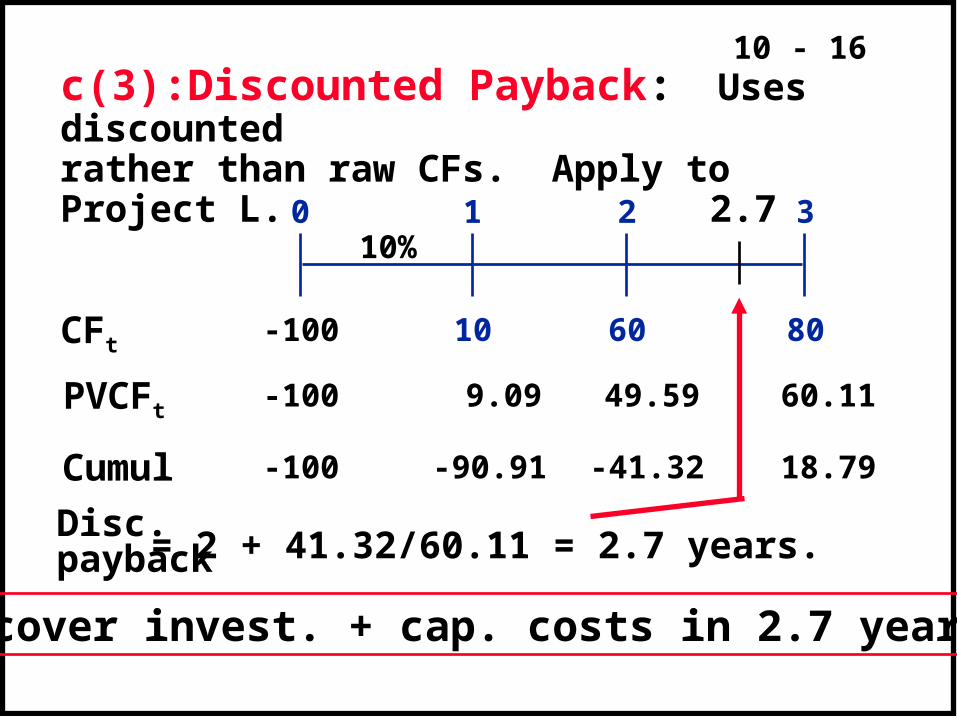
= 2 + 41.32/60.11 = 2.7 years.
-41.32
60.11
10 8060
0 1 2 3
CFt
Cumul -100 -90.91 18.79
Disc.payback
c(3):Discounted Payback: Uses discountedrather than raw CFs. Apply to Project L.
PVCFt -100
-100
10%
9.09 49.59
Recover invest. + cap. costs in 2.7 years.
2.7
10 - 17
d(1) Net Present Value (NPV)
10 - 18
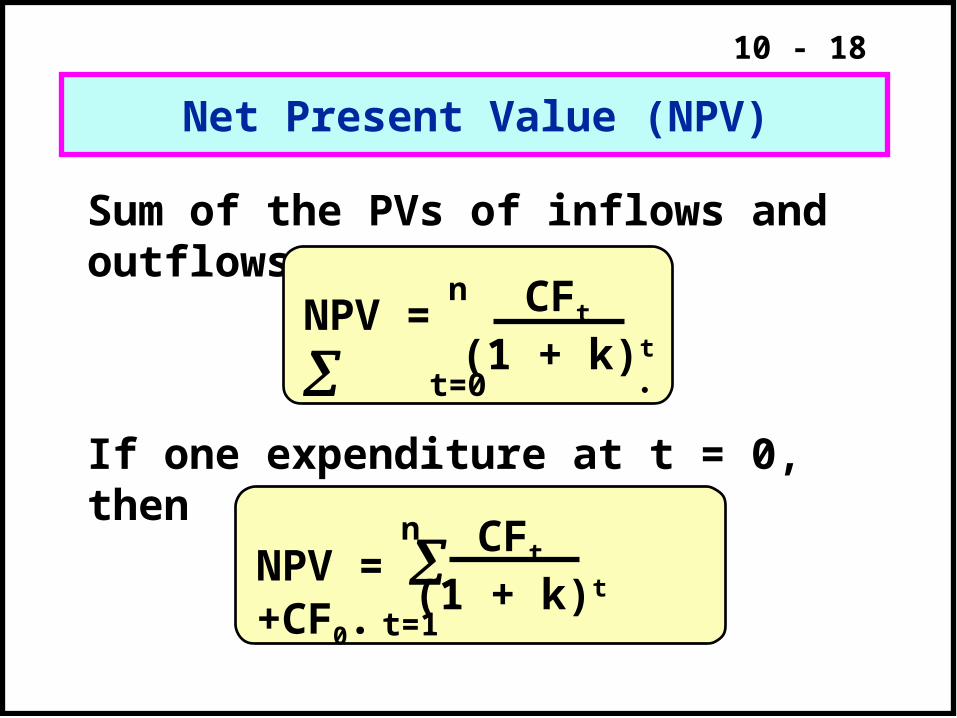
Sum of the PVs of inflows and outflows.
Net Present Value (NPV)
If one expenditure at t = 0, then
NPV =
n
t=0
CFt
(1 + k)t
NPV = +CF0.n
t=1
CFt
(1 + k)t
10 - 19
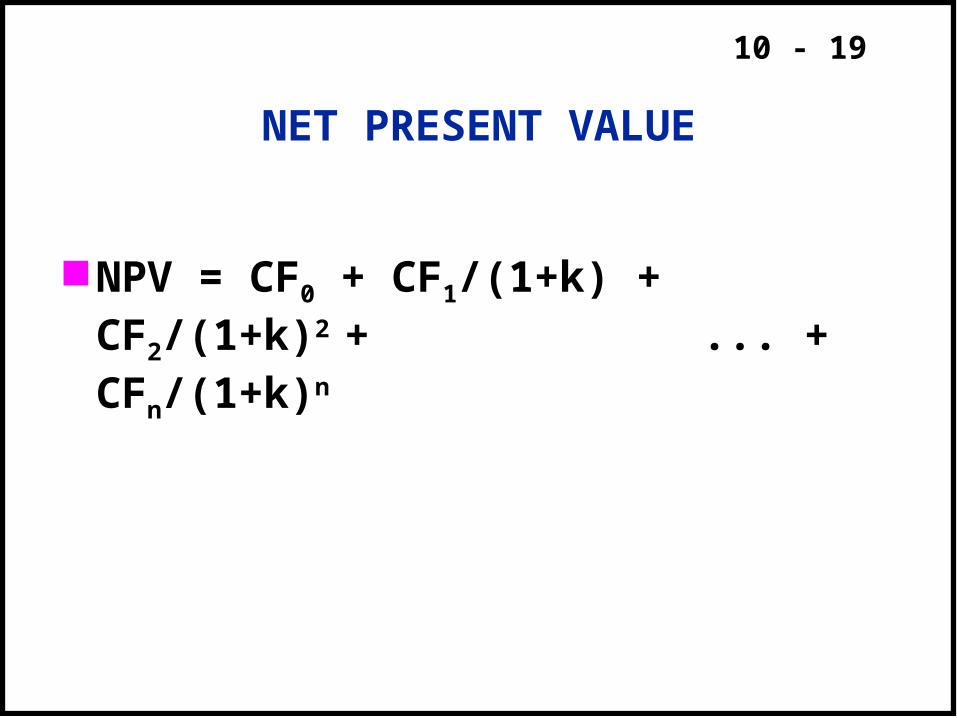
NET PRESENT VALUE
NPV = CF0 + CF1/(1+k) + CF2/(1+k)2 + ... + CFn/(1+k)n
10 - 20
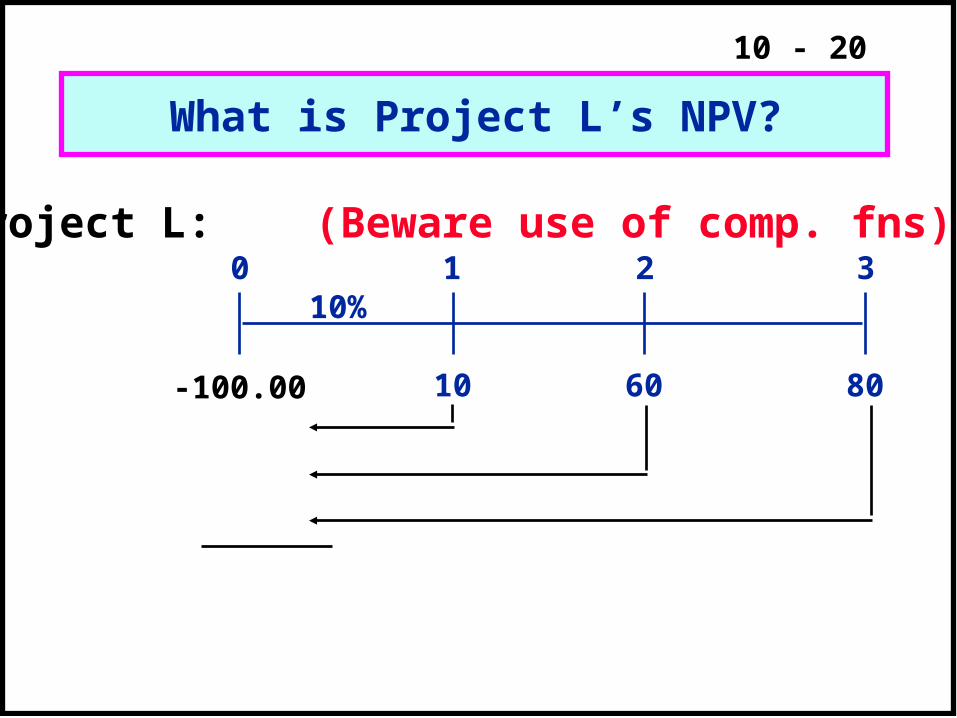
What is Project L’s NPV?
10 8060
0 1 2 310%
Project L: (Beware use of comp. fns)
-100.00
10 - 21
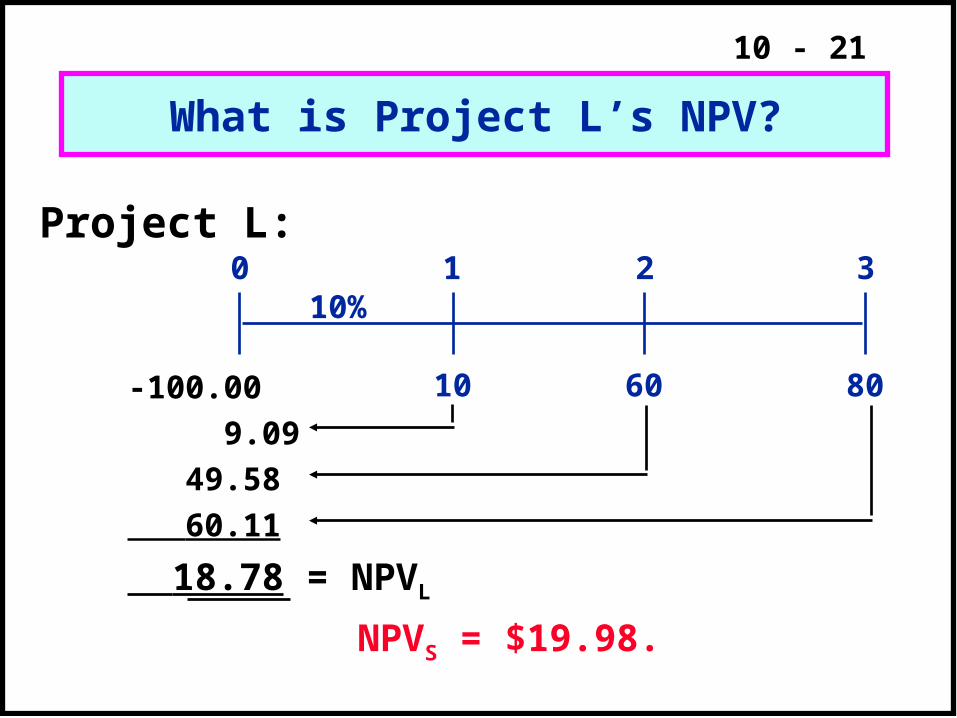
What is Project L’s NPV?
10 8060
0 1 2 310%
Project L:
-100.00
9.09
49.58
60.11
18.78 = NPVL
NPVS = $19.98.
10 - 22
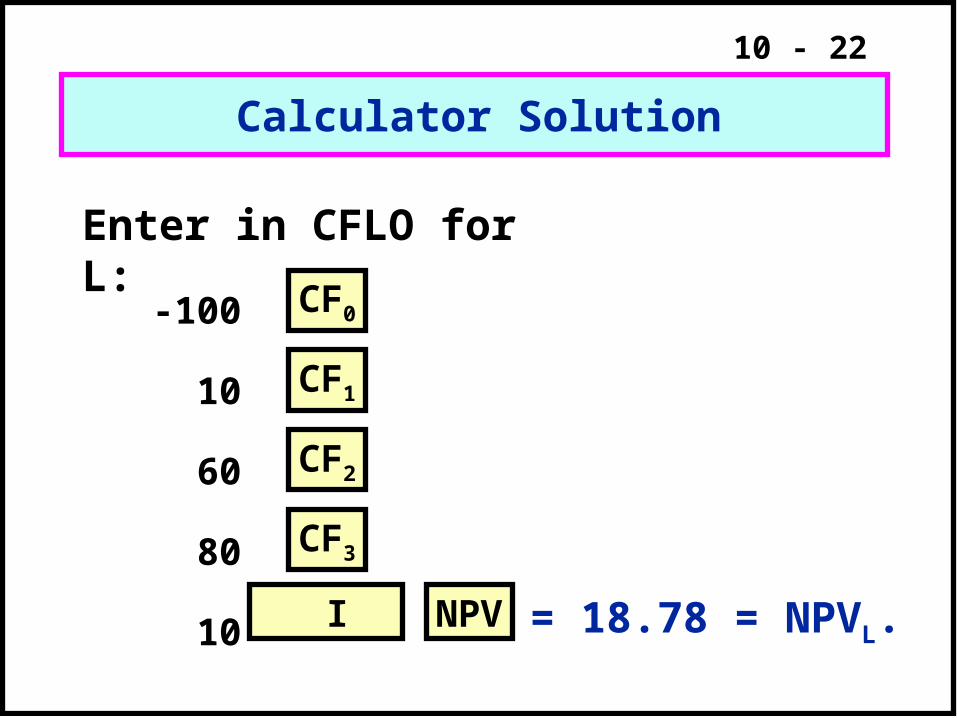
= 18.78 = NPVL.
Calculator Solution
Enter in CFLO for L:
-100
10
60
80
10
CF0
CF1
NPV
CF2
CF3
I
10 - 23
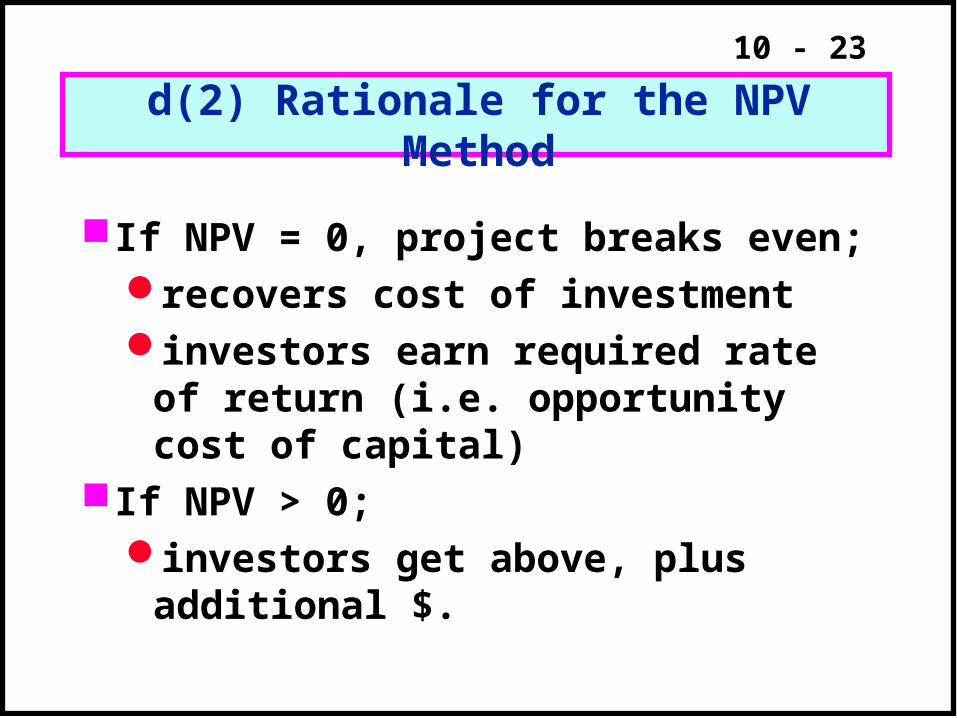
d(2) Rationale for the NPV Method
If NPV = 0, project breaks even;recovers cost of investmentinvestors earn required rate of
return (i.e. opportunity cost of capital)
If NPV > 0;investors get above, plus additional
$.
10 - 24
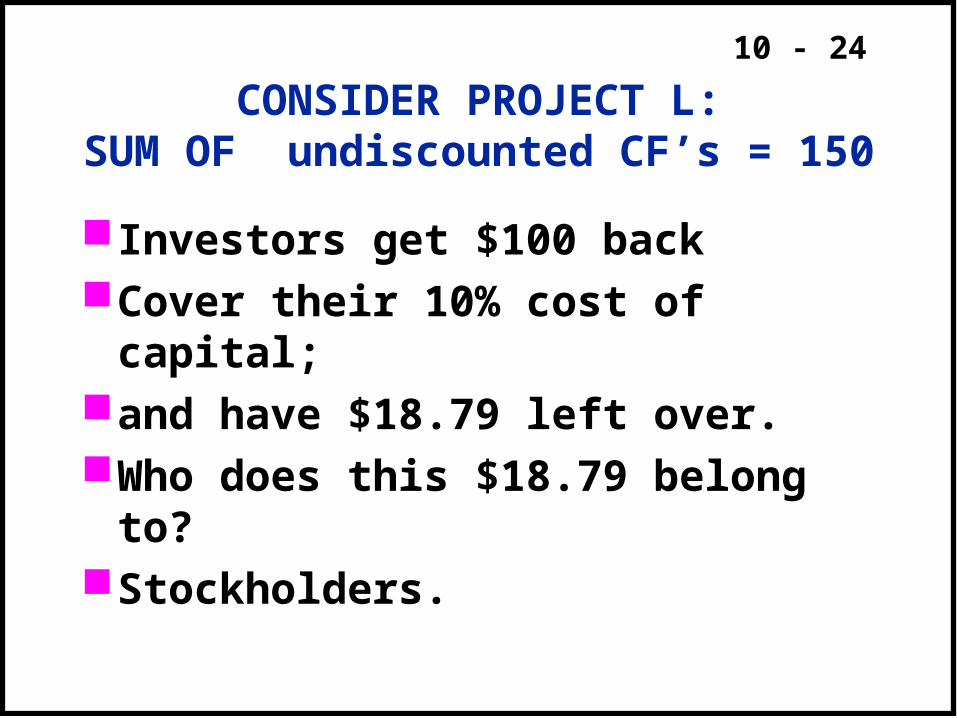
CONSIDER PROJECT L:SUM OF undiscounted CF’s = 150
Investors get $100 backCover their 10% cost of capital;and have $18.79 left over.Who does this $18.79 belong to?Stockholders.
10 - 25
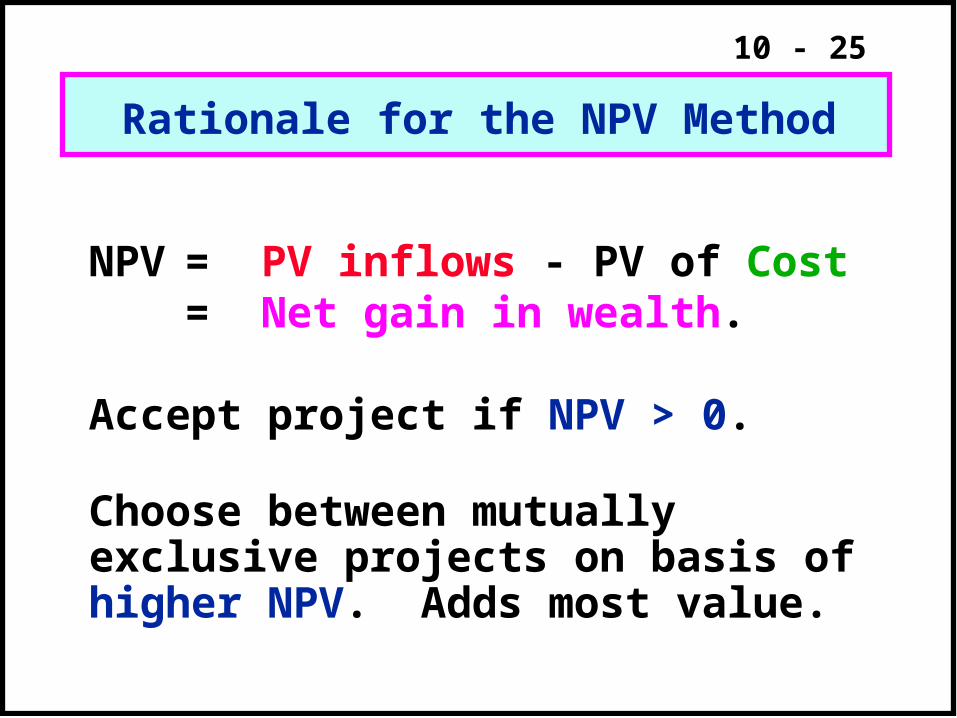
NPV = PV inflows - PV of Cost= Net gain in wealth.
Accept project if NPV > 0.
Choose between mutually exclusive projects on basis ofhigher NPV. Adds most value.
Rationale for the NPV Method
10 - 26
Using NPV method, which project(s) should be accepted?
If Projects S and L are mutually exclusive, ?
If S & L are independent, ?
10 - 27
Using NPV method, which project(s) should be accepted?
If Projects S and L are mutually exclusive,…..
If S & L are independent, accept…..What happens to the NPV as the
cost of capital changes?
10 - 28
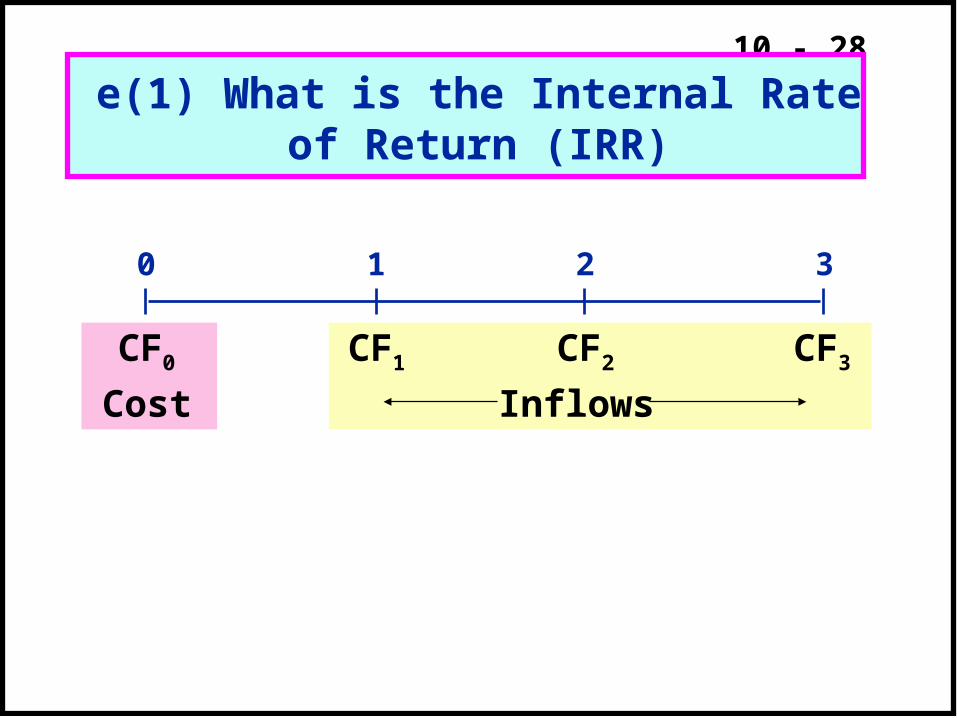
e(1) What is the Internal Rate of Return (IRR)
0 1 2 3
CF0 CF1 CF2 CF3
Cost Inflows
10 - 29
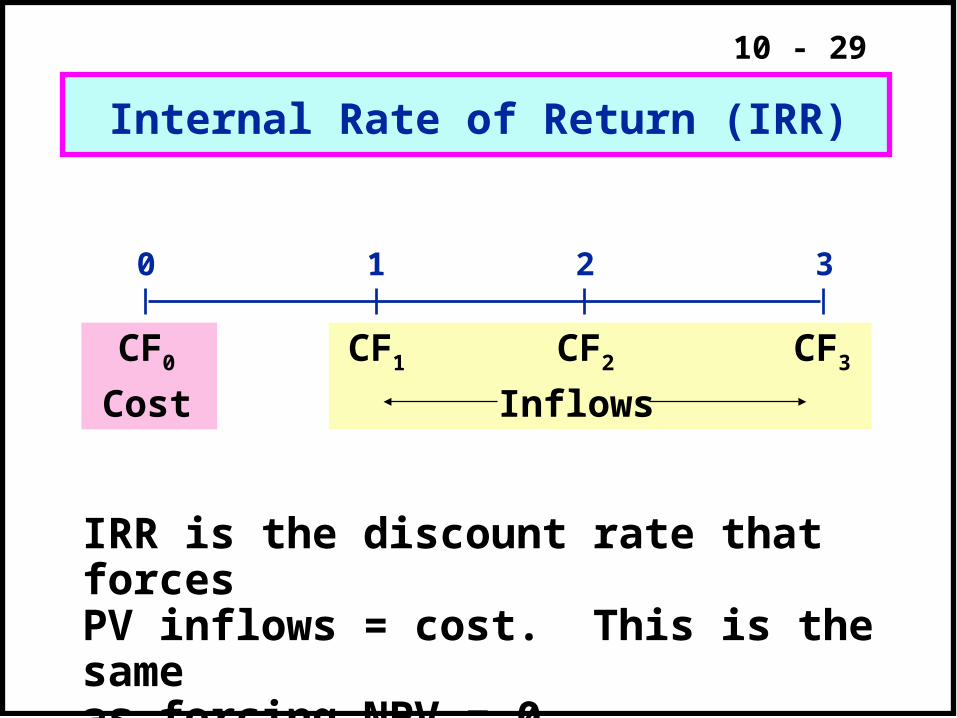
Internal Rate of Return (IRR)
0 1 2 3
CF0 CF1 CF2 CF3
Cost Inflows
IRR is the discount rate that forcesPV inflows = cost. This is the sameas forcing NPV = 0.
10 - 30
t
nt
t
CF
IRR
0 10.
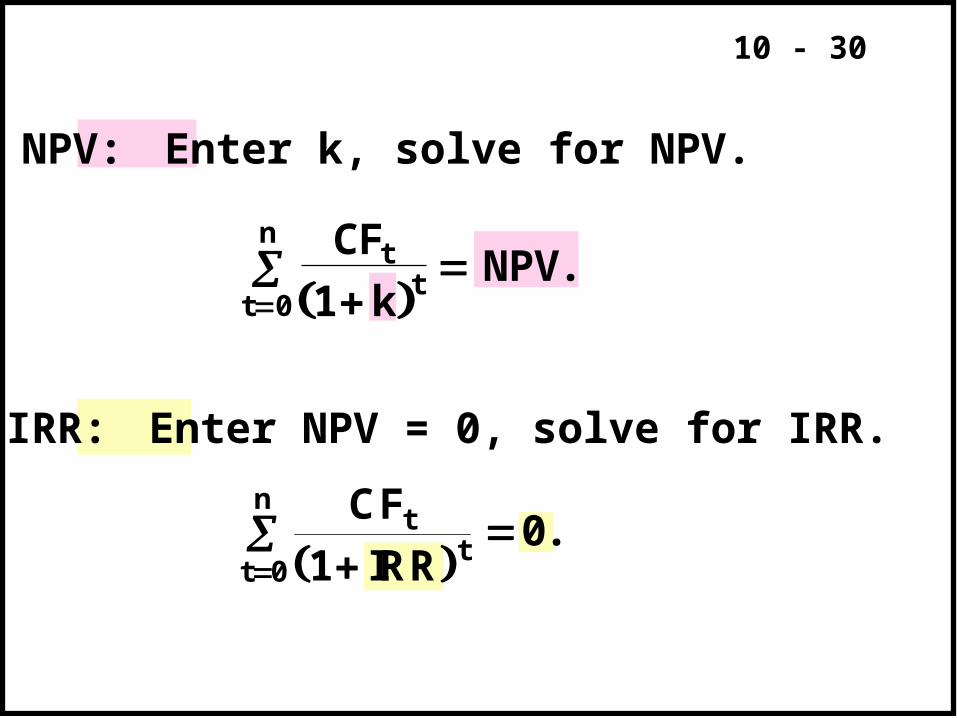
NPV: Enter k, solve for NPV.
IRR: Enter NPV = 0, solve for IRR.
t
nt
tCF
kNPV
0 1.
10 - 31
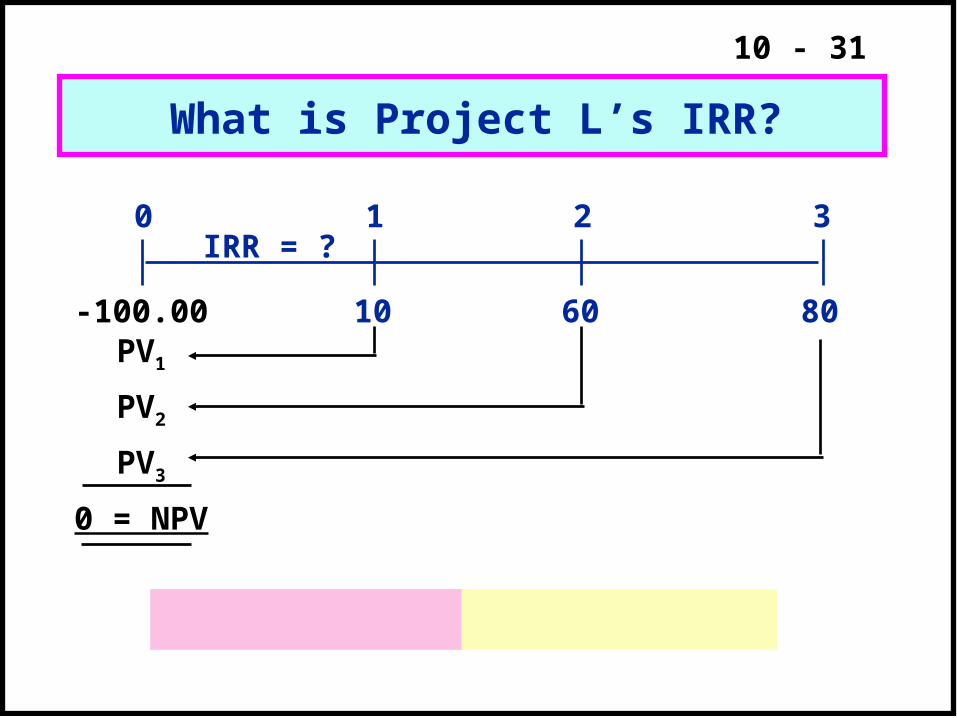
What is Project L’s IRR?
10 8060
0 1 2 3IRR = ?
-100.00
PV3
PV2
PV1
0 = NPV
10 - 32
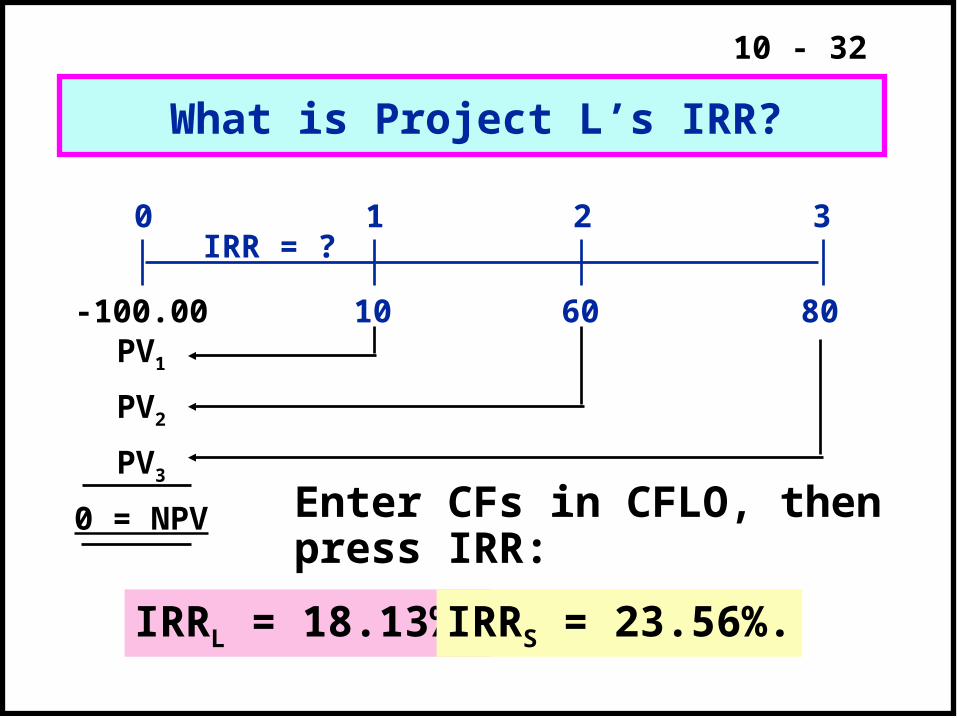
What is Project L’s IRR?
10 8060
0 1 2 3IRR = ?
-100.00
PV3
PV2
PV1
0 = NPV Enter CFs in CFLO, then press IRR:
IRRL = 18.13%. IRRS = 23.56%.
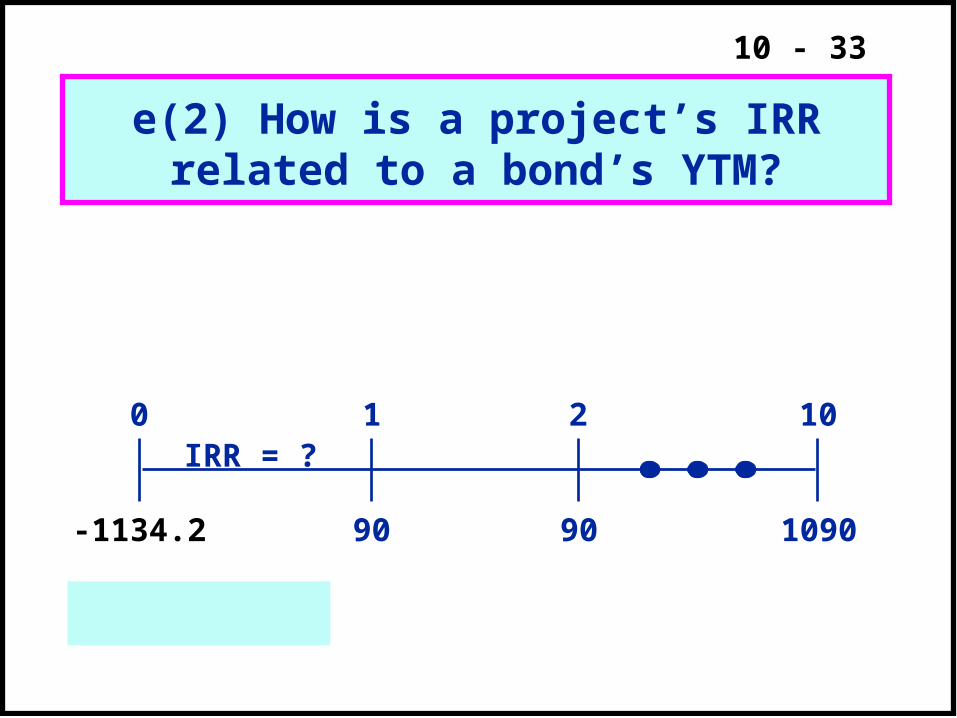
10 - 33
90 109090
0 1 2 10IRR = ?
e(2) How is a project’s IRR related to a bond’s YTM?
-1134.2
10 - 34
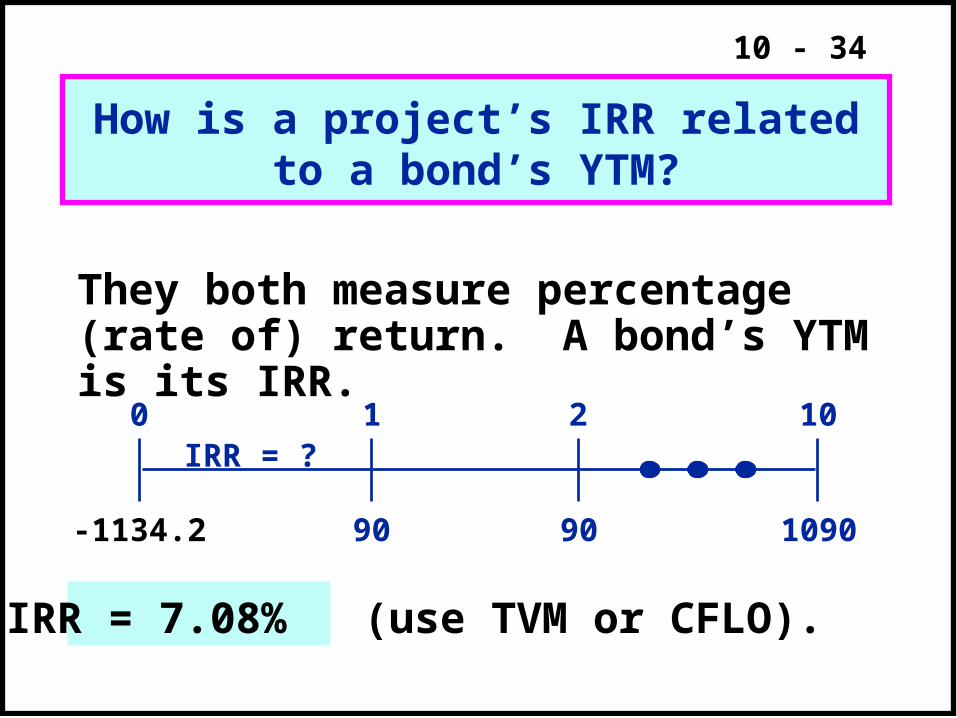
90 109090
0 1 2 10IRR = ?
How is a project’s IRR related to a bond’s YTM?
They both measure percentage (rate of) return. A bond’s YTM is its IRR.
-1134.2
IRR = 7.08% (use TVM or CFLO).
10 - 35
e(3) Rationale for the IRR Method?
10 - 36
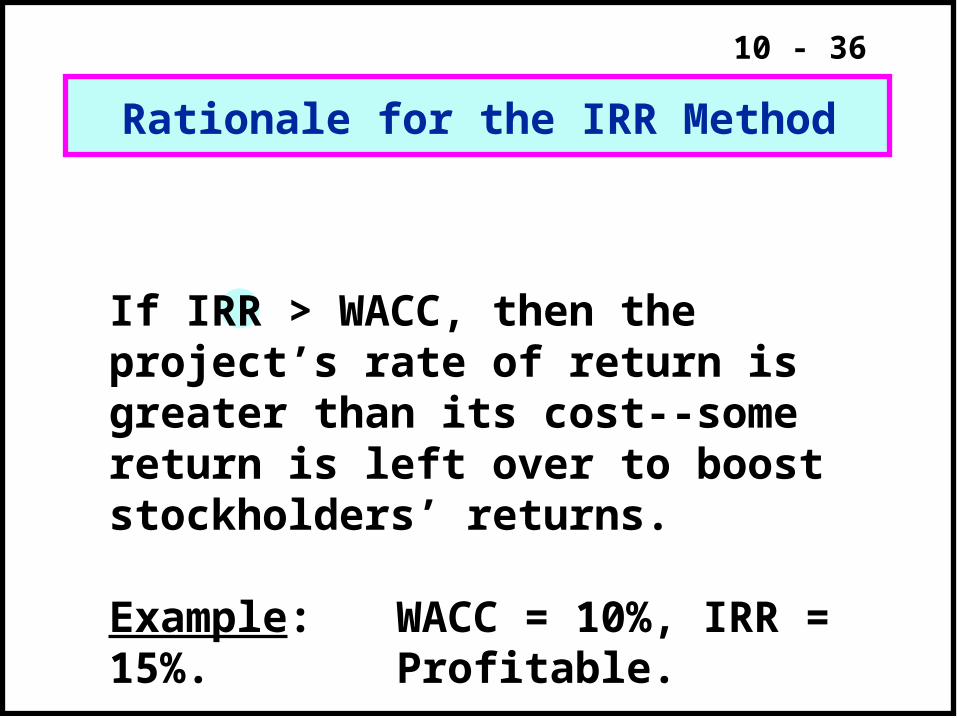
Rationale for the IRR Method
If IRR > WACC, then the project’s rate of return is greater than its cost--some return is left over to boost stockholders’ returns.
Example:WACC = 10%, IRR = 15%. Profitable.
10 - 37
If IRR > k, accept project.
If IRR < k, reject project.
IRR Acceptance Criteria
10 - 38
Using IRR method, which project(s) should be accepted?
10 - 39
If S and L are independent, ……….
If S and L are mutually exclusive, accept………….
What effect does a change in the cost of capital have on the IRR?
Using IRR method, which project(s) should be accepted?
10 - 40
f(1) Define Profitability Index (PI)
10 - 41
PI = . PV of inflows PV of outflows
Define Profitability Index (PI)
PI measures a project’s “bang for the buck”.
10 - 42
Calculate each project’s PI.
10 - 43
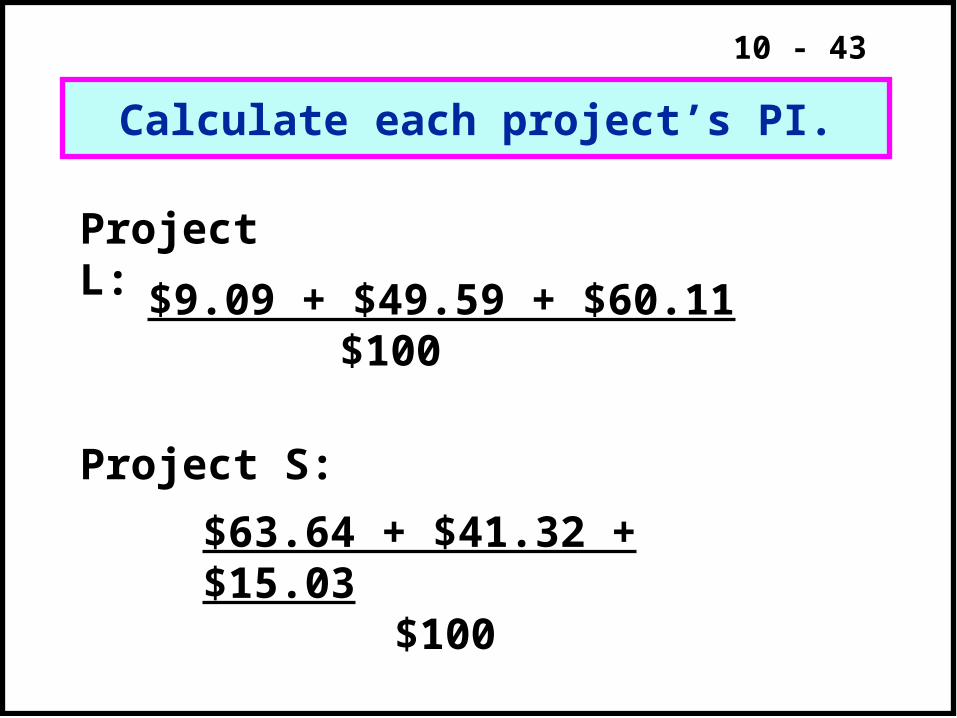
Calculate each project’s PI.
Project L:
$9.09 + $49.59 + $60.11$100
Project S:
$63.64 + $41.32 + $15.03$100
PIL = = 1.19.
PIS = = 1.20.
10 - 44
PI Acceptance Criteria
10 - 45
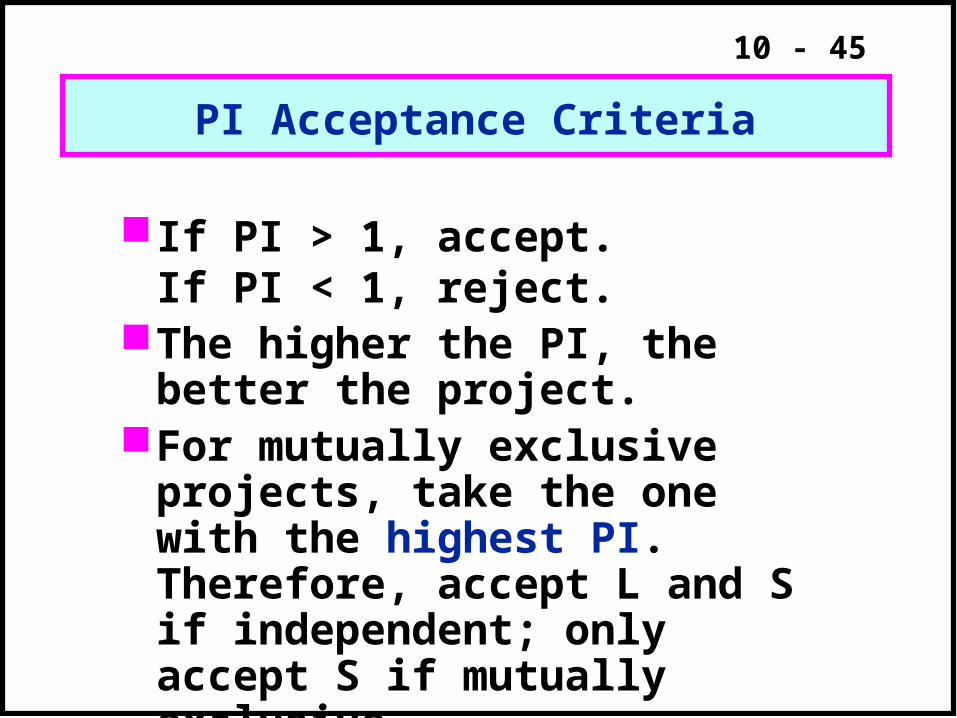
If PI > 1, accept.If PI < 1, reject.
The higher the PI, the better the project.
For mutually exclusive projects, take the one with the highest PI. Therefore, accept L and S if independent; only accept S if mutually exclusive.
Any problems with using PI?
PI Acceptance Criteria
10 - 46
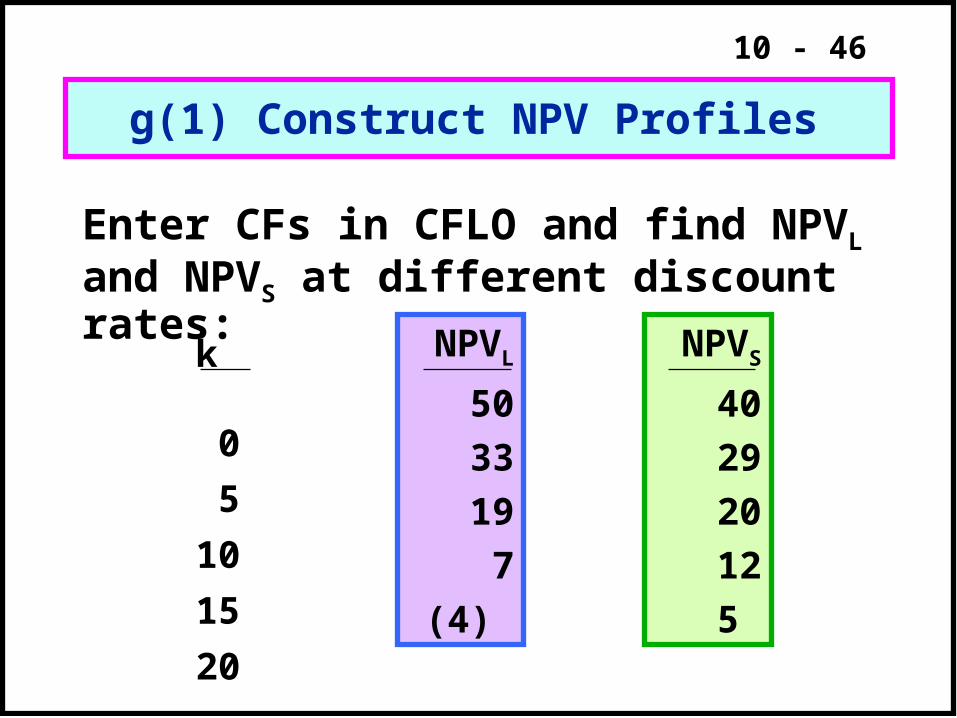
g(1) Construct NPV Profiles
Enter CFs in CFLO and find NPVL and NPVS at different discount rates:
k 0
5
10
15
20
NPVL
50
33
19
7
(4)
NPVS
40
29
20
12
5
10 - 47
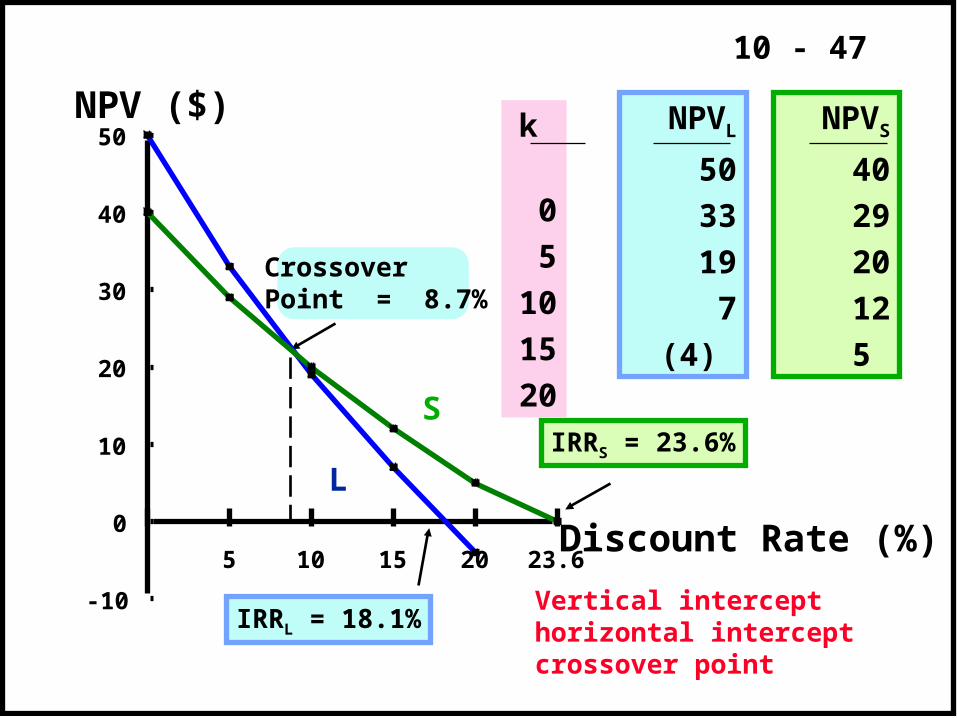
NPV ($)
Discount Rate (%)
IRRL = 18.1%
IRRS = 23.6%
Crossover Point = 8.7%
k
0
5
10
15
20
NPVL
50
33
19
7
(4)
NPVS
40
29
20
12
5
S
L
-10
0
10
20
30
40
50
5 10 15 20 23.6
Vertical intercepthorizontal interceptcrossover point
10 - 48
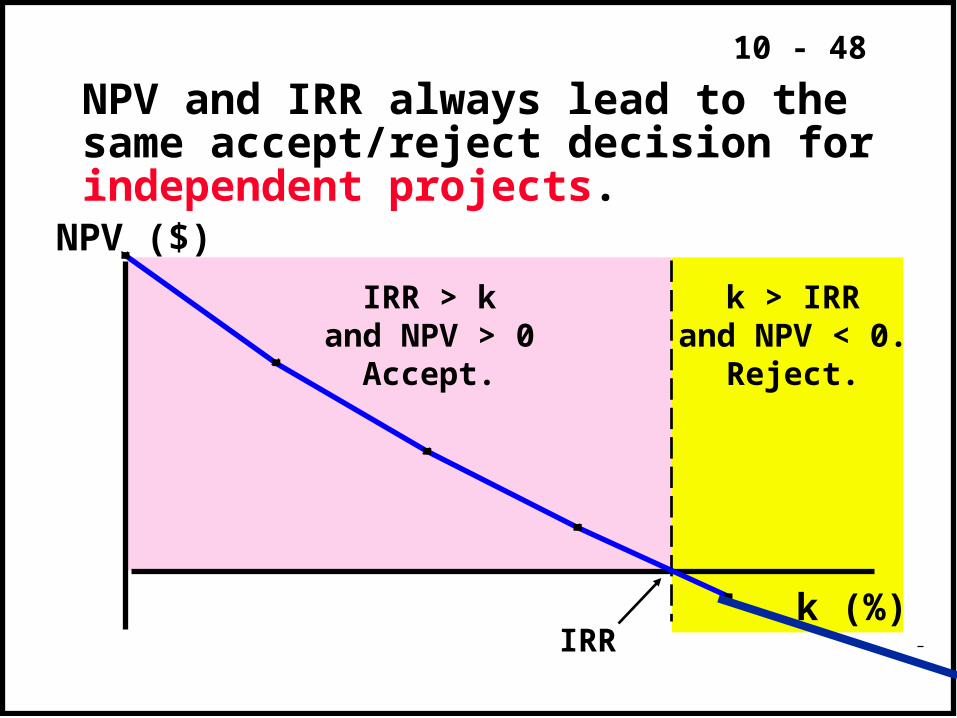
NPV and IRR always lead to the same accept/reject decision for independent projects.
k > IRRand NPV < 0.
Reject.
NPV ($)
k (%)IRR
IRR > kand NPV > 0
Accept.
10 - 49
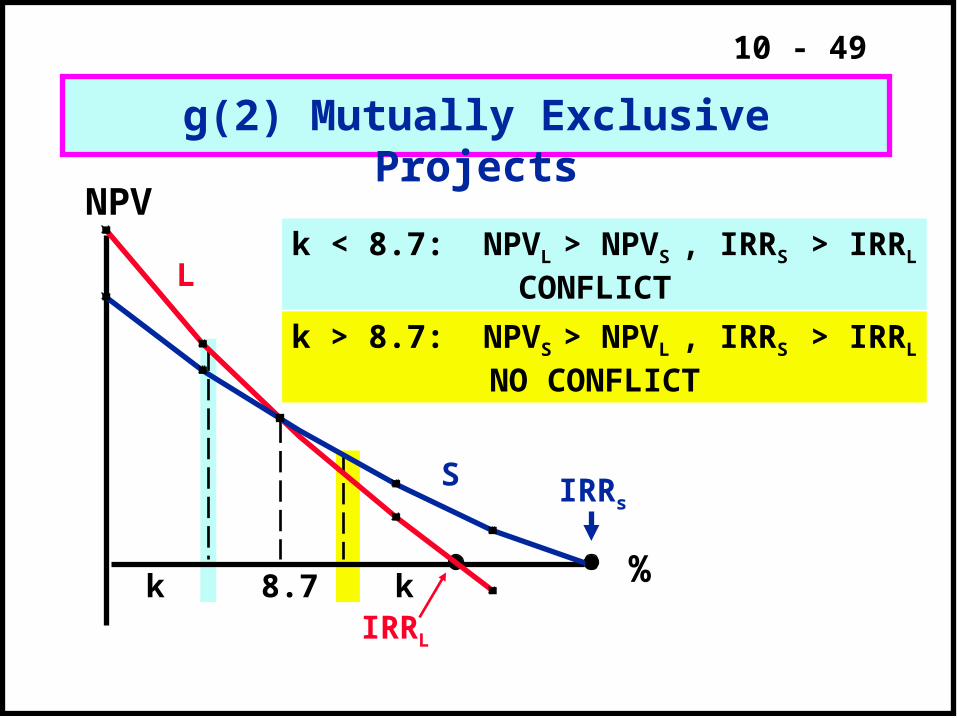
g(2) Mutually Exclusive Projects
k 8.7 k
NPV
%
IRRs
IRRL
L
S
k < 8.7: NPVL > NPVS , IRRS > IRRL
CONFLICT
k > 8.7: NPVS > NPVL , IRRS > IRRL
NO CONFLICT
10 - 50
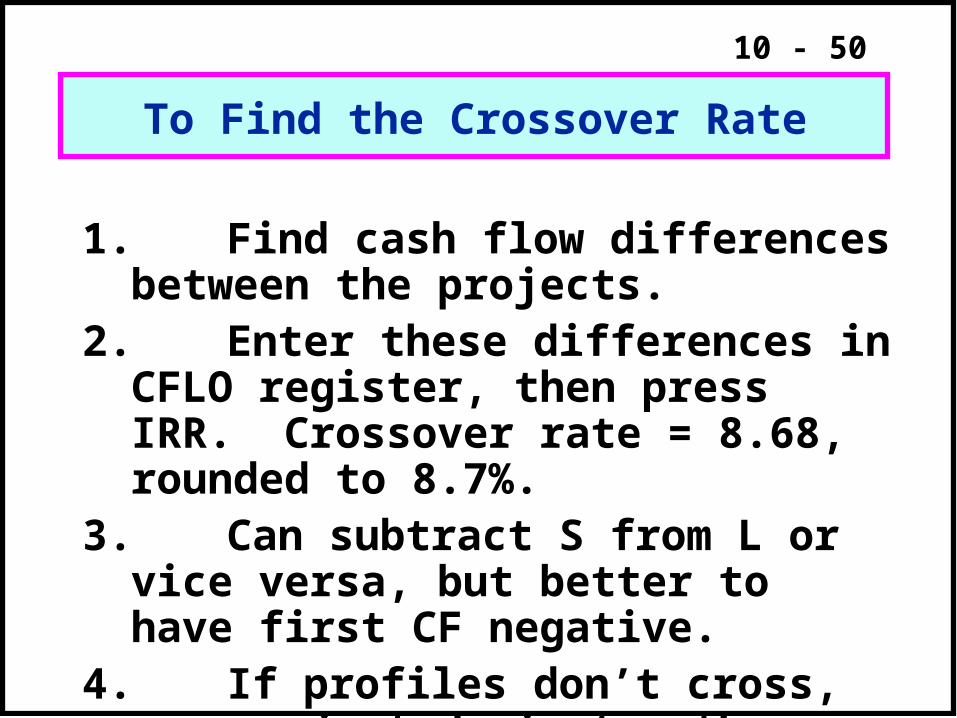
To Find the Crossover Rate
1. Find cash flow differences between the projects.
2. Enter these differences in CFLO register, then press IRR. Crossover rate = 8.68, rounded to 8.7%.
3. Can subtract S from L or vice versa, but better to have first CF negative.
4. If profiles don’t cross, one project dominates the other.
10 - 51
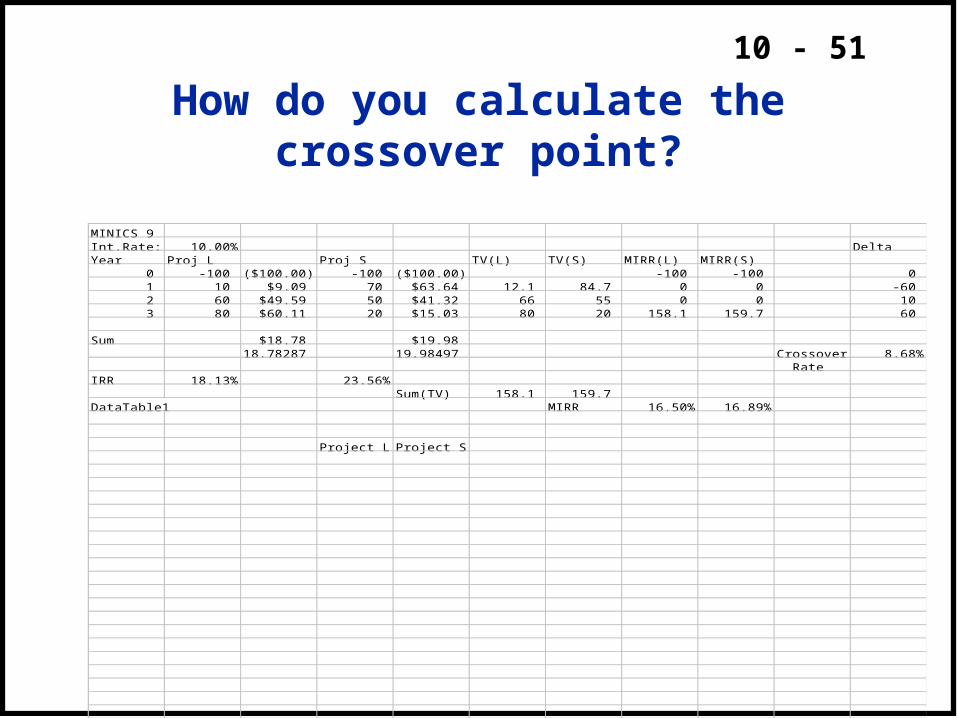
How do you calculate the crossover point?
MINICS 9Int.Rate: 10.00% DeltaYear Proj L Proj S TV(L) TV(S) MIRR(L) MIRR(S)
0 -100 ($100.00) -100 ($100.00) -100 -100 01 10 $9.09 70 $63.64 12.1 84.7 0 0 -602 60 $49.59 50 $41.32 66 55 0 0 103 80 $60.11 20 $15.03 80 20 158.1 159.7 60
Sum $18.78 $19.9818.78287 19.98497 Crossover 8.68%
RateIRR 18.13% 23.56%
Sum(TV) 158.1 159.7DataTable1 MIRR 16.50% 16.89%
Project L Project S
Project L Project S

10 - 52
Which project do you choose?
10 - 53
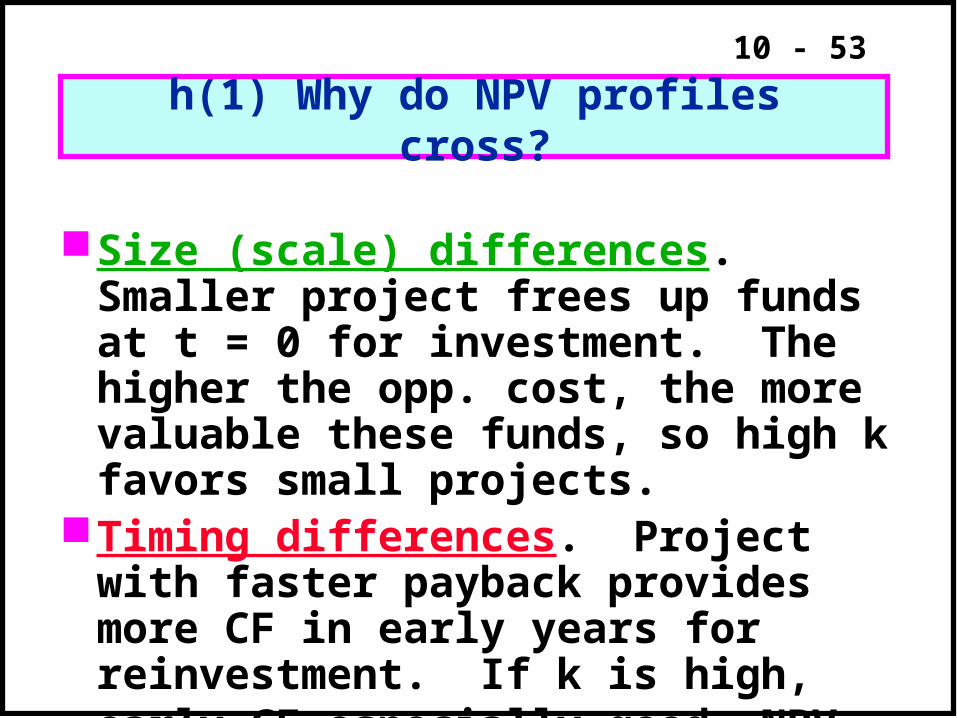
Size (scale) differences. Smaller project frees up funds at t = 0 for investment. The higher the opp. cost, the more valuable these funds, so high k favors small projects.
Timing differences. Project with faster payback provides more CF in early years for reinvestment. If k is high, early CF especially good, NPVS > NPVL.
h(1) Why do NPV profiles cross?
10 - 54
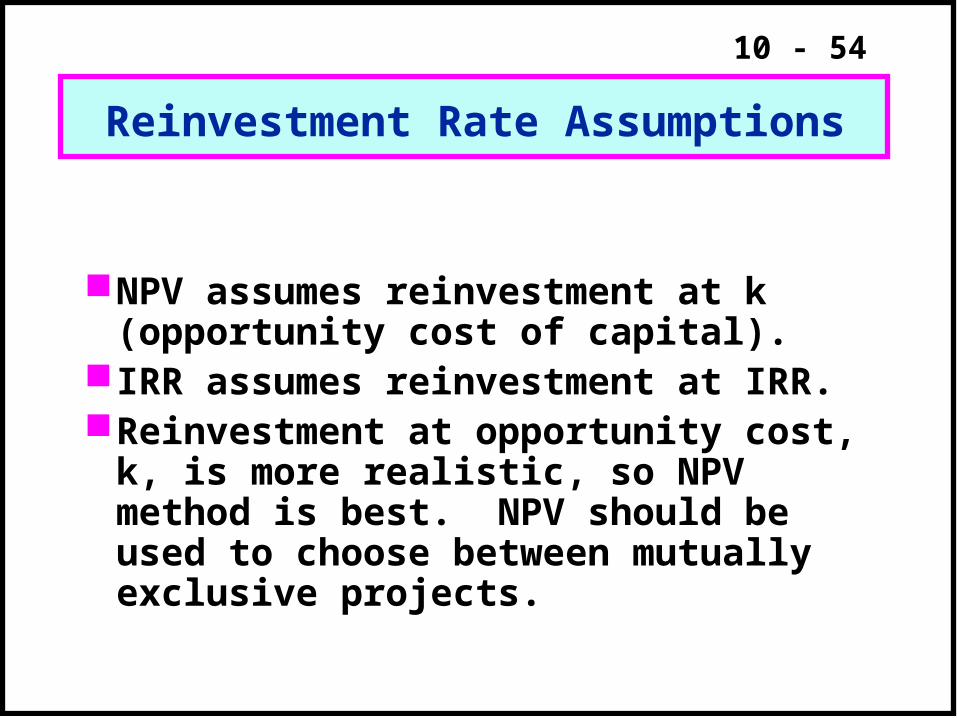
NPV assumes reinvestment at k (opportunity cost of capital).
IRR assumes reinvestment at IRR.Reinvestment at opportunity cost, k,
is more realistic, so NPV method is best. NPV should be used to choose between mutually exclusive projects.
Reinvestment Rate Assumptions
10 - 55
i(1) Managers prefer IRR to NPV. Can we give them a better IRR?
10 - 56
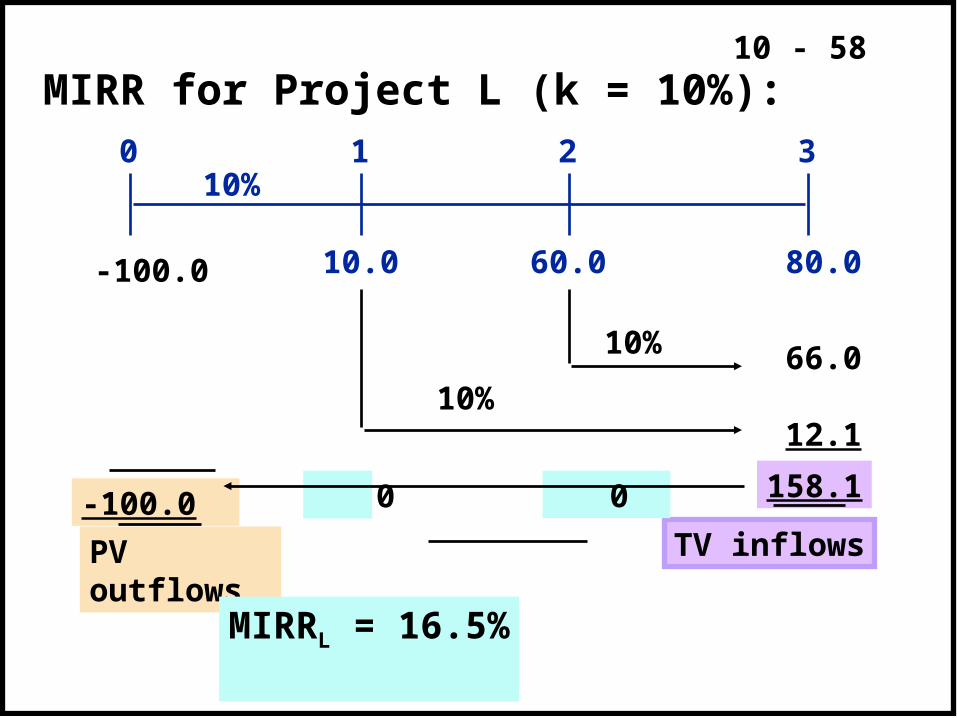
Yes, modified IRR (MIRR) is the discount rate which causes the PV of a project’s terminal value (TV) to equal the PV of costs. TV is found by compounding inflows at WACC.Thus, MIRR forces cash inflows to be reinvested at WACC.
Managers prefer IRR to NPV. Can we give them a better IRR?
10 - 57
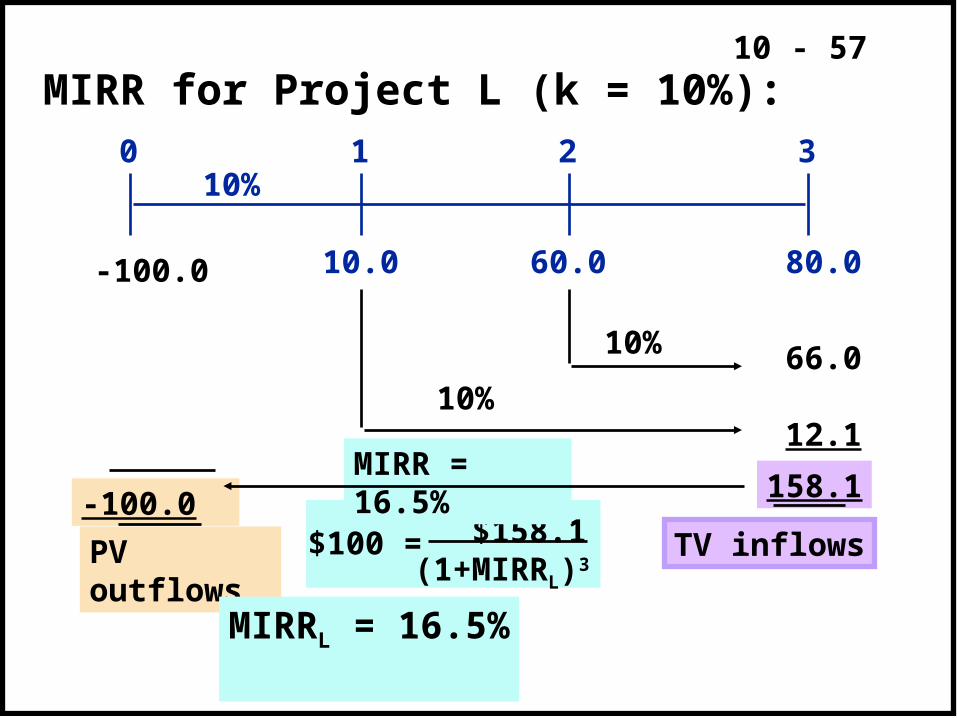
$158.1(1+MIRRL)3
10.0 80.060.0
0 1 2 310%
66.0
12.1
158.1
MIRR for Project L (k = 10%):
-100.0
10%
10%
TV inflows-100.0
PV outflows
MIRR = 16.5%
MIRRL = 16.5%
$100 =
10 - 58
0
10.0 80.060.0
0 1 2 310%
66.0
12.1
158.1
MIRR for Project L (k = 10%):
-100.0
10%
10%
TV inflows-100.0
PV outflows
0
MIRRL = 16.5%
10 - 59
EXCEL HAS MIRR FUNCTION!
10 - 60
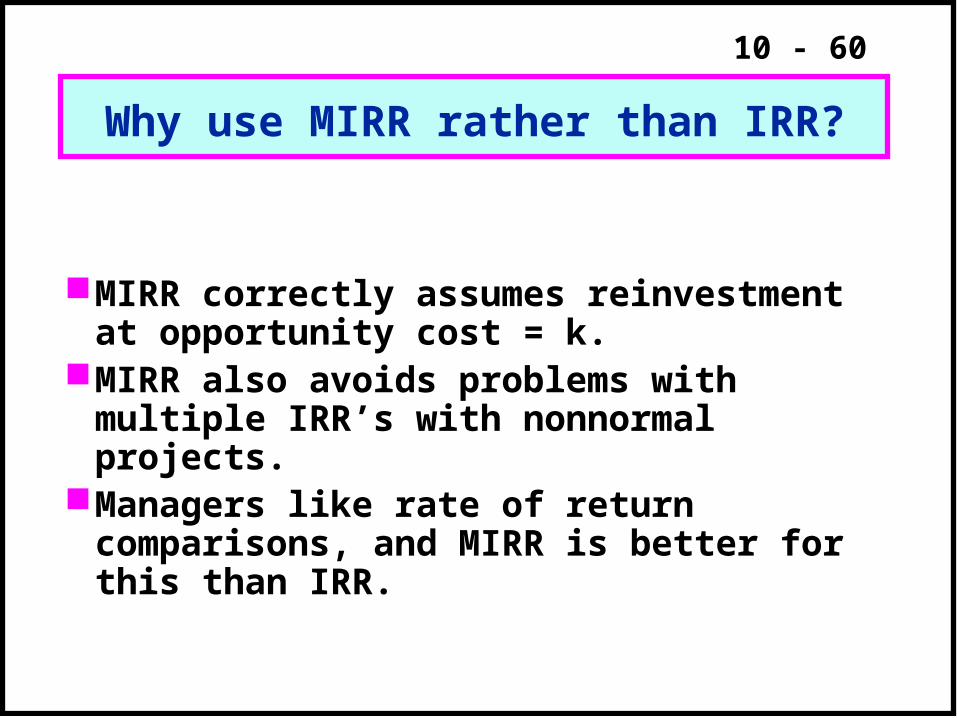
MIRR correctly assumes reinvestment at opportunity cost = k.
MIRR also avoids problems with multiple IRR’s with nonnormal projects.
Managers like rate of return comparisons, and MIRR is better for this than IRR.
Why use MIRR rather than IRR?
10 - 61
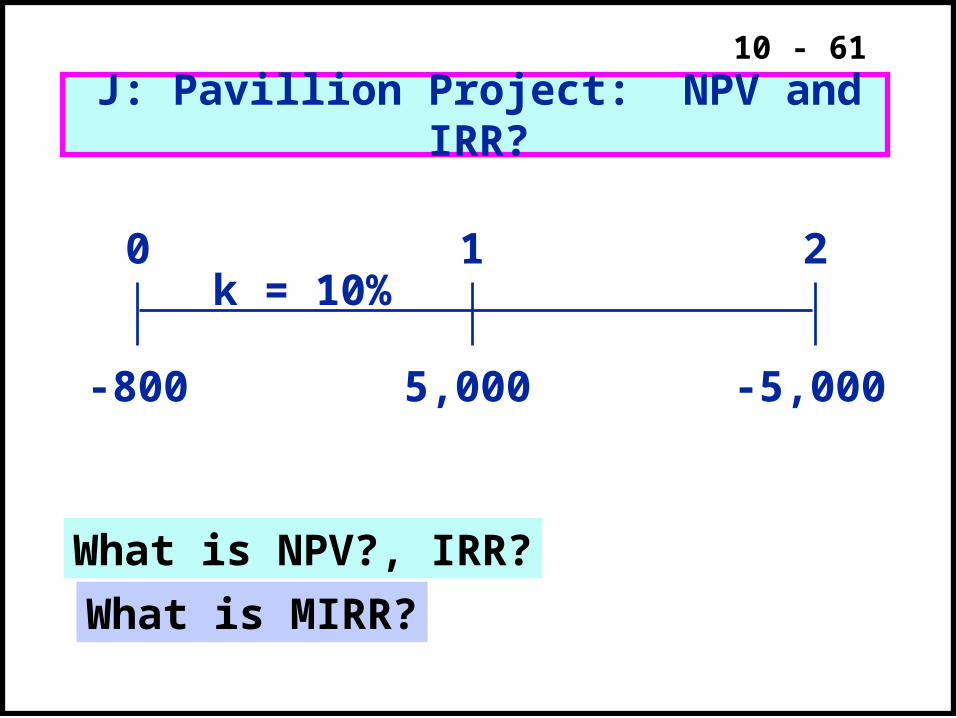
J: Pavillion Project: NPV and IRR?
5,000 -5,000
0 1 2k = 10%
-800
What is NPV?, IRR?
What is MIRR?
10 - 62
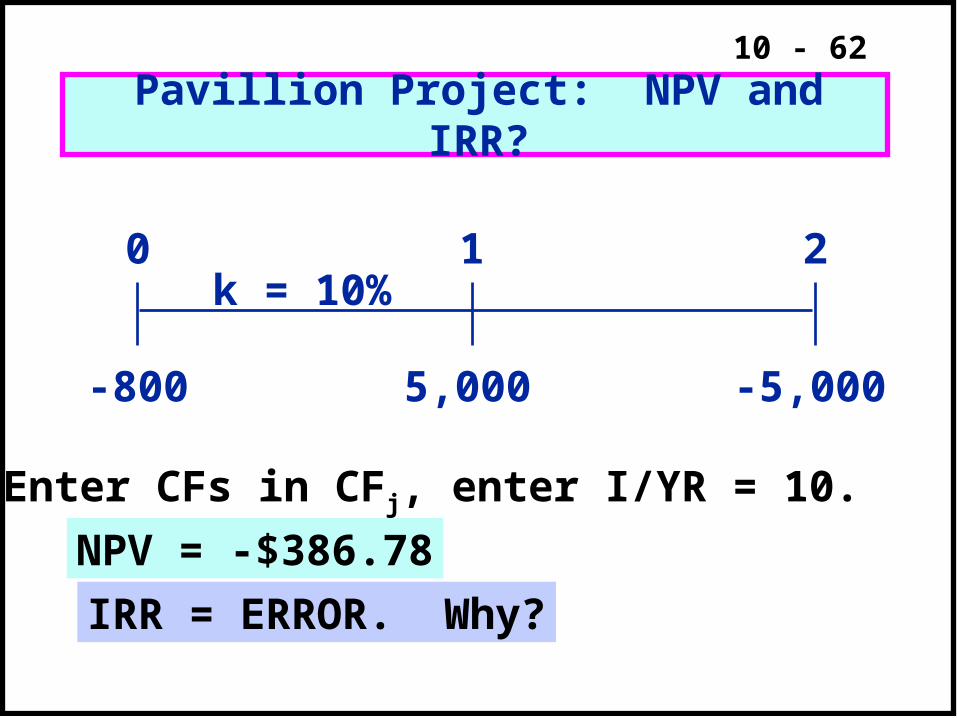
Pavillion Project: NPV and IRR?
5,000 -5,000
0 1 2k = 10%
-800
Enter CFs in CFj, enter I/YR = 10.
NPV = -$386.78
IRR = ERROR. Why?
10 - 63
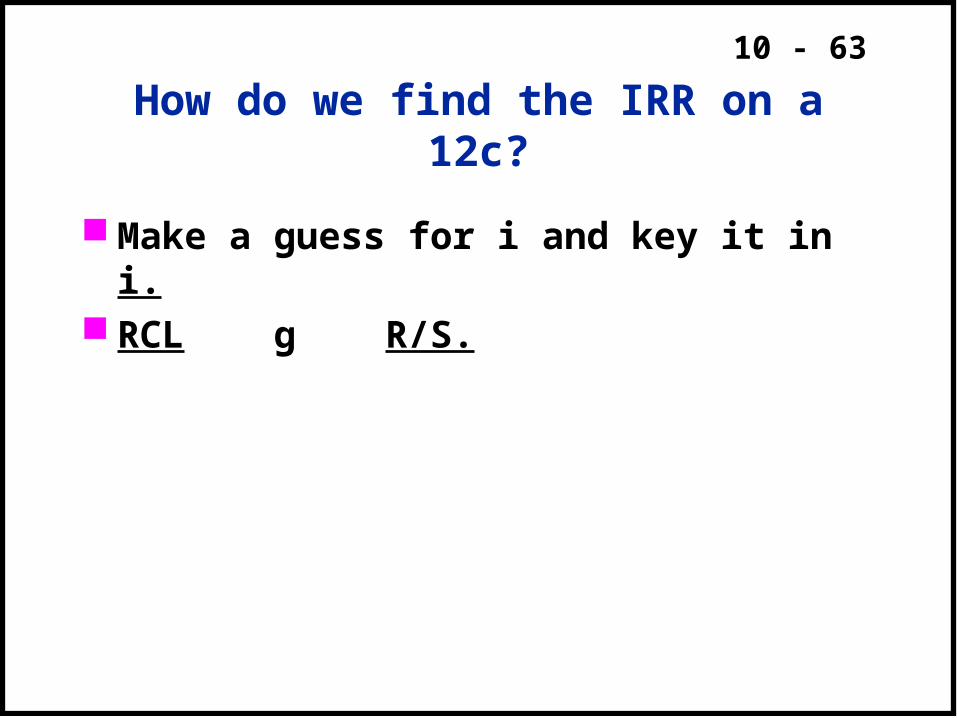
How do we find the IRR on a 12c?
Make a guess for i and key it in i. RCL g R/S.
10 - 64
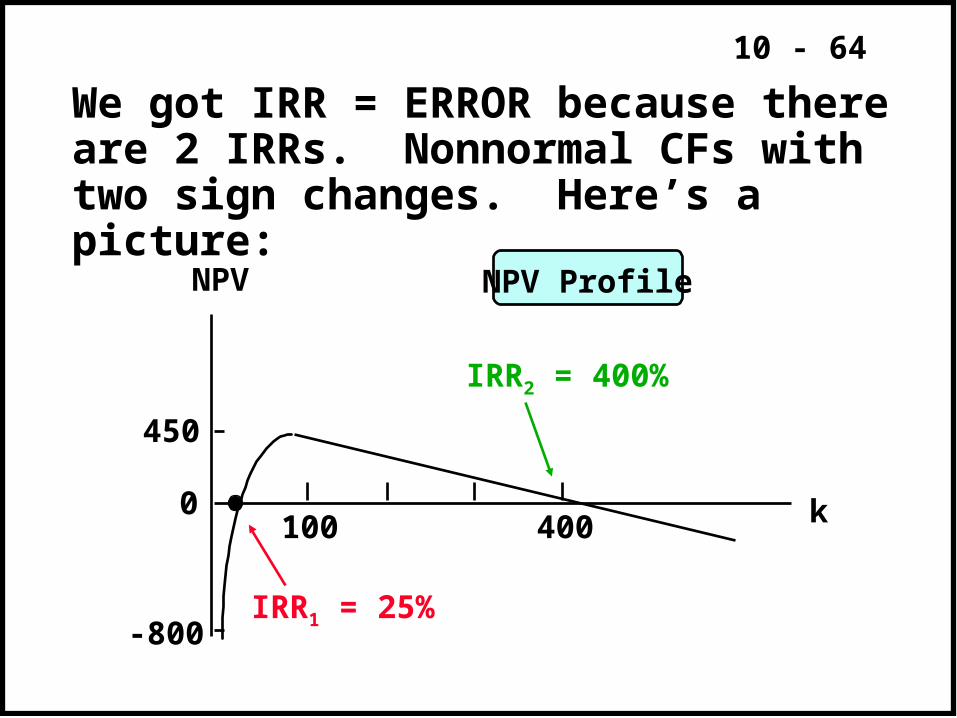
We got IRR = ERROR because there are 2 IRRs. Nonnormal CFs with two sign changes. Here’s a picture:
NPV Profile
450
-800
0400100
IRR2 = 400%
IRR1 = 25%
k
NPV
10 - 65
At very low disc. rates, the PV of CF2 is large & negative, so NPV < 0.
At very high disc. rates, the PV of CF1 and CF2 are both low, so CF0 dominates and again NPV < 0.
In between, the disc. rate hits CF2 harder than CF1 , so NPV > 0.
Result: 2 IRRs.
Logic of Multiple IRRs
10 - 66
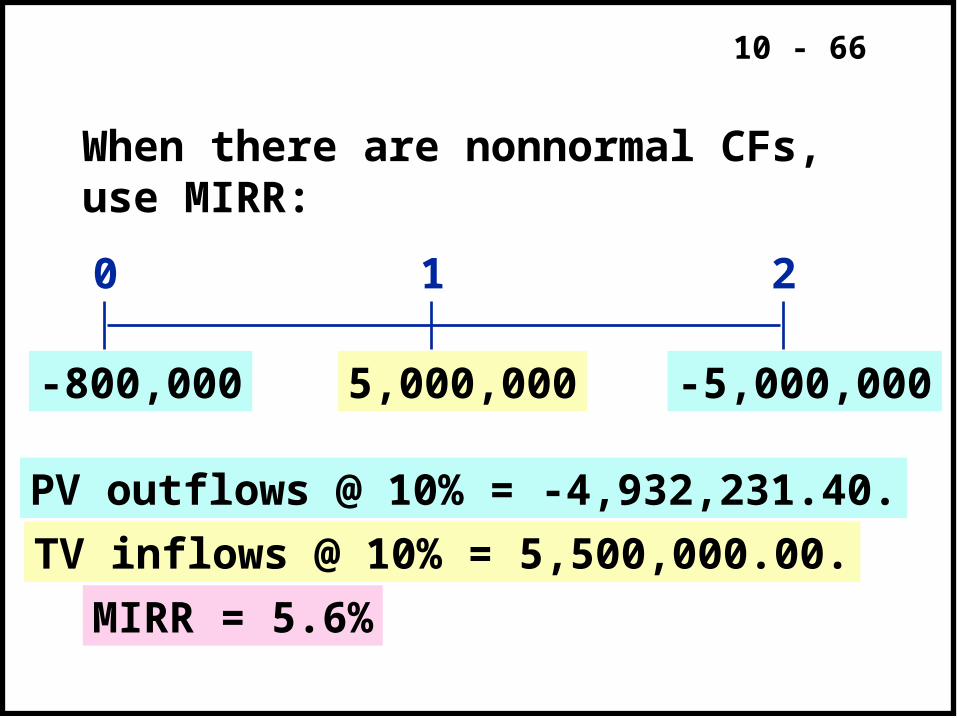
When there are nonnormal CFs, use MIRR:
0 1 2
-800,000 5,000,000 -5,000,000
PV outflows @ 10% = -4,932,231.40.
TV inflows @ 10% = 5,500,000.00.
MIRR = 5.6%
10 - 67
j(2) Accept Project P?
10 - 68
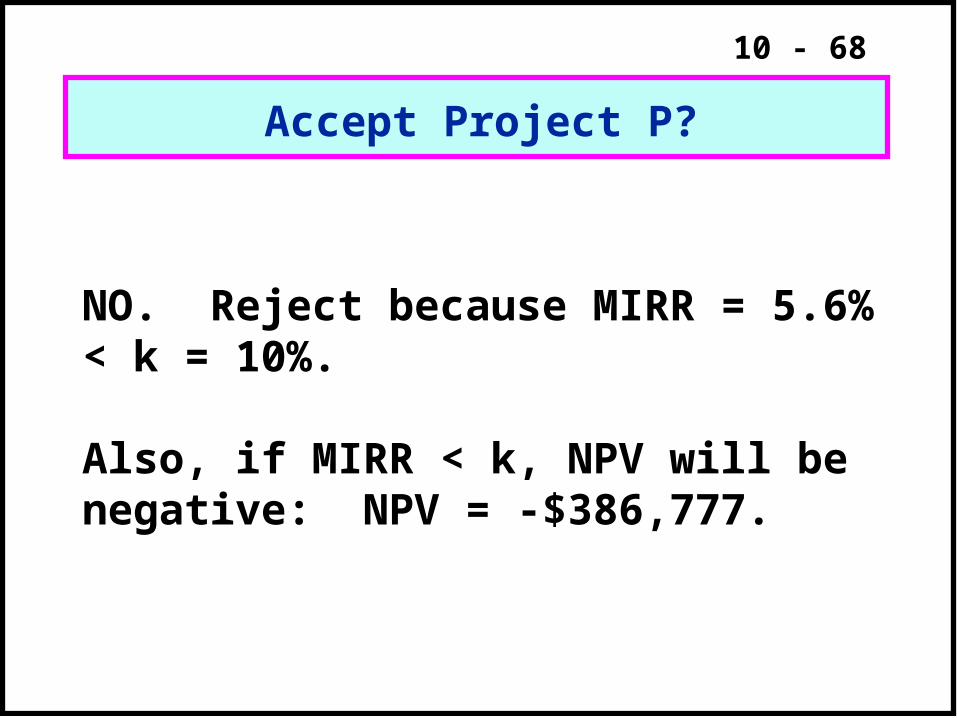
Accept Project P?
NO. Reject because MIRR = 5.6% < k = 10%.
Also, if MIRR < k, NPV will be negative: NPV = -$386,777.
10 - 69
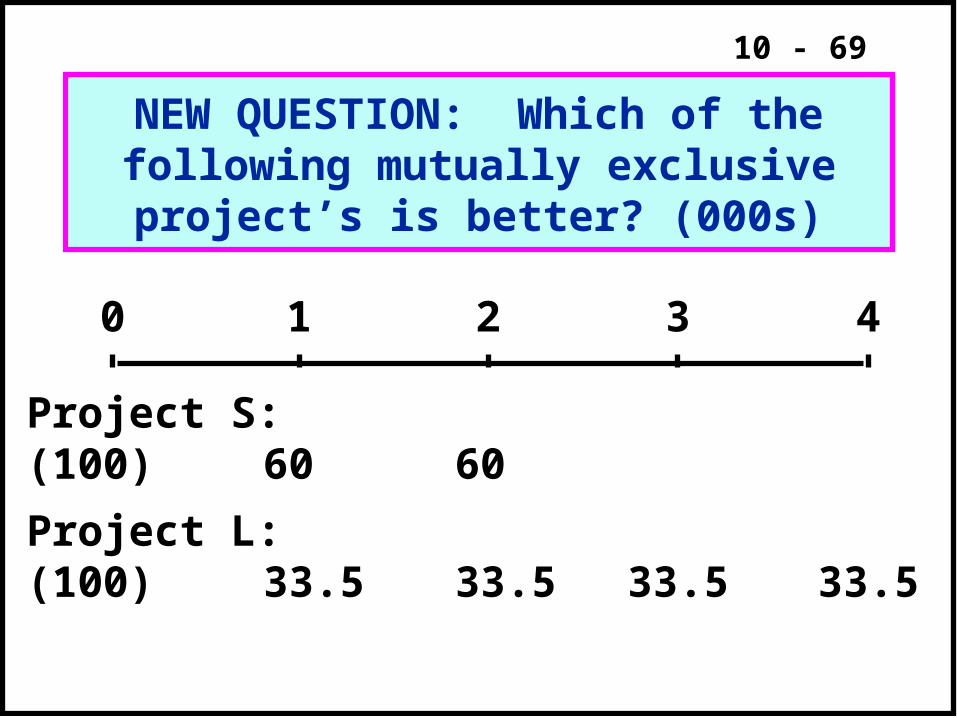
NEW QUESTION: Which of the following mutually exclusive project’s
is better? (000s)
0 1 2 3 4
Project S:(100)
Project L:(100)
60
33.5
60
33.5 33.5 33.5
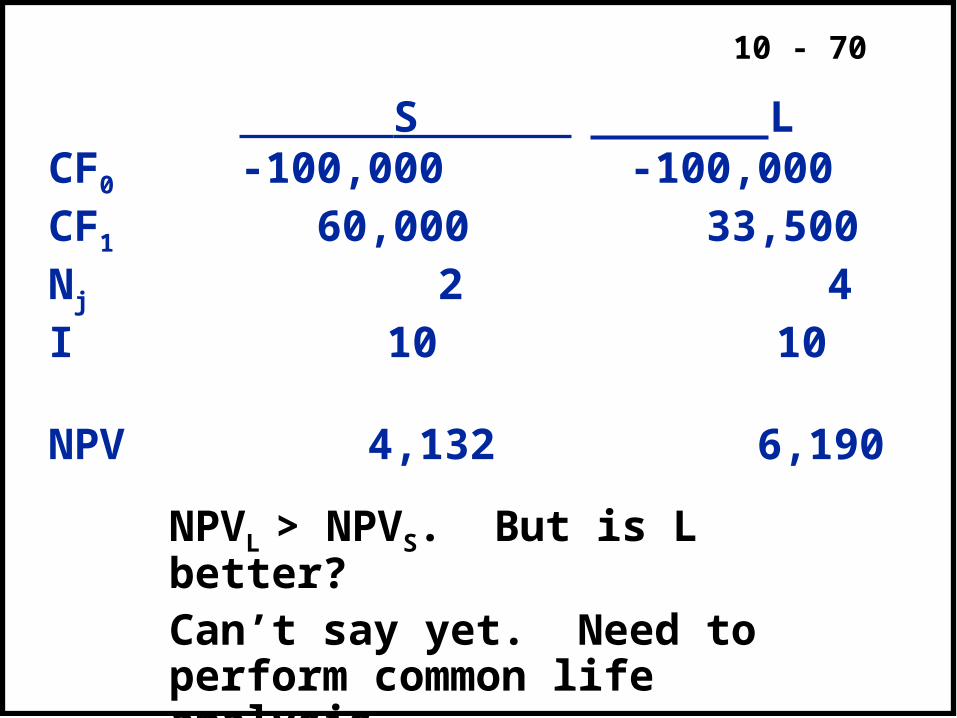
10 - 70
S LCF0 -100,000 -100,000CF1 60,000 33,500Nj 2 4I 10 10
NPV 4,132 6,190
NPVL > NPVS. But is L better?Can’t say yet. Need to perform common life analysis.
10 - 71
Note that Project S could be repeated after 2 years to generate additional profits.
Can use either replacement chain or equivalent annual annuity analysis to make decision.
10 - 72
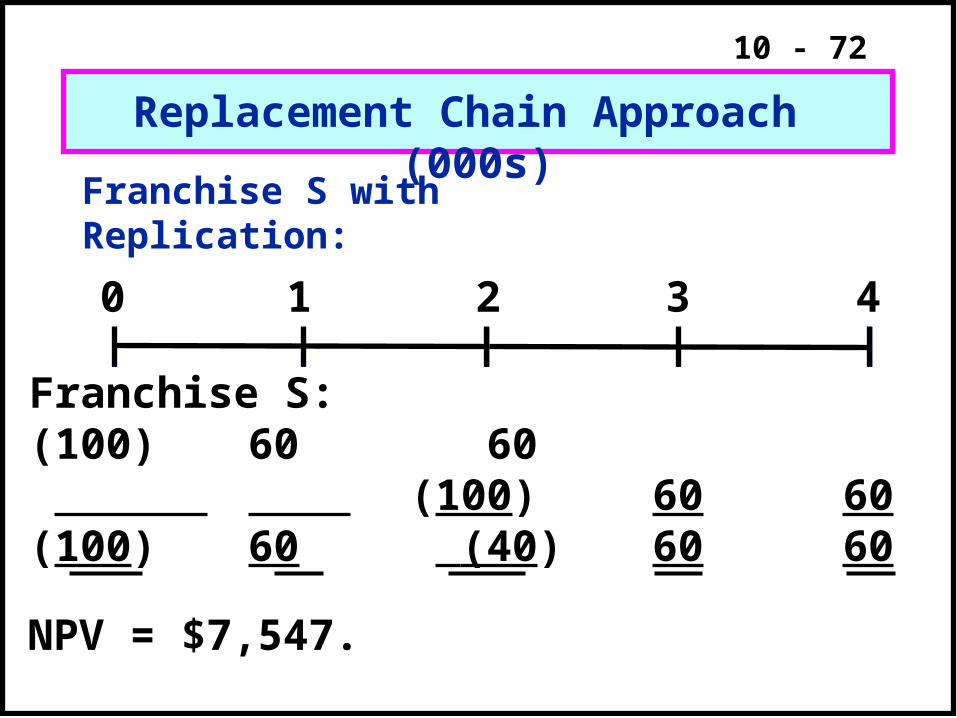
Franchise S with Replication:
NPV = $7,547.
Replacement Chain Approach (000s)
0 1 2 3 4
Franchise S:(100) (100)
60 60
60(100) (40)
6060
6060
10 - 73
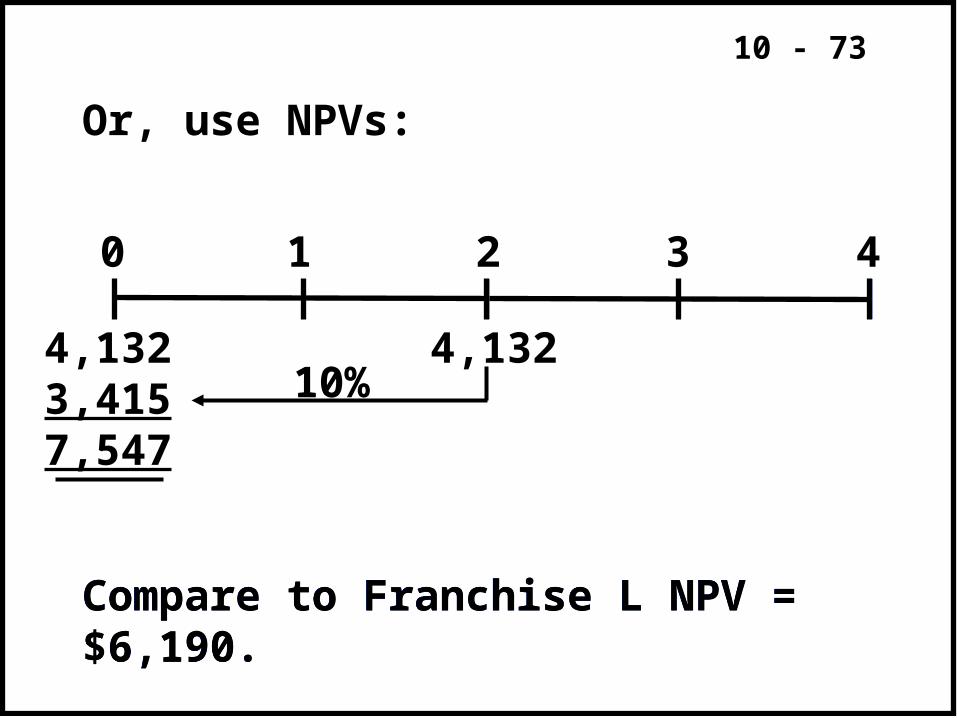
Compare to Franchise L NPV = $6,190.Compare to Franchise L NPV = $6,190.
Or, use NPVs:
0 1 2 3 4
4,1323,4157,547
4,13210%
10 - 74
Equivalent Annual Annuity(EAA) Approach
Finds the constant annuity payment whose PV is equal to the project’s raw NPV over its original life.
10 - 75
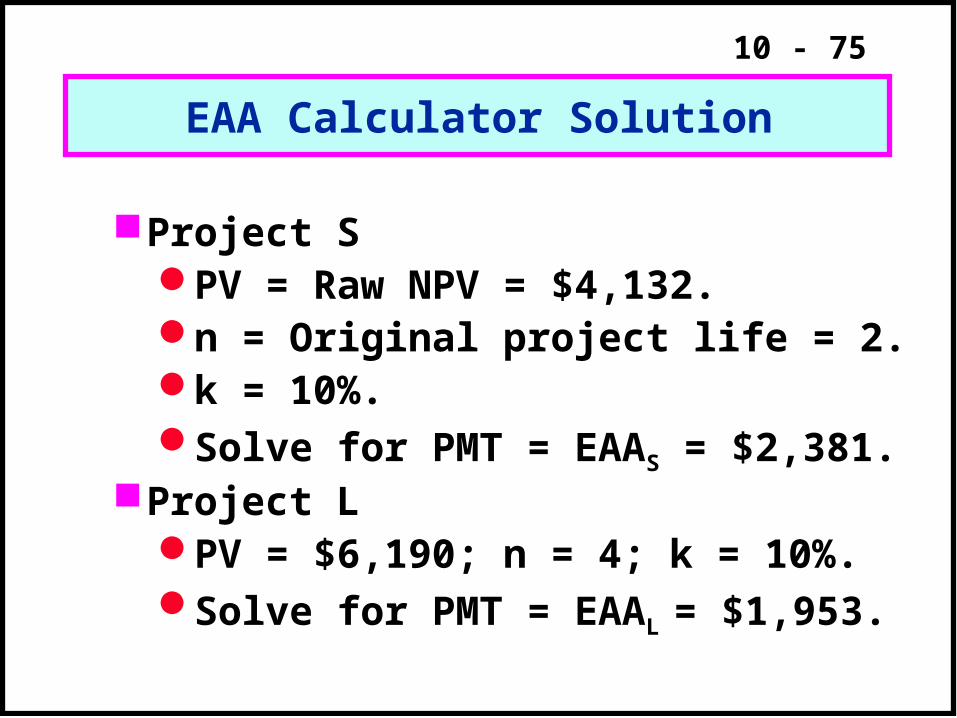
EAA Calculator Solution
Project SPV = Raw NPV = $4,132.n = Original project life = 2.k = 10%.Solve for PMT = EAAS = $2,381.
Project LPV = $6,190; n = 4; k = 10%.Solve for PMT = EAAL = $1,953.
10 - 76
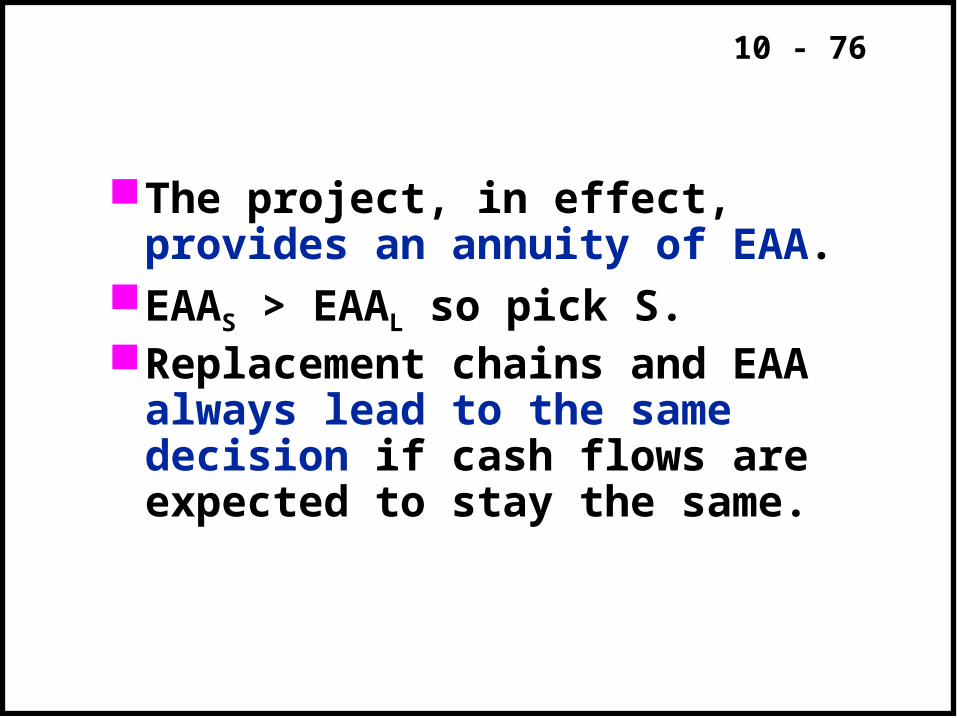
The project, in effect, provides an annuity of EAA.
EAAS > EAAL so pick S.Replacement chains and EAA
always lead to the same decision if cash flows are expected to stay the same.
10 - 77
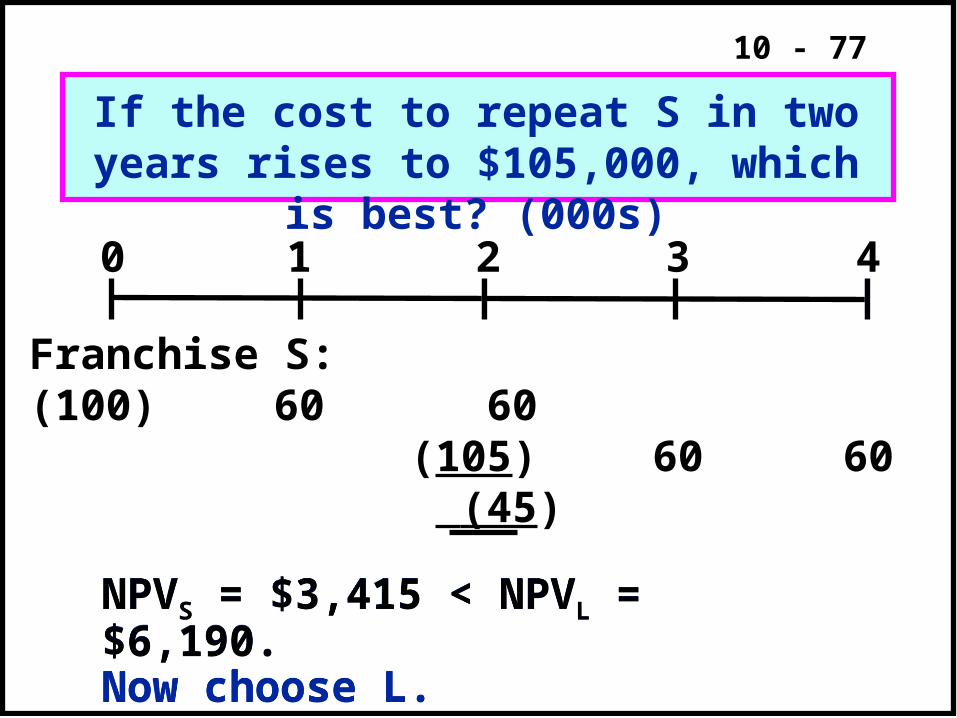
If the cost to repeat S in two years rises to $105,000, which is best? (000s)
NPVS = $3,415 < NPVL = $6,190.Now choose L.NPVS = $3,415 < NPVL = $6,190.Now choose L.
0 1 2 3 4
Franchise S:(100)
60 60(105) (45)
60 60
10 - 78
Types of Abandonment
Sale to another party who can obtain greater cash flows, e.g., IBM sold typewriter division.
Abandon because losing money, e.g., smokeless cigarette.
10 - 79
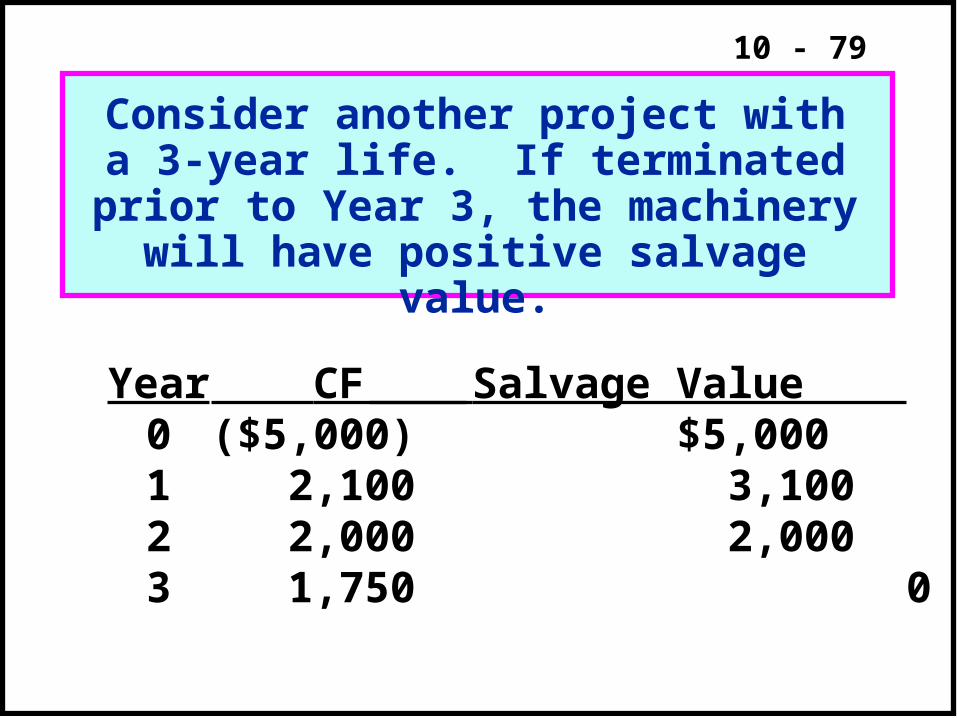
Year0123
CF ($5,000) 2,100 2,000 1,750
Salvage Value $5,000 3,100 2,000 0
Consider another project with a 3-year life. If terminated prior to Year 3, the machinery will have positive salvage
value.
10 - 80
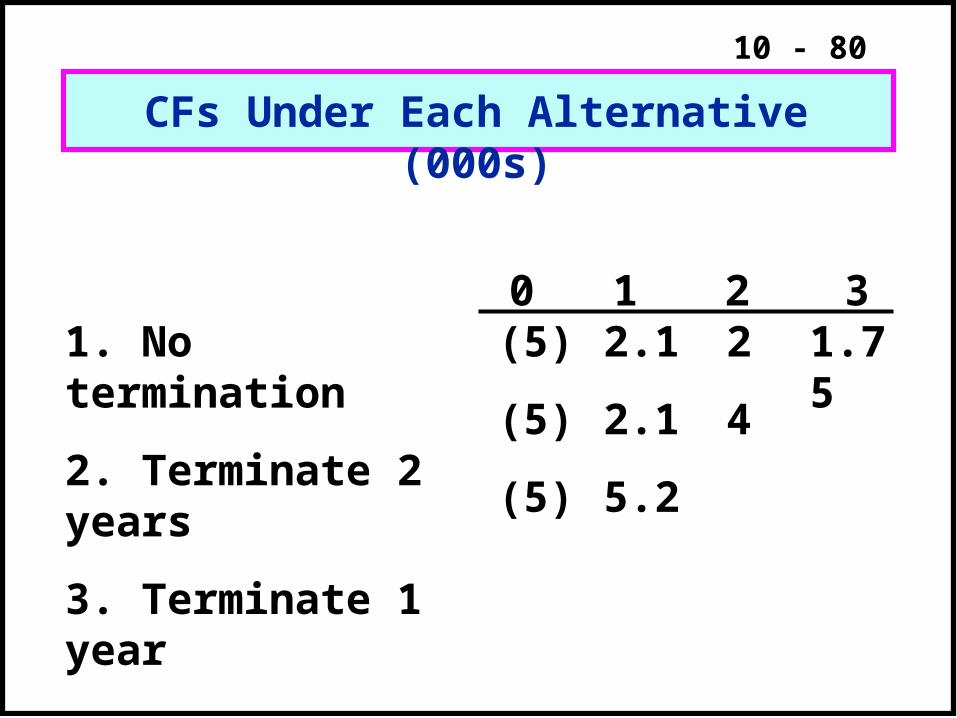
1.751. No termination
2. Terminate 2 years
3. Terminate 1 year
(5)
(5)
(5)
2.1
2.1
5.2
2
4
0 1 2 3
CFs Under Each Alternative (000s)
10 - 81
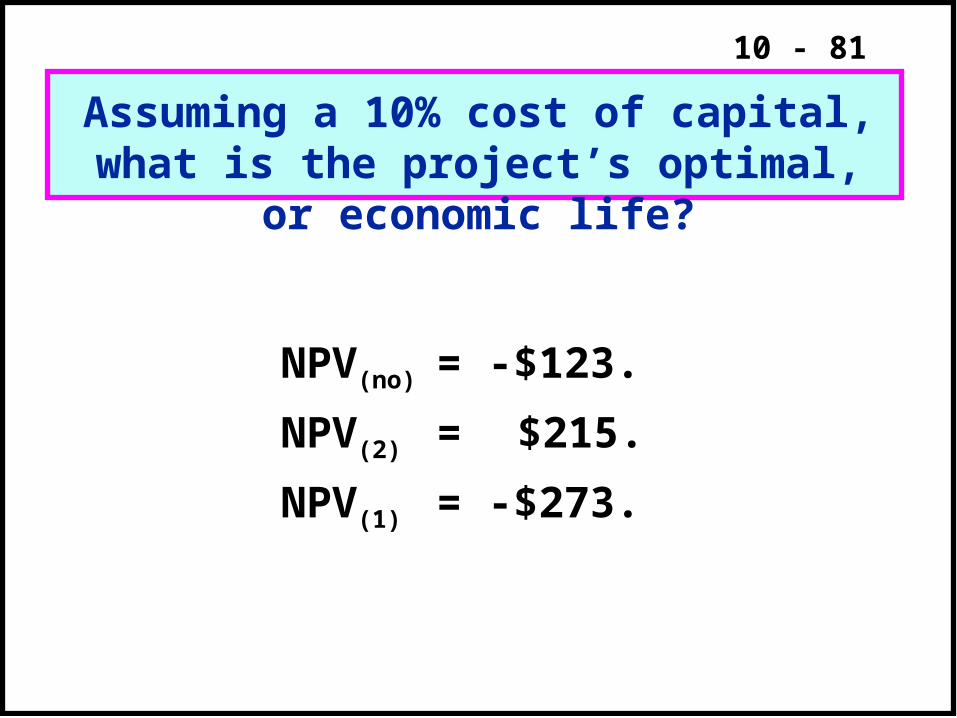
NPV(no) = -$123.
NPV(2) = $215.
NPV(1) = -$273.
Assuming a 10% cost of capital, what is the project’s optimal, or economic life?
10 - 82
The project is acceptable only if operated for 2 years.
A project’s engineering life does not always equal its economic life.
Conclusions
10 - 83
The project is acceptable only if operated for 2 years.
A project’s engineering life does not always equal its economic life.
The ability to abandon a project may make an otherwise unattractive project acceptable.
Abandonment possibilities will be very important when we get to risk.
Conclusions
10 - 84
Choosing the Optimal Capital Budget
Finance theory says to accept all positive NPV projects.
Two problems can occur when there is not enough internally generated cash to fund all positive NPV projects:
An increasing marginal cost of capital.
Capital rationing
10 - 85
Increasing Marginal Cost of Capital
Externally raised capital can have large flotation costs, which increase the cost of capital.
Investors often perceive large capital budgets as being risky, which drives up the cost of capital.
(More...)
10 - 86
If external funds will be raised, then the NPV of all projects should be estimated using this higher marginal cost of capital.
10 - 87
Capital Rationing
Capital rationing occurs when a company chooses not to fund all positive NPV projects.
The company typically sets an upper limit on the total amount of capital expenditures that it will make in the upcoming year.
(More...)
10 - 88
Reason: Companies want to avoid the direct costs (i.e., flotation costs) and the indirect costs of issuing new capital.
Solution: Increase the cost of capital by enough to reflect all of these costs, and then accept all projects that still have a positive NPV with the higher cost of capital.
(More...)
10 - 89
Reason: Companies don’t have enough managerial, marketing, or engineering staff to implement all positive NPV projects.
Solution: Use linear programming to maximize NPV subject to not exceeding the constraints on staffing.
(More...)
10 - 90
Reason: Companies believe that the project’s managers forecast unreasonably high cash flow estimates, so companies “filter” out the worst projects by limiting the total amount of projects that can be accepted.
Solution: Implement a post-audit process and tie the managers’ compensation to the subsequent performance of the project.

![9 IRR dan MIRR [Mode Kompatibilitas]€¦ · NPV vs. IRR • NPV dan IRR secara umum memberikan keputusan yang sama • Perkecualian –Non-konvensionalcashflows •Perubahan cash](https://img.pdfslide.us/doc/110x75/6098962414ea7310d0608782/9-irr-dan-mirr-mode-kompatibilitas-npv-vs-irr-a-npv-dan-irr-secara-umum-memberikan.jpg)