Embed Size (px)
Citation preview

© 2006 by Nelson, a division of Thomson Canada Limited10-104/20/23
Slides developed by:Slides developed by:
Peter YannopoulosPeter Yannopoulos
Chapter 10Chapter 10
Pricing Strategy

© 2006 by Nelson, a division of Thomson Canada Limited10-2
Strategic pricing involves finding a balance between the customer’s desire to obtain good value and the firm’s need to cover costs and earn profits
Thomas T. Nagle and Reed K. Holden,The Strategy and Tactics of Pricing
Essence of Pricing

© 2006 by Nelson, a division of Thomson Canada Limited10-3
Strategic Influences on Price
Strategic Influences on Price
Perceived Customer Value Cost
Competition
Marketing Strategy
Pricing Objectives
Single Versus Multiple Product
Line

© 2006 by Nelson, a division of Thomson Canada Limited10-4
Price Elasticity of Demand
P1
P2
Q2 Q1
Price
Quantity

© 2006 by Nelson, a division of Thomson Canada Limited10-5
The Price Elasticity of Demand Equation
Q/Q E = - P/P

© 2006 by Nelson, a division of Thomson Canada Limited10-6
Price Elasticity of Demand Example
(500 000 – 400 000)/500 000 E = -
(100-108)/100 = -2.5

© 2006 by Nelson, a division of Thomson Canada Limited10-7
Cost and Price Dynamics

© 2006 by Nelson, a division of Thomson Canada Limited10-8
A Typical Experience Curve
Log Cumulative Industry Output
Log Cost per Unit
(in real dollars)Industry Costs

© 2006 by Nelson, a division of Thomson Canada Limited10-9
Sources of the Experience Curve Effect
Product redesign and
standardization
Technologicaladvances
Learning
Economies of scale
Sources of the Sources of the Experience Experience Curve EffectCurve Effect

© 2006 by Nelson, a division of Thomson Canada Limited10-10
Product Life Cycle Stages, Industry Price, and Experience Curve
Log Cumulative Industry Output, (‘000s)
Log Price or Cost per Unit(in constant dollars) and AnnualSales (units)
AverageCosts
Average Industry Prices
Annual sales
Introduction Growth Shakeout Maturity

© 2006 by Nelson, a division of Thomson Canada Limited10-11
Pricing Implications of the Experience Curve
Log Cumulative Output, Units
Log Price or Cost per Unit(in real dollars)
Company
Costs
IndustryPrice
A
B
C CurrentPrice

© 2006 by Nelson, a division of Thomson Canada Limited10-12
Pricing Strategies for New Products
Parity PricingParity Pricing
Price SkimmingPrice Skimming
Penetration PricingPenetration PricingNew Product Pricing
New Product Pricing

© 2006 by Nelson, a division of Thomson Canada Limited10-13
Penetration
PricingStrategic Factors
Price
Skimming
Market factors
Large Market size Small
Elastic Elasticity of demand Inelastic
Product factors
Low Product differentiation High
Long Product life span Short
No Product protected by a patent Yes
Price factors
Yes High price will attract competition No
No Customers use higher prices as an indicator of higher quality Yes
Cost factors
No Substantial margins are required to recover product development andother costs
Yes
Yes Substantial cost reductions are expected due to economies of scale No
Competitive factors
Yes Little chance that competitors will enter market shortly with a similarproduct
No
Strategic Factors Influencing the Choice Between Penetration Pricing and Price Skimming

© 2006 by Nelson, a division of Thomson Canada Limited10-14
Pricing Existing Products
Prestige Pricing
EverydayLow
Pricing
Cost-plusPricing
Randomized Pricing
Value Pricing
PromotionalPricing
Pricing Pricing Existing Existing ProductsProducts

© 2006 by Nelson, a division of Thomson Canada Limited10-15
Value Pricing
1. Determine target price based on consumer, competitive, and other factors
2. Subtract desired channel intermediary markup
3. Subtract desired manufacturer margin4. Target cost to be recouped5. Produce product

© 2006 by Nelson, a division of Thomson Canada Limited10-16
Cost-Plus Pricing
1. Produce product with appropriate features and service level
2. Compute full unit cost
3. Add desired manufacturer margin
4. Add desired channel intermediary margin
5. Retail price

© 2006 by Nelson, a division of Thomson Canada Limited10-17
Product Line PricingProduct Line Pricing
Cross-SubsidizationPricing
Two-Part Pricing
Price Bundling
Product Line Pricing
© 2006 by Nelson, a division of Thomson Canada Limited10-18
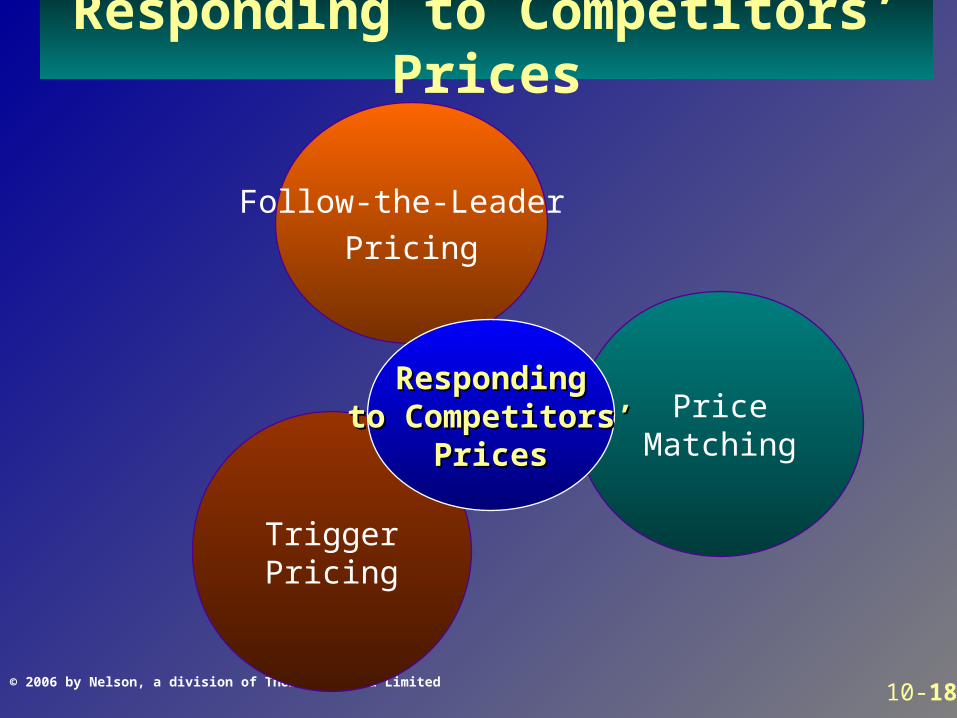
Responding to Competitors’ Prices
TriggerPricing
Follow-the-Leader
Pricing
PriceMatching
RespondingRespondingto Competitors’to Competitors’
PricesPrices

© 2006 by Nelson, a division of Thomson Canada Limited10-19
Price Customization StrategiesPrice Customization Strategies
Price Customization
by Location
Price Customization by Customer
Price Customization
by TimePricePriceCustomizationCustomization
StrategiesStrategies

© 2006 by Nelson, a division of Thomson Canada Limited10-20
Conditions for Price Customization to Work
Firm must be able to divide the market into segments with different price sensitivities
People must not be able to transfer between segments
Different prices must be perceived to be fair by customers

© 2006 by Nelson, a division of Thomson Canada Limited10-21
Price-Profitability Analysis

© 2006 by Nelson, a division of Thomson Canada Limited10-22
Break-Even Analysis Example
Assume:Fixed cost = $9,000Price = $10Variable Cost = $2Expected company sales = 1,500Market size = 5,000
Assume:Fixed cost = $9,000Price = $10Variable Cost = $2Expected company sales = 1,500Market size = 5,000
Fixed cost $9,000
Break-even (units) = = Price – variable cost $10 - $2
= 1,125 units
Fixed cost $9,000
Break-even (units) = = Price – variable cost $10 - $2
= 1,125 units

© 2006 by Nelson, a division of Thomson Canada Limited10-23
Break-Even Market share
Break-even unit sales Break-even market share = [ ] × 100
Market size
1,125 = [ ] × 100
5,000
= 22.5 %
Break-even unit sales Break-even market share = [ ] × 100
Market size
1,125 = [ ] × 100
5,000
= 22.5 %

© 2006 by Nelson, a division of Thomson Canada Limited10-24
Safety Margin
Expected company sales – Break-even unit salesSafety = [ ] × 100margin Expected company sales
1,500 – 1,125= [ ] × 100 1,500
= 25 %
Expected company sales – Break-even unit salesSafety = [ ] × 100margin Expected company sales
1,500 – 1,125= [ ] × 100 1,500
= 25 %

© 2006 by Nelson, a division of Thomson Canada Limited10-25
Break-Even Sales Change Example
Assume :Price = $8Price change = -$1 Contribution margin = $4Expected company sales = 1,500
Assume :Price = $8Price change = -$1 Contribution margin = $4Expected company sales = 1,500

© 2006 by Nelson, a division of Thomson Canada Limited10-26
Break-Even Sales Change Example (concluded)
-Price change% Break-even = [ ] × 100 sales change Contribution + Price change
margin
-(-$1) = [ ] × 100
$4 + (-$1) = 33.3 %
Break-even sales change = 0.33 × 1,500 = 500 units
-Price change% Break-even = [ ] × 100 sales change Contribution + Price change
margin
-(-$1) = [ ] × 100
$4 + (-$1) = 33.3 %
Break-even sales change = 0.33 × 1,500 = 500 units