Embed Size (px)
Citation preview
1
Yield Curves and Yield Curves and Rate of Return Rate of Return
2
Yield CurvesYield Curves
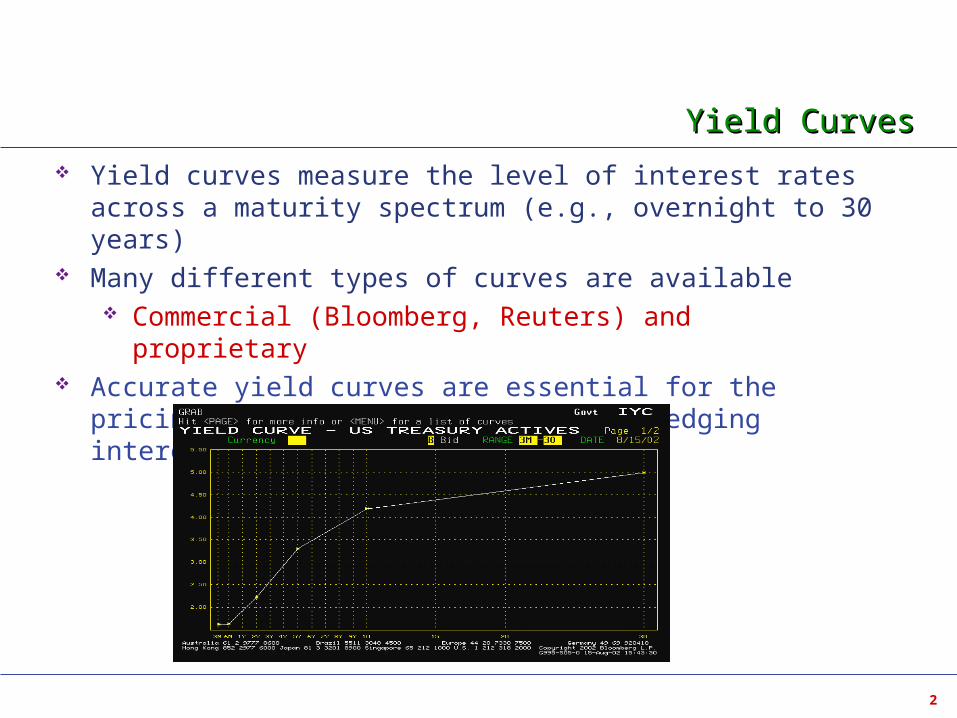
Yield curves measure the level of interest rates across a maturity spectrum (e.g., overnight to 30 years)
Many different types of curves are available Commercial (Bloomberg, Reuters) and proprietary
Accurate yield curves are essential for the pricing, trading, revaluation, and hedging interest-rate sensitive products
3
Yield MeasuresYield Measures
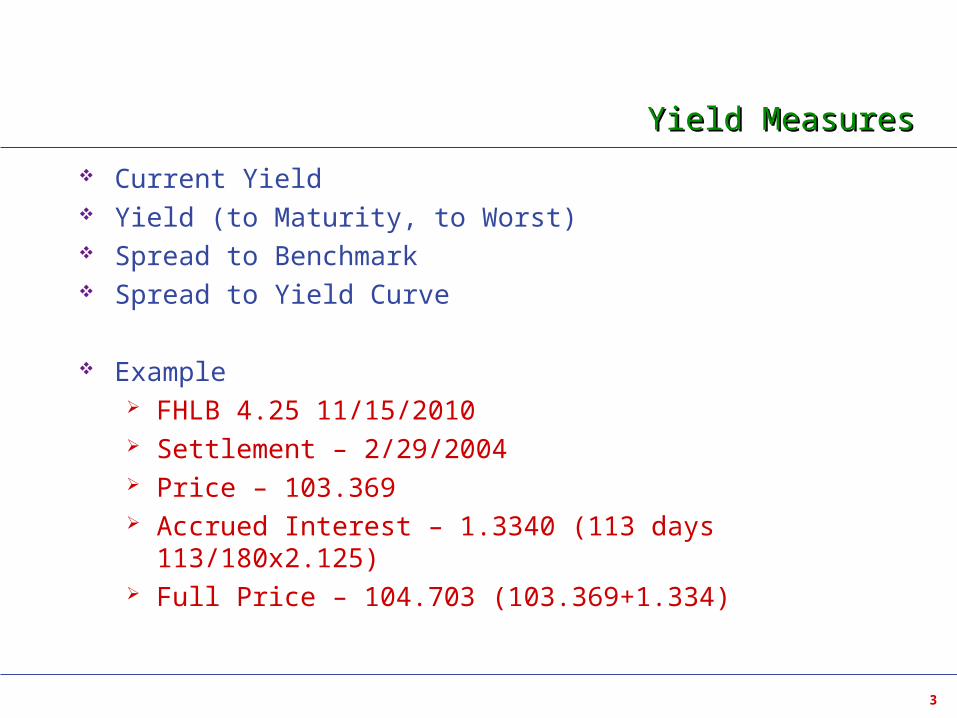
Current Yield Yield (to Maturity, to Worst) Spread to Benchmark Spread to Yield Curve
Example FHLB 4.25 11/15/2010 Settlement – 2/29/2004 Price – 103.369 Accrued Interest – 1.3340 (113 days 113/180x2.125) Full Price – 104.703 (103.369+1.334)
4
Yield Measures – Current YieldYield Measures – Current Yield
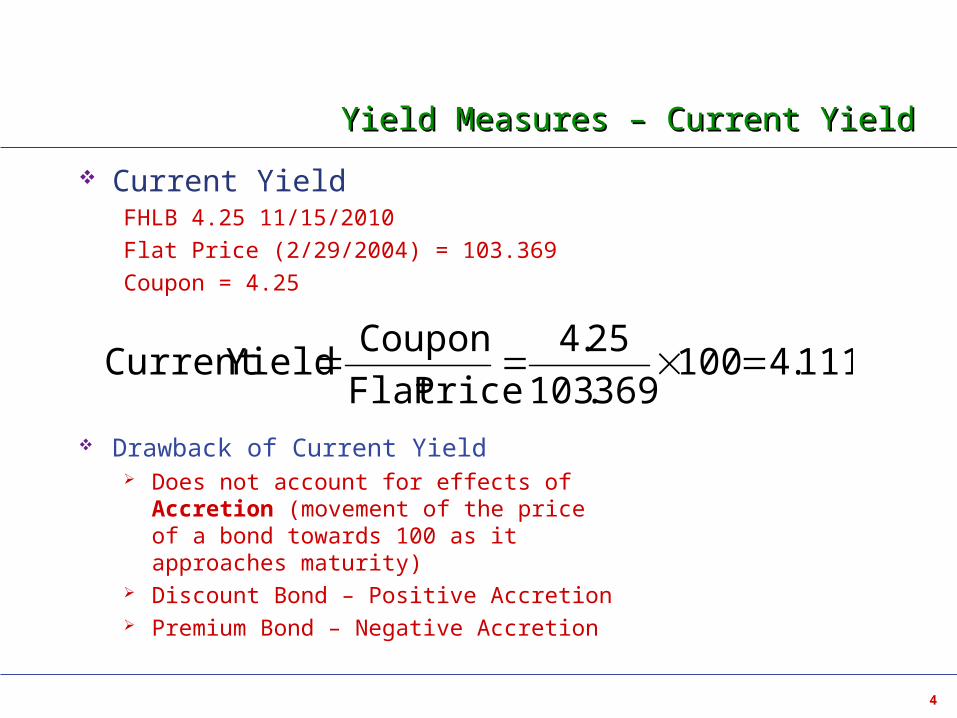
Current YieldFHLB 4.25 11/15/2010
Flat Price (2/29/2004) = 103.369
Coupon = 4.25
Drawback of Current Yield Does not account for effects of Accretion
(movement of the price of a bond towards 100 as it approaches maturity)
Discount Bond – Positive Accretion Premium Bond – Negative Accretion
111.4100369.103
25.4
PriceFlat
CouponYieldCurrent
5
Yield Measures – Yield to MaturityYield Measures – Yield to MaturityYield to Maturity
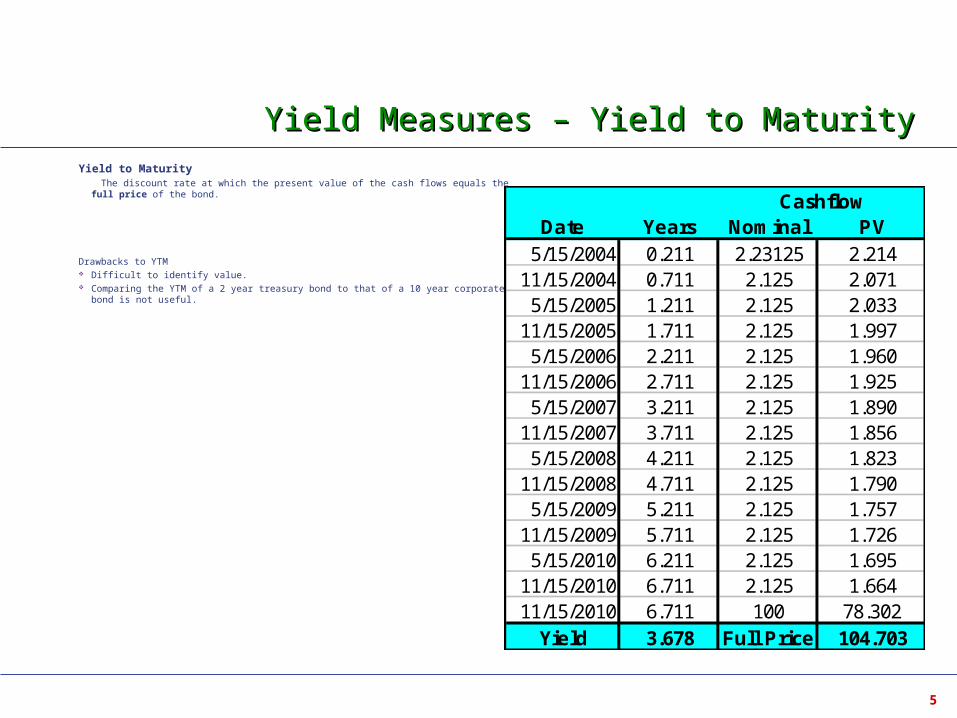
The discount rate at which the present value of the cash flows equals the full price of the bond.
Drawbacks to YTM Difficult to identify value. Comparing the YTM of a 2 year treasury bond to that of a 10 year corporate bond is not useful.
CashflowDate Years Nominal PV
5/15/2004 0.211 2.23125 2.21411/15/2004 0.711 2.125 2.0715/15/2005 1.211 2.125 2.033
11/15/2005 1.711 2.125 1.9975/15/2006 2.211 2.125 1.960
11/15/2006 2.711 2.125 1.9255/15/2007 3.211 2.125 1.890
11/15/2007 3.711 2.125 1.8565/15/2008 4.211 2.125 1.823
11/15/2008 4.711 2.125 1.7905/15/2009 5.211 2.125 1.757
11/15/2009 5.711 2.125 1.7265/15/2010 6.211 2.125 1.695
11/15/2010 6.711 2.125 1.66411/15/2010 6.711 100 78.302
Yield 3.678 Full Price 104.703
6
Yield Measures – Spread to BenchmarkYield Measures – Spread to Benchmark
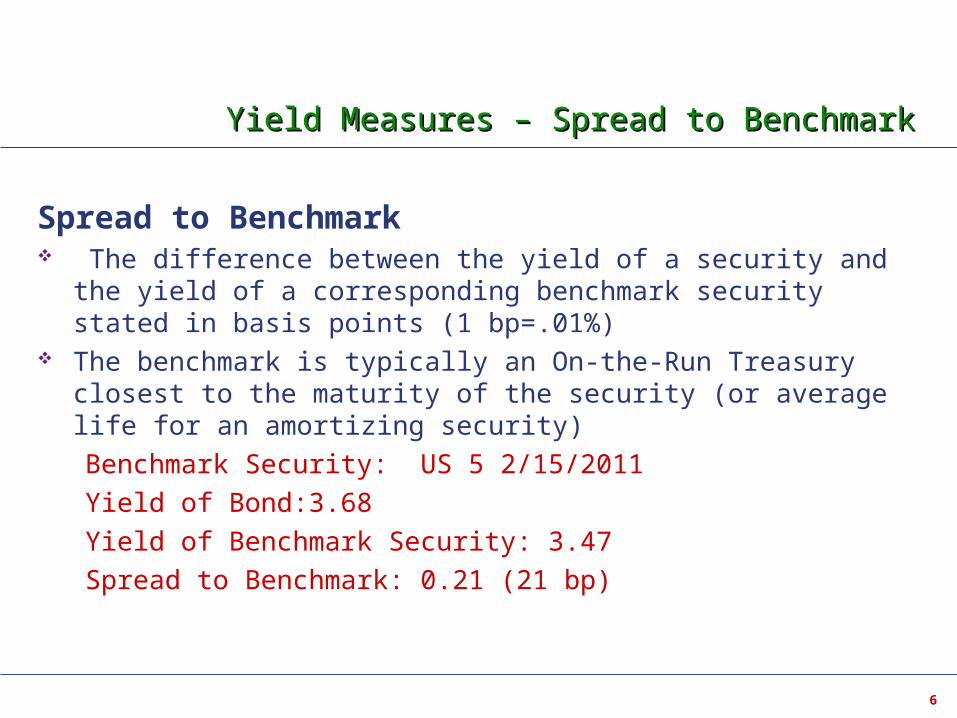
Spread to Benchmark The difference between the yield of a security and the yield of a
corresponding benchmark security stated in basis points (1 bp=.01%) The benchmark is typically an On-the-Run Treasury closest to the
maturity of the security (or average life for an amortizing security)
Benchmark Security: US 5 2/15/2011
Yield of Bond:3.68
Yield of Benchmark Security: 3.47
Spread to Benchmark: 0.21 (21 bp)
7
Yield Measures – Spread to Yield CurveYield Measures – Spread to Yield Curve
Spread to Yield Curve The difference between a security’s yield and the interpolated
point on the yield curve corresponding to the security’s average life, stated in basis points (1 bp=.01%) On-The-Run Treasury Curve Off-The-Run Treasury Model Curve Swap Curve
8
Yield Measures – Spread to Yield CurveYield Measures – Spread to Yield Curve
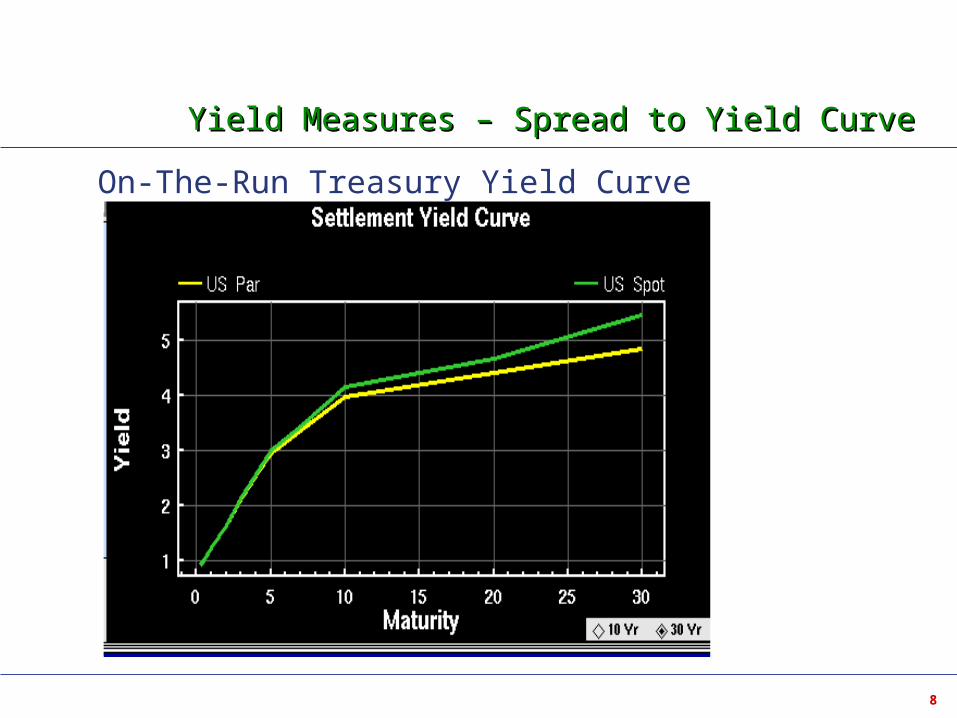
On-The-Run Treasury Yield Curve (2/29/2004)
9
Yield Measures – Spread to On the Run CurveYield Measures – Spread to On the Run Curve
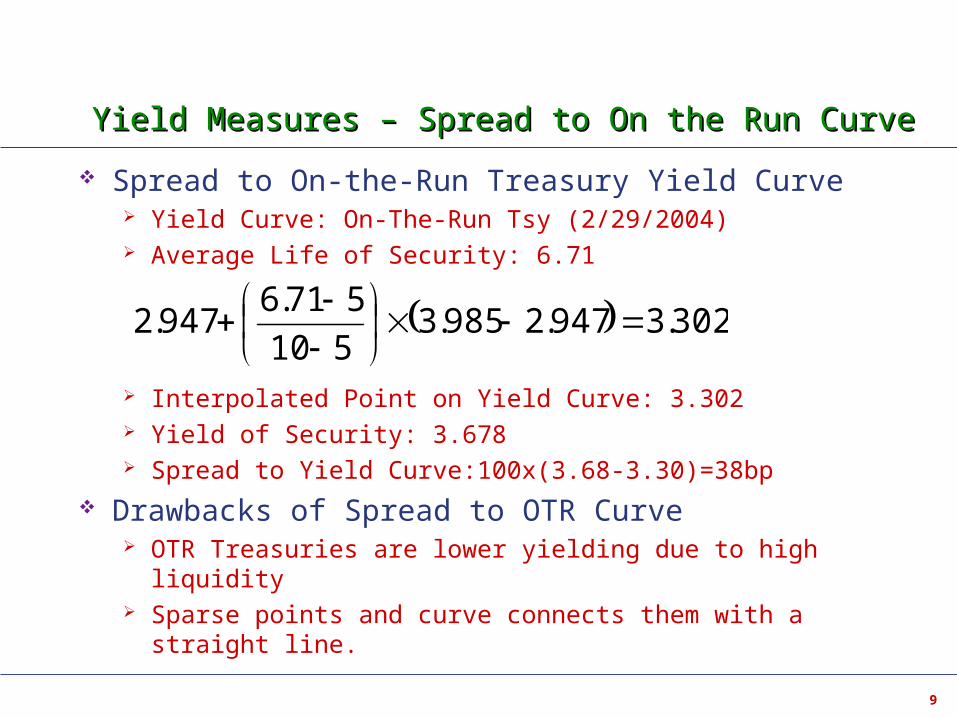
Spread to On-the-Run Treasury Yield Curve Yield Curve: On-The-Run Tsy (2/29/2004) Average Life of Security: 6.71
Interpolated Point on Yield Curve: 3.302 Yield of Security: 3.678 Spread to Yield Curve:100x(3.68-3.30)=38bp
Drawbacks of Spread to OTR Curve OTR Treasuries are lower yielding due to high liquidity Sparse points and curve connects them with a straight line.
302.3947.2985.3510
571.6947.2
10
Yield Measures – Spread to Off the Run CurveYield Measures – Spread to Off the Run Curve
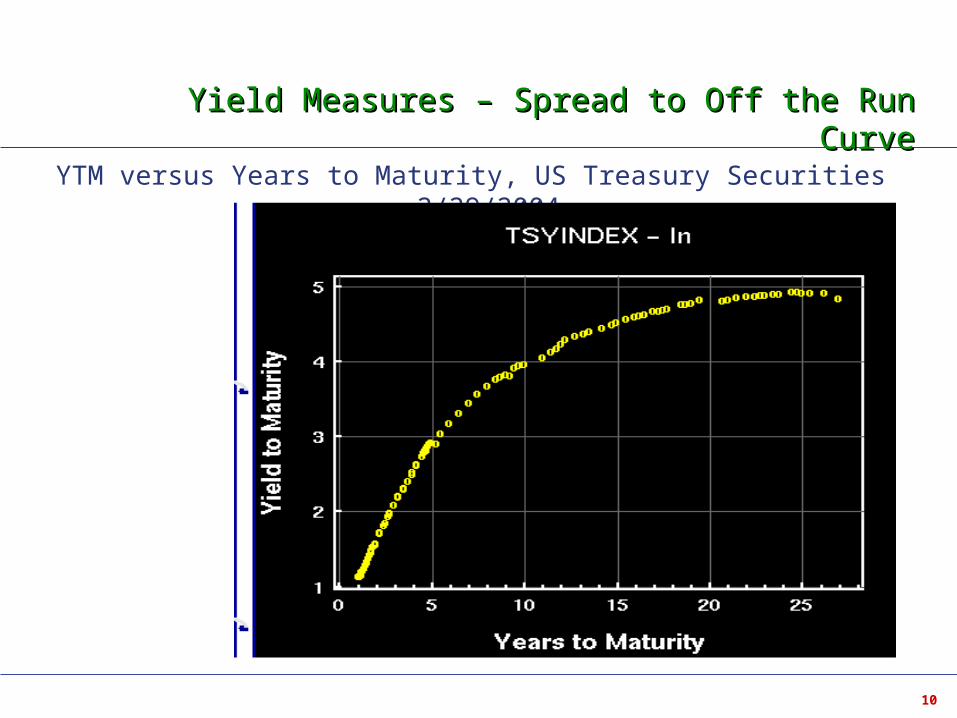
YTM versus Years to Maturity, US Treasury Securities 2/29/2004
11
Yield Measures – Spread to Off the Run CurveYield Measures – Spread to Off the Run Curve
Treasury Off-The-Run Yield Curve Statistically constructed by fitting a curve to YTM versus Years to
Maturity data to a universe of Treasury securities Universe includes all Treasury Bills, Notes, and Bonds
Excluded - On the Run Treasuries Excluded - Callable Bonds
Also referred to as the Treasury Model Curve
12
Yield MeasuresYield Measures
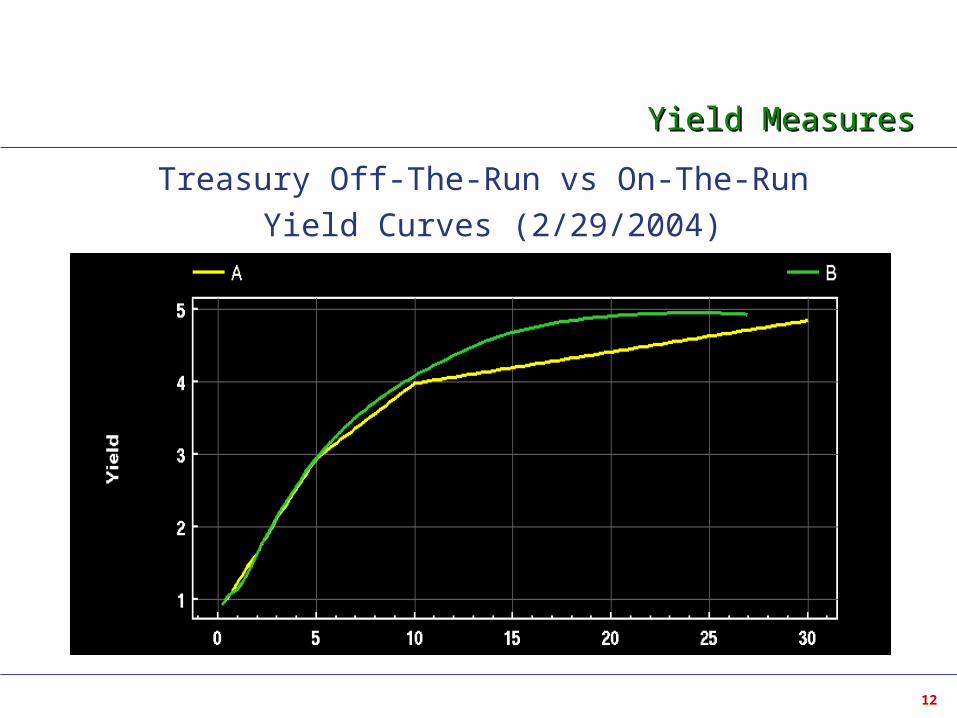
Treasury Off-The-Run vs On-The-Run
Yield Curves (2/29/2004)
13
Yield MeasuresYield Measures
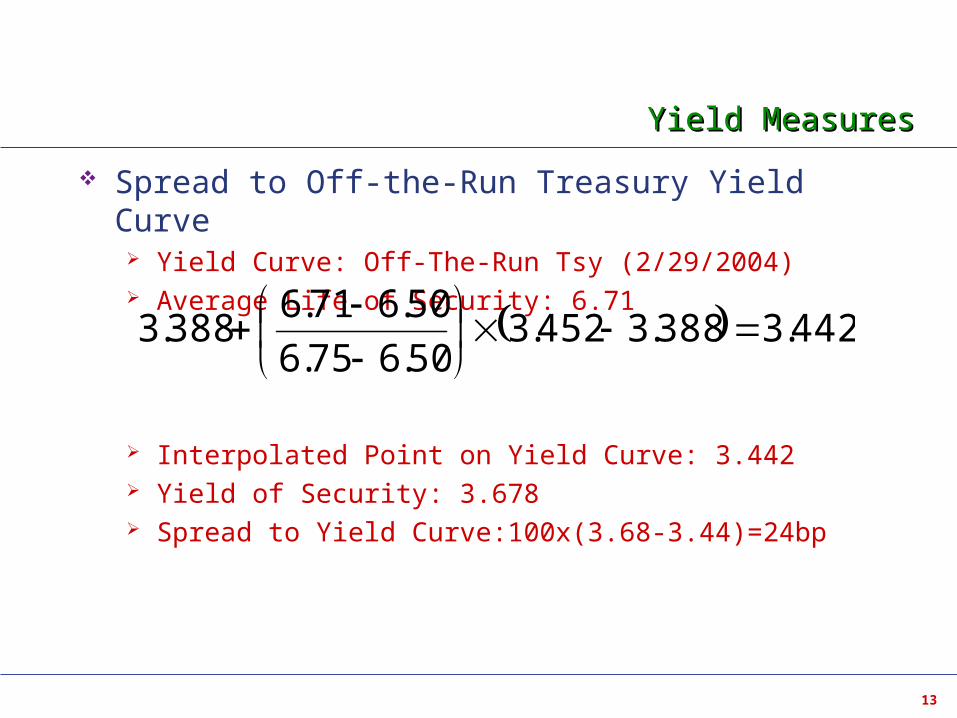
Spread to Off-the-Run Treasury Yield Curve Yield Curve: Off-The-Run Tsy (2/29/2004) Average Life of Security: 6.71
Interpolated Point on Yield Curve: 3.442 Yield of Security: 3.678 Spread to Yield Curve:100x(3.68-3.44)=24bp
442.3388.3452.350.675.6
50.671.6388.3
14
Yield MeasuresYield Measures
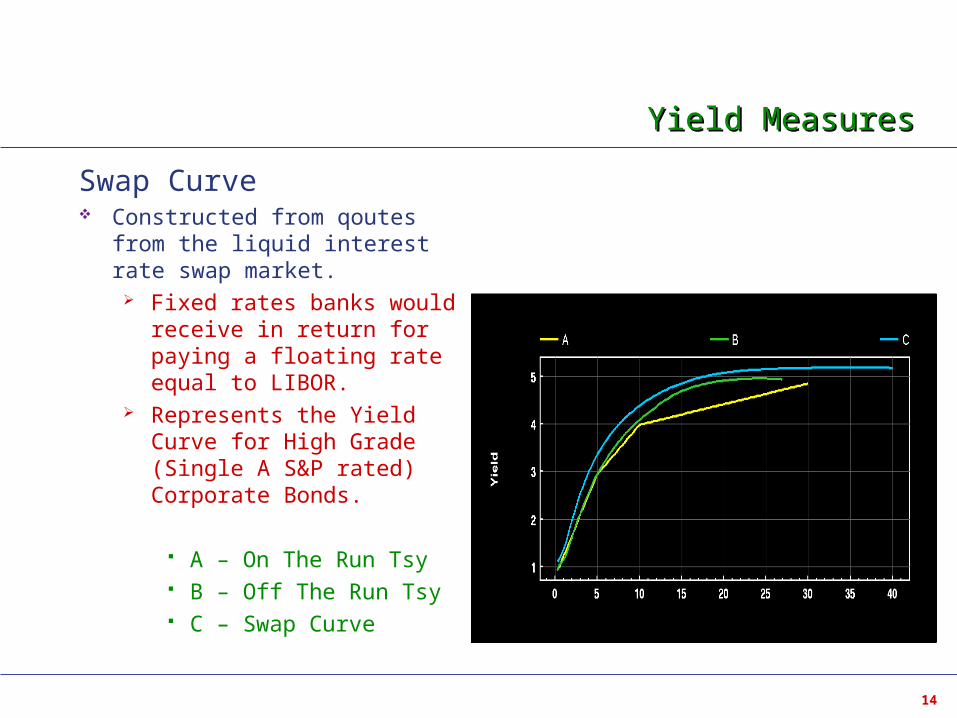
Swap Curve Constructed from qoutes from
the liquid interest rate swap market.
Fixed rates banks would receive in return for paying a floating rate equal to LIBOR.
Represents the Yield Curve for High Grade (Single A S&P rated) Corporate Bonds.
A – On The Run Tsy B – Off The Run Tsy C – Swap Curve
15
Yield MeasuresYield Measures
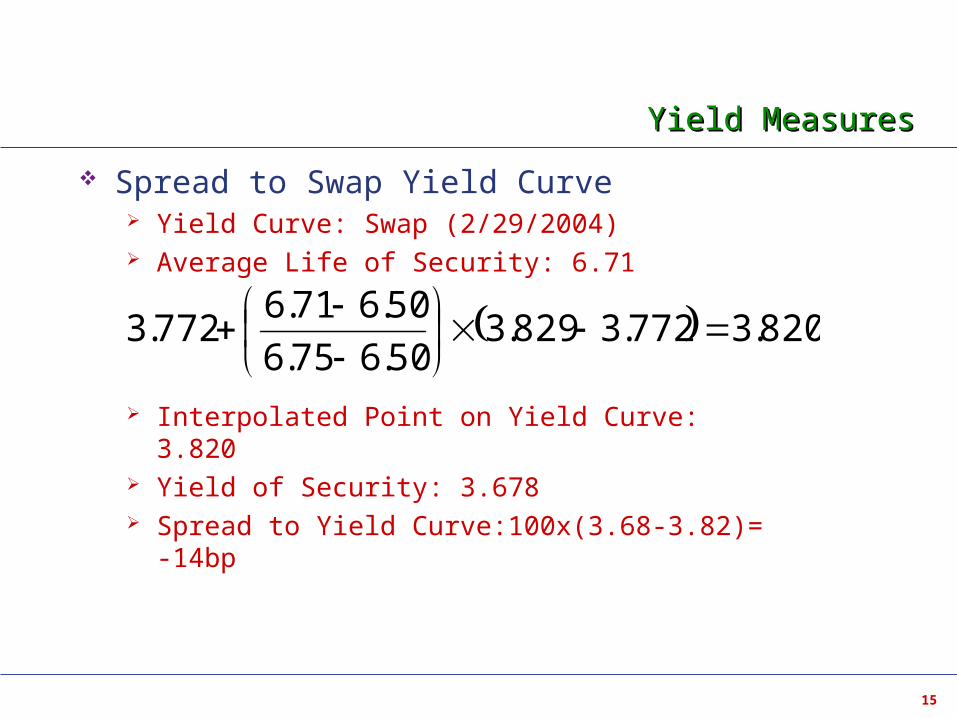
Spread to Swap Yield Curve Yield Curve: Swap (2/29/2004) Average Life of Security: 6.71
Interpolated Point on Yield Curve: 3.820 Yield of Security: 3.678 Spread to Yield Curve:100x(3.68-3.82)= -14bp
820.3772.3829.350.675.6
50.671.6772.3
16
Yield Curve Shapes – Positive Yield CurveYield Curve Shapes – Positive Yield Curve
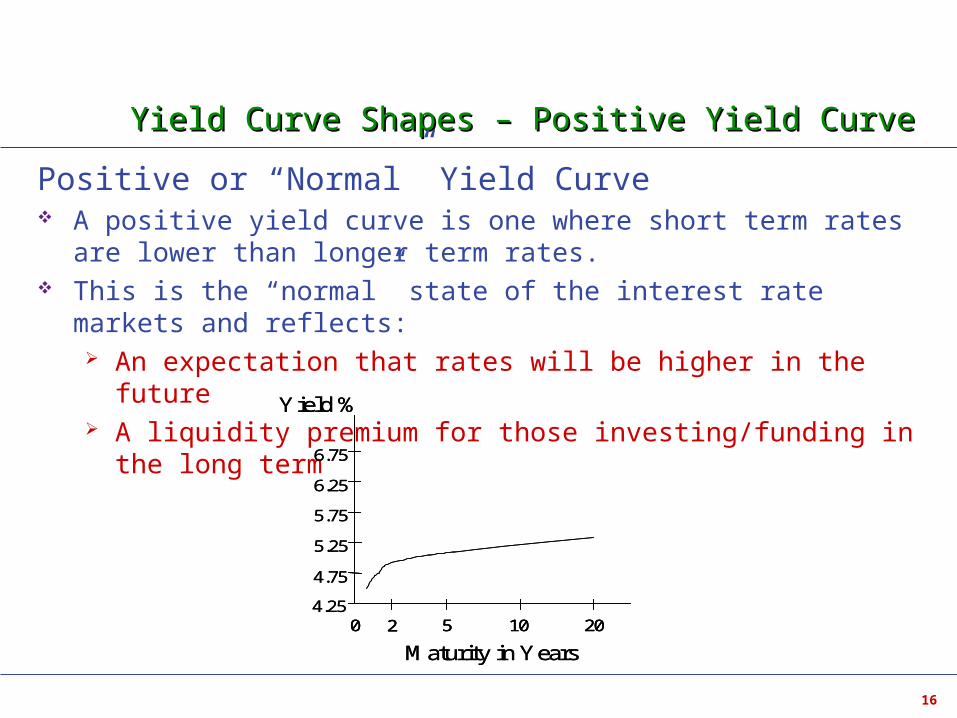
Positive or “Normal” Yield Curve A positive yield curve is one where short term rates are lower than
longer term rates. This is the “normal” state of the interest rate markets and reflects:
An expectation that rates will be higher in the future A liquidity premium for those investing/funding in the long term
Maturity in Years
Yield %
4.75
0 2 5 10 20
6.25
5.25
5.75
4.25
6.75
Maturity in Years
Yield %
4.75
0 2 5 10 20 0 2 5 10 20
6.25
5.25
5.75
4.25
6.75
17
Drivers of Yield Curve Shapes -Expectations TheoryDrivers of Yield Curve Shapes -Expectations Theory
Drivers of Yield Curve Shapes Expectations Theory
Long-term rates reflect the market’s view of rates expected to prevail in the future
If investors think that long-term interest rates will rise they will avoid longer-term bonds and invest short term.
Short-term prices rise (rates fall) Long-term prices fall (rates rise)
18
Liquidity Preference TheoryLiquidity Preference Theory
Drivers of Yield Curve Shapes Liquidity Preference Theory
The longer an investor’s horizon, the greater the credit risk Statistically, a borrower is less likely to have credit problems
over a shorter period than a longer period. An investor will demand a premium for the extra risk, meaning
longer term rates rise above short term rates.
19
Market Segmentation TheoryMarket Segmentation Theory
Drivers of Yield Curve Shapes Market Segmentation Theory
The shape of the yield curve is the result of supply and demand for investments in particular segments of the curve.
If an investment fund wants to invest strictly in securities that have maturities between 10 and 15 years that will raise prices (lower yields) in that segment
If demand by short-term investors is exceedingly high, the yield curve will steepen
20
Negative Yield CurveNegative Yield Curve
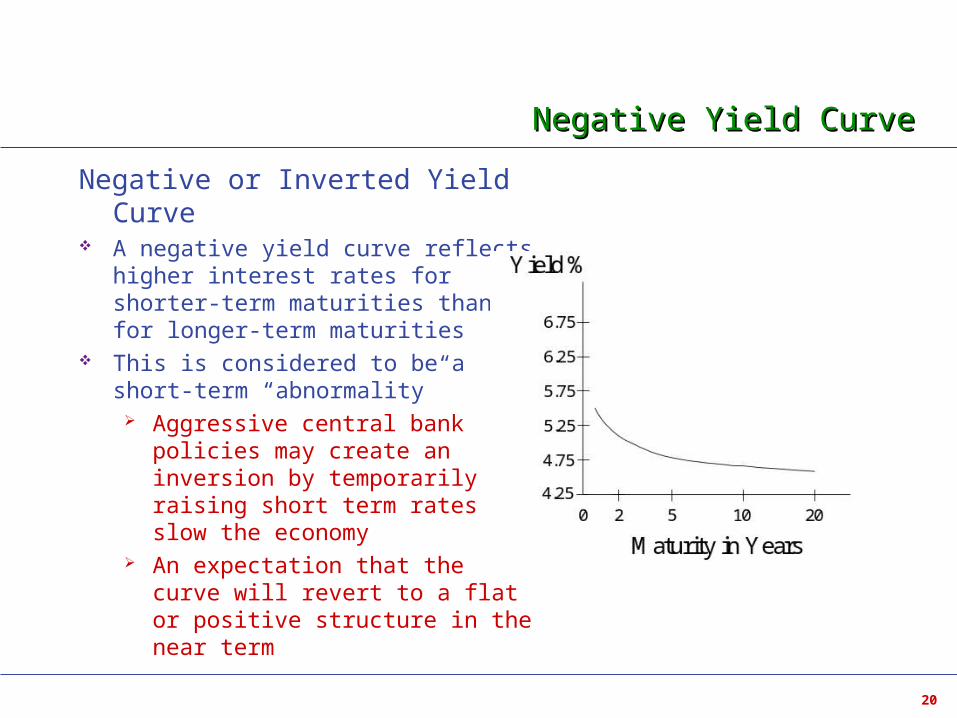
Negative or Inverted Yield Curve A negative yield curve reflects higher
interest rates for shorter-term maturities than for longer-term maturities
This is considered to be a short-term “abnormality”
Aggressive central bank policies may create an inversion by temporarily raising short term rates to slow the economy
An expectation that the curve will revert to a flat or positive structure in the near term
21
Flat Yield CurveFlat Yield Curve
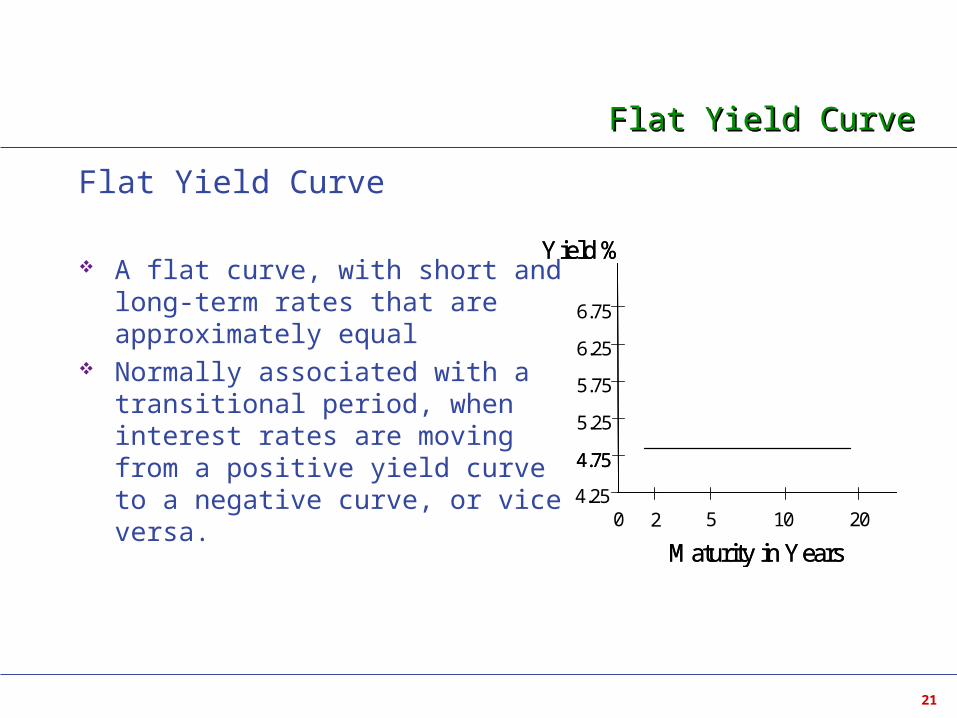
Flat Yield Curve
A flat curve, with short and long-term rates that are approximately equal
Normally associated with a transitional period, when interest rates are moving from a positive yield curve to a negative curve, or vice versa.
Maturity in Years
Yield %
4.75
0 2 5 10 20
6.25
5.25
5.75
4.25
6.75
Maturity in Years
Yield %
4.75
22
Spot Yield CurveSpot Yield Curve
Par Yield Curves provide a good representation of where market yields are At the beginning of a bond's life Yield is equal (or close) to the coupon rate
For deep discount or high premium bonds comparing their yield to the yield of a treasury with a price close to par is not as useful This is particularly true for zero coupon bonds Zero coupon bonds make no payments to the bondholder until
the bond's maturity date, when the principal plus interest is paid Zero coupon (spot) rates allow each cash flow to be priced
individually using an interest rate relevant to that specific cash flow, rather than one rate for the whole stream of cash flows.
23
Spot Yield Curve - BootstrappingSpot Yield Curve - Bootstrapping
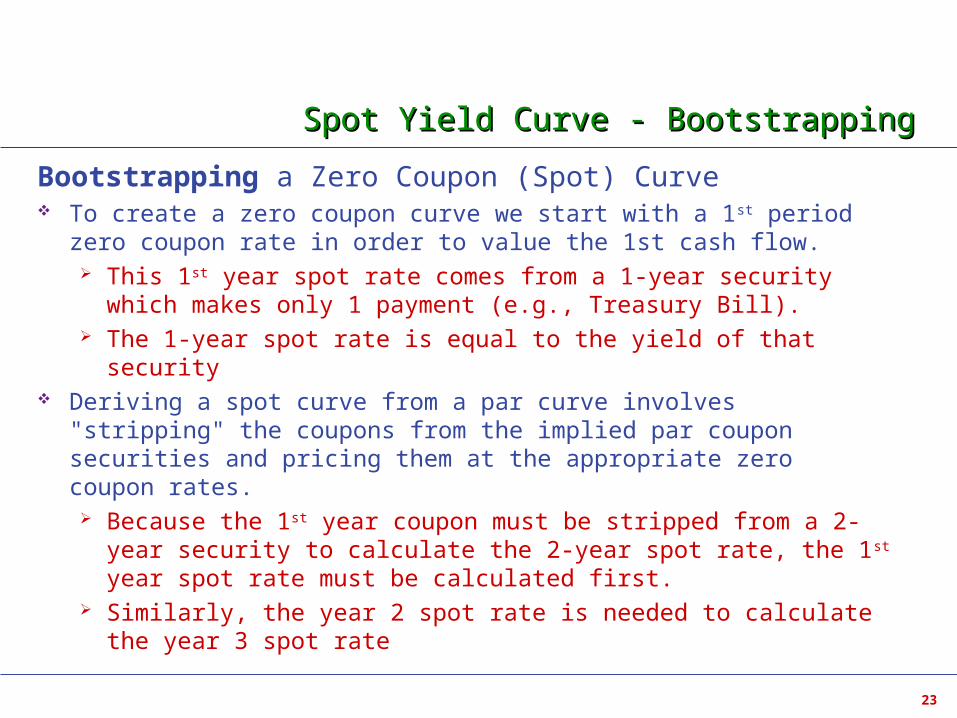
Bootstrapping a Zero Coupon (Spot) Curve To create a zero coupon curve we start with a 1st period zero coupon
rate in order to value the 1st cash flow. This 1st year spot rate comes from a 1-year security which makes
only 1 payment (e.g., Treasury Bill). The 1-year spot rate is equal to the yield of that security
Deriving a spot curve from a par curve involves "stripping" the coupons from the implied par coupon securities and pricing them at the appropriate zero coupon rates. Because the 1st year coupon must be stripped from a 2-year
security to calculate the 2-year spot rate, the 1st year spot rate must be calculated first.
Similarly, the year 2 spot rate is needed to calculate the year 3 spot rate
24
Spot Yield Curve - BootstrappingSpot Yield Curve - Bootstrapping
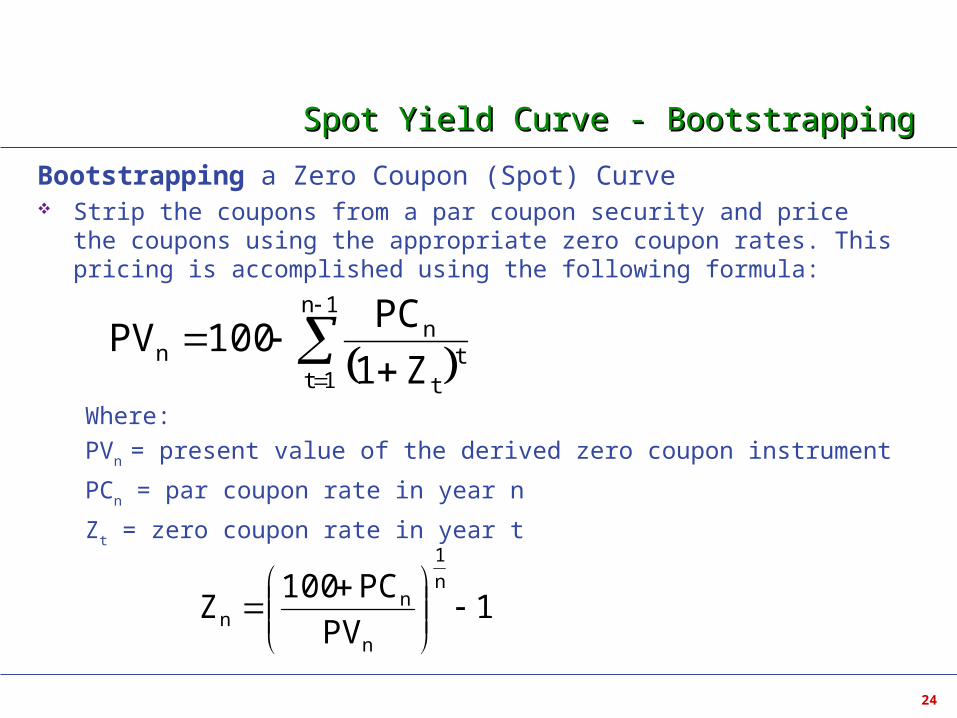
Bootstrapping a Zero Coupon (Spot) Curve Strip the coupons from a par coupon security and price the coupons using the
appropriate zero coupon rates. This pricing is accomplished using the following formula:
Where:
PVn = present value of the derived zero coupon instrument
PCn = par coupon rate in year n
Zt = zero coupon rate in year t
1n
1tt
t
nn
Z1
PC100PV
1PV
PC100Z
n
1
n
nn
25
Bootstrapping ExampleBootstrapping Example
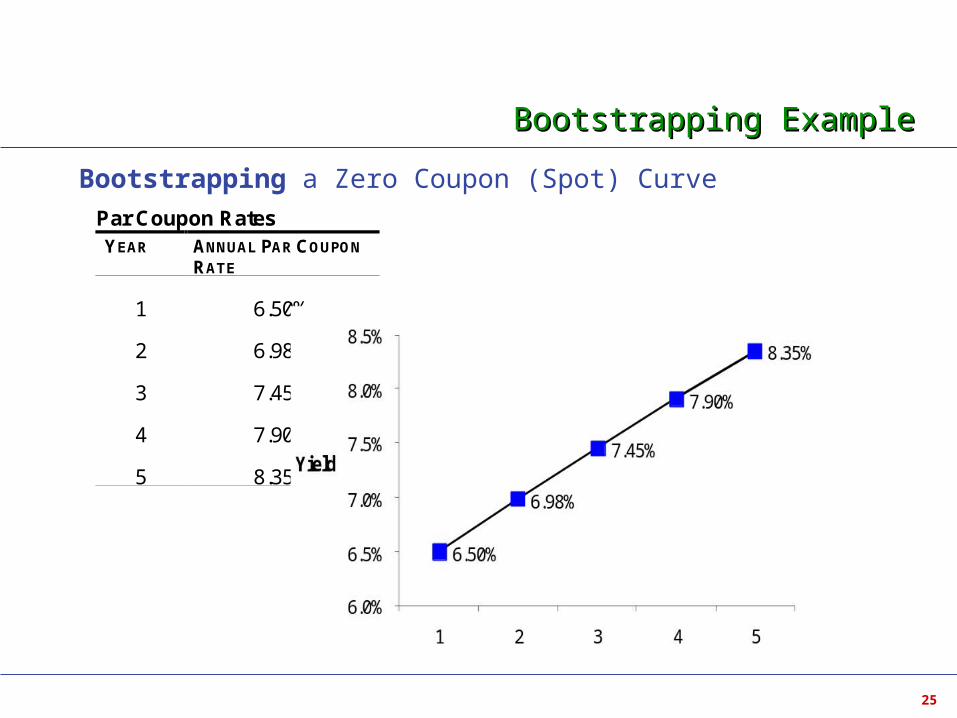
Bootstrapping a Zero Coupon (Spot) CurvePar Coupon Rates YEAR ANNUAL PAR COUPON
RATE
1 6.50%
2 6.98%
3 7.45%
4 7.90%
5 8.35%
26
Bootstrapping ExampleBootstrapping Example
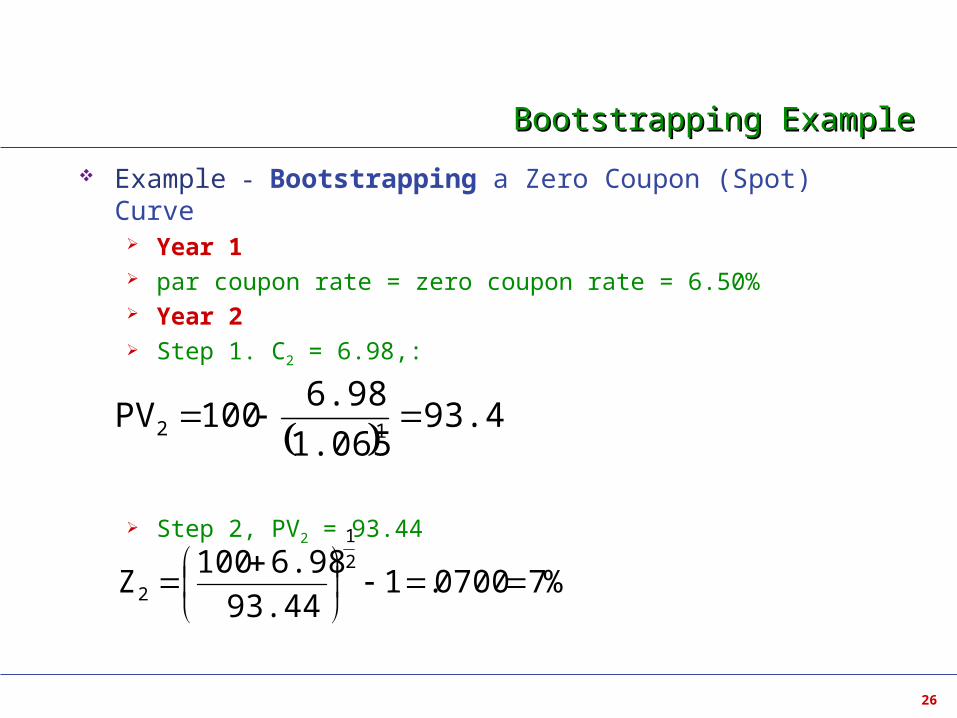
Example - Bootstrapping a Zero Coupon (Spot) Curve Year 1 par coupon rate = zero coupon rate = 6.50% Year 2 Step 1. C2 = 6.98,:
Step 2, PV2 = 93.44
93.44
1.065
6.98100PV 12
%70700.193.44
6.98100Z
2
1
2
27
Bootstrapping ExampleBootstrapping Example
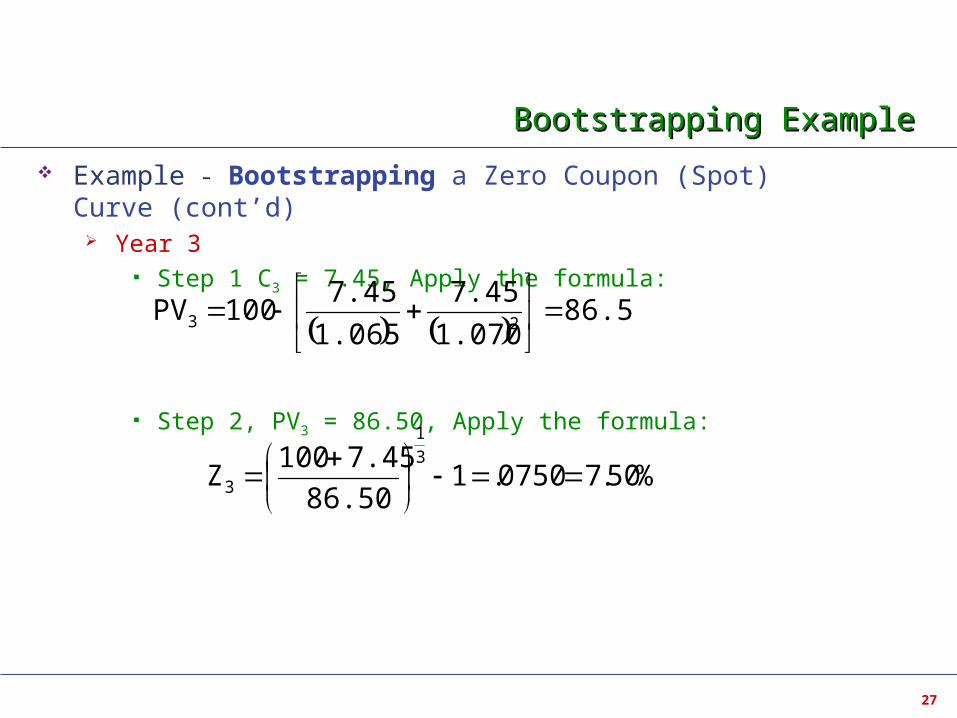
Example - Bootstrapping a Zero Coupon (Spot) Curve (cont’d) Year 3
Step 1 C3 = 7.45, Apply the formula:
Step 2, PV3 = 86.50, Apply the formula:
%50.70750.186.50
7.45100Z
3
1
3
86.50
1.070
7.45
1.065
7.45100PV 23
28
Bootstrapping ExerciseBootstrapping Exercise
Calculate the spot rate in year 4, Z4
29
Answer to ExerciseAnswer to Exercise
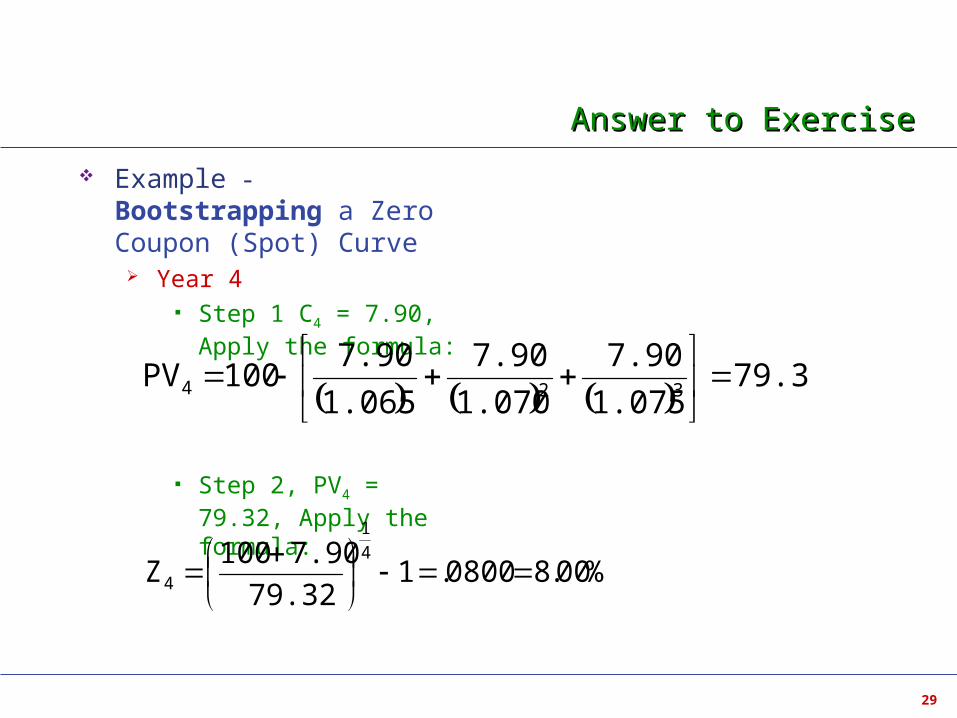
Example - Bootstrapping a Zero Coupon (Spot) Curve
Year 4 Step 1 C4 = 7.90, Apply
the formula:
Step 2, PV4 = 79.32, Apply the formula:
79.32
1.075
7.90
1.070
7.90
1.065
7.90100PV 324
%00.80800.179.32
7.90100Z
4
1
4
30
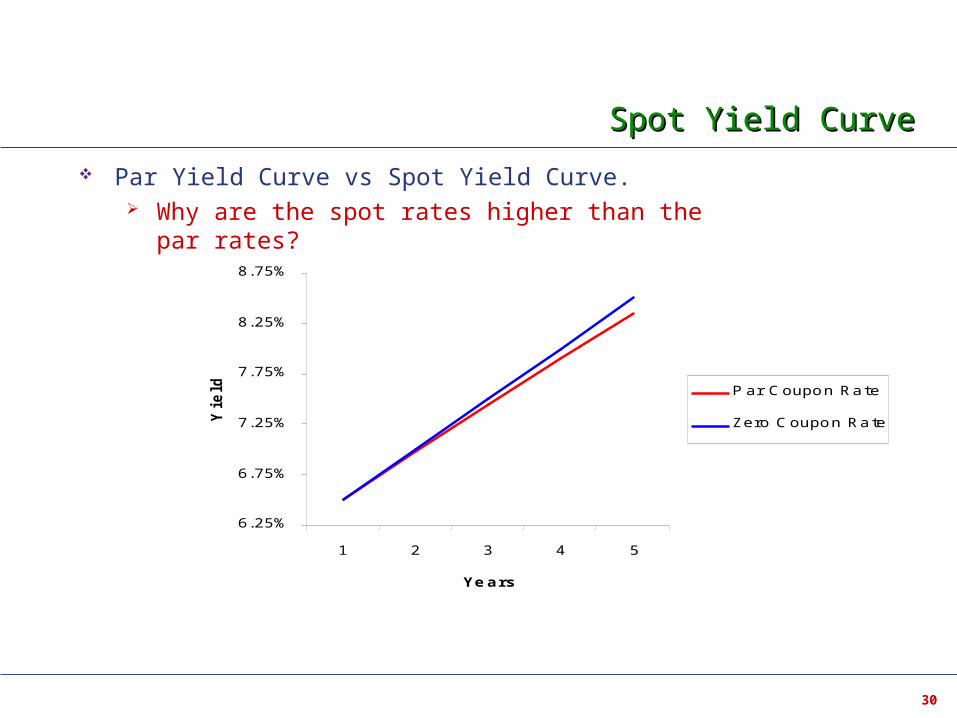
Spot Yield CurveSpot Yield Curve
Par Yield Curve vs Spot Yield Curve. Why are the spot rates higher than the par rates?
6.25%
6.75%
7.25%
7.75%
8.25%
8.75%
1 2 3 4 5
Years
Yie
ld Par Coupon Rate
Zero Coupon Rate
31
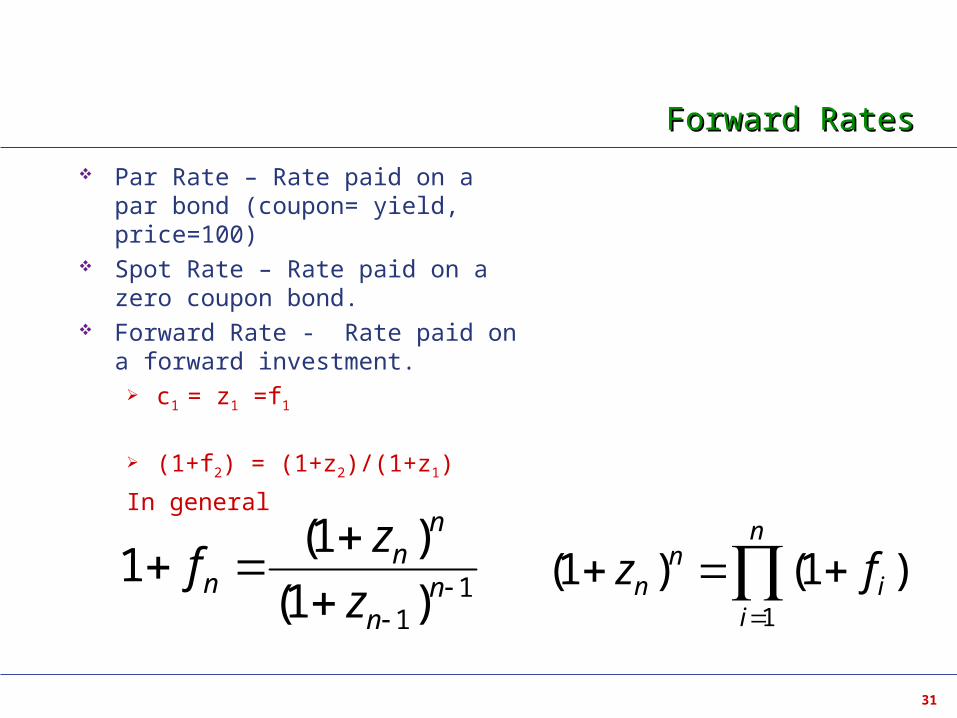
Forward RatesForward Rates
Par Rate – Rate paid on a par bond (coupon= yield, price=100)
Spot Rate – Rate paid on a zero coupon bond.
Forward Rate - Rate paid on a forward investment.
c1 = z1 =f1
(1+f2) = (1+z2)/(1+z1)
In general
)1()1(1
n
ii
nn fz1
1)1(
)1(1
n
n
nn
n z
zf
32
Total ReturnTotal Return
Nominal Return Rate of Return on a security assuming it was purchased on a
certain begin (settlement) date and sold on a certain horizon date.
The return calculation takes into account; Settlement full price, Horizon full price Intermediate cash flows from the security (coupon plus any
principal payments) Reinvestment of any intermediate cash flow payments to the
horizon date.
33
Total ReturnTotal Return
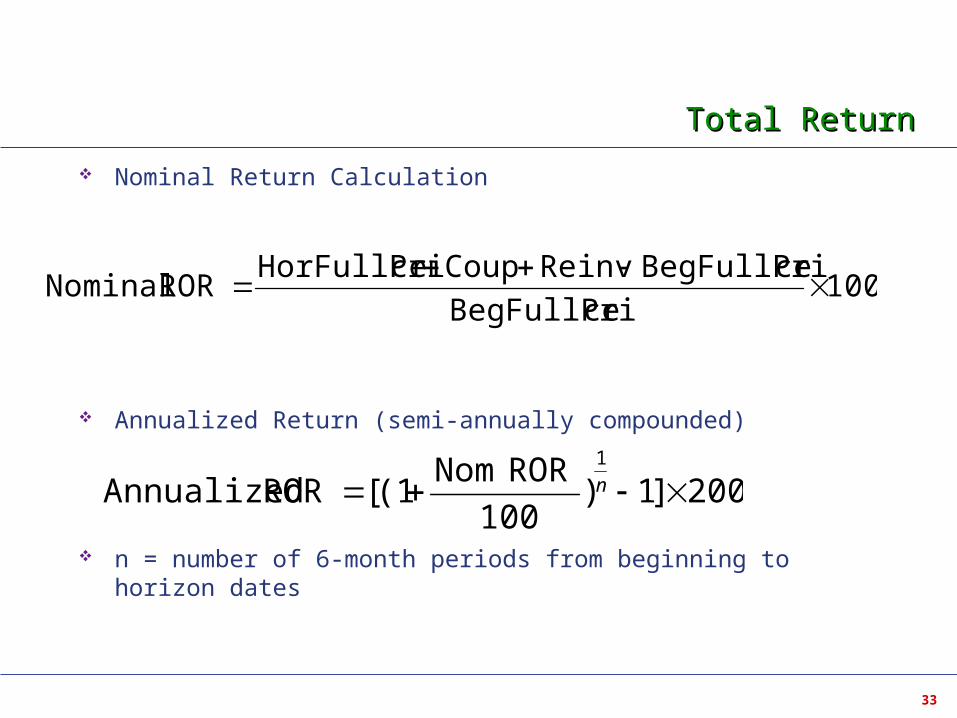
Nominal Return Calculation
Annualized Return (semi-annually compounded)
n = number of 6-month periods from beginning to horizon dates
100ceBegFullPri
ceBegFullPriReinvCoupceHorFullPriROR Nominal
200]1)100
ROR Nom(1[ROR Annualized
1
n
34
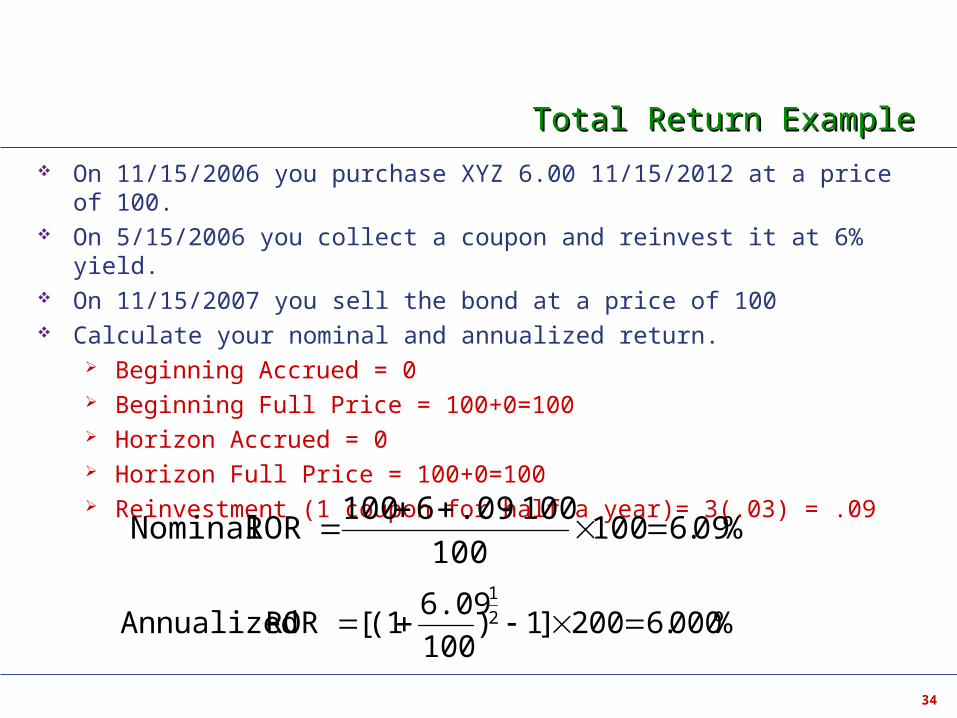
Total Return ExampleTotal Return Example
On 11/15/2006 you purchase XYZ 6.00 11/15/2012 at a price of 100. On 5/15/2006 you collect a coupon and reinvest it at 6% yield. On 11/15/2007 you sell the bond at a price of 100 Calculate your nominal and annualized return.
Beginning Accrued = 0 Beginning Full Price = 100+0=100 Horizon Accrued = 0 Horizon Full Price = 100+0=100 Reinvestment (1 coupon for half a year)= 3(.03) = .09
%09.6100100
100.096100ROR Nominal
%000.6200]1)100
6.09(1[ROR Annualized 2
1
35
Differences between Annualized ROR and YTMDifferences between Annualized ROR and YTM
YTM is the Internal Rate of Return (IIR) of the bonds cashflows The discount rate at which the sum of the PV of the cashflows equals
the Full Price of the bond YTM presumes you hold the bond until maturity YTM ignores reinvestment
ROR takes into account Sale of security prior to maturity Reinvestment Rate
For ROR = YTM Bond needs to be held to maturity or sold at the same YTM Reinvestment Rate must equal the YTM
36
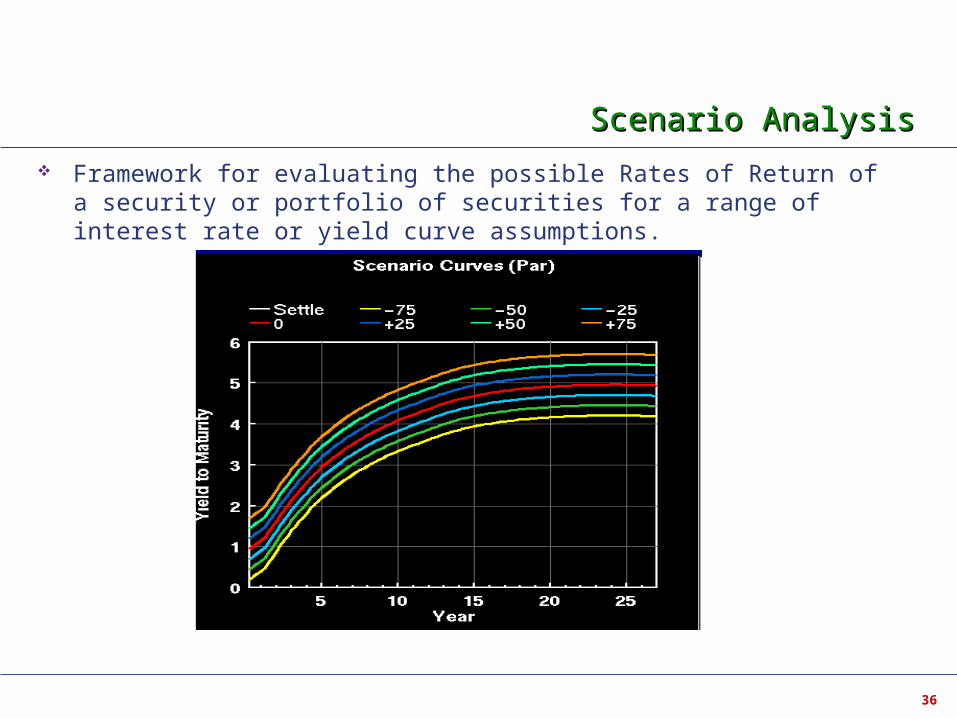
Scenario AnalysisScenario Analysis
Framework for evaluating the possible Rates of Return of a security or portfolio of securities for a range of interest rate or yield curve assumptions.
37
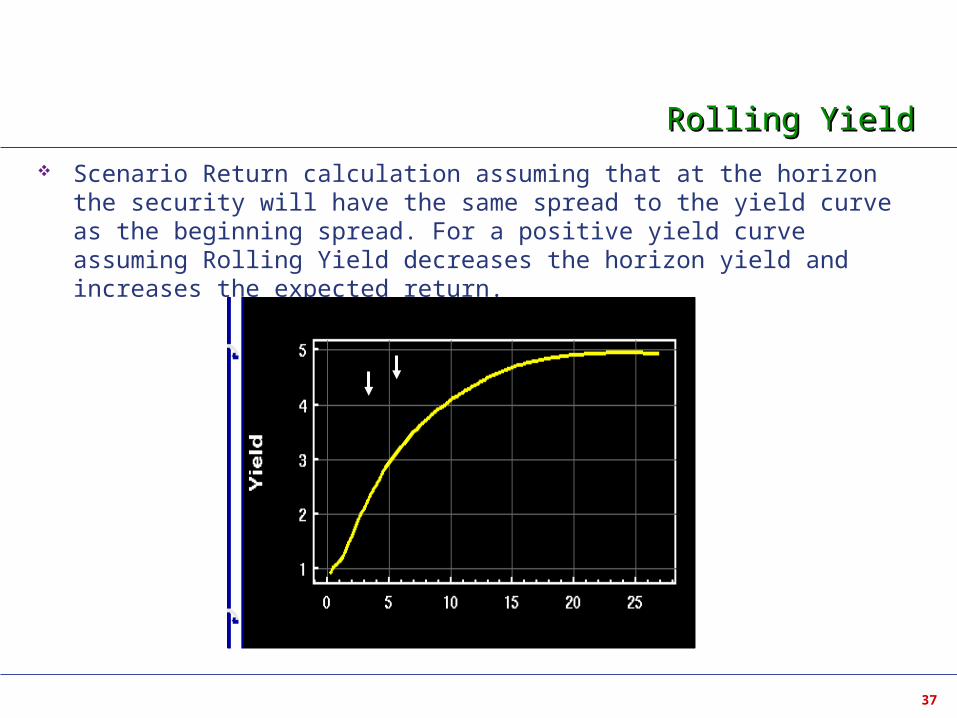
Rolling YieldRolling Yield
Scenario Return calculation assuming that at the horizon the security will have the same spread to the yield curve as the beginning spread. For a positive yield curve assuming Rolling Yield decreases the horizon yield and increases the expected return.
38
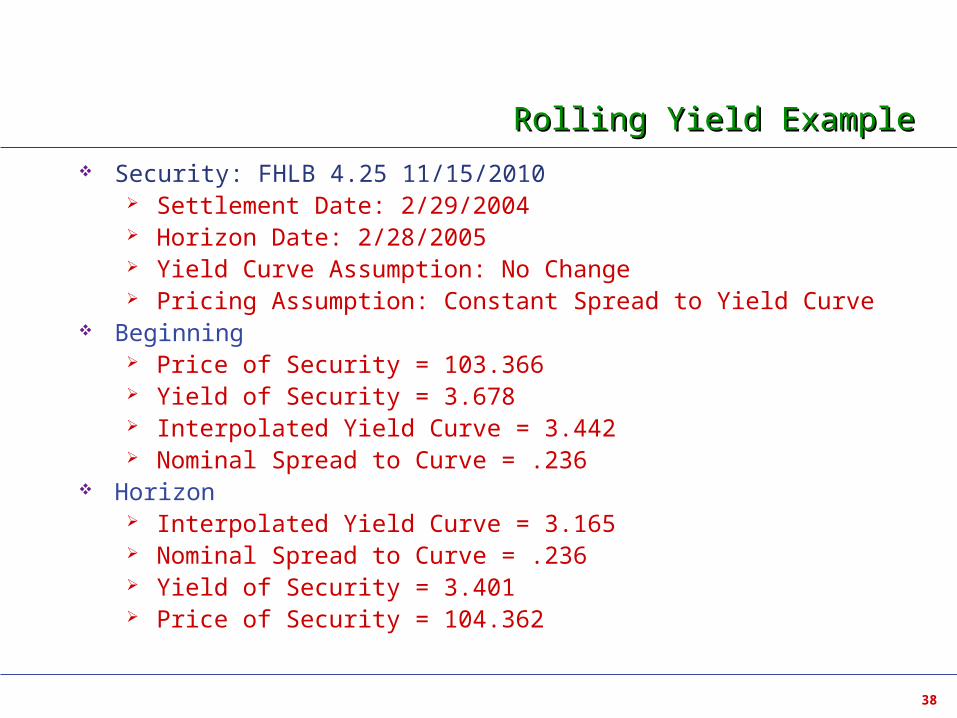
Rolling Yield ExampleRolling Yield Example
Security: FHLB 4.25 11/15/2010 Settlement Date: 2/29/2004 Horizon Date: 2/28/2005 Yield Curve Assumption: No Change Pricing Assumption: Constant Spread to Yield Curve
Beginning Price of Security = 103.366 Yield of Security = 3.678 Interpolated Yield Curve = 3.442 Nominal Spread to Curve = .236
Horizon Interpolated Yield Curve = 3.165 Nominal Spread to Curve = .236 Yield of Security = 3.401 Price of Security = 104.362
39
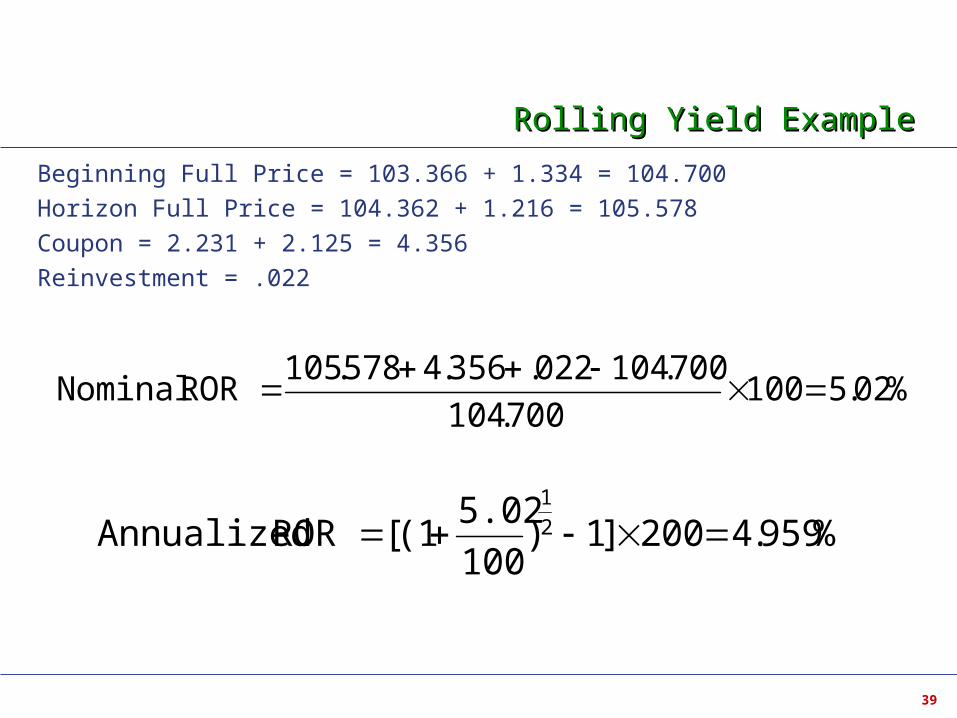
Rolling Yield ExampleRolling Yield Example
Beginning Full Price = 103.366 + 1.334 = 104.700
Horizon Full Price = 104.362 + 1.216 = 105.578
Coupon = 2.231 + 2.125 = 4.356
Reinvestment = .022
%02.5100700.104
700.104022.356.4578.105ROR Nominal
%959.4200]1)100
5.02(1[ROR Annualized 2
1
40
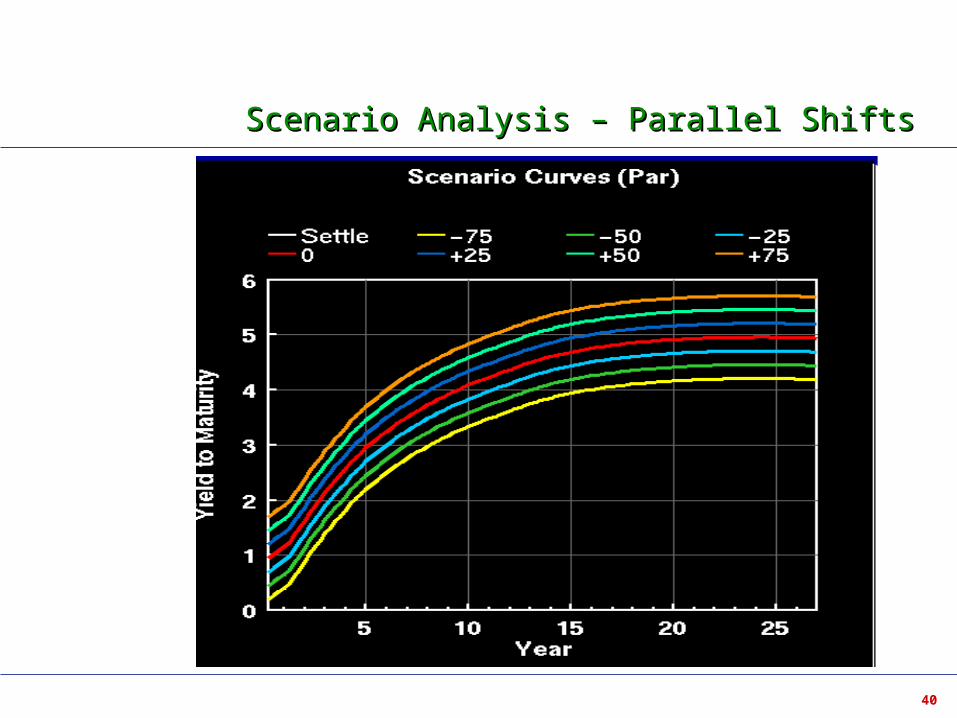
Scenario Analysis – Parallel ShiftsScenario Analysis – Parallel Shifts
41
Non Parallel ShiftsNon Parallel Shifts
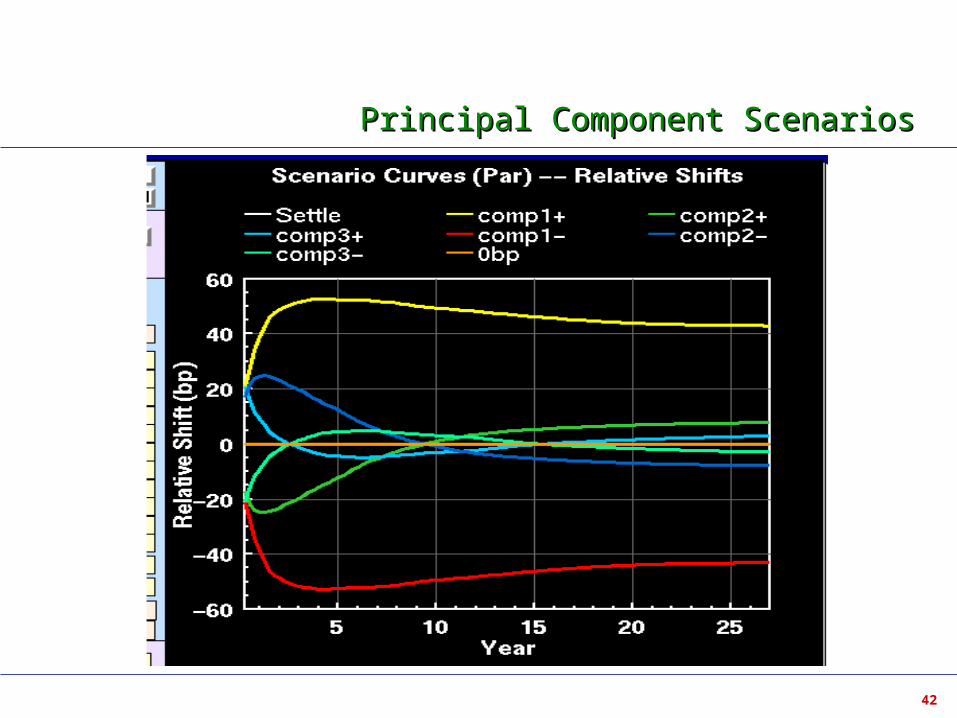
Principal Component Scenarios Statistically likely re-shapings of the Yield Curve Derived through analysis of 15 years of monthly movements in the
Off-the-Run Treasury Yield Curve. These scenarios model 95% of observed movements in the Yield
Curve. 95% of the monthly movements over the past 15 years could be
represented as a linear combination of the Principal Component Scenarios.
42
Principal Component ScenariosPrincipal Component Scenarios