Embed Size (px)
Citation preview

1
Yang Yang, Jie Tang, Juanzi LiTsinghua University
Walter Luyten, Marie-Francine MoensKatholieke Universiteit Leuven
Lu LiuNorthwestern University
Forecasting Potential Diabetes Complications
2
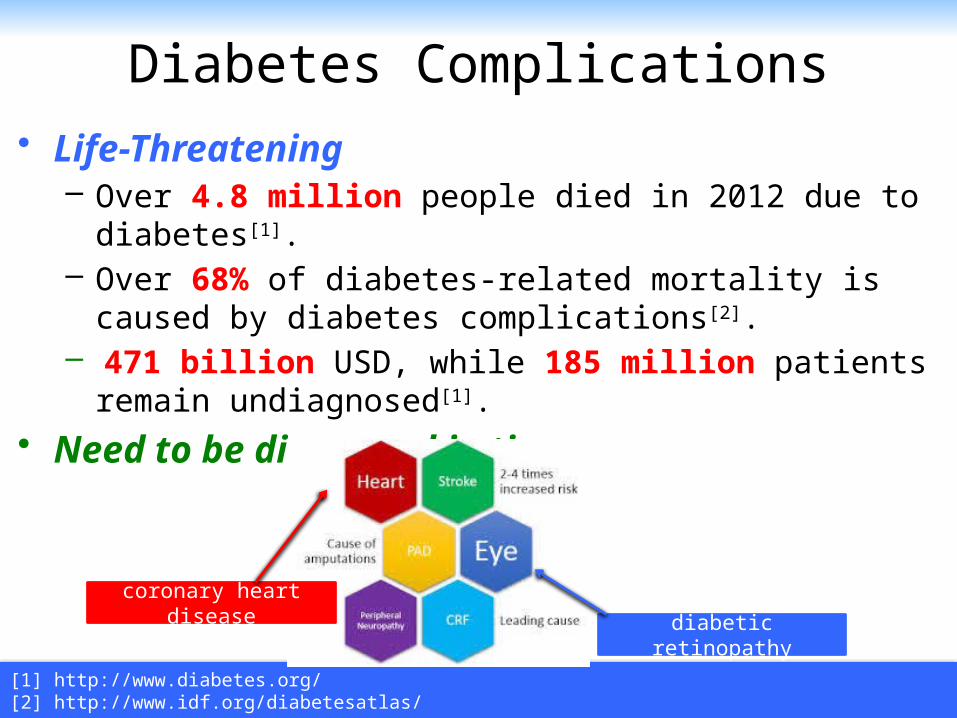
Diabetes Complications• Life-Threatening
– Over 4.8 million people died in 2012 due to diabetes[1].– Over 68% of diabetes-related mortality is caused by
diabetes complications[2].– 471 billion USD, while 185 million patients remain
undiagnosed[1].
• Need to be diagnosed in time
[1] http://www.diabetes.org/[2] http://www.idf.org/diabetesatlas/
coronary heart disease
diabetic retinopathy
3
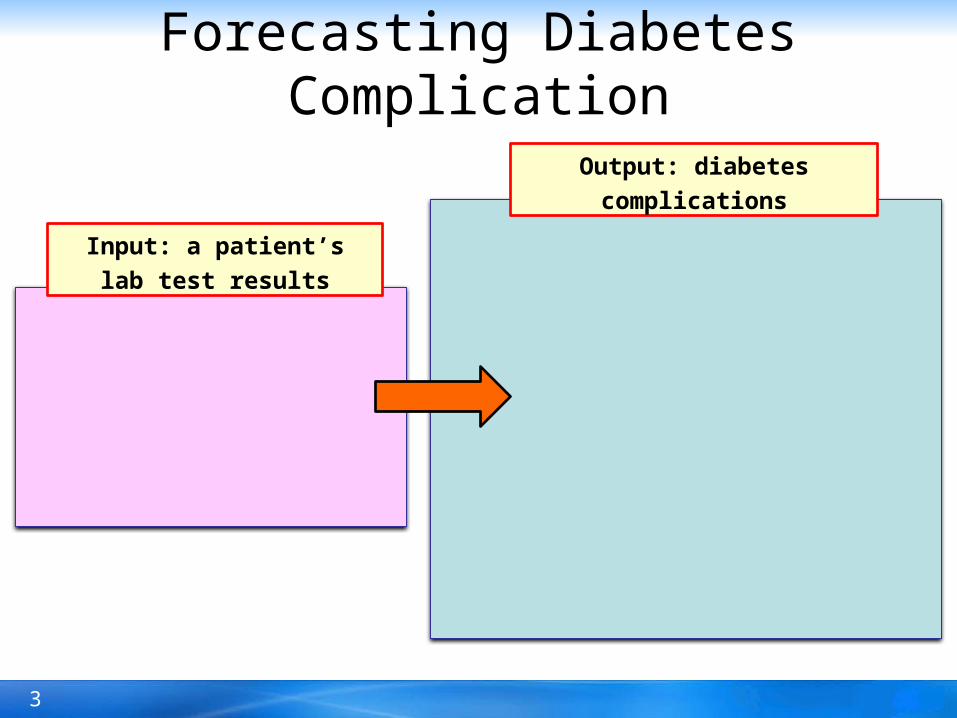
Forecasting Diabetes Complication
Routine urine analysis
Bilirubin example
coronary heart disease
diabetic retinopathy
Output: diabetes
complications
Input: a patient’s lab
test results
4
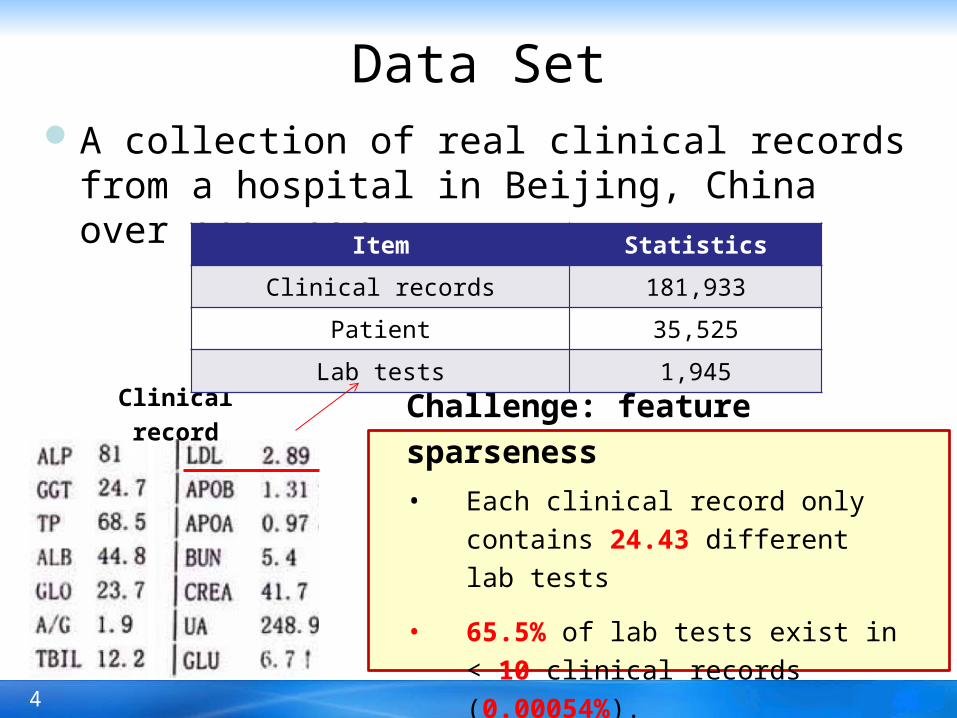
Data SetA collection of real clinical records from a hospital in
Beijing, China over one year.
Clinical record
Challenge: feature sparseness
• Each clinical record only contains
24.43 different lab tests
• 65.5% of lab tests exist in < 10
clinical records (0.00054%).
Item Statistics
Clinical records 181,933
Patient 35,525
Lab tests 1,945

5
Our Approach
6
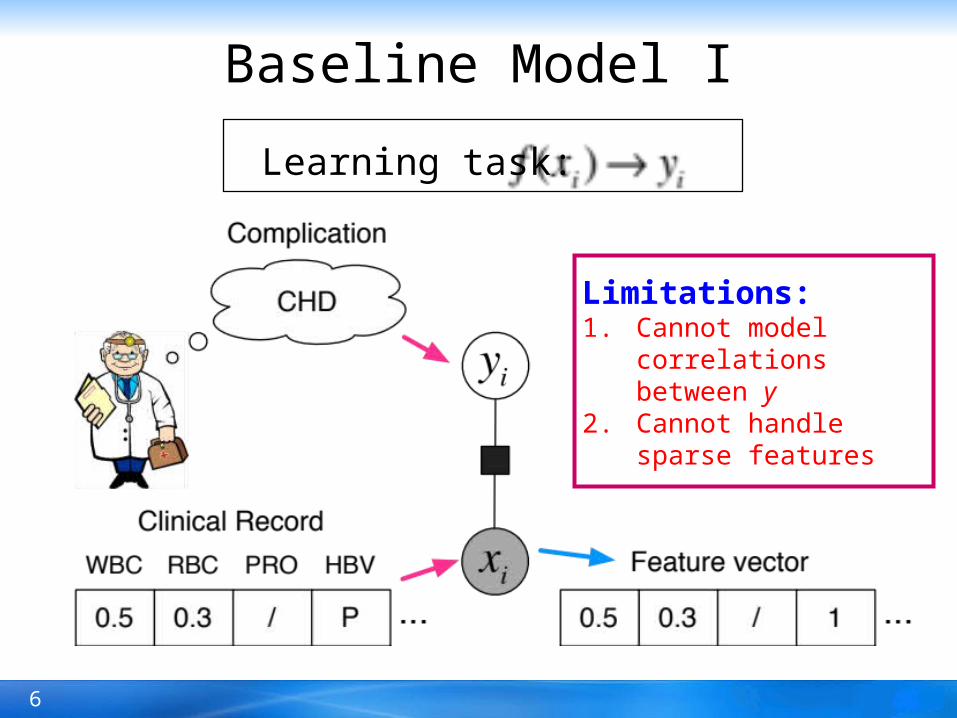
Baseline Model I
Learning task:
Limitations:1. Cannot model
correlations between y2. Cannot handle sparse
features
7
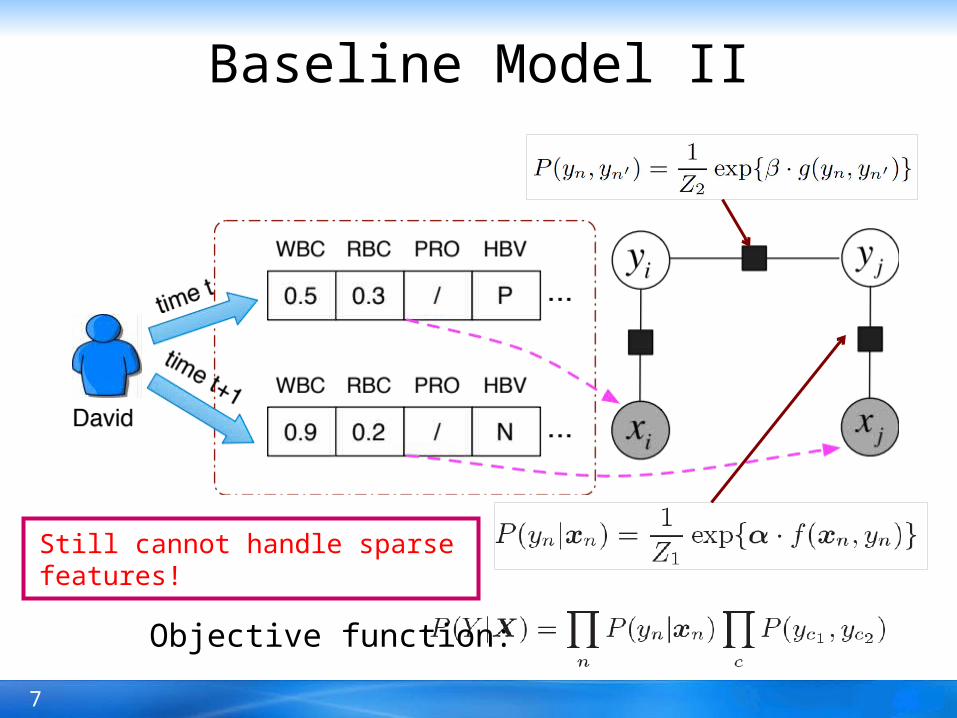
Baseline Model II
Objective function:
Still cannot handle sparse features!
8
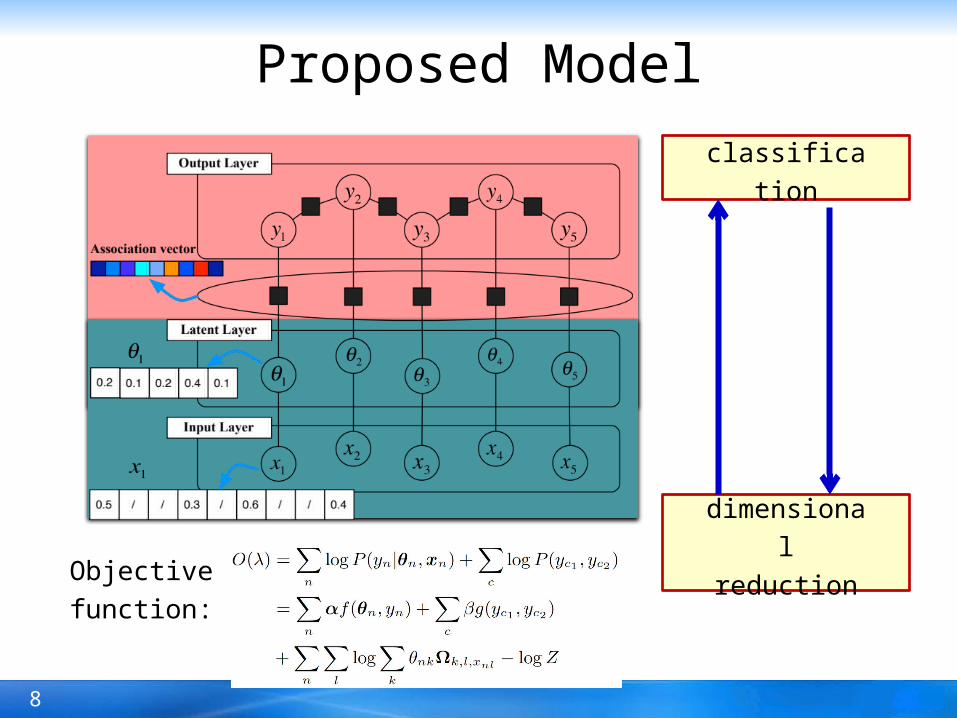
Proposed Model
dimensional
reduction
classification
Objective
function:
9
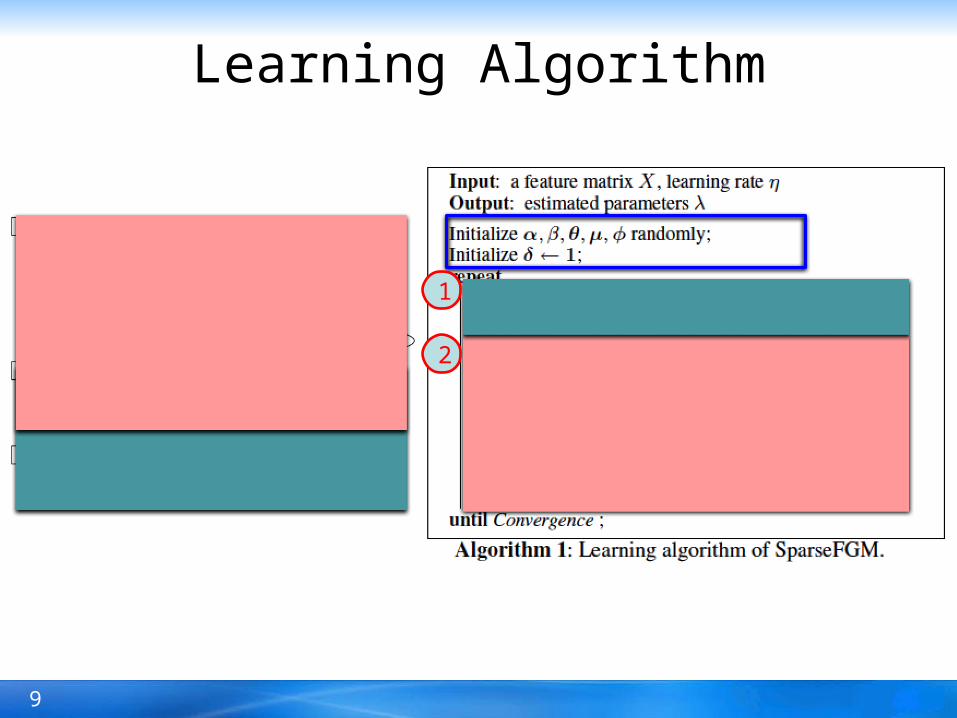
Learning Algorithm
1
2
10
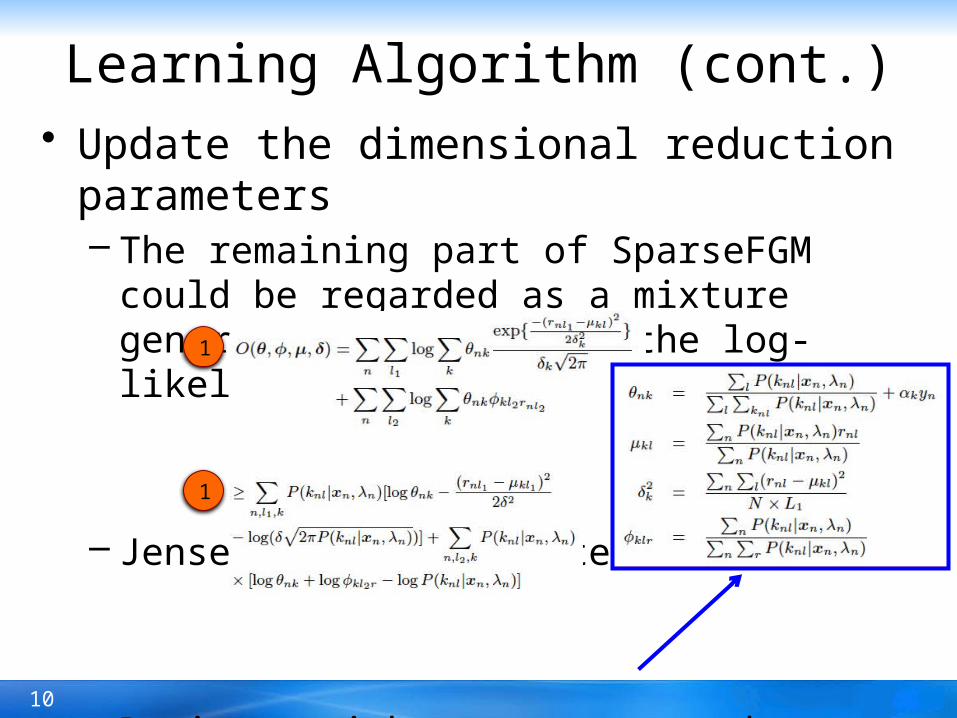
Learning Algorithm (cont.)• Update the dimensional reduction parameters
– The remaining part of SparseFGM could be regarded as a mixture generative model, with the log-likelihood
– Jensen’s inequality tells us that
– Derivate with respect to each parameters, set them to zero, and get the update equations.
1
1
11
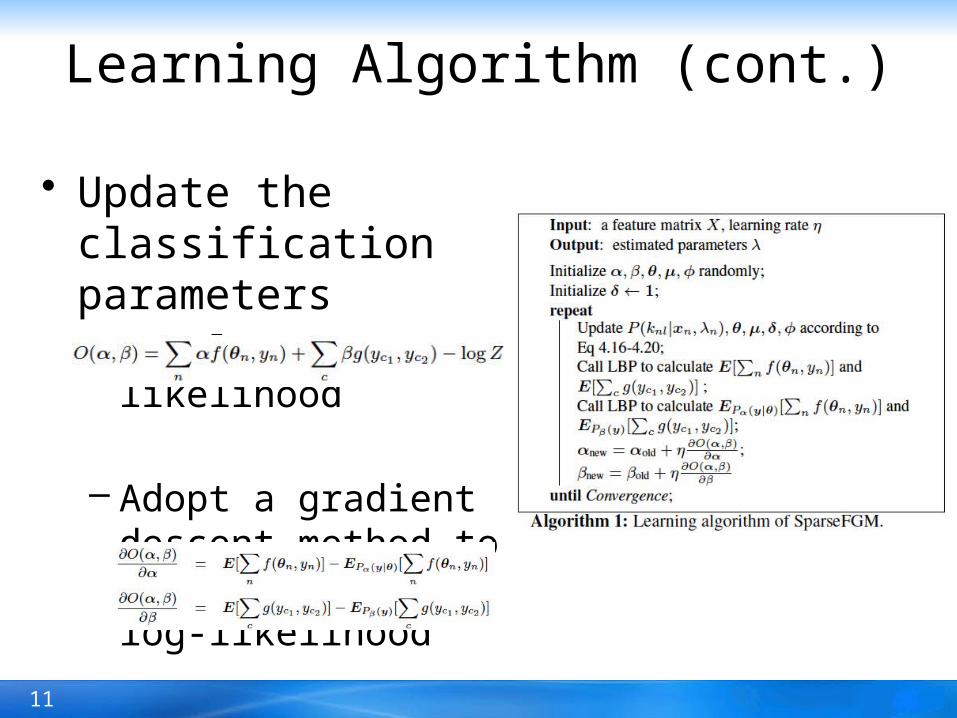
Learning Algorithm (cont.)
• Update the classification parameters– New log-likelihood
– Adopt a gradient descent method to optimize the new log-likelihood
12
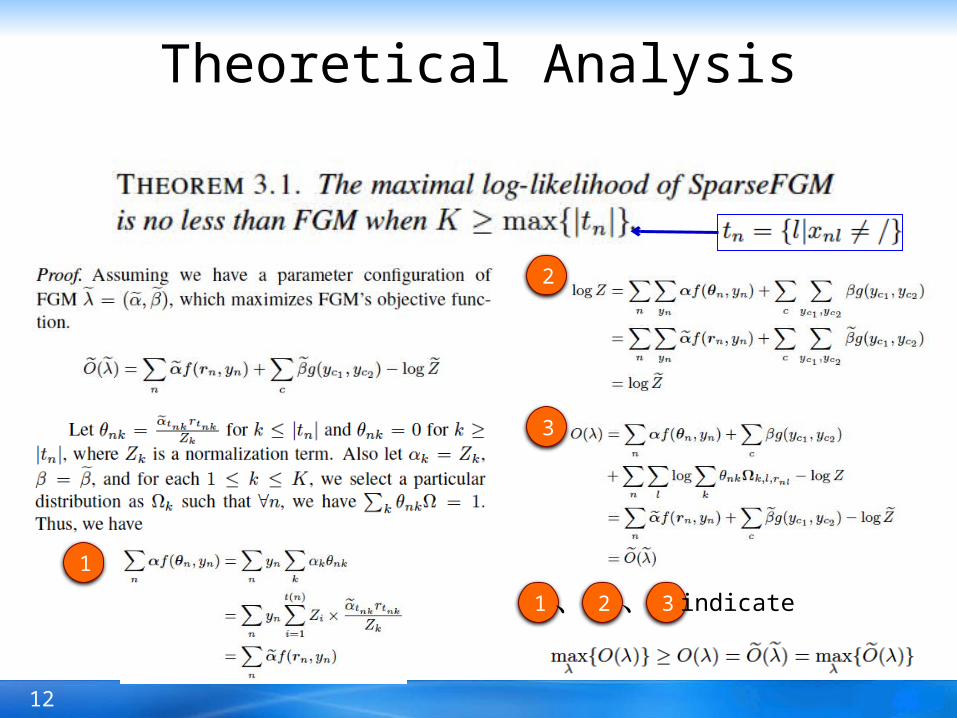
Theoretical Analysis
1
2
3
1 2 3、 、 indicate
13
Experiments
14
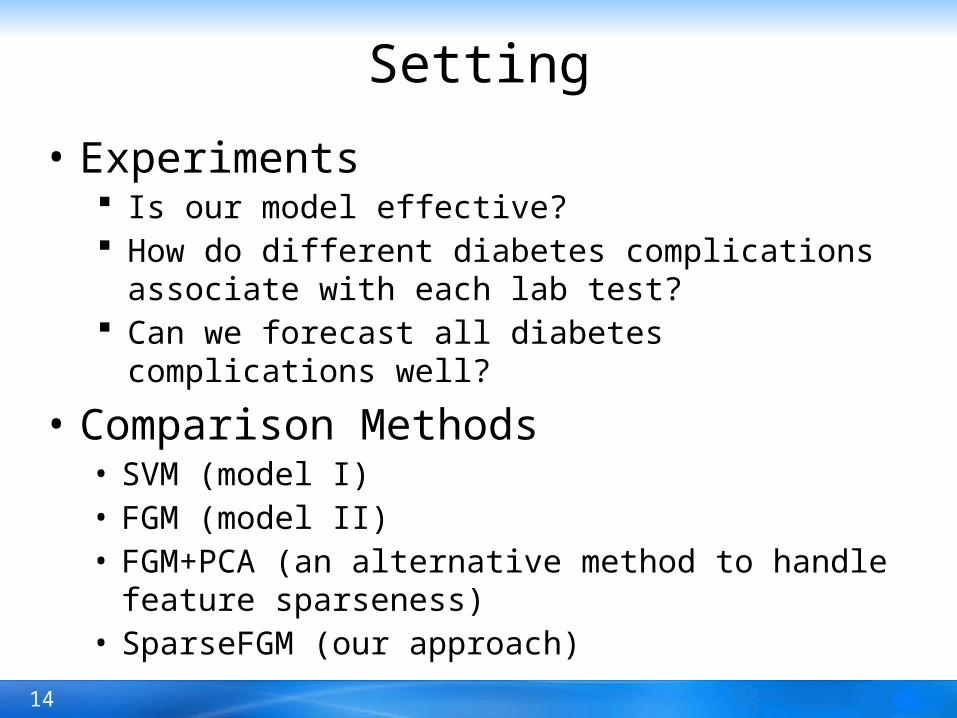
Setting
• Experiments Is our model effective? How do different diabetes complications associate with
each lab test? Can we forecast all diabetes complications well?
• Comparison Methods• SVM (model I)• FGM (model II)• FGM+PCA (an alternative method to handle feature
sparseness)• SparseFGM (our approach)
15
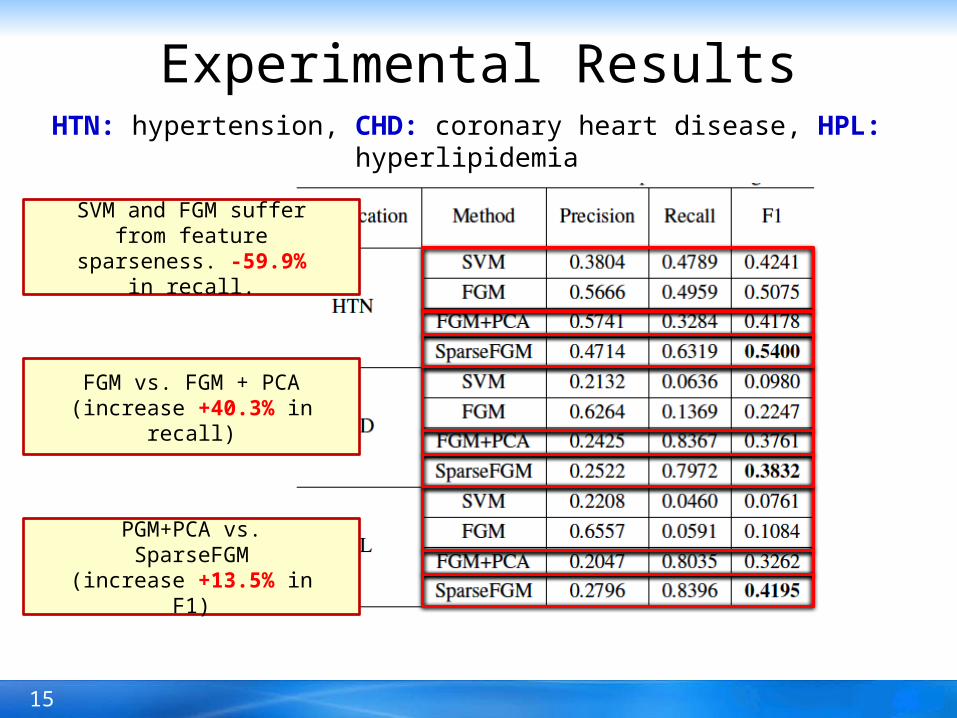
Experimental ResultsHTN: hypertension, CHD: coronary heart disease, HPL: hyperlipidemia
SVM and FGM suffer from feature sparseness. -
59.9% in recall.
FGM vs. FGM + PCA(increase +40.3% in recall)
PGM+PCA vs. SparseFGM(increase +13.5% in F1)
16
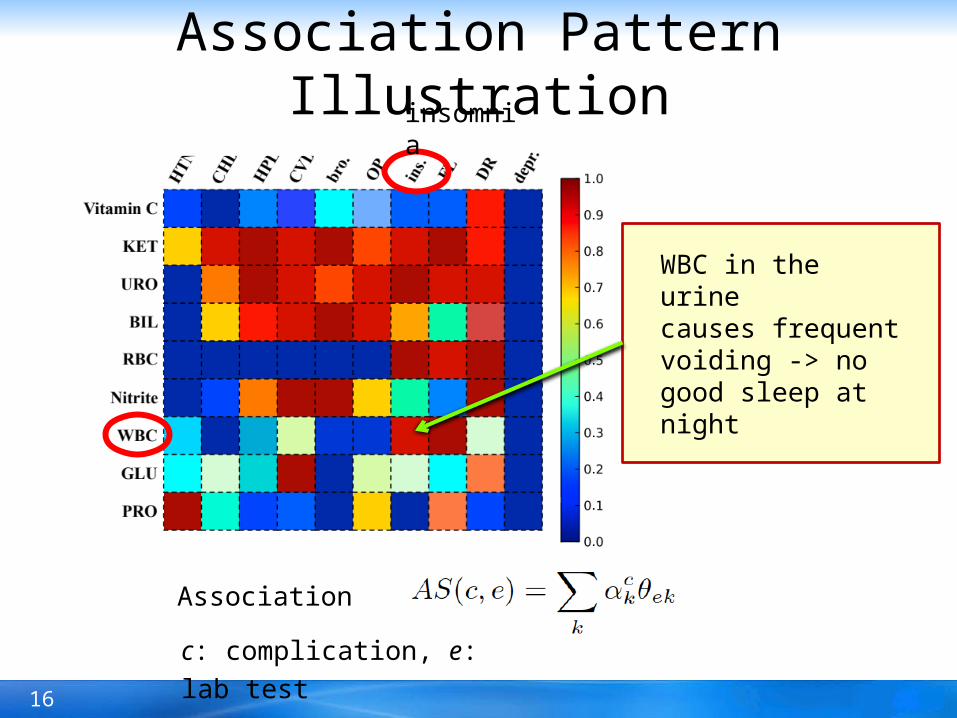
Association Pattern Illustration
WBC in the urinecauses frequent voiding -> no good sleep at night
Association score:
c: complication, e: lab test
insomnia
17
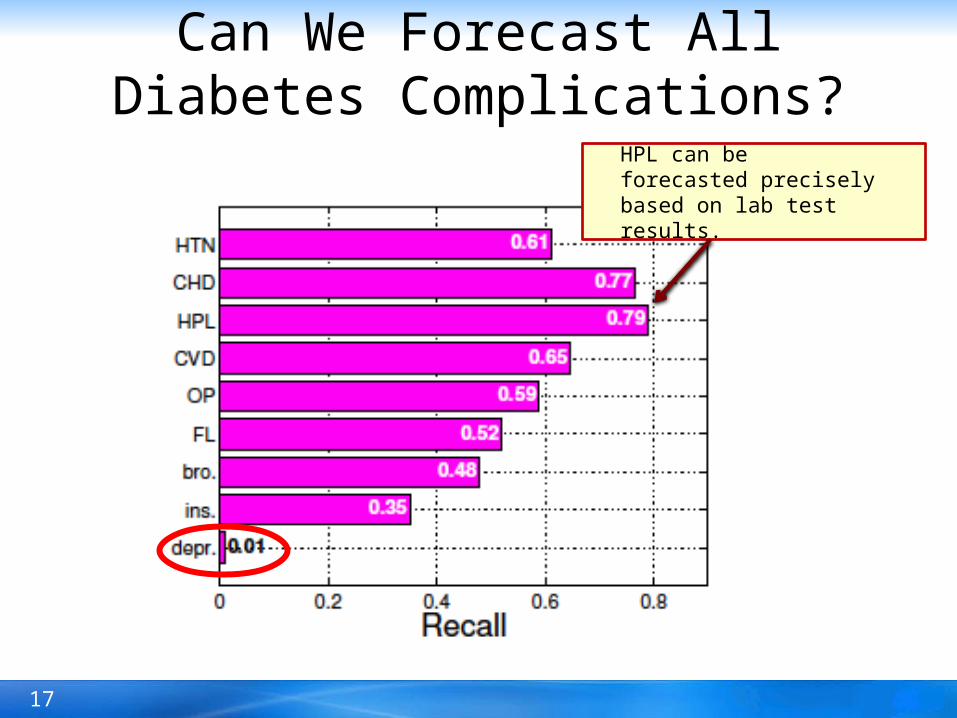
Can We Forecast All Diabetes Complications?
HPL can be forecasted precisely based on lab test results.
18
Conclusion
• We study the problem of forecasting diabetes complications.
• We propose a graphical model which integrates dimensional reduction and classification into a uniform framework.
• We further study the underlying associations between different diabetes complications and lab test types.