Embed Size (px)
Citation preview

1
Workforce Symposium
March 31, 2006
Bill Payne & Mark Stasson
2
Where this Survey Data came from? Co-occurring Training Project (partners)
Chemical Health Division (DHS) Metropolitan State University Continuing Education (MCTC)
Attendance mandated by new Rule 31 regulation
3
Where this Survey Data came from? Training delivery
60, 2-day training sessions October, 2004 to September, 2005 Nearly 1400 participants
4
Where this Survey Data came from? Evaluation Components of Training Sessions
Pre/Post Test Training Evaluation (Participants & Trainer) Outcome Evaluation Workforce Survey
5
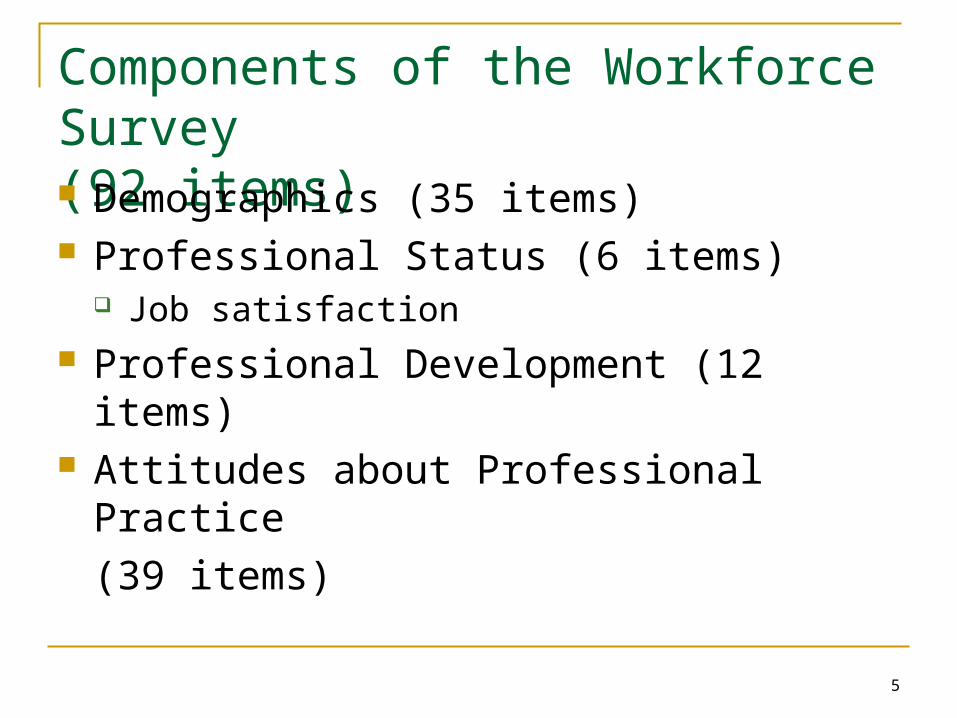
Components of the Workforce Survey(92 items) Demographics (35 items) Professional Status (6 items)
Job satisfaction Professional Development (12 items) Attitudes about Professional Practice
(39 items)
6
Results from Workforce Survey…
“The most comprehensive and authoritative picture of the Chemical Dependency workforce ever collected in Minnesota”
7
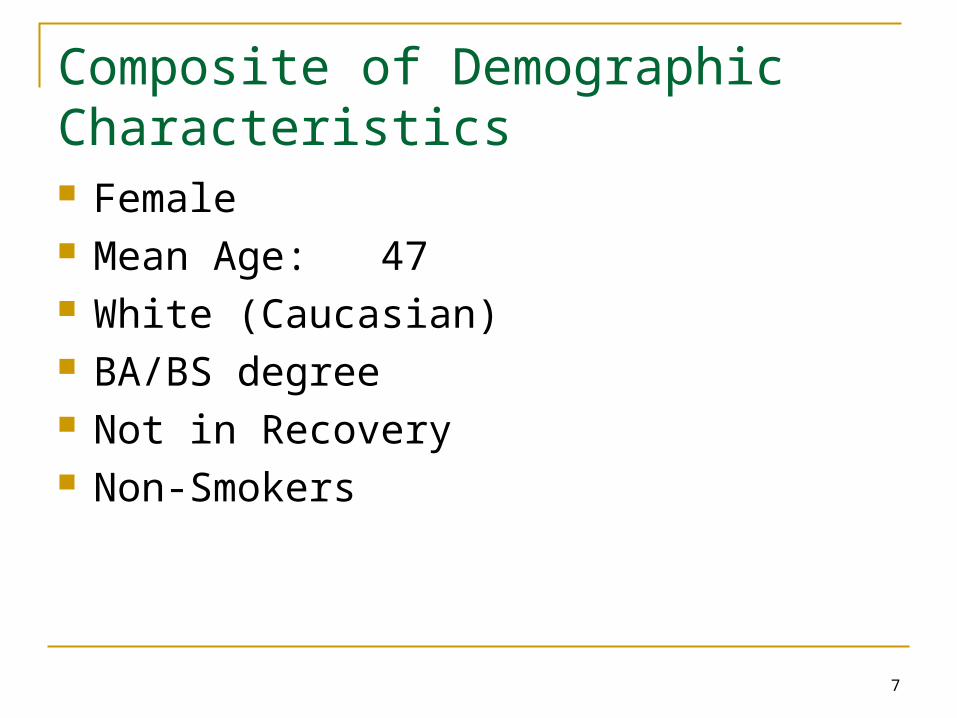
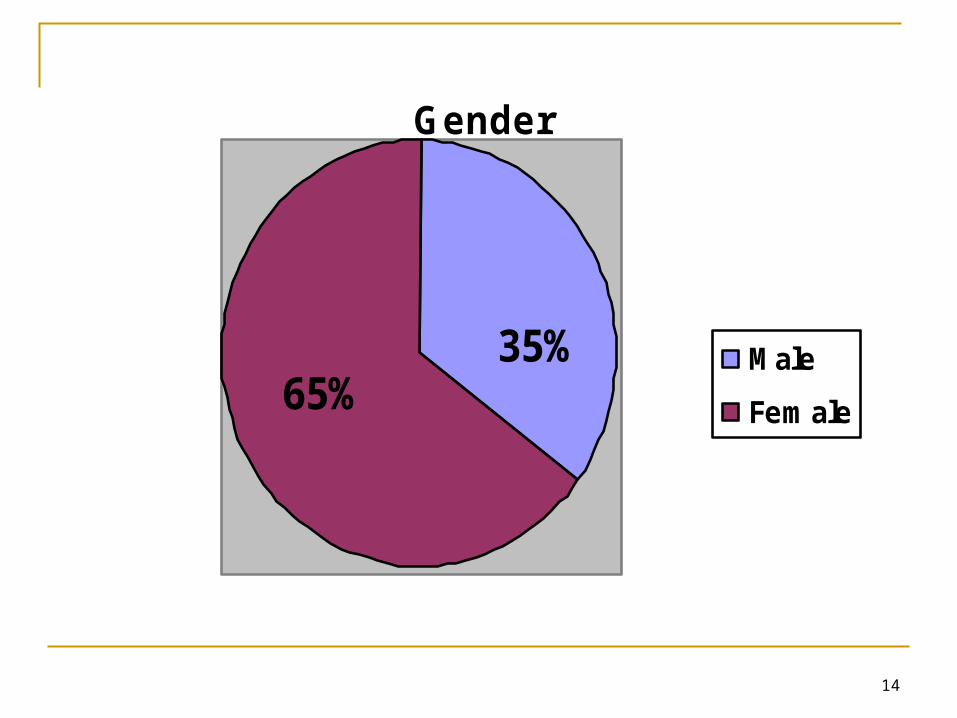
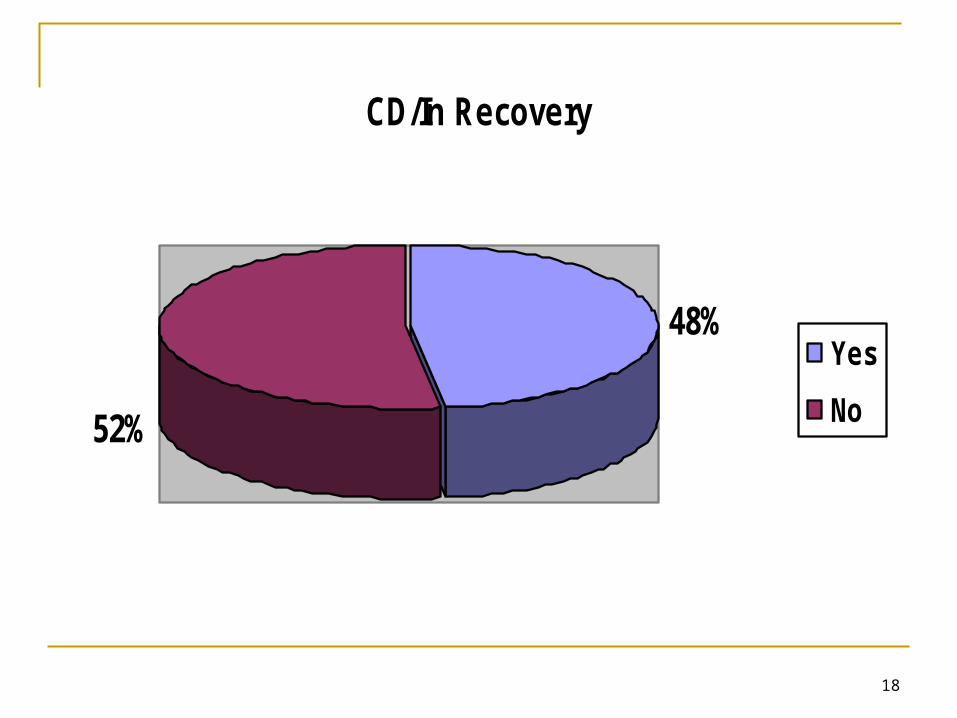
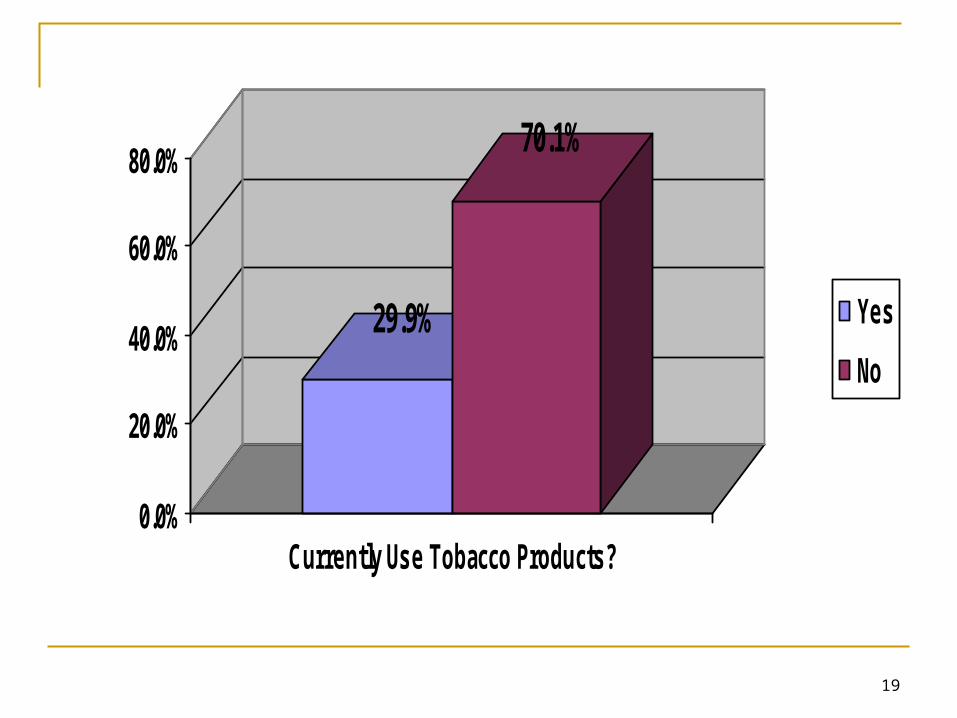
Composite of Demographic Characteristics Female Mean Age: 47 White (Caucasian) BA/BS degree Not in Recovery Non-Smokers
8
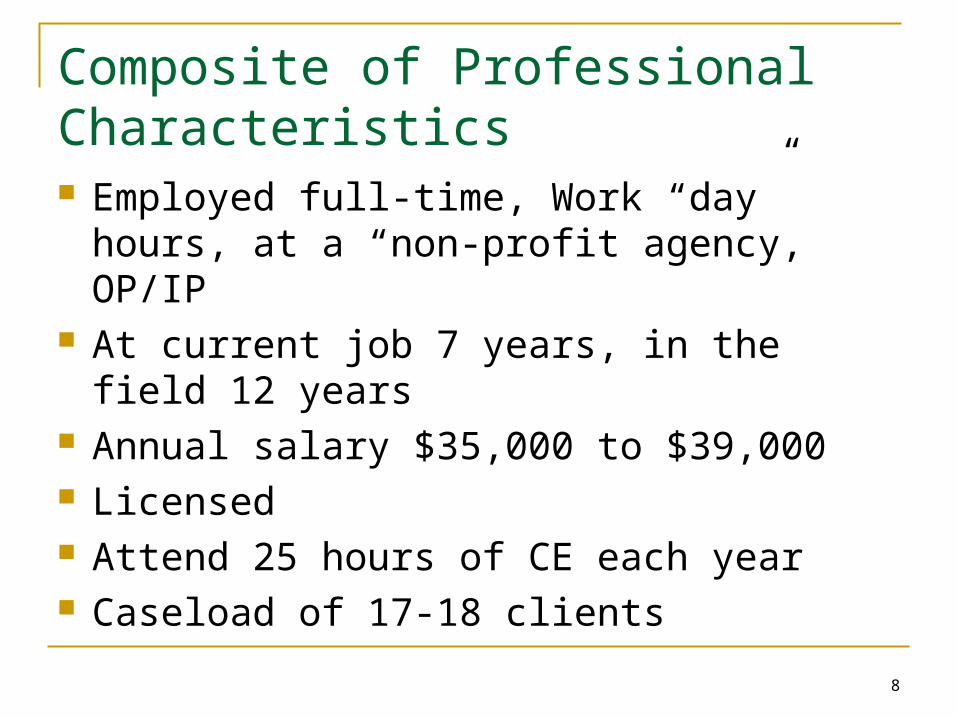
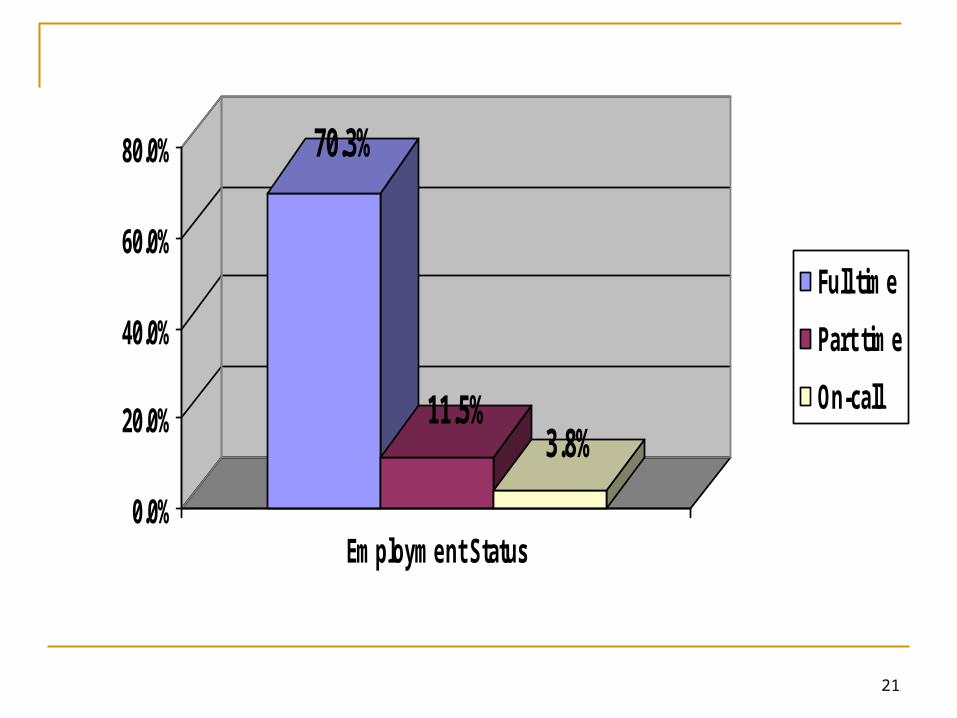
Composite of Professional Characteristics Employed full-time, Work “day” hours, at a
“non-profit agency, OP/IP At current job 7 years, in the field 12 years Annual salary $35,000 to $39,000 Licensed Attend 25 hours of CE each year Caseload of 17-18 clients
9
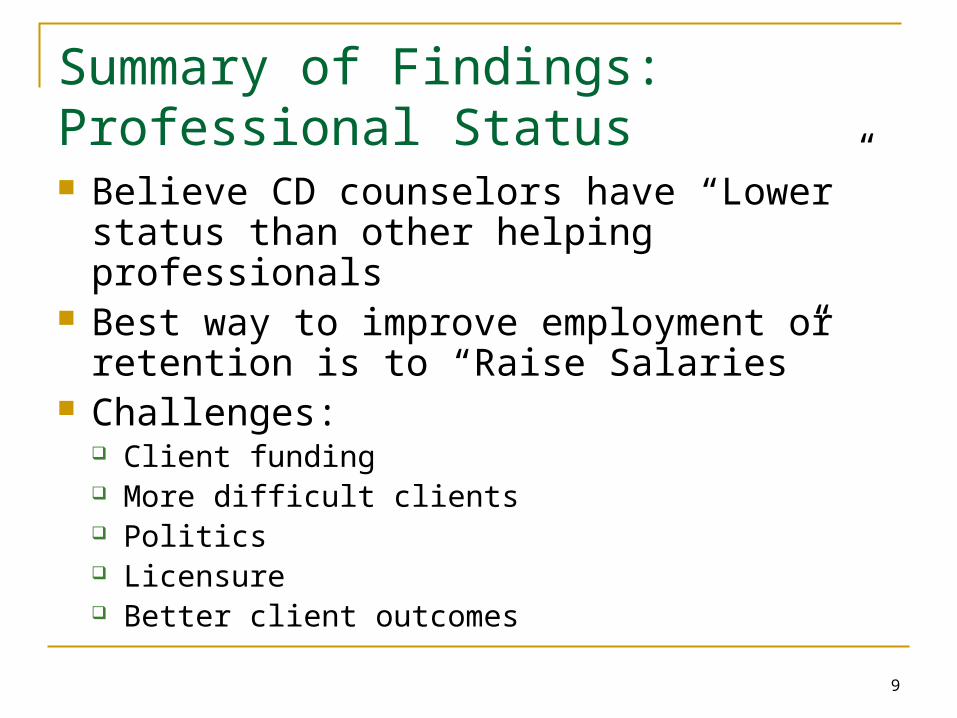
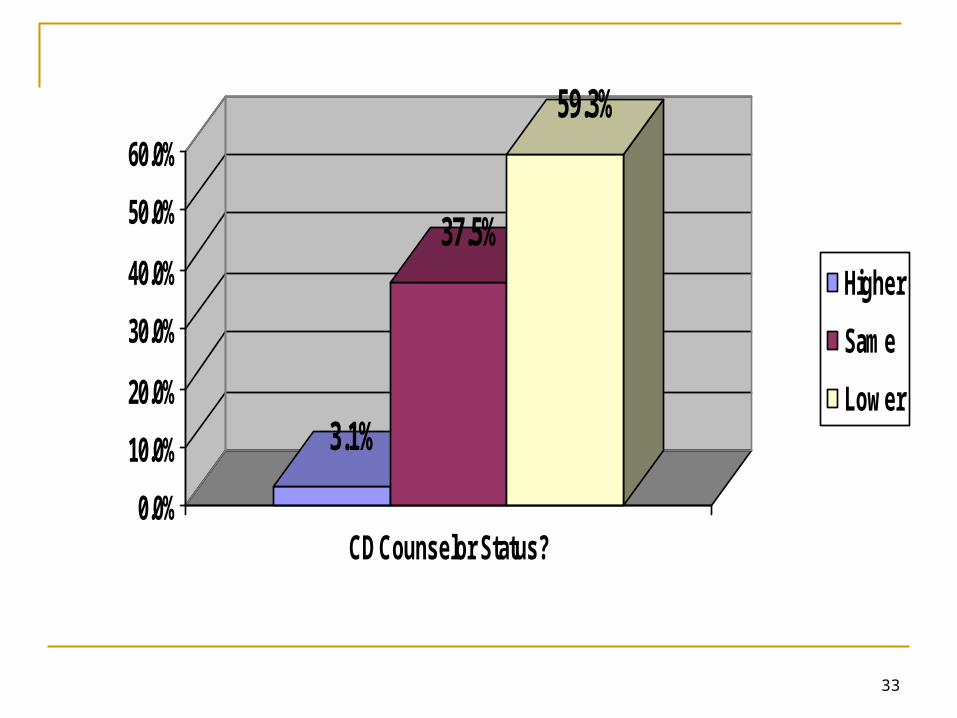
Summary of Findings: Professional Status Believe CD counselors have “Lower” status
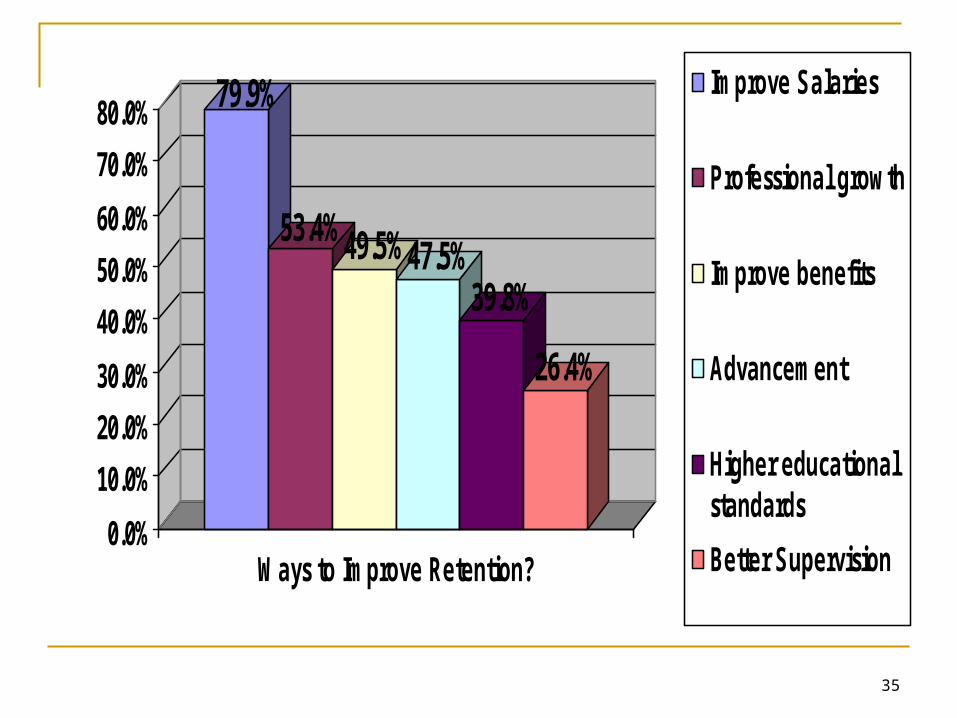
than other helping professionals Best way to improve employment or retention
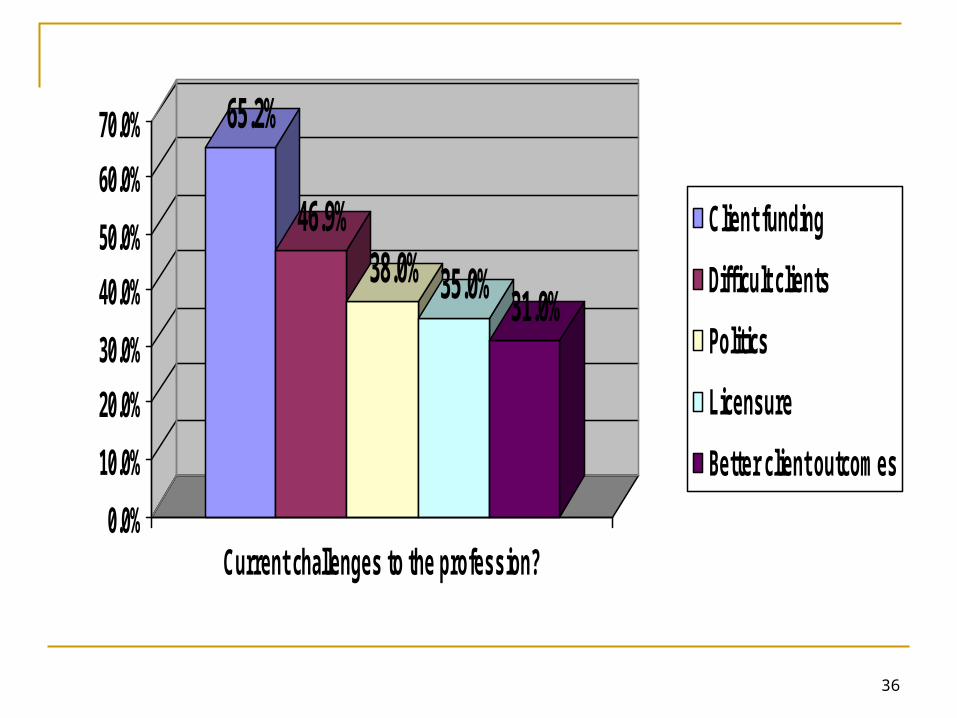
is to “Raise Salaries” Challenges:
Client funding More difficult clients Politics Licensure Better client outcomes
10
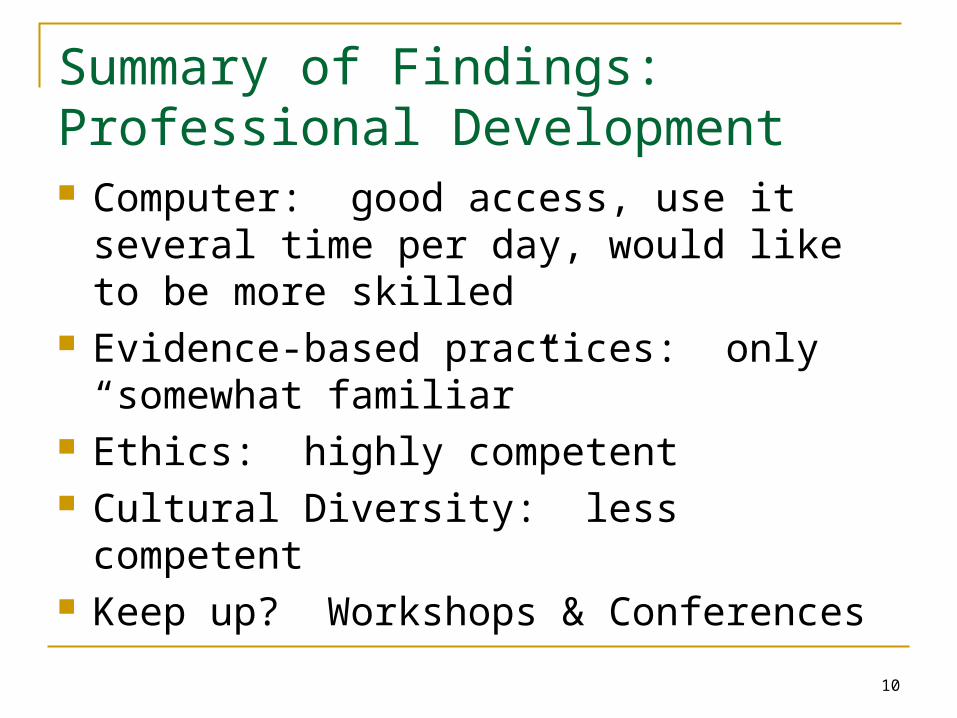
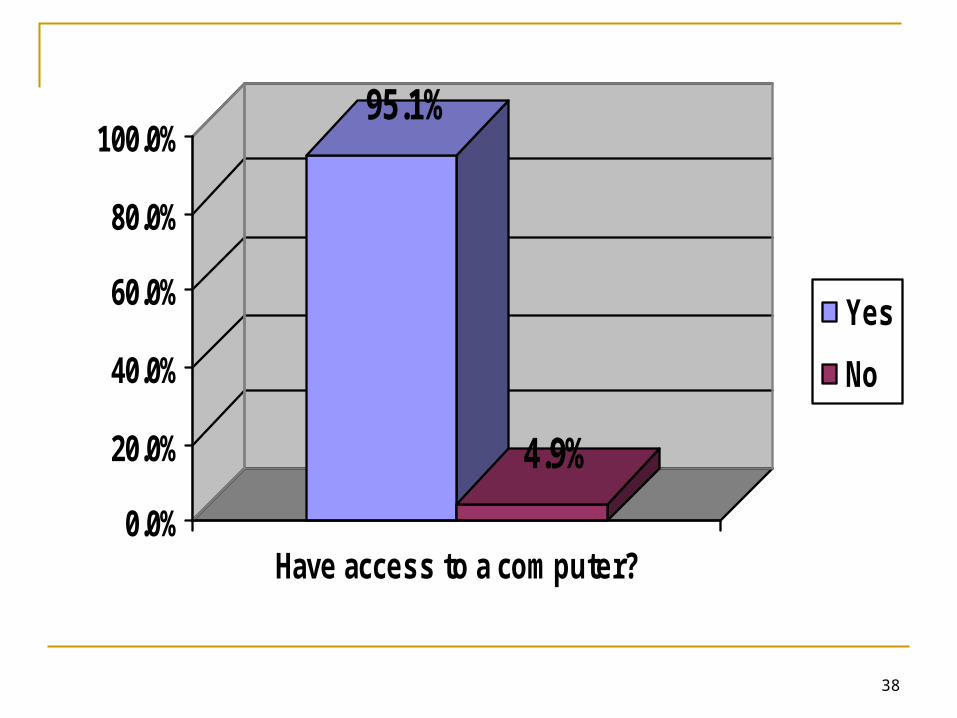
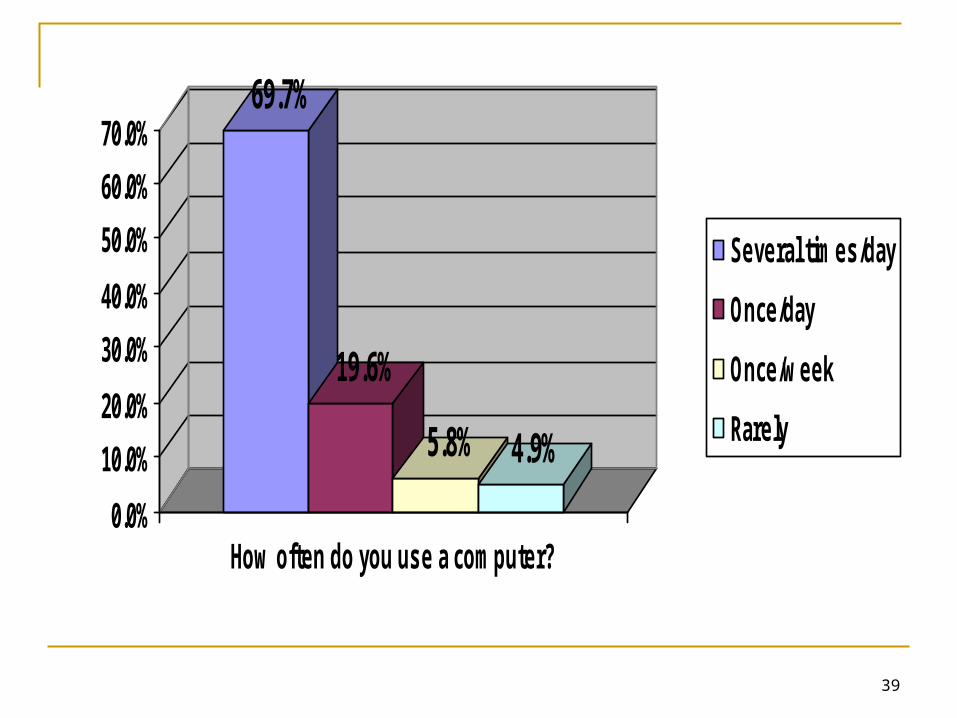
Summary of Findings: Professional Development Computer: good access, use it several time
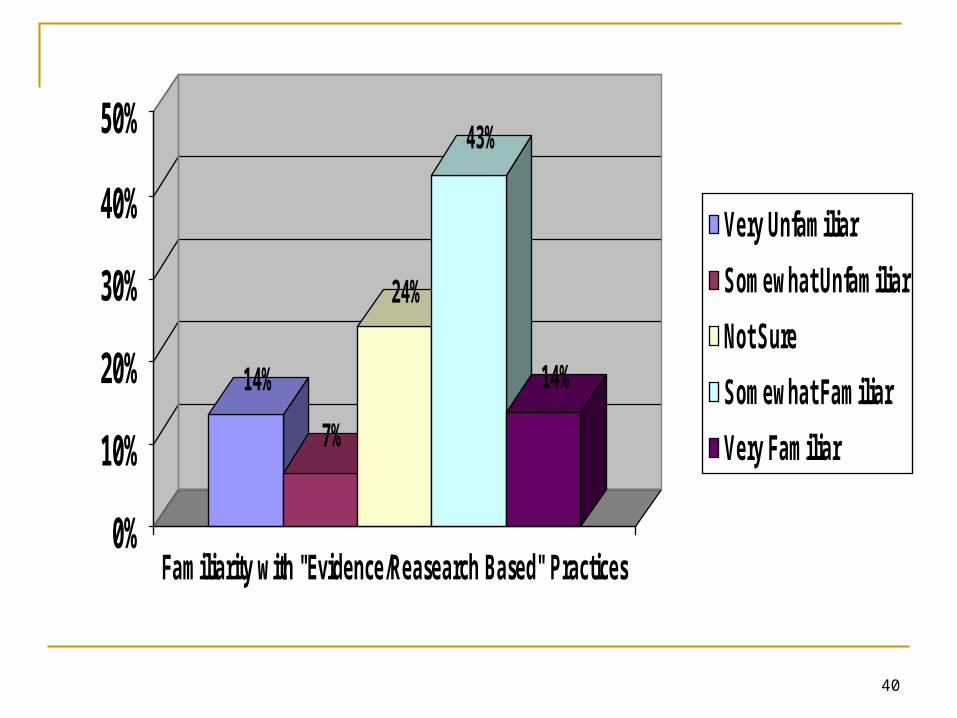
per day, would like to be more skilled Evidence-based practices: only “somewhat
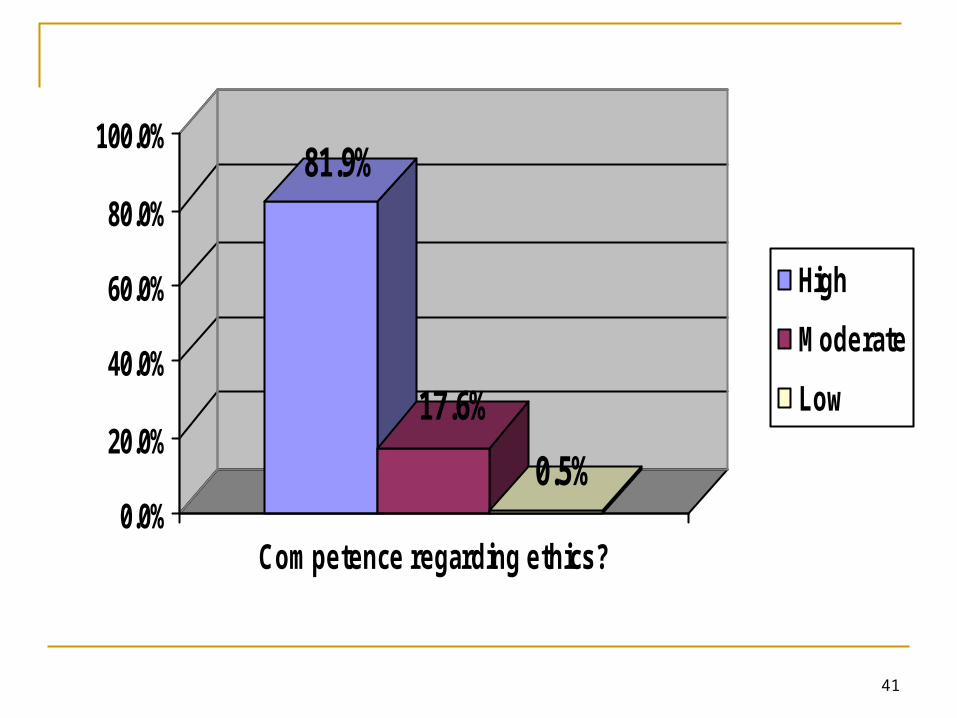
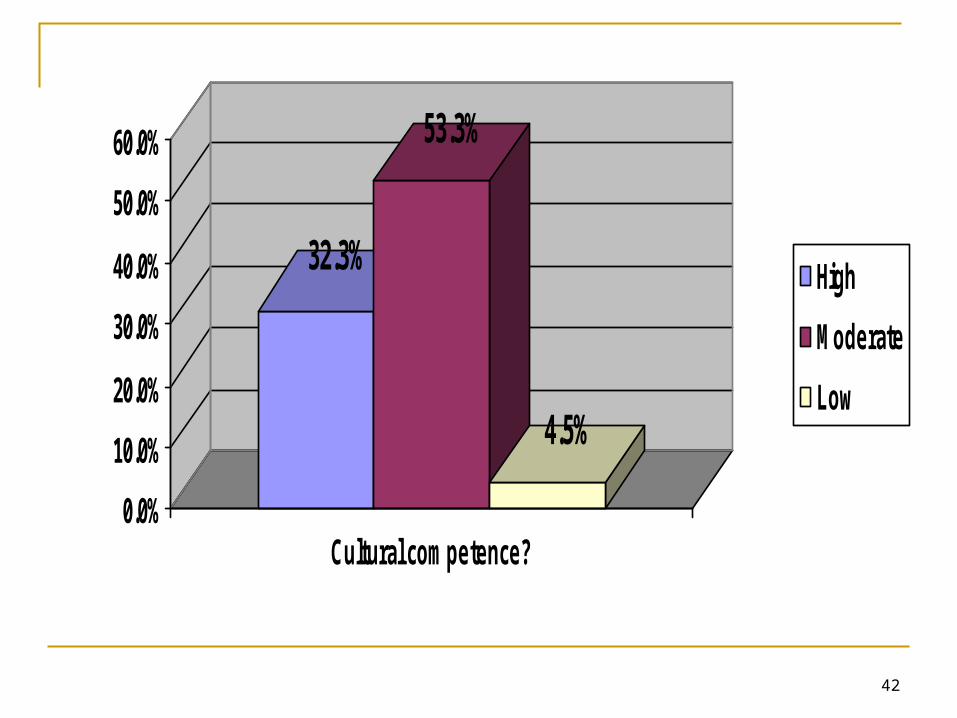
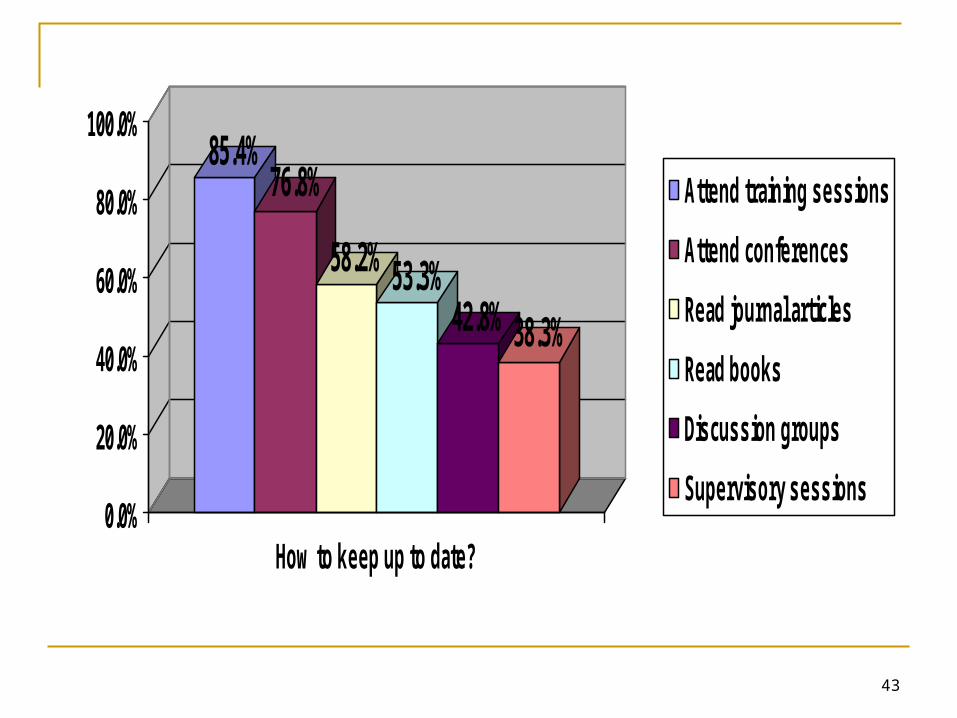
familiar” Ethics: highly competent Cultural Diversity: less competent Keep up? Workshops & Conferences
11
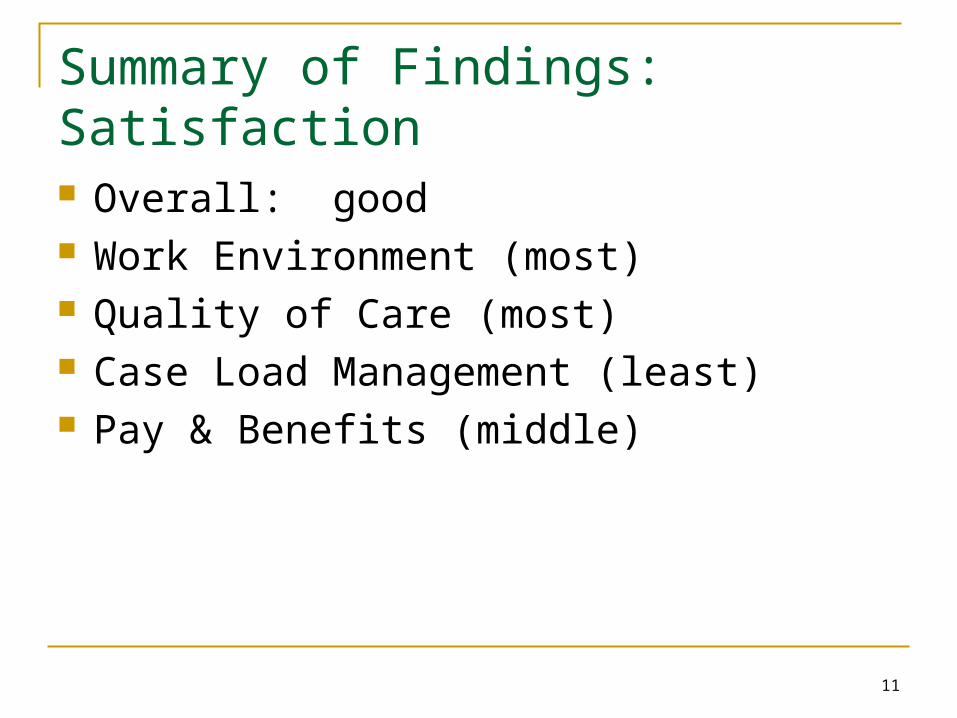
Summary of Findings: Satisfaction Overall: good Work Environment (most) Quality of Care (most) Case Load Management (least) Pay & Benefits (middle)
12
Summary of Findings: Attitudes about Professional Practice Evidence-Based Practices Medications Traditional Approaches Research Evaluation & Assessment Tools CD Education

13
Some of the Demographic Characteristics
The details..
14
Gender
65%35% Male
Female
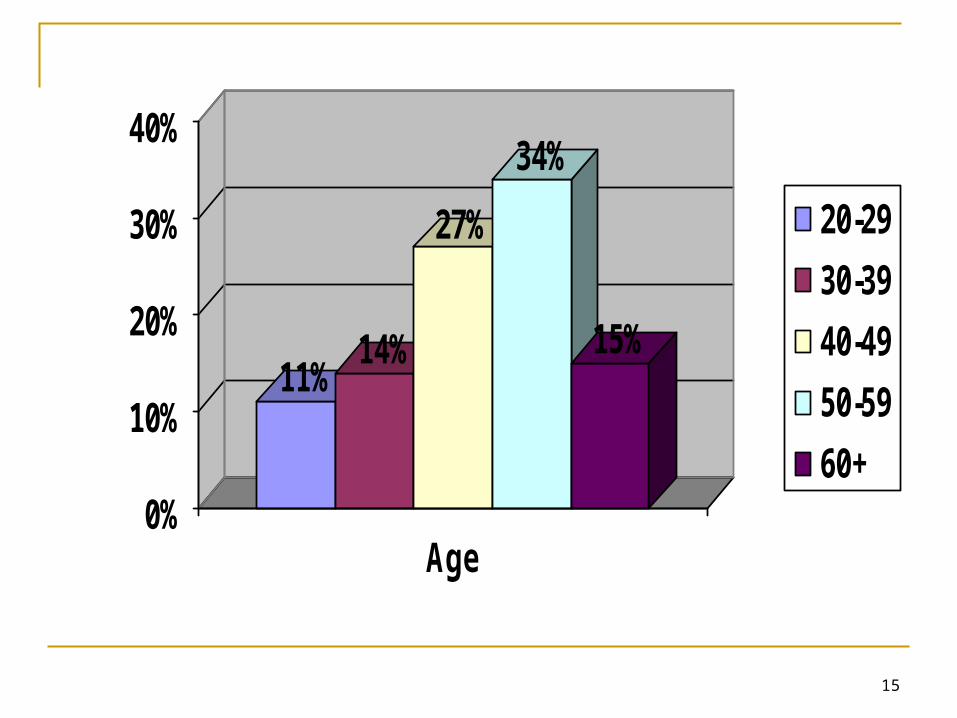
15
11%14%
27%
34%
15%
0%
10%
20%
30%
40%
Age
20-29
30-39
40-49
50-59
60+
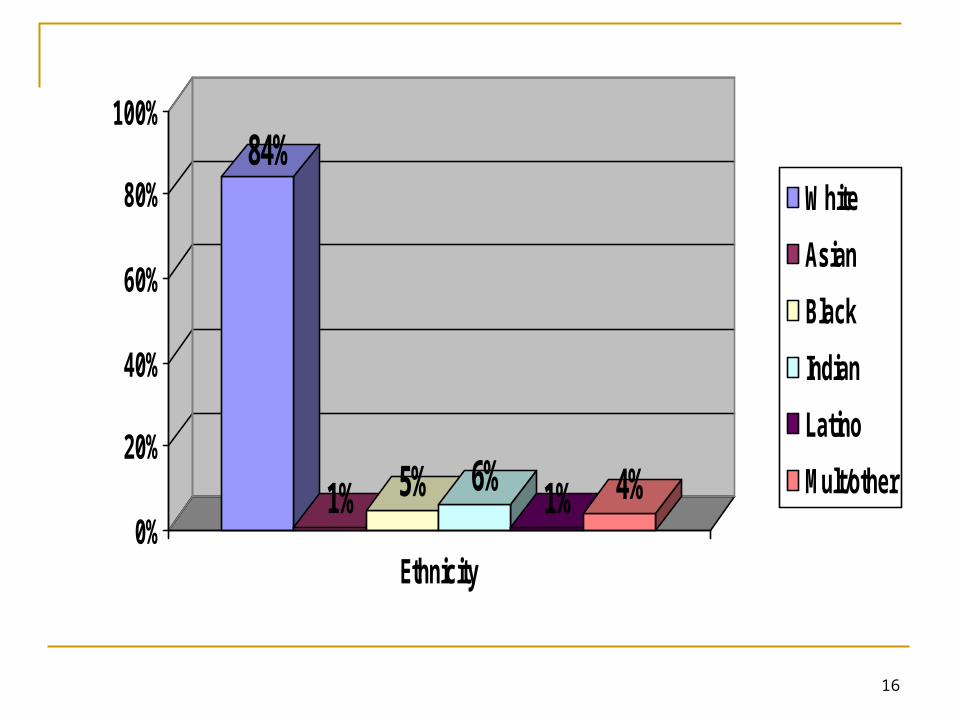
16
84%
1% 5% 6% 1% 4%0%
20%
40%
60%
80%
100%
Ethnicity
White
Asian
Black
Indian
Latino
Mult/other
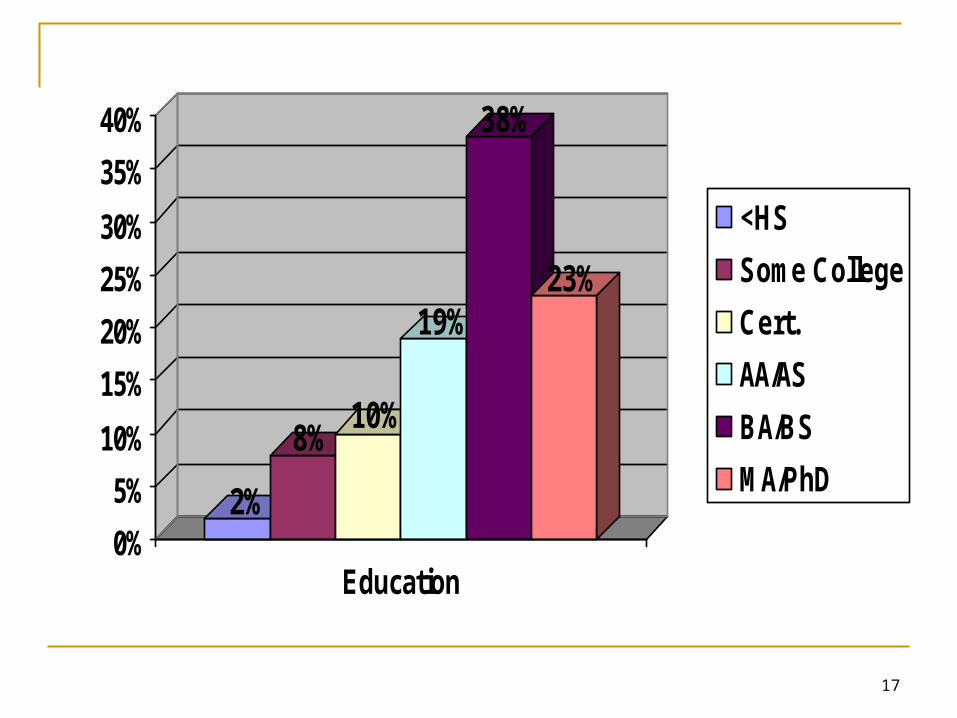
17
2%
8%10%
19%
38%
23%
0%
5%
10%
15%
20%
25%
30%
35%
40%
Education
<HS
Some College
Cert.
AA/AS
BA/BS
MA/PhD
18
CD/In Recovery
48%
52%
Yes
No
19
29.9%
70.1%
0.0%
20.0%
40.0%
60.0%
80.0%
Currently Use Tobacco Products?
Yes
No
20
Some of the Professional Characteristics
21
70.3%
11.5%3.8%
0.0%
20.0%
40.0%
60.0%
80.0%
Employment Status
Full time
Part time
On-call
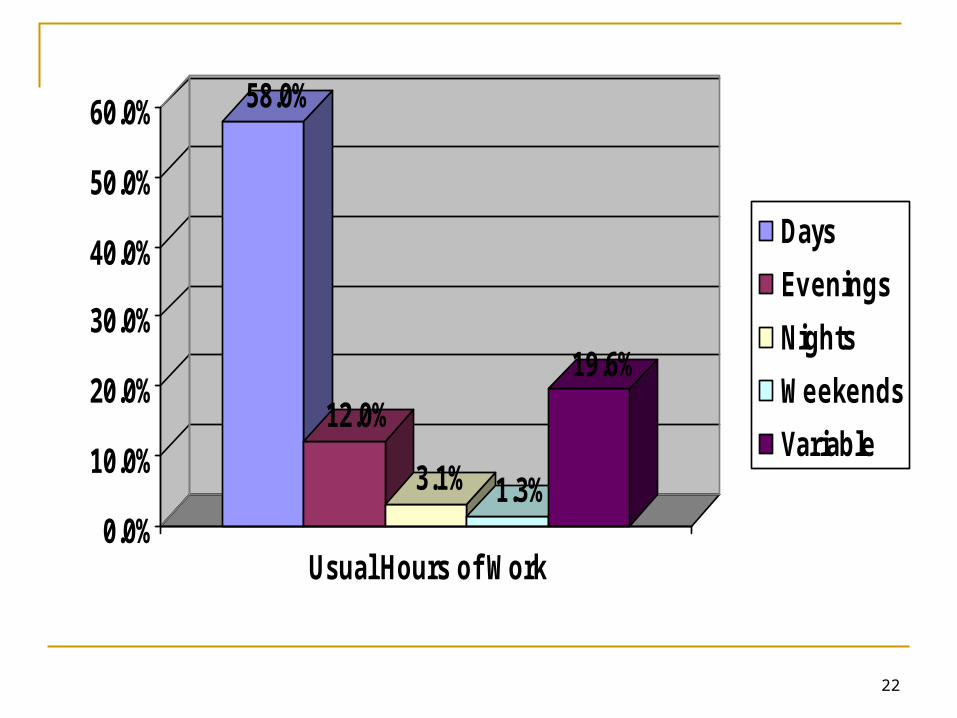
22
58.0%
12.0%
3.1% 1.3%
19.6%
0.0%
10.0%
20.0%
30.0%
40.0%
50.0%
60.0%
Usual Hours of Work
Days
Evenings
Nights
Weekends
Variable
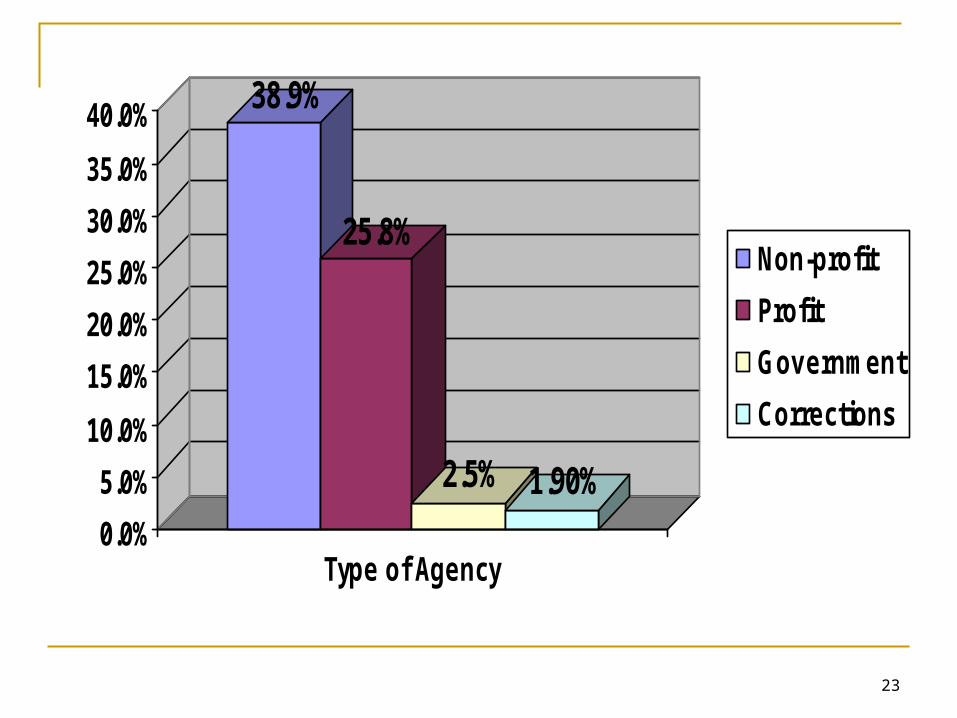
23
38.9%
25.8%
2.5% 1.90%0.0%
5.0%
10.0%
15.0%
20.0%
25.0%
30.0%
35.0%
40.0%
Type of Agency
Non-profit
Profit
Government
Corrections
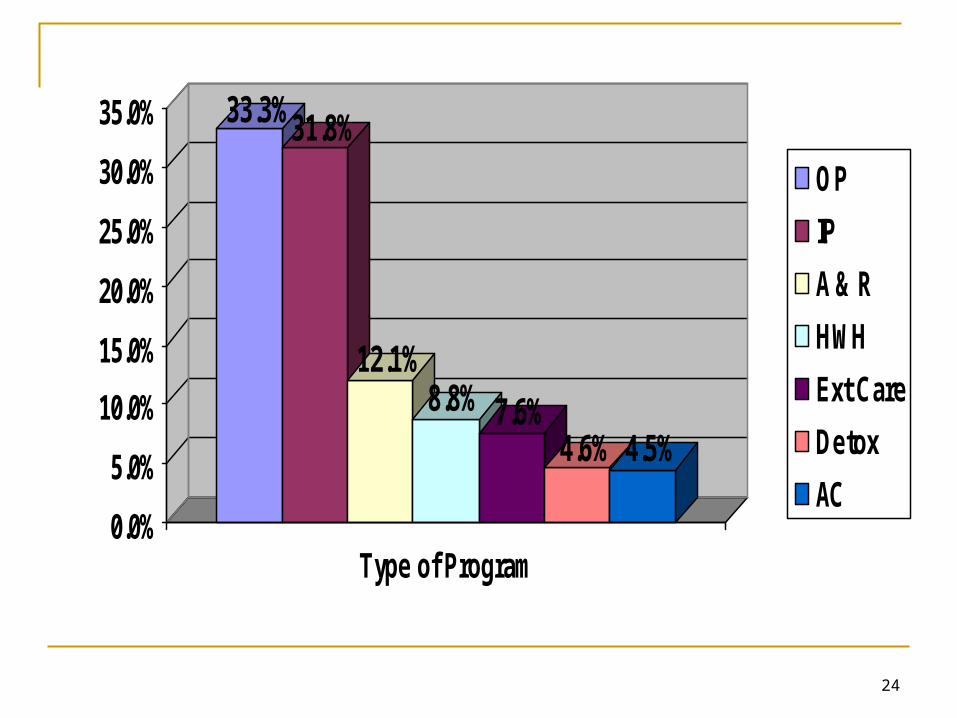
24
33.3%31.8%
12.1%8.8% 7.6%
4.6% 4.5%
0.0%
5.0%
10.0%
15.0%
20.0%
25.0%
30.0%
35.0%
Type of Program
OP
IP
A & R
HWH
Ext Care
Detox
AC
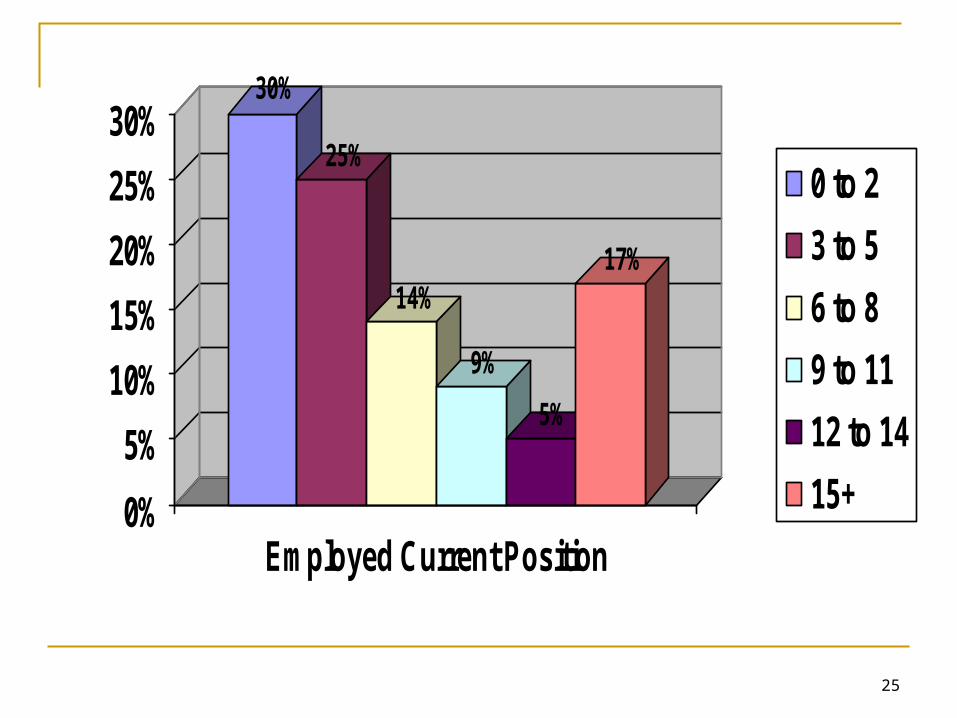
25
30%
25%
14%
9%
5%
17%
0%
5%
10%
15%
20%
25%
30%
Employed Current Position
0 to 2
3 to 5
6 to 8
9 to 11
12 to 14
15+
26
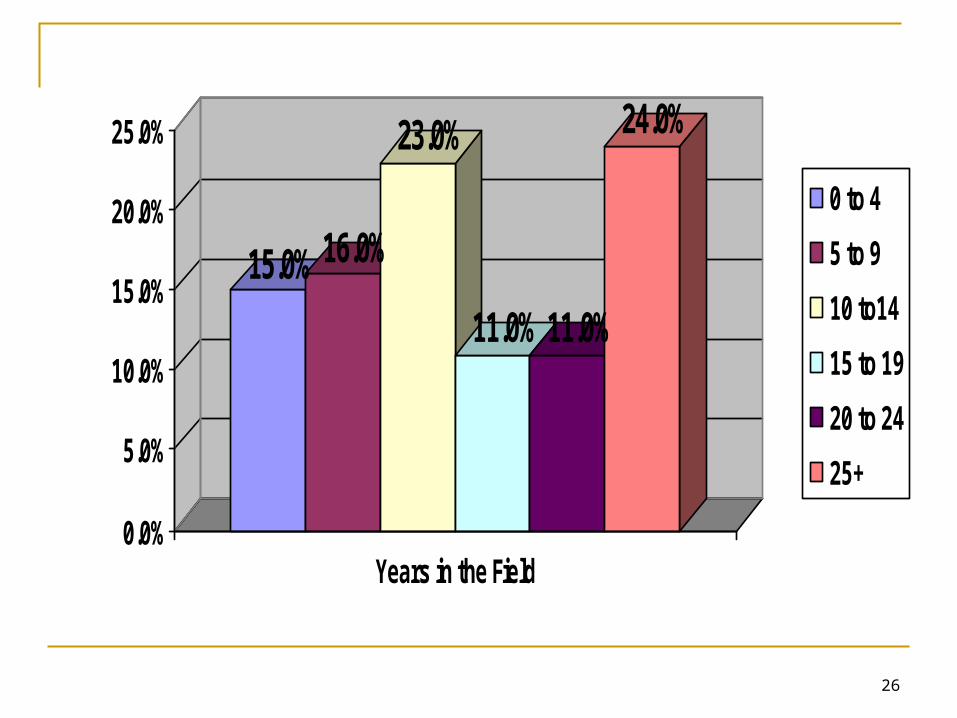
15.0% 16.0%
23.0%
11.0% 11.0%
24.0%
0.0%
5.0%
10.0%
15.0%
20.0%
25.0%
Years in the Field
0 to 4
5 to 9
10 to14
15 to 19
20 to 24
25+
27
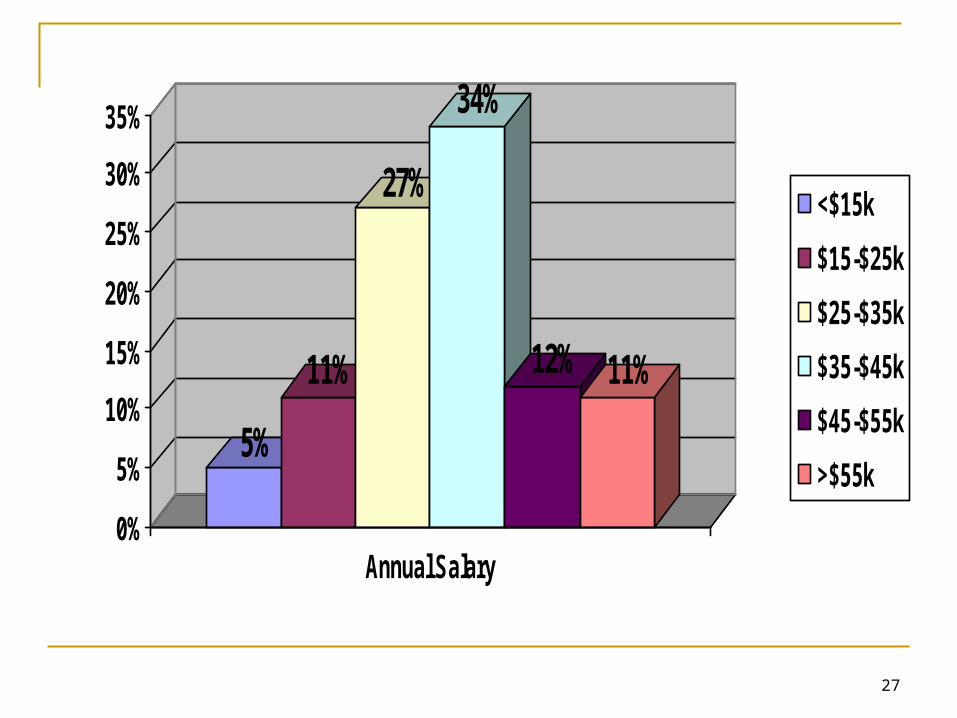
5%
11%
27%
34%
12% 11%
0%
5%
10%
15%
20%
25%
30%
35%
Annual Salary
<$15k
$15-$25k
$25-$35k
$35-$45k
$45-$55k
>$55k
28
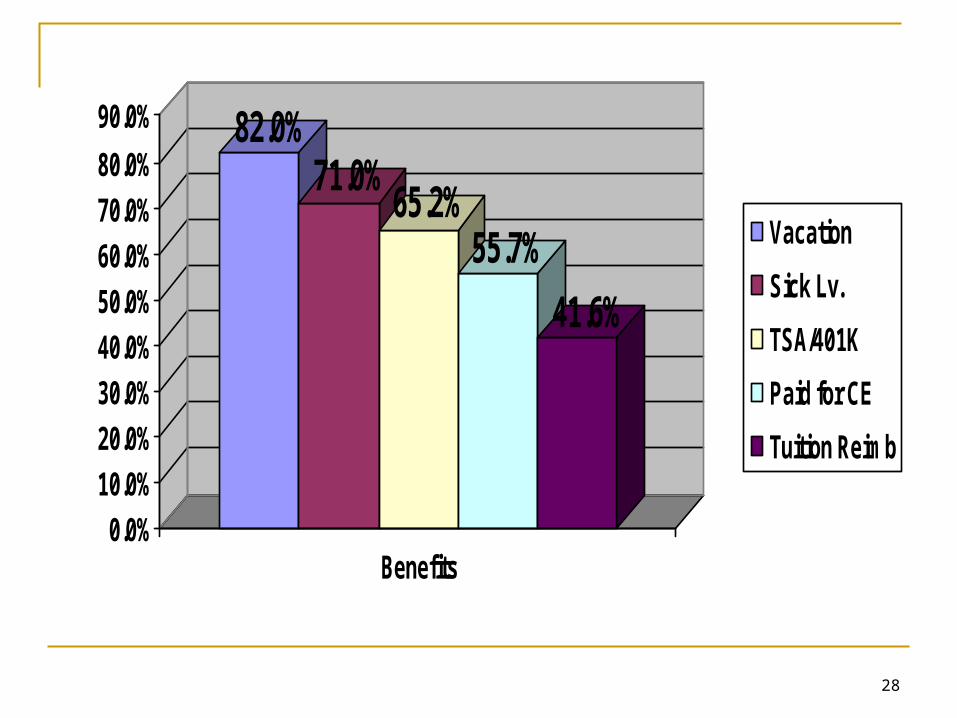
82.0%71.0%
65.2%55.7%
41.6%
0.0%
10.0%
20.0%
30.0%
40.0%
50.0%
60.0%
70.0%
80.0%
90.0%
Benefits
Vacation
Sick Lv.
TSA/401K
Paid for CE
Tuition Reimb
29
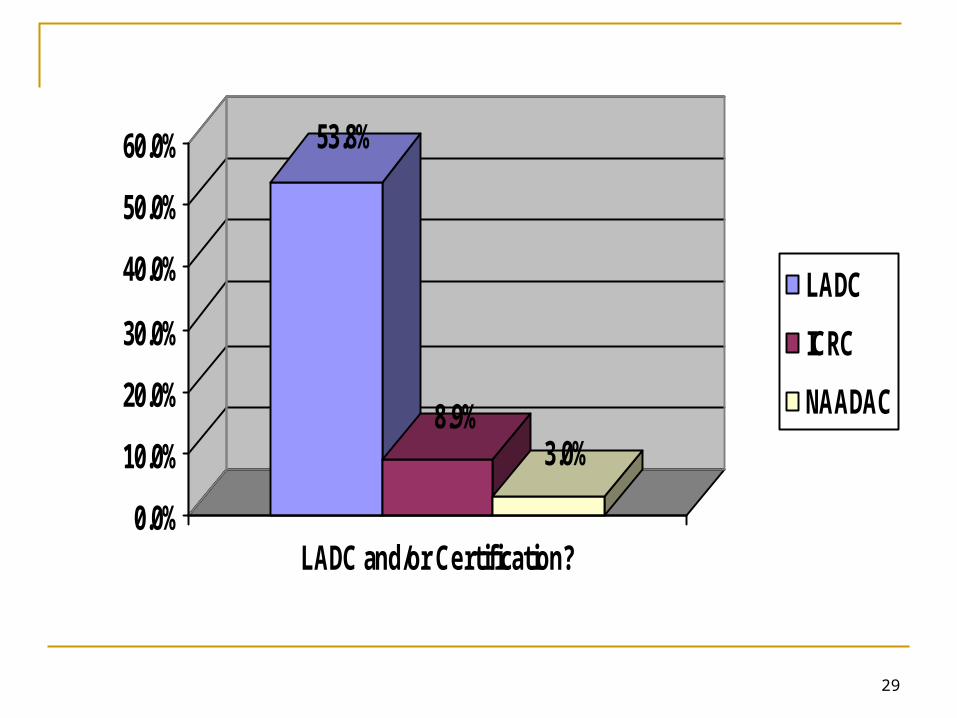
53.8%
8.9%3.0%
0.0%
10.0%
20.0%
30.0%
40.0%
50.0%
60.0%
LADC and/or Certification?
LADC
ICRC
NAADAC

30
9%
18%
28%
15%13%
8%
0%
5%
10%
15%
20%
25%
30%
Continuing Education Hours
1 to 9
10 to 19
20-29
30-39
40-59
50+

31
11%
31%29%
14%
7% 8%
0%
5%
10%
15%
20%
25%
30%
35%
Client Caseload
0
1 to 10
11 to 20
21 to 30
31 to 40
41 or more

32
Professional Status
33
3.1%
37.5%
59.3%
0.0%
10.0%
20.0%
30.0%
40.0%
50.0%
60.0%
CD Counselor Status?
Higher
Same
Lower
34
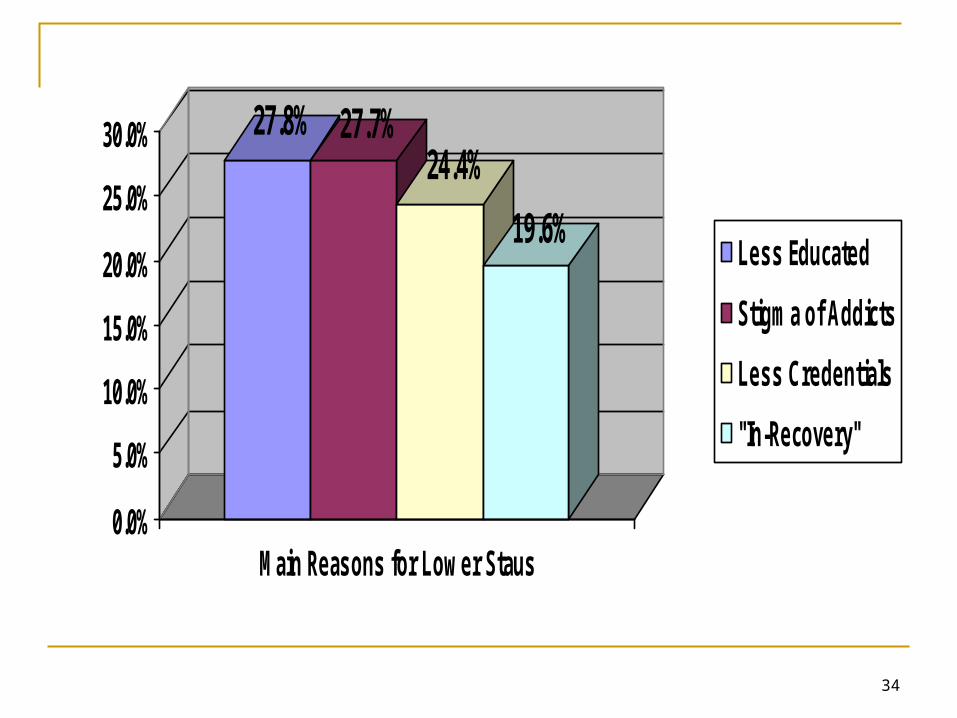
27.8% 27.7%24.4%
19.6%
0.0%
5.0%
10.0%
15.0%
20.0%
25.0%
30.0%
Main Reasons for Lower Staus
Less Educated
Stigma of Addicts
Less Credentials
"In-Recovery"
35
79.9%
53.4%49.5%47.5%39.8%
26.4%
0.0%
10.0%
20.0%
30.0%
40.0%
50.0%
60.0%
70.0%
80.0%
Ways to Improve Retention?
Improve Salaries
Professional growth
Improve benefits
Advancement
Higher educationalstandards
Better Supervision
36
65.2%
46.9%38.0% 35.0% 31.0%
0.0%
10.0%
20.0%
30.0%
40.0%
50.0%
60.0%
70.0%
Current challenges to the profession?
Client funding
Difficult clients
Politics
Licensure
Better client outcomes
37
Professional Development
38
95.1%
4.9%
0.0%
20.0%
40.0%
60.0%
80.0%
100.0%
Have access to a computer?
Yes
No
39
69.7%
19.6%
5.8% 4.9%
0.0%
10.0%
20.0%
30.0%
40.0%
50.0%
60.0%
70.0%
How often do you use a computer?
Several times/day
Once/day
Once/week
Rarely
40
14%
7%
24%
43%
14%
0%
10%
20%
30%
40%
50%
Familiarity with "Evidence/Reasearch Based" Practices
Very Unfamiliar
Somewhat Unfamiliar
Not Sure
Somewhat Familiar
Very Familiar
41
81.9%
17.6%
0.5%0.0%
20.0%
40.0%
60.0%
80.0%
100.0%
Competence regarding ethics?
High
Moderate
Low
42
32.3%
53.3%
4.5%
0.0%
10.0%
20.0%
30.0%
40.0%
50.0%
60.0%
Cultural competence?
High
Moderate
Low
43
85.4%76.8%
58.2% 53.3%42.8% 38.3%
0.0%
20.0%
40.0%
60.0%
80.0%
100.0%
How to keep up to date?
Attend training sessions
Attend conferences
Read journal articles
Read books
Discussion groups
Supervisory sessions

44
Satisfaction
45
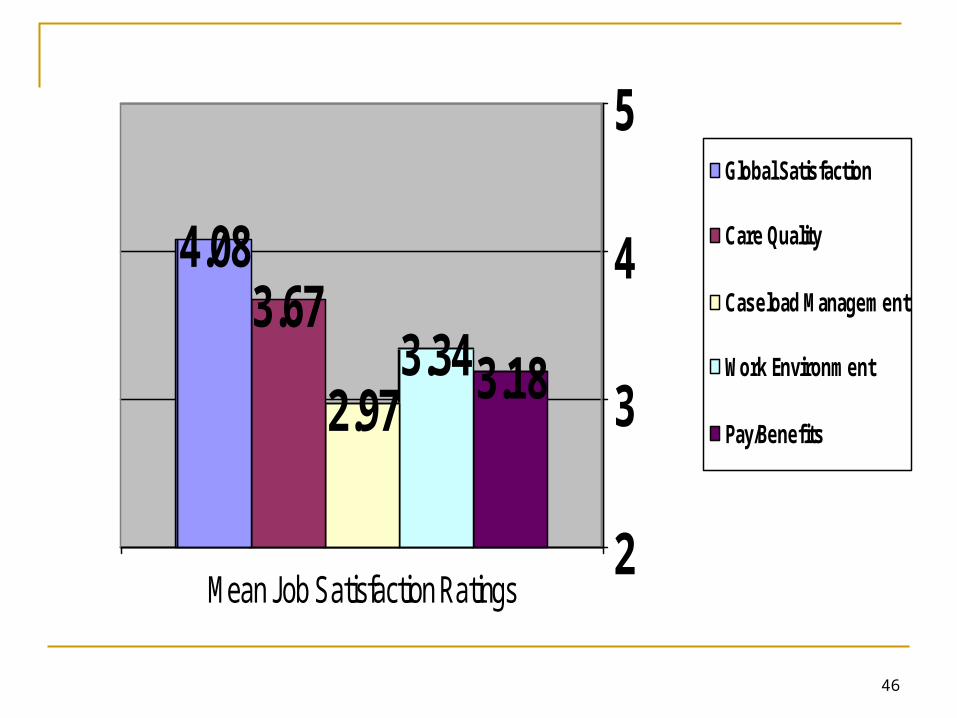
Satisfaction: Factors
Satisfaction with Work Environment Satisfaction with Quality of Care Satisfaction with Case Load Management Satisfaction with Pay & Benefits
46
3.183.342.97
3.674.08
2
3
4
5
Mean Job Satisfaction Ratings
Global Satisfaction
Care Quality
Caseload Management
Work Environment
Pay/Benefits
47
Attitudes about Professional Practice
48
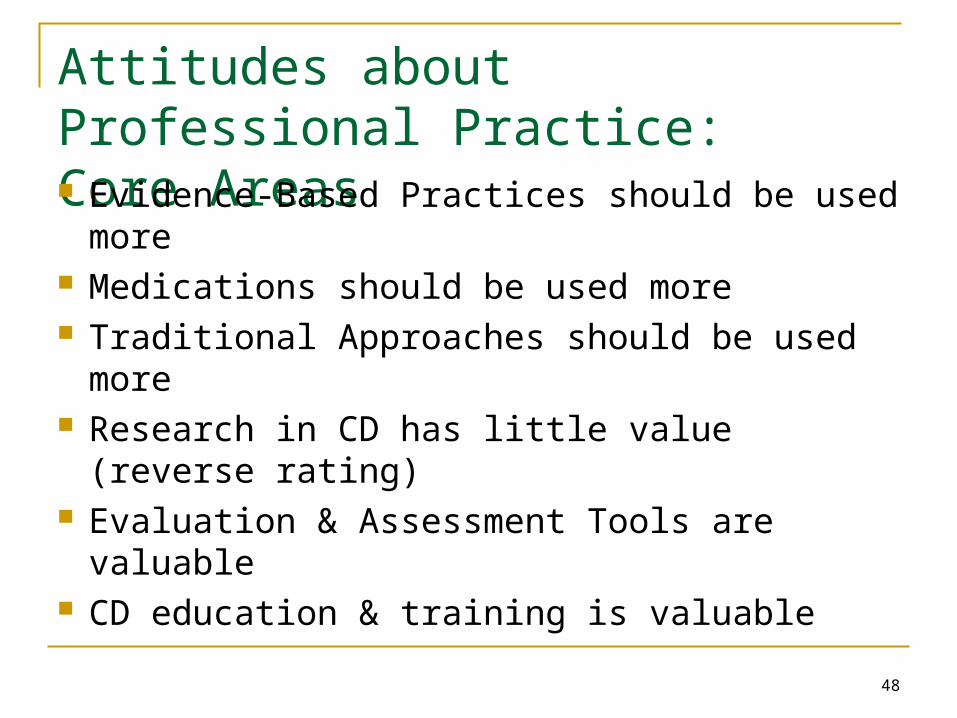
Attitudes about Professional Practice:Core Areas Evidence-Based Practices should be used
more Medications should be used more Traditional Approaches should be used more Research in CD has little value (reverse
rating) Evaluation & Assessment Tools are valuable CD education & training is valuable
49
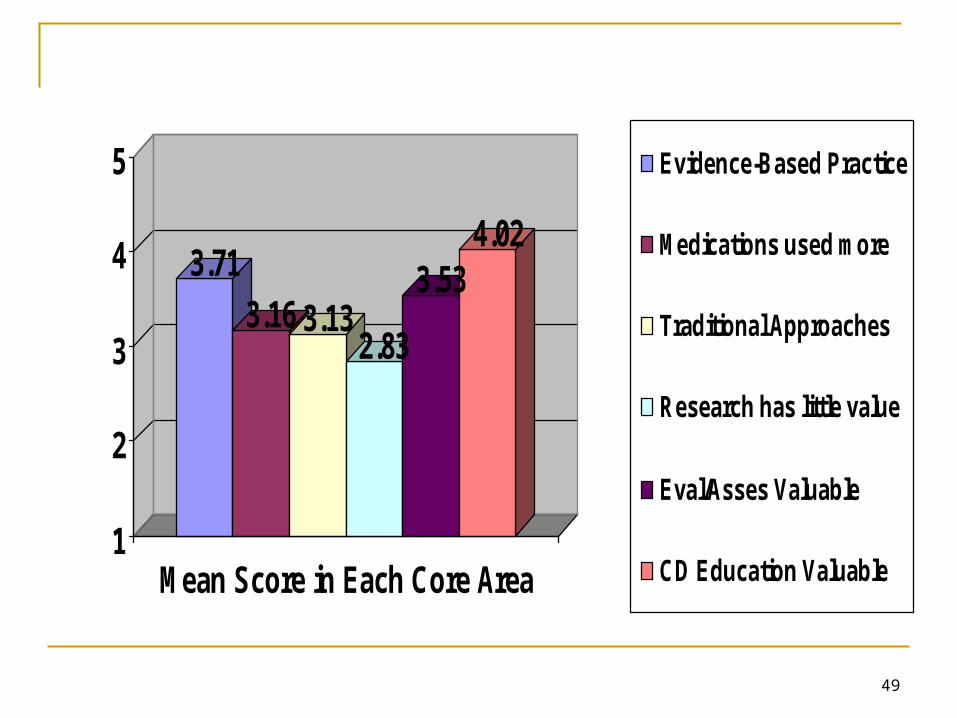
3.71
3.16 3.132.83
3.534.02
1
2
3
4
5
Mean Score in Each Core Area
Evidence-Based Practice
Medications used more
Traditional Approaches
Research has little value
Eval/Asses Valuable
CD Education Valuable
50
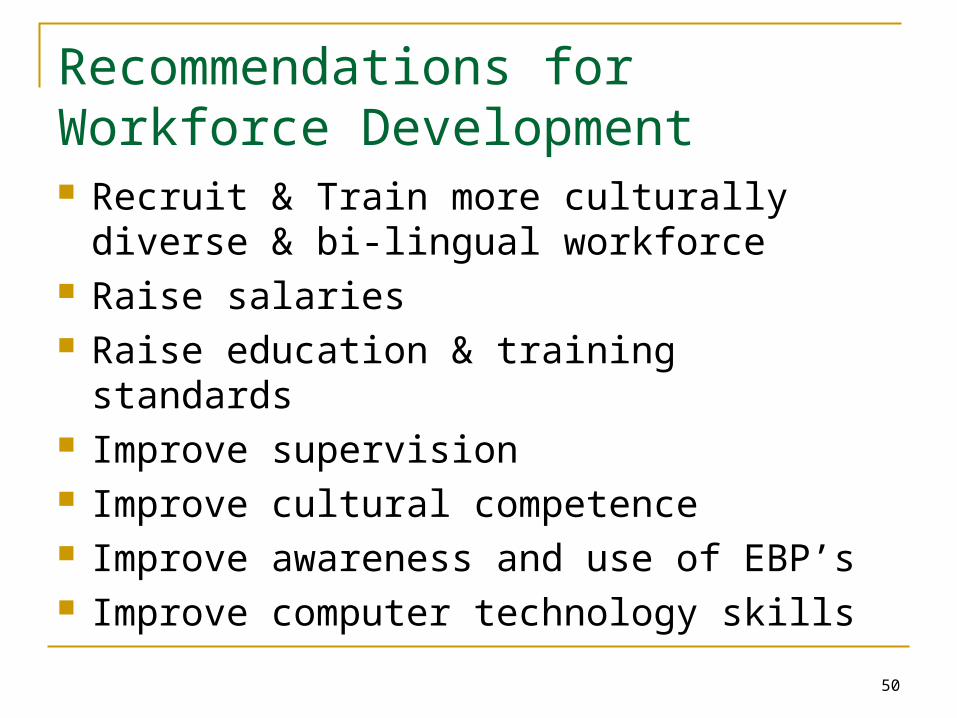
Recommendations for Workforce Development Recruit & Train more culturally diverse & bi-
lingual workforce Raise salaries Raise education & training standards Improve supervision Improve cultural competence Improve awareness and use of EBP’s Improve computer technology skills