Embed Size (px)
Citation preview

AN ABSTRACT OF THE DISSERTATION OF
Teresa M. Wolfe for the degree of Doctor of Philosophy in Science Education presented on June 13, 2013.
Title: Investigating Science Identity and Motivation Constructs in Undergraduate Chemistry Through Novel Instrument Development
Abstract approved: _________________________________________! ! ! ! Lawrence B. Flick
The purposes of this study were to: 1) determine in what ways incorporating active
engagement into a traditional lecture chemistry course contributed to students’ science
identity and their motivation to learn the science, and 2) determine how the development
of a science identity could be measured through the use of a quantitative instrument and
tracked over time. Students took a 13-item science identity questionnaire, designed and
validated as a part of the current study, and Glynn and Koballa Jr.’s (2006) 30-item
motivation questionnaire three times (pre, mid and post) over a 10-week term. The
science identity questionnaire was developed to measure aspects of a students’ science
identity using a conceptual framework that situated identity as both individually and
socially constructed. The theorectical framework that guided the design of the instrument
involved self-concept, presented self, and recognition by others that interact within the
context of the social environment of college to affect development of student identity.
The assumption was made that all students enter into college with some measure of a
science identity. The participants (n=1246) were enrolled at a large, research university in
the Pacific Northwest in one of two undergraduate, general chemistry courses that were
taught using either an experimental active engagement section or using a traditional
lecture method. Students in the experimental section (n=113) were predicted to show
higher intrinsic motivation, self-efficacy, and self-determination in learning chemistry
and to show maintenance or development of a science identity over time compared to
their counterparts (n=634) who were not receiving the treatment. Students in a general
chemistry course for engineers (n=500) were used as a positive control and hypothesized
to have a well-developed science identity that would remain stable. Results of the science
identity questionnaire showed that students’ science identity could be grouped into
several categories using a cluster analysis. Open-ended interviews were used to in
conjunction with the survey data to verify these categories. Students’ science identity
ranged on a continuum from low to high, that could be monitored over time. The positive
control group (the engineers) exhibited a higher science identity than either the
experimental group or its counterpart, and served as a reference standard for measuring
science identity. The experimental group reported an initial lower level of science identity
than the positive control group and this difference was significant. Over the course of the
term, the experimental group reported a science identity that ceased to be significantly
different from the positive control group, suggesting a similarity in science identity
between the two groups. The results of the motivation survey showed several aspects of
motivation that changed over time, with no significant differences seen in total
motivation. Significant differences between the two groups were seen in self-efficacy,
extrinsic motivation, and self-determination. This study provides a quantitative reference
standard for science identity and a novel instrument for measuring and tracking
development of a students’ science identity. !

©Copyright by Teresa M. Wolfe
June 13, 2013
All Rights Reserved

Investigating Science Identity and Motivation Constructs in Undergraduate Chemistry Through Novel Instrument Development
byTeresa M. Wolfe
A DISSERTATION
submitted to
Oregon State University
in partial fulfillment ofthe requirements for the
degree of
Doctor of Philosophy
Presented June 13, 2013Commencement June 2014

Doctor of Philosophy dissertation of Teresa M. Wolfe presented on
June 13, 2013.
APPROVED:
________________________________________________________________________
Co-Major Professor, representing Science Education
________________________________________________________________________
Co-Major Professor, representing Science Education
________________________________________________________________________
Dean of the College of Education
________________________________________________________________________
Dean of the Graduate School
I understand that my dissertation will become part of the permanent collection of Oregon
State University libraries. My signature below authorizes release of my dissertation to
any reader upon request.
________________________________________________________________________
Teresa M. Wolfe, Author
ACKNOWLEDGEMENTS
The completion of this dissertation would not have been possible without the help and
encouragement of many people. This project represents a large amount of time, work, and
effort on the part of all involved. I am very grateful to everyone for his or her assistance
and would like to acknowledge the following people:
Major Advisor: Lawrence B. Flick
Larry, thank you for all your help and support through this process. It all started with one
phone call and the rest was history. Next time bring snacks.
Committee Members:
Sharyn Clough, Derron R. Coles, John H. Falk, Balz Frei, and Dennis Hruby
Thank you for helping me jump the hurdles and pointing me in the right direction on
many occasions. A special note to Derron Coles: Your ideas and energy were what helped
get this project off the ground and to completion. Ad-hoc is my new mantra.
Graduate School: Thank you to Julie Kurtz and Nagwa Naguib for their help in managing
this process. A special thank you to Dr. Brenda McComb for your mentoring and for
providing me with an assistantship that helped to make this venture possible.
Department of Chemistry Faculty: Kristi Edwards, Margie Haak, Geneva Laurita, Alan
Richardson, Phillip Watson, Paula Weiss
My time in grad school would not have been possible without the teaching assistantships
and the chemistry experience. Thank you for being willing to work with me and for all
your suggestions and ideas.
Statistics Assistance: I would like to thank Sasha Friedman, Dr. Mark Needham, and Dr.
Misty Lambert for their invaluable help with the statistical methods for this project.
Parents: Conrado and Rosemarie Wolfe, Thank you for your love and support.
Celeste Edman: once again, thank you for believing in me and being my sister. I think I
have finally given up the 14 professions and the prize is yet to be determined. You always
seem to know where I am headed, so where to next?
Erik McKnight: Captain, thank you for taking control of the bridge. You are a true friend.
Katie Stofer: my hockey buddy! I will miss you. Thanks for all the editing, suggestions,
shopping, support, and just hanging out in general.
Becka Morgan: Thanks the friendship and encouragement over hummus and ice tea.
Friends and Family: Kresta Austin, Joann Barham, Sally Campbell, Kathleen LeBoeuf,
Tammy Luttrell, Katie Moriarty, Kathy and Jerry Oltion, James Pape, Jean Powell, Mary
Wikswo.
Ralph Barnhart: You set an example that I can only hope one day to aspire.
My Students: You gave me the inspiration and drive to follow this path. Thank you.
SMED cohort: Jia-Huang Chen, Michele Crowl, Sue Ellen DeChenne, Paula Dungjen,
Larry Enochs, Henry Gillow-Wiles, Laura Good, Mike Furuto, Michelle Mileham, Krissi
Hewitt, and Sissi Li, Each and everyone of you is amazing and made my time here worth
the struggle. Thank you for your thoughts, encouragement, suggestions, and support.
Bella, Heknew, Indy, and Max: Life just would not be the same without the existence of
souls like you. Thank you for teaching me that life is a walk in the park and that one big
bowl of food fixes everything.
TABLE OF CONTENTS
! Page
CHAPTER 1: INTRODUCTION............................................................................! 1
! PROBLEM STATEMENT................................................................................. !2
! BACKGROUND...............................................................................................! 2
! ! Increased need for STEM educated workforce............................................! 2
! The Traditional Lecture................................................................................ !4
! ! Student experiences during the first year of college....................................! 5
! ! Identity in STEM education........................................................................ ! 9
! THEORETICAL FRAMEWORK..................................................................... ! 12
! ! Towards a science identity.......................................................................... ! 12
! ! Identity Theory.............................................................................................! 15
! ! Student Development Theory...................................................................... ! 17
! PURPOSE OF STUDY.....................................................................................! 19
! RESEARCH QUESTIONS..............................................................................! 20
! SIGNIFICANCE OF STUDY.......................................................................... ! 21
CHAPTER 2: LITERATURE REVIEW.................................................................! 23
! ReDefining the approach to undergraduate education.......................................! 23
! Motivation in undergraduate education.............................................................! 33
! Identity in undergraduate education...................................................................! 36
! College student development.............................................................................! 42
CHAPTER 3: METHODS.......................................................................................! 46
! ! Study Site.....................................................................................................! 46
! ! Participants................................................................................................... !48
! ! Data Collection............................................................................................! 49
! ! Survey variables used in analysis.................................................................! 51
! RESEARCH DESIGN.......................................................................................! 54
TABLE OF CONTENTS (Continued)! ! ! Page
! DATA ANALYSIS.............................................................................................! 57
! ! Validity.........................................................................................................! 58
! ! ! Exploratory Factor Analysis..................................................................! 58
! ! ! Kaiser-Meyer Sampling Adequacy for Factor Analysis........................! 58
! ! ! Bartlett's Test of Sphericity....................................................................! 59
! ! Reliability.....................................................................................................! 59
! ! Statistical Analysis.......................................................................................! 60
! ! ! Bivariate Correlations............................................................................! 60
! ! ! Analysis of Variance (ANOVA).............................................................! 60
! ! Paricipant Differences..................................................................................! 61
! ! ! Cluster analysis for science identity responders....................................! 61
! ! ! Participant Interviews............................................................................! 63
CHAPTER 4: RESULTS.........................................................................................! 64
! Participants.........................................................................................................! 65
! Validity...............................................................................................................! 66
! ! Exploratory Factor Analysis.........................................................................! 68
! Reliability...........................................................................................................! 70
! ! Reliability Analysis-Motivation Questionnaire...........................................! 70
! ! Reliability Analysis-Science Identity...........................................................! 76
! Statistical Analysis............................................................................................! 79
! ! Bivariate Correlations..................................................................................! 79
! ! One-Way Analysis of Variance (ANOVA)...................................................! 79
! ! Chemistry Motivation Questionnaire Analysis............................................! 86
! ! Science Identity Questionnaire Analysis......................................................! 87
! ! K-Means Cluster Analysis for Science Identity............................................! 88

TABLE OF CONTENTS (Continued)! ! ! Page
! Participant Interviews........................................................................................! 98
! ! Low Science Identity (SI Score 12-27).......................................................! 101
! ! Low-Moderate Science Identity (SI Score 28-37).......................................! 103
! ! Moderate Science Identity (SI Score 38-47)................................................! 105
! ! High Science Identity (SI Score 48-60).......................................................! 107
CHAPTER 5: DISCUSSION AND CONCLUSION...............................................! 109
! Synthesis of Results...........................................................................................! 109
! Discussion..........................................................................................................! 119
! Limitations of the study.....................................................................................! 123
! Future Work.......................................................................................................! 124
! Implications.......................................................................................................! 125
! Conclusion.........................................................................................................! 127
REFERENCES.........................................................................................................! 130
APPENDICES..........................................................................................................! 146
! Appendix A Demographics Questionnaire.........................................................! 147
! Appendix B Chemistry Motivation Questionnaire............................................! 149
! Appendix C Science Identity Questionnaire......................................................! 151
! Appendix D Interview Protocol.........................................................................! 152
LIST OF FIGURES
Figure! Page
1.1! A Model of Identity.......................................................................................! 14
1.2! The Seven Vectors of Student Development Theory....................................! 18
3.1! Data Sources.................................................................................................! 51
3.2! Experimental Design.....................................................................................! 55
4.1! Scree Plot......................................................................................................! 69
4.2! Two and Three Cluster Solutions for Science Identity using K-means
! Analysis.........................................................................................................! 90
4.3! Four and Five Cluster Solutions for Science Identity using a K-means
Analysis.........................................................................................................! 91
4.4! Cross-tabulation Two by Three Cluster Solution for Science Identity..........! 94
4.5! Cross Tabulation Three by Four Cluster Solution for Science Identity.........! 95
4.6! Cross-Tabulation Four by Five Cluster Solution for Science Identity...........! 96

LIST OF TABLES
Table! Page
4.1! Response Rates of CH10x and CH20x participants........................................! 67
4.2! Demographics of CH10x and CH20x participants...........................................! 67
4. 3 ! Reliability analysis of the Chemistry Motivation Questionnaire for CH10x participants........................................................................................................! 71
4.4 ! Reliability analysis of the Chemistry Motivation Questionnaire for CH20x participants........................................................................................................! 72
4.5 ! Reliability analysis of the Chemistry Anxiety Motivation Questionnaire for ! CH10x participants...........................................................................................! 73
4.6 ! Reliability analysis of the Chemistry Anxiety Motivation Questionnaire for ! CH20x participants...........................................................................................! 73
4.7 ! Reliability analysis of the Chemistry Motivation Questionnaire Factors for!! CH10x participants...........................................................................................! 74
4.8 ! Reliability analysis of the Chemistry Motivation Questionnaire Factors for ! CH20x participants...........................................................................................! 75
4.9 ! Reliability analysis of the Science Identity Questionnaire for CH10x participants........................................................................................................! 77
4.10 !Reliability analysis of the Science Identity Questionnaire for CH20x participants........................................................................................................! 78
4.11! Bivariate correlation between science identity and total motivation...............! 80
4.12! Science identity among the course sections.....................................................! 82
4.13! Total motivation among the course sections....................................................! 82
4.14 !Motivational factors among the course sections..............................................! 84
4.15! Four cluster science identity solution by sourse type.......................................! 97
4.16! Characteristics of science identity cluster types...............................................! 97
4.17! Demographics of CH10x and CH20x interview participants...........................! 100

For
Michael Scott Cope
(1957-2010)
I hope that you are in a good place, watching the waves, and beachcombing.
Save me a spot.
CHAPTER 1
INTRODUCTION
! On her first day of class, a college freshman enters a large auditorium filled with
hundreds of students. The room lacks windows and the chairs are anchored to the floor.
The rows of seats are angled sharply downwards to the ‘stage,’ as this design gives the
audience a clear view of the instructor who presents the lecture. The cacophony is
overwhelming with competing conversations, zippers parting, and books slamming onto
tables. This scene is unfamiliar to the freshman, who remembers a very different
experience from high school. This ‘classroom’ seems more like a pep rally in the
gymnasium. She looks around for a place to sit, recognizes no one among the sea of
faces, and feels alone in the crowd.
! As more students pile into the room, the temperature of the air begins to rise causing
the student to become groggy as she ponders the wisdom of taking an early morning
class. She worries about being able to learn and retain the material in this unfamiliar
setting. She found science in high school to be difficult, especially chemistry with its
abstract concepts! Another student sits down next to her. He is also a freshman and is
worried about doing well in the class. He struggles with math and gets overwhelmed
when memorizing equations. The sheer scale and anonymity of the situation is causing
him to panic about the course exams before the first lecture has begun. His parents expect
him to go to medical school, but he does not see himself in science. These two students
are not alone in their internal struggles. Students around the room are thinking and
feeling similar thoughts. The instructor appears on the stage, yells for everyone to quiet
down, and with that the class begins.
! At all universities, students regardless of their major take a series of core math and
science courses. These courses are intended to build the foundation of knowledge that
students need for their degree, a holdover from the liberal arts curriculum model
(Peddiwell, 1939). At large universities, these introductory courses often enroll 1000 or
more students per class divided into three or four lecture sessions. Institutions adopted the
1

large lecture class model as a way to meet the challenge of using existing resources for an
increasing student population. This model employs large auditoriums with theater style
seating; a single instructor talks at the front while students listen passively. While this
model accommodates several hundred students at a time, several problems arise:
students are anonymous to the instructor and this can lead to issues of accountability, they
have little interaction with their peers, and they become disengaged with the material
(Aud, et. al, 2012; Mulryan-Kyne, 2010; Sunal, et al., 2001). University faculty rely on
this form of instruction, as it is how they and generations of students before them were
taught and the method has obvious fiscal advantages generating tens of thousands of
student-credit hours.
PROBLEM STATEMENT
! The problem to be addressed in this study is twofold. First, the traditional lecture
format of introductory science courses is inefficient for inspiring interest in a subject,
fails to facilitate critical thinking, and contributes to the fact that only 10% of all college
graduates earn a degree in science, technology, engineering, or mathematics (STEM)
(Cuseo, 2007; Aud, et al., 2012). Second, the current culture of lecturing in undergraduate
science education does not foster development of a science identity in students (i.e. their
self-image as a person in science or as a scientist), yet students who choose a course of
study in STEM disciplines often have an emerging science identity.
BACKGROUND
Increased need for STEM educated workforce
! By the year 2018, the United States (U.S.) Bureau of Labor Statistics projects an 18%
increased need in science, technology, engineering, and mathematics (STEM)
employment in comparison to only a 10% increased need in non-STEM positions (Beede
& Langton, 2011). Earning a degree in STEM is the most common route to obtaining a
STEM job; STEM workers earn approximately 25% more than non-STEM workers and
those who hold STEM degrees have higher wages regardless of the type of job they hold
2

(Beede & Langton, 2011). With these favorable statistics, one would predict that students
would be eager to earn STEM degrees. The reality is that only one-fourth of all bachelor
degrees earned in the US are in STEM fields (Beede & Langto, 2011). Even more
disturbing is the 30-50% attrition rate for college freshmen (Barefoot, 2004; Cuseo,
2007), which is cause for serious concern. In order to stay competitive in the global
economy, the US must increase the number of STEM graduates.
! The College Board (2011) reports that 42% of college-bound high school seniors
intend to major in a STEM related field. Despite the fact that a large proportion of
students are entering college with intent to study in STEM fields, attrition is still a
problem. By their sophomore year, approximately half of science majors switch to a non-
science major, and rarely do non-science majors switch to a science major ([C-IDEA],
2000). Particular characteristics of higher education that contribute to this decline include
common attributes of the first-year experience: the use of large classes for introductory
first-year courses, which promote limited interactions between students and faculty
subsequently relegating students to anonymity status; and the use of a transmission model
of learning that enculturates new college students to passive note taking (Cooper &
Robinson, 2000; Cuseo, 2007; Mulryan-Kyne, 2010).
! Switching to a student-centered learning environment is one way to reverse the
decline of students from college (Mulryan-Kyne, 2010). Pedagogies such as group
activities and peer-to-peer interactions serve the purpose of shifting the focus to the
learner, creating an atmosphere conducive to development of personality attributes like
self-efficacy, leadership, and self-determination (McKeachie, 1990). The result of using
these unconventional methods is that students become participants in their learning
instead of mere spectators. Since many first year introductory science and math courses
are taught as large lecture courses (Cuseo, 2007; Exeter et al., 2010), focusing on
changing the first year experience towards a more student-centered learning environment
could contribute towards motivating and influencing freshmen to persevere in college and
in STEM disciplines (McKeachie, 1990; Cooper & Robinson, 2000).
3
The Traditional Lecture
! Lectures originated in medieval universities, as books and libraries were rare. The
medieval scholar’s task was to present ideas either from his notes or a book (Healey,
1950; Mazur, 2009). This trend was established as an efficient means to disseminate
information quickly and often to a large audience. Lecturing became associated with
academia and it is prevalent today at most levels of schooling. Given advances in
technology, one might ask if lectures are still relevant today.
! The traditional perspective in academia is that students gain an appreciation of critical
thinking, scientific investigation, problem solving and decision making skills throughout
their college career; a career that most of which includes just taking classes. Traditional
undergraduate science education is taught deductively (Felder & Silverman, 1988;
McWilliam, Poronnik, &Taylor, 2008), and the idea is to teach principles first and
applications second. The tacit theory of learning is one cannot engage in meaningful
applications until one has established a foundation. In general, courses in the first two
years of a major are designed to cover basic concepts so that students will gain a
fundamental understanding of their chosen field (Bransford, Brown, & Cocking, 2000).
While the intention of the curriculum seems logical, the actual practice of deductive
teaching becomes a highly structured presentation of content designed to cover an
enormous amount of facts and data (Bieron & Dinan, 2008; Herreid, 2007). This process
is known as, “lecturing.”
! A survey that queried 1800 faculty at a variety of institutions showed that between 73
and 83 percent of faculty utilized lectures as their main instructional technique
(Blackburn, Pellino, Boberg, & O’Connell, 1990). This is not surprising considering most
faculty are not taught how to teach during graduate school and they repeat methods that
are most familiar (Burmila, 2010). Lectures do have merit: most notably they serve to
help the speaker (not the student) organize, synthesize and reflect on the content
(McKeachie, 2011). They can be useful for storytelling, demonstrating enthusiasm for a
subject, and clarifying complex information from the textbook (Costin, 1972; Cuseo,
1998). Lectures are used by experts to demonstrate role modeling during apprenticeship
4

training (i.e. modeling surgical techniques in medical school training) (Reuler and
Nardone, 1994). Information in textbooks is generally outdated by the time the book is
printed; therefore lectures can serve to highlight recently published information and/or
current real world applications (Cuseo, 1998; Brearley, 1959).
! A science instructor’s role is to promote meaningful learning that is increasingly in
alignment with the course curriculum objectives (Ausubel, 1960; Taber, 2004), as
opposed to just focusing on lower levels of knowledge and comprehension (Bloom,
1956). Meaningful learning occurs when instruction provides an organization of the
general principles and then moves towards specific examples that students can apply to
the general principles (Ausubel, 1960). The content is consistently related back to the
general principles in a way that allows students to scaffold their existing knowledge with
new knowledge. In undergraduate science education, studies show that approximately
75% of science courses are taught as instructor centered courses that cover an enormous
amount of facts and data (Trempy, Skinner, & Siebold, 2002). The emphasis in these
types of courses tends to be rote memorization of material that is simply reiterated on
exams. Rote memorization can be useful for some types of learning, like learning the
script for a play or words to a song; however, this activity does not lead to higher levels
of problem solving, critical thinking, and decision making, crucial elements of scientific
practice (Bower, 2005; Woolfolk, 2001, p. 285).
Student experiences during the first year of college !
! Students entering college for the first time experience a period of transition. The
majority of first-year college students (95%) are between the ages of 18-25 years
(Lounsbury, Huffstetler, Leong, & Gibson, 2005), often still in the throes of biological
adolescence. This is a key transformational point known as “emerging
adulthood” (Arnett, 2000); a time in which a person views herself as more than an
adolescent, but not yet quite an adult. This is a period of independence, where the typical
responsibilities of adulthood (e.g. marriage, children, and settling down) have been
replaced with seemingly endless life choices and directions that one may take. Emerging
5
adulthood is a “culturally constructed” situation identified in the 1940’s as a result of
changes in industrialized societies and education levels (Arnett, 2000). This situation can
make the transition to college even more difficult as students are actively modifying their
identities against boundaries of parental expectations, peers, and their own growing sense
of themselves as they enter adulthood (Arnett, 2000; Chickering & Reisser, 1993).
! The first year experiences are important indicators for student persistence and
retention in college (Pascarella & Terenzini, 2005). Students entering college directly
from high school find themselves facing several major drivers of change: struggling with
increased academic demands requiring more self-direction than high school, losing a
familiar home environment and long-time social supports, suffering from financial and
career decision concerns, and integrating into a new way of life. Students who can
successfully manage these changes, who achieve a sense of belonging, are more likely to
be academically successful (Tinto, 1993; Willms, 2003).
! Many undergraduate-core science courses that freshmen are required to take are high
enrollment (e.g. 100-200 students), taught in the traditional lecture format, and offered in
auditoriums with theater-stadium style seating. These courses are part of the first-year
experience at many research-based universities. While this format serves to funnel large
numbers of students through the system, it does little to address some of the problems in
undergraduate science education which include emphasis on passive note taking and
memorization of facts, inadequate interaction with faculty, and lack of connections to
real-life applications (Cooper & Robinson, 2000; Exeter, et al., 2010; Seymour & Hewitt,
1997).
! Tobias (1990) has shown that attrition among science undergraduates partially results
from the manner in which introductory science courses are taught, and she cites several
negative features of these courses: 1) failure to motivate students by relating the course
content to their lives and personal interests; 2) consistent use of passive teaching methods
(i.e. lecture); 3) emphasis on assessment and grades; and 4) focus on rote memorization
rather than conceptual understanding. Studies done on student perceptions of large lecture
science courses revealed that students most often cited lack of individual accountability,
6
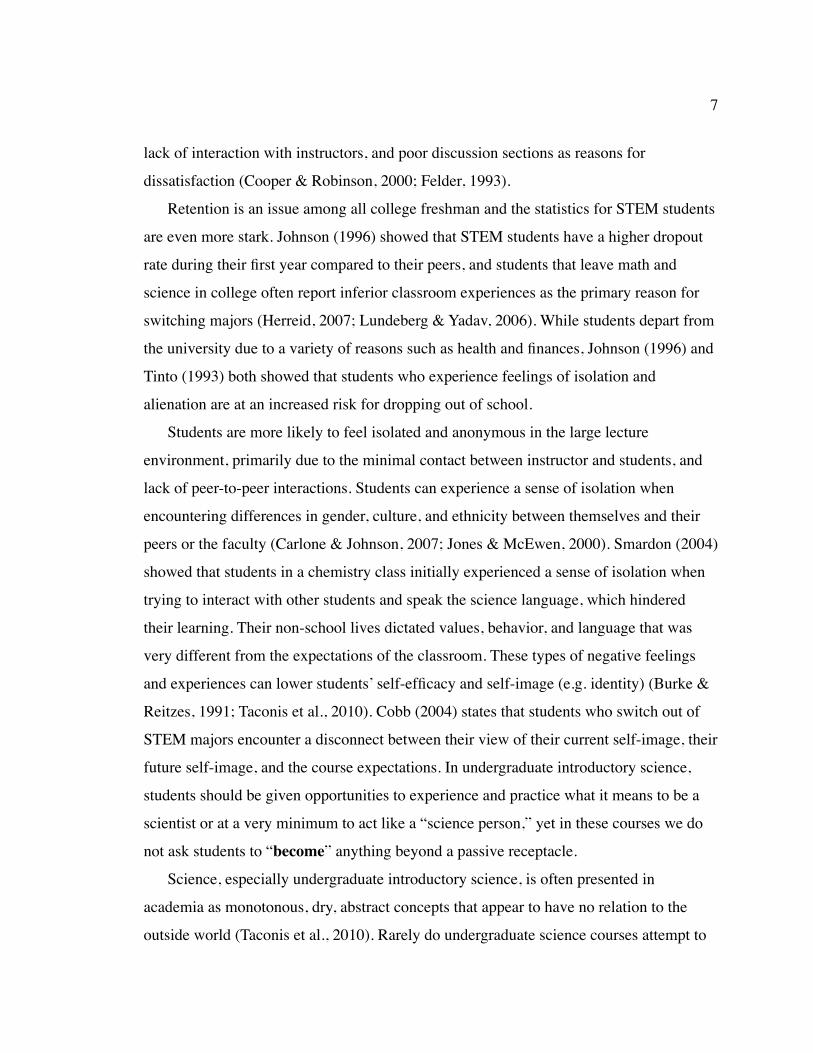
lack of interaction with instructors, and poor discussion sections as reasons for
dissatisfaction (Cooper & Robinson, 2000; Felder, 1993).
! Retention is an issue among all college freshman and the statistics for STEM students
are even more stark. Johnson (1996) showed that STEM students have a higher dropout
rate during their first year compared to their peers, and students that leave math and
science in college often report inferior classroom experiences as the primary reason for
switching majors (Herreid, 2007; Lundeberg & Yadav, 2006). While students depart from
the university due to a variety of reasons such as health and finances, Johnson (1996) and
Tinto (1993) both showed that students who experience feelings of isolation and
alienation are at an increased risk for dropping out of school.
! Students are more likely to feel isolated and anonymous in the large lecture
environment, primarily due to the minimal contact between instructor and students, and
lack of peer-to-peer interactions. Students can experience a sense of isolation when
encountering differences in gender, culture, and ethnicity between themselves and their
peers or the faculty (Carlone & Johnson, 2007; Jones & McEwen, 2000). Smardon (2004)
showed that students in a chemistry class initially experienced a sense of isolation when
trying to interact with other students and speak the science language, which hindered
their learning. Their non-school lives dictated values, behavior, and language that was
very different from the expectations of the classroom. These types of negative feelings
and experiences can lower students’ self-efficacy and self-image (e.g. identity) (Burke &
Reitzes, 1991; Taconis et al., 2010). Cobb (2004) states that students who switch out of
STEM majors encounter a disconnect between their view of their current self-image, their
future self-image, and the course expectations. In undergraduate introductory science,
students should be given opportunities to experience and practice what it means to be a
scientist or at a very minimum to act like a “science person,” yet in these courses we do
not ask students to “become” anything beyond a passive receptacle.
! Science, especially undergraduate introductory science, is often presented in
academia as monotonous, dry, abstract concepts that appear to have no relation to the
outside world (Taconis et al., 2010). Rarely do undergraduate science courses attempt to
7
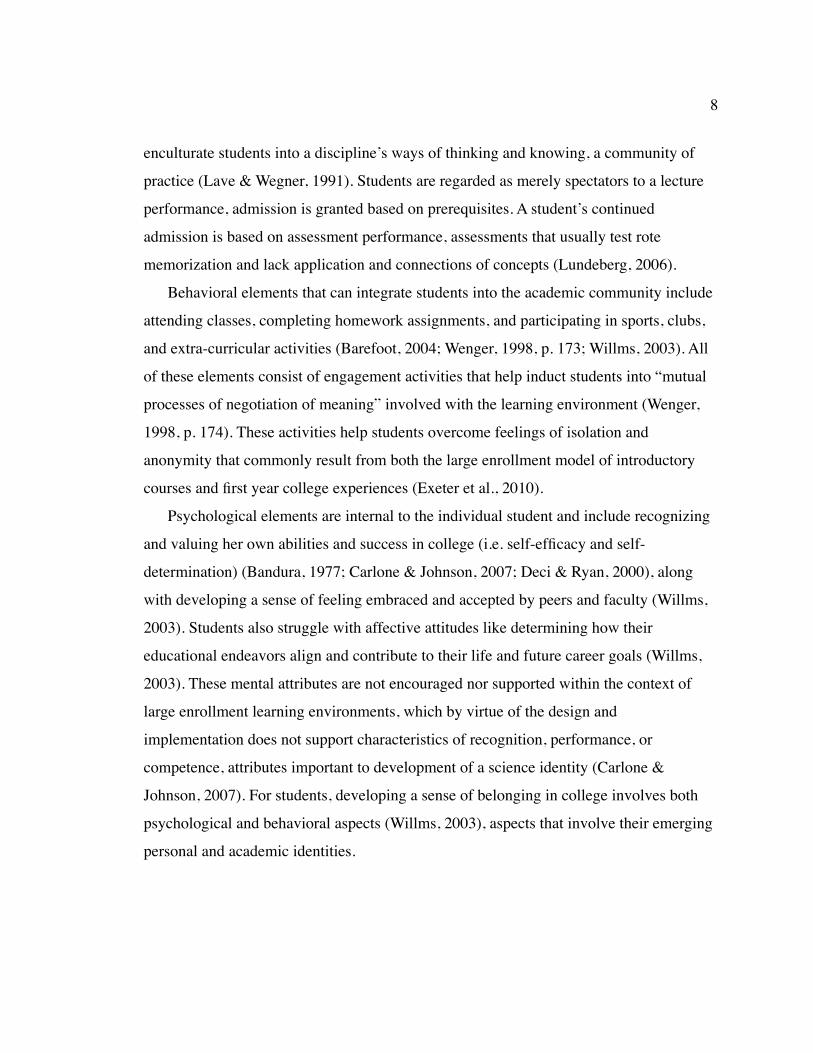
enculturate students into a discipline’s ways of thinking and knowing, a community of
practice (Lave & Wegner, 1991). Students are regarded as merely spectators to a lecture
performance, admission is granted based on prerequisites. A student’s continued
admission is based on assessment performance, assessments that usually test rote
memorization and lack application and connections of concepts (Lundeberg, 2006).
! Behavioral elements that can integrate students into the academic community include
attending classes, completing homework assignments, and participating in sports, clubs,
and extra-curricular activities (Barefoot, 2004; Wenger, 1998, p. 173; Willms, 2003). All
of these elements consist of engagement activities that help induct students into “mutual
processes of negotiation of meaning” involved with the learning environment (Wenger,
1998, p. 174). These activities help students overcome feelings of isolation and
anonymity that commonly result from both the large enrollment model of introductory
courses and first year college experiences (Exeter et al., 2010).
! Psychological elements are internal to the individual student and include recognizing
and valuing her own abilities and success in college (i.e. self-efficacy and self-
determination) (Bandura, 1977; Carlone & Johnson, 2007; Deci & Ryan, 2000), along
with developing a sense of feeling embraced and accepted by peers and faculty (Willms,
2003). Students also struggle with affective attitudes like determining how their
educational endeavors align and contribute to their life and future career goals (Willms,
2003). These mental attributes are not encouraged nor supported within the context of
large enrollment learning environments, which by virtue of the design and
implementation does not support characteristics of recognition, performance, or
competence, attributes important to development of a science identity (Carlone &
Johnson, 2007). For students, developing a sense of belonging in college involves both
psychological and behavioral aspects (Willms, 2003), aspects that involve their emerging
personal and academic identities.
8
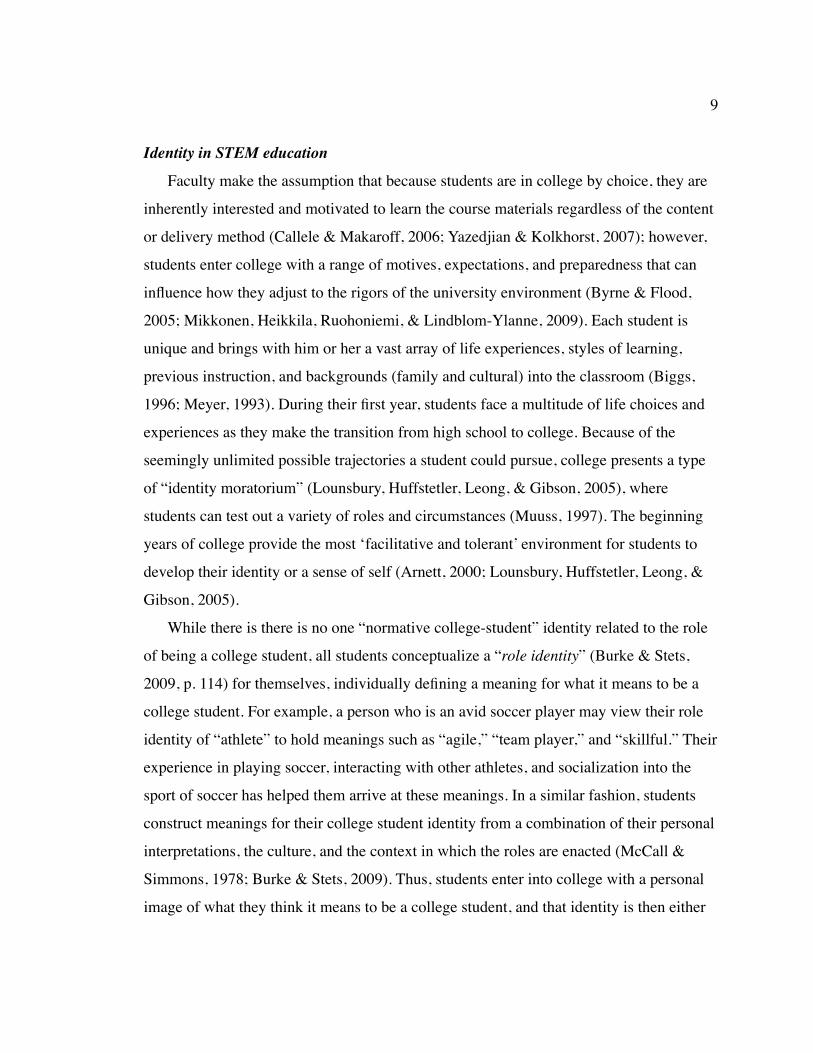
Identity in STEM education
! Faculty make the assumption that because students are in college by choice, they are
inherently interested and motivated to learn the course materials regardless of the content
or delivery method (Callele & Makaroff, 2006; Yazedjian & Kolkhorst, 2007); however,
students enter college with a range of motives, expectations, and preparedness that can
influence how they adjust to the rigors of the university environment (Byrne & Flood,
2005; Mikkonen, Heikkila, Ruohoniemi, & Lindblom-Ylanne, 2009). Each student is
unique and brings with him or her a vast array of life experiences, styles of learning,
previous instruction, and backgrounds (family and cultural) into the classroom (Biggs,
1996; Meyer, 1993). During their first year, students face a multitude of life choices and
experiences as they make the transition from high school to college. Because of the
seemingly unlimited possible trajectories a student could pursue, college presents a type
of “identity moratorium” (Lounsbury, Huffstetler, Leong, & Gibson, 2005), where
students can test out a variety of roles and circumstances (Muuss, 1997). The beginning
years of college provide the most ‘facilitative and tolerant’ environment for students to
develop their identity or a sense of self (Arnett, 2000; Lounsbury, Huffstetler, Leong, &
Gibson, 2005).
! While there is there is no one “normative college-student” identity related to the role
of being a college student, all students conceptualize a “role identity” (Burke & Stets,
2009, p. 114) for themselves, individually defining a meaning for what it means to be a
college student. For example, a person who is an avid soccer player may view their role
identity of “athlete” to hold meanings such as “agile,” “team player,” and “skillful.” Their
experience in playing soccer, interacting with other athletes, and socialization into the
sport of soccer has helped them arrive at these meanings. In a similar fashion, students
construct meanings for their college student identity from a combination of their personal
interpretations, the culture, and the context in which the roles are enacted (McCall &
Simmons, 1978; Burke & Stets, 2009). Thus, students enter into college with a personal
image of what they think it means to be a college student, and that identity is then either
9
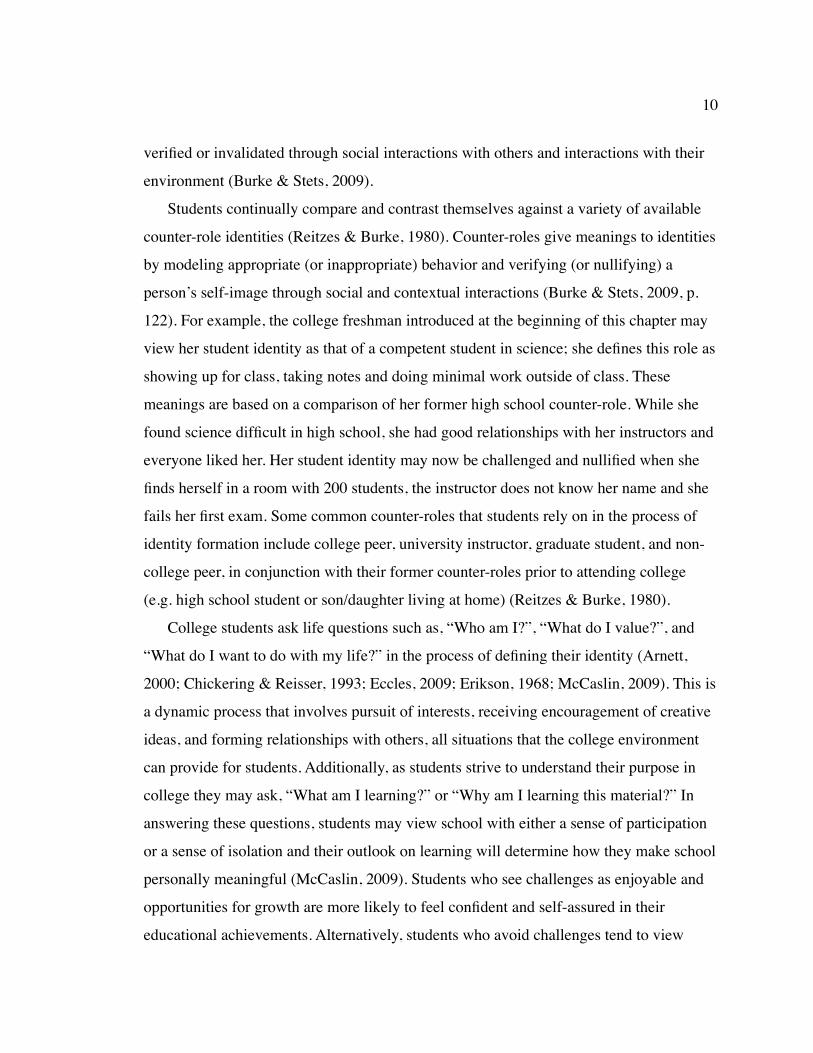
verified or invalidated through social interactions with others and interactions with their
environment (Burke & Stets, 2009).
! Students continually compare and contrast themselves against a variety of available
counter-role identities (Reitzes & Burke, 1980). Counter-roles give meanings to identities
by modeling appropriate (or inappropriate) behavior and verifying (or nullifying) a
person’s self-image through social and contextual interactions (Burke & Stets, 2009, p.
122). For example, the college freshman introduced at the beginning of this chapter may
view her student identity as that of a competent student in science; she defines this role as
showing up for class, taking notes and doing minimal work outside of class. These
meanings are based on a comparison of her former high school counter-role. While she
found science difficult in high school, she had good relationships with her instructors and
everyone liked her. Her student identity may now be challenged and nullified when she
finds herself in a room with 200 students, the instructor does not know her name and she
fails her first exam. Some common counter-roles that students rely on in the process of
identity formation include college peer, university instructor, graduate student, and non-
college peer, in conjunction with their former counter-roles prior to attending college
(e.g. high school student or son/daughter living at home) (Reitzes & Burke, 1980).
! College students ask life questions such as, “Who am I?”, “What do I value?”, and
“What do I want to do with my life?” in the process of defining their identity (Arnett,
2000; Chickering & Reisser, 1993; Eccles, 2009; Erikson, 1968; McCaslin, 2009). This is
a dynamic process that involves pursuit of interests, receiving encouragement of creative
ideas, and forming relationships with others, all situations that the college environment
can provide for students. Additionally, as students strive to understand their purpose in
college they may ask, “What am I learning?” or “Why am I learning this material?” In
answering these questions, students may view school with either a sense of participation
or a sense of isolation and their outlook on learning will determine how they make school
personally meaningful (McCaslin, 2009). Students who see challenges as enjoyable and
opportunities for growth are more likely to feel confident and self-assured in their
educational achievements. Alternatively, students who avoid challenges tend to view
10
them as sources of struggle, hurdles to overcome. Students may also become disinterested
in learning if they view school as a place of futility and discouragement (Craig, Graesser,
Sullins, & Gholson, 2004; Csikszentmihalyi, 1997). As students negotiate their role
identity as a college student, they may think “Do I belong here?” and “Am I welcome
here?” (McCaslin, 2009). Students who form few relationships and adopt a perspective
that faculty and peers do not care about them or their learning are more likely to feel
disconnected from the college community. Students who have positive interactions with
faculty and peers, and engage in activities related to their learning are more likely to feel
they belong in college. Students may be motivated to learn if they view school as
interesting and challenging within the limits of their abilities (Csikszentmihalyi, 1997).
! Finding interest and challenge in a particular subject area may prompt students to
identity with and seek out groups or clubs that allow them to engage in behaviors
associated with that subject. These experiences allow students to “test-drive” an identity
and can ultimately lead to development of that identity. This process involves the social
interactions of recognition by others (Bucholtz & Hall, 2005; Burke & Reitzes, 1991;
Carlone & Johnson, 2007; Gee, 2000), a belief in one’s own abilities (self-efficacy) and
demonstrated success in those abilities (Bandura, 1977; Carlone & Johnson, 2007;
Lounsbury, Huffstetler, Leong, & Gibson, 2005). For example, students involved in a pre-
veterinary club are presented with many opportunities to engage in and experience the
duties and responsibilities associated with having a career in veterinary medicine. As a
result of the social aspects of this group or club, student members take on the particular
characteristics of the group, which allows them to test the identity of being a veterinarian.
! Students’ may also identify with a particular subject area in the classroom when they
can apply their prior experiences and past success to the larger world of possibilities that
college life affords. In these types of situations, students’ development of a science
identity is one that emerges as part of the process of participation in, experiencing, and
being recognized for their work in science courses (Carlone & Johnson, 2007; Cobb,
2004; Gee, 2000). Brown (2004) showed that students who were given opportunities to
take on roles similar to a research community (e.g. scientists collaborating with one
11
another on research projects) exhibited long term retention of content, but more
importantly they had higher levels of self-esteem, felt accepted and recognized for their
accomplishments, and adopted attitudes that were sustained over long periods. In essence,
these students had adopted new identities that were individually and socially constructed
from experiences gained in their learning environment. In a science classroom, providing
students with experiences to test roles can result in the development of identities,
including a science identity. Carlone and Johnson (2007) have shown that students who
develop a strong science identity are more likely to be committed to a science career and
therefore persist in STEM majors.
THEORETICAL FRAMEWORK
! This study uses Identity Theory (Burke & Stets, 2009; McCall & Simmons, 1978;
Tajfel, 1978) and Student Development Theory (Chickering, 1969) as the basis for
framing research questions about how students develop a science identity. These two
theories contribute to an understanding of the challenges and issues undergraduates face
when learning difficult subjects like science in college and how these problems may help
or hinder the development of a science identity.
Towards a science identity
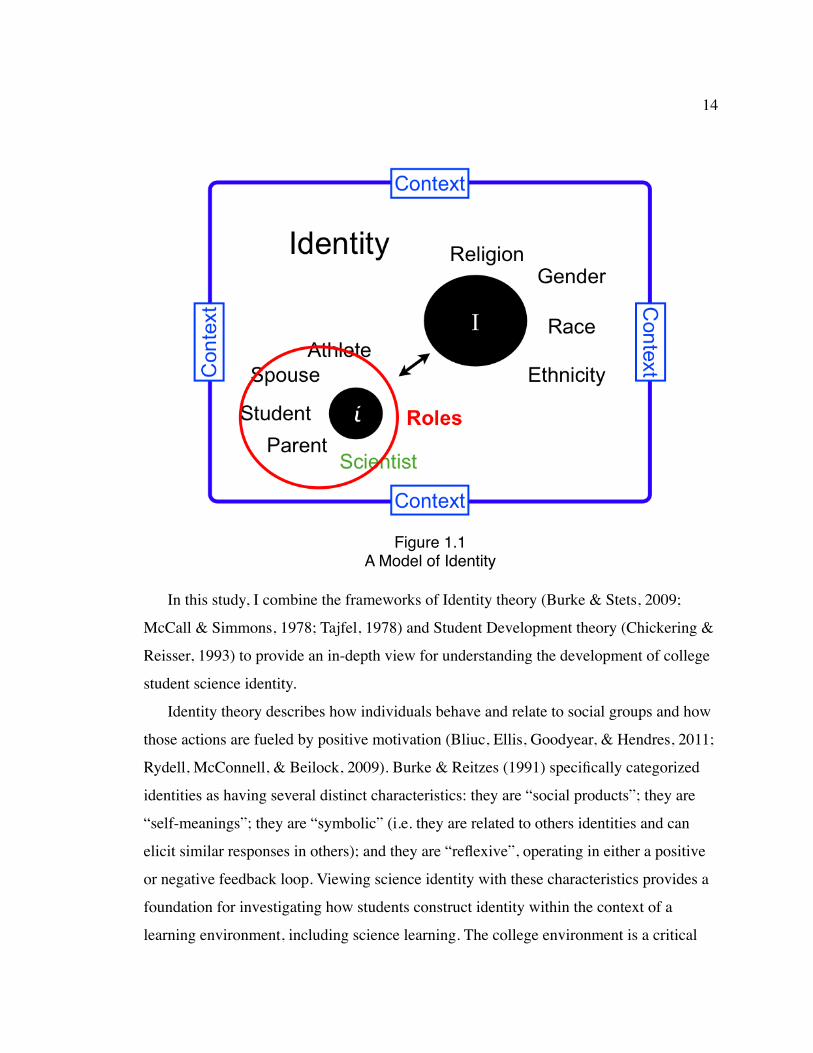
! Much of the literature centered on identity discusses the concept in terms of race,
ethnicity, religion, gender, or sexual orientation (e.g. Carlone & Johnson, 2007; Chang,
Eagan, Lin, & Hurtado, 2011; Jones & McEwen, 2000) what Falk (2009, p. 73) terms,
“big ‘I’ identities” (See Figure 1.1). As examples, Carlone and Johnson (2007) researched
how women who were marginalized in science came to develop a science identity, while
Chang, et al. (2011) studied racial stigmas as a result of low rates of science major
completion among minority students. These big “I” identities are the largely stable
identities, often central to an individual’s character, that everyone commonly associates
with the word “identity” (Bond & Falk, 2012; Gee, 2000). While the term identity often
12
invokes thoughts of more obvious personal attributes like gender, nationality or ethnicity,
in this study, identity will be defined according to a general definition. This definition is
similar to that used in the identity literature as a set of meanings, attributes, and
characteristics that make a person unique, that give a person a sense of who he is (i.e. a
sense of self), that help a person form goals and values, and that define a person as a
member of a particular group or role in society. More specifically, a science identity will
be defined with guidance from Carlone and Johnson's (2007) research as that portion of a
college student’s identity that she associates with her self-image as a person in science (or
as a scientist), that she is confident in her abilities to understand science content and
demonstrates this ability through the use of appropriate tools and symbolic interaction
(i.e. social dialogue and behavior), and that other people (e.g. peers, teachers, family)
acknowledge as being a person associated with science. Additionally, a science identity
will be classified as a “little ‘i’ identity” by Falk’s (2009, p. 73) definition, an identity that
is contextually situated and responds in the moment (See Figure 1.1).
! An individual can gain a sense of self or in other words identity through recognition
by others whom they deem important (e.g. a supervisor, a teacher, a parent, etc...)
(Carlone and Johnson, 2007). A sense of self can also be developed through life
experiences (Giddens, 1991; Kozoll & Osborne, 2004), social discourse (Bucholtz &
Hall, 2005) and the meanings of roles that one may hold in society (Burke & Stets, 2009,
p. 114). Additionally, an individual’s identity is influenced by participation in the
practices of their culture, and culture can in turn be influenced and altered by the
communities’ activities (Burke & Reitzes, 1991; Gutierrez & Rogoff, 2003; Lave &
Wenger, 1991). Identity is therefore both individually and socially constructed; a
comprehensive view of identity considers both the individual and social perspectives
when observing students’ learning experiences in the classroom. In the development of a
science identity, this perspective would include social interactions in the classroom,
connections that students make between the science and their lives, and the use of
scientific tools and discourse related to the course content.
13
! In this study, I combine the frameworks of Identity theory (Burke & Stets, 2009;
McCall & Simmons, 1978; Tajfel, 1978) and Student Development theory (Chickering &
Reisser, 1993) to provide an in-depth view for understanding the development of college
student science identity.
! Identity theory describes how individuals behave and relate to social groups and how
those actions are fueled by positive motivation (Bliuc, Ellis, Goodyear, & Hendres, 2011;
Rydell, McConnell, & Beilock, 2009). Burke & Reitzes (1991) specifically categorized
identities as having several distinct characteristics: they are “social products”; they are
“self-meanings”; they are “symbolic” (i.e. they are related to others identities and can
elicit similar responses in others); and they are “reflexive”, operating in either a positive
or negative feedback loop. Viewing science identity with these characteristics provides a
foundation for investigating how students construct identity within the context of a
learning environment, including science learning. The college environment is a critical
14
Figure 1.1A Model of Identity
element in identity development (Lounsbury, Huffstetler, Leong, & Gibson, 2005;
Luyckx, Goossens, & Soenens, 2006) and in this context, students also establish, manage,
and monitor relationships in the process of developing an identity (Lounsbury,
Huffstetler, Leong, & Gibson, 2005).
! Student Development Theory (Chickering & Reisser, 1993) outlines seven
developmental vectors that can be used to examine and interpret these relationships in the
formation of a science identity: establishing identity (the primary vector) developing
competence, purpose, and integrity, managing emotions, transitioning from autonomy
towards interdependence, and creating mature relationships. Students progress through
these vectors, at varying rates and not in sequential order, when processing emotions,
cognition, and managing relationships with others in the process of identity development
(Lounsbury, Huffstetler, Leong, & Gibson, 2005). Identity theory and Student
Development theory will be discussed in the next two sections.
Identity Theory
! Identity theory is situated in a social constructivist framework known as symbolic
interactionism (Burke & Stets, 2009; McCall & Simmons, 1978). Symbolic
interactionism (Blumer, 1969) is rooted in behaviorism, yet it is not based on conditioned
or instinctive responses (Bodner & Orgill, 2007, p. 52); this perspective is based on the
interpreted meanings that individuals make for the objects and individuals in their
environment (Blumer, 1969, p. 79; Burke & Stets, 2009). Individuals construct meanings
through an interpretive reciprocal process that arises out of social interactions that an
individual has with others (Blumer, 1969, p. 79; Bodner & Orgill, 2007, p. 51; Foote,
1951; Mead, 1934). These meanings that an individual constructs successively determine
behavior (Burke & Stets, 2009, p. 51). In order to equate these behaviors with formation
of an identity, the behavior performed should correlate with the meaning the individual
holds for his identity (Burke & Stets, 2009, p. 51). For example, if a student has a
developed science identity, then that student should exhibit behaviors that indicate a
science identity. These behaviors include: performance of scientific skills, practices, and
15
discourse with and for others that demonstrates science content knowledge, and
motivation to seek out new science knowledge and relation of this knowledge to real-
world contexts; and self-recognition of herself as having a science identity and ipso facto
is recognized by others (Carlone & Johnson, 2007). Recognition (by self and others) is
one of the more salient behaviors because “Identities are the shared social meanings that
persons attribute to themselves in a role” (Burke & Reitzes, 1991).
! According to Burke, the process of activating an identity in a situation creates a
feedback loop (Burke & Reitzes, 1991; Burke & Stets, 2009). Individuals construct
meanings for themselves they use to define who they are as a person in social roles and
situations. These self-meanings associated with that particular identity then function as
reference standards for the individual and act as regulators of behavior (Burke & Reitzes,
1991). As the individual receives recognition (positive or negative) for the new identity
through social interactions (Carlone & Johnson, 2007), he compares the input received
from others against the self-created identity reference standard (Burke & Reitzes, 1991).
Incongruence between the received inputs and the self reference standard, causes the
individual to undergo behavior modification; either the individual tries to modify his
behavior to match the inputs received or tries to modify other people’s perceptions
through continued behavior that matches his original self-meaning of the identity (Burke
& Reitzes, 1991).
! To illustrate this framework in action, I will examine the science identity
development of a student entering a large research university as a freshman. The Big I
identities (Falk, 2009) of this student include his race, gender, religious affiliation, sexual
orientation, and socioeconomic status. He is a white, male, heterosexual who was raised
Catholic in a small, rural town in Eastern Oregon. He is away from home for the first
time, is the oldest child in a family with four kids, and is the first person in his family to
go to college. He was an average student in high school with science subjects and
believes that he is not capable of doing science, yet he has an interest in science. His
parents are not science-oriented and have consistently told him that they did not like
science in school, reinforcing his negative self-image in science. While his parents are
16
supportive of his decision to attend college, their expectations are that he will study
business management in order to return after graduation to help operate the family
business. This student carries a negative self-image in science, yet believes he must be a
good student, bolstered by acceptance into college. Upon entering college, this student
will be faced with conflicting views of his identity. One identity view tells him that he is
bad at science because his past and his family have said so, while the other view
occurring through the college environment tells him he is a capable student. His new
college peers, all of whom he considers to be good at science, encourage him to view
himself as competent. In the context of his chemistry class, the instructor has told all
students that half of them will fail because the course is hard, along with another insight
that most will fail if they are bad at math. Through these experiences, his little “i”
identities (Falk, 2009) of his science ability and as a good student have both a sense of
stability and malleability (Burke, 1980; Markus & Kunda, 1986). Which identity is
dominant in this situation? He carries this self-concept that he is bad at science, his
identity reference standard, which can serve to undermine (i.e. regulate his behavior) his
good student identity; however, he now belongs to a group that contradicts his self-
concept. He will now compare the inputs received from his new peers against his identity
reference standard. His negative self-concept can be replaced with a more positive self-
concept if he can be convinced by others (e.g. peers, instructors, teaching assistants, etc.)
that he can do the science and be successful at it.
Student Development Theory
! Like the student in the previous example, students can bring with them prior
experiences, attitudes, and backgrounds that can be a bridge (or a chasm) between their
concept of self and their concept of the group to which they belong and relate in college
(Rydell, McConnell, & Beilock, 2009). Student Development Theory (Chickering, 1969;
Chickering & Reisser, 1993) can be used as a model of multiple dimensions of identity
(Abes, Jones, & McEwen, 2007; James, 1890) to illustrate how students socially
construct a science identity out of the many personal attributes and conceptions of self
17
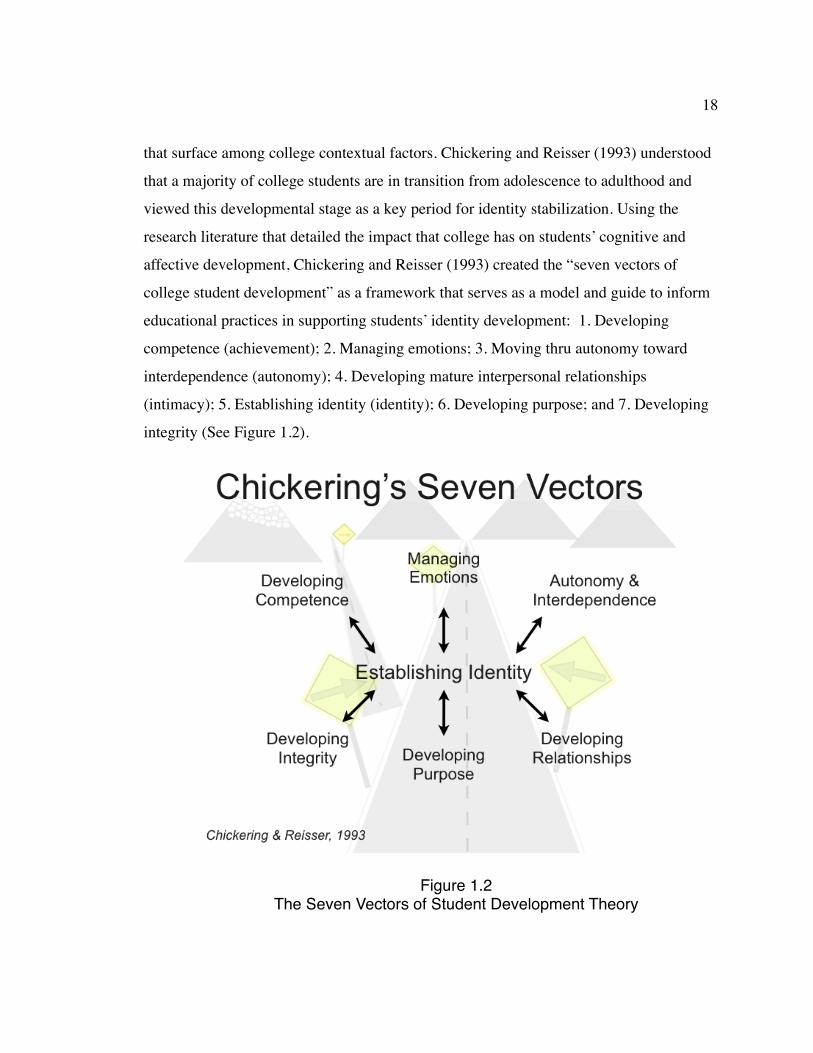
that surface among college contextual factors. Chickering and Reisser (1993) understood
that a majority of college students are in transition from adolescence to adulthood and
viewed this developmental stage as a key period for identity stabilization. Using the
research literature that detailed the impact that college has on students’ cognitive and
affective development, Chickering and Reisser (1993) created the “seven vectors of
college student development” as a framework that serves as a model and guide to inform
educational practices in supporting students’ identity development: 1. Developing
competence (achievement); 2. Managing emotions; 3. Moving thru autonomy toward
interdependence (autonomy); 4. Developing mature interpersonal relationships
(intimacy); 5. Establishing identity (identity); 6. Developing purpose; and 7. Developing
integrity (See Figure 1.2).
18
Figure 1.2The Seven Vectors of Student Development Theory
! These seven vectors align with the life stages that adolescences advance through as
they attempt to establish identity, as described by Erickson (1968) who believed that
defining identity was the most important goal of adolescence. In Erickson’s view, identity
evolution was a schematic that dictated a sequence of developmental events that
progressed from point A to point B usually being preceded by some crises or critical
moment that either encouraged or deterred the direction of a person's identity
development; thus a person could either move forward or backward during the process of
developing an identity. Like Erickson, Chickering and Reisser (1993) view student
identity development as a student resolving crises; students face challenges, they utilize
intrinsic motivations to make commitments and they gain self-efficacy and self-
determination along this process. Chickering and Reisser's seven vectors also align with
Erickson’s model in that they do not follow a prescribed trajectory or linear path. The
seven vectors model encompasses a range of attributes that are important in identity
development of adolescents, but it sets identity as the focal point for how students
progress towards development of an identity. Movement can occur simultaneously among
two or more of vectors or along just one vector, in an ebb and flow pattern. If the vectors
are viewed as a system of highways and byways that students must navigate in their quest
for a stable identity, then the vectors serve as a series of maps to indicate mode of
transport and direction for students’ progress (Chickering & Reisser, 1993, p. 34); maps
that can be used to understand how students’ identities develop in college and more
specifically, how students develop science identities.
PURPOSE OF STUDY
The purpose of this study is to assess the effects of active engagement strategies on
science identity formation and motivation, through the use of online surveys and personal
interviews, as a means of enhancing student retention and persistence in college.
19

RESEARCH QUESTIONS
RQ1: In what ways can the development of a student’s science identity be measured?
H1: All students enter college with some measure of a science identity.
In this project, I developed a science identity instrument consisting of questions focused
around three aspects of a science identity: recognition of one’s identity, performance
related to one’s identity, and competence in one’s ability (self-efficacy) to function in a
science identity role. I analyzed behavior patterns between and within individuals by: 1)
combining responses of similar individuals on the instrument in order to highlight
patterns of a certain type of individual (e.g. someone with a science identity) and 2)
coordinating the instrument responses to individual interviews to place participants on a
scale of low, moderate, high science identity.
RQ2: How does group work in lecture affect development of a student’s science identity?
H2:! There will be a positive relationship between the use of active engagement work in
a large lecture and students’ development of a science identity.
Science identity can be driven by college experiences, such as the opportunity to explore
majors, potential careers, and develop a sense of self and a professional identity. Student
learning occurs through an interaction of personal characteristics, behaviors, and
contexts, yet a majority of college courses are taught in large auditoriums. Students sit
passively listening to a lecture with few opportunities for engagement or interaction. I
used the science identity instrument to measure how individual identity and behavior are
being influenced by the social structures of using group work in lecture.
RQ3: How does group work in lecture effect a student’s motivation (intrinsic, self-
determination, and self-efficacy) in learning science?
H3:! There will be a positive relationship between the use of active group work in a large
lecture and students’ self-efficacy, motivation and affect.
Poor motivation often leads to a student’s low academic achievement. Students,
especially non-science majors, who are poorly motivated often do not view science as
20

relevant to their careers and/or find undergraduate science courses to be frustrating and
difficult. These poorly motivated students are likely to drop out of college or switch
majors. Attrition among college students has been shown to be partially due to the
manner in which introductory science courses are taught. To understand the effects of
using group work in lecture, I used the Chemistry Motivation Questionnaire (Glynn &
Koballa, 2006) in an online survey format. I utilized the student responses generated to
measure six aspects of motivation related to studying motivation. This questionnaire was
validated for use with undergraduates to determine their motivation to learn chemistry.
Ideally, students using group work in lecture will show an increase in their motivation to
do chemistry over the length of the course.
SIGNIFICANCE OF STUDY
! This study is significant to the field of science education research in two ways. First,
this study provides a novel instrument for measuring and tracking the development of a
students’ science identity. I used the instrument to compare the initial science identity of
science non-majors to the science identities of science majors within two large lecture
chemistry courses and I tracked the development of students’ science identity over time.
This research contributes to the literature on student identity in that little research has
been done specifically on the development of science identities in undergraduate non-
science majors. Furthermore, the ability to measure and track a students’ science identity
will be useful in high school and informal learning contexts that are looking for ways to
assess student engagement in the sciences. This instrument will also prove beneficial to
STEM recruitment and retention programs that are required by funding sources to
evaluate the effectiveness of the programs
! Second, this study measured the effects of using active engagement strategies on
students’ development of a science identity and motivation to do science. Student
experiences in the first-year of college often include studying introductory subjects taught
in the context of large, lecture courses, a situation that offers limited faculty-student
interactions and a transmission model of instruction that cultivates passive note taking.
21
While the model is efficient for disseminating information to large groups at one time, it
also facilitates student anonymity. Students who feel anonymous in school are less likely
to feel personally responsible for learning and are more likely to skip class, behaviors that
can lead to a decrease in motivation to learn and potentially withdrawal from college.
Pedagogies that incorporate group activities and encourage peer-to-peer interactions can
serve to both decrease the feeling of anonymity among students and create learning
environments that foster development of motivational attributes, such as self-efficacy,
self-determination and goal orientation that can contribute to student success and
retention in college.
22
CHAPTER 2
LITERATURE REVIEW
ReDefining the approach to undergraduate education
“The classroom is a place of multiple affective experiences with motivational
significance, including feelings associated with achievement success or failure, as well as
acceptance or rejection by others.” (Graham, 1991)
! There is nationwide concern that the US is doing a poor job of teaching students in
science, technology, engineering, and mathematics (STEM) disciplines (C-IDEA, 2000;
OCED, 2010). Teaching is a highly skilled profession, yet most university faculty are not
taught to teach during their graduate training (Felder, Brent, & Prince, 2011). Faculty are
hired into a position and expected to learn by trial and error how to manage teaching and
research. Boice (2000) showed that 95% of new faculty members take 4-5 years to
become proficient at teaching. However, to truly master a skill takes approximately twice
this amount of time. Ericsson, Krampe, and Tesch-Romer (1993) have shown that it takes
a minimum of 10,000 hours of intense practice and deliberate efforts to improve to fully
master a skill to achieve expertise. Unfortunately few faculty receive teacher training or
support and instinctively teach classes the way they were taught in graduate school, the
assumption being that it worked then and it should work now (Felder, 1993).
! In graduate school, students spend considerable time preparing presentations to cover
large amounts of material at a relatively fast pace, with little attention to audience
understanding (Boice, 2000). Graduate students often present to audiences with
knowledge superior to their own and their presentations become an opportunity for them
to exhibit their mastery of discipline specific discourse and content, not to teach novices.
This method of presenting is appropriate for an audience of content experts, but does not
provide instructional scaffolding of new content to undergraduates who lack the
foundational knowledge to make conceptual connections. Thus, as graduate students
23
transition into faculty positions, they continue to lecture and are rarely exposed to
alternative forms in their career (Felder, Brent, & Prince, 2011).
! Lecturing is a cultural phenomenon; it is a practice taught and reinforced by life
experiences that start during childhood. Anyone who has attended church or religious
services remembers having to sit quietly for extended periods of time while listening to a
pastor or priest recite a sermon. Parents “lecture” to their children, often falling upon deaf
ears, on the appropriate ways to behave. Politicians and leaders deliver speeches on their
views and beliefs to audiences that sit and listen to them speak. Even entertainment
activities like sporting events and the theater involve spectators watching the action
happen in front of them. These experiences are certainly not unique to modern society
and examples of each can be dated back to ancient times. Prior to the advent of printing
presses and books, lecturing was the only method of transmitting knowledge to others
(Mazur, 2009). Despite the advent of mechanical printing devices in the mid-19th
century, in addition to a host of other technological advances in the 20th and 21st
centuries, lecturing persists as one of the most common means of passing information
along to others.
! The typical university introductory science course, especially at large research
institutions, is held as a lecture format, often located in an auditorium, with 1000 or more
more students enrolled per course. These instructor-centered courses are advantageous for
transmitting large amounts of information, are efficient and cost effective (more students
per faculty); however, the focus in these types of courses tends to be rote memorization
of content that students repeat on exams. Von Glaserfeld (1989) has written that,
“learner’s do not simply mirror and reflect what they read or hear,” implying that learning
is a both a personal act and not completely objective. Yet in many undergraduate science
courses, students are expected to do just what Von Glaserfeld rebukes: mirror and reflect
what they are told or shown. Instructors present the material and students take judicious
notes writing down every formula and list in preparation for the exam, which in the case
of a large lecture course, is often a multiple choice exam that emphasizes this mirror and
repeat cycle. Studies such as those done by Gardiner (1994) showed that students who are
24

tested immediately after retained only 42% of the material covered in a lecture.
Moreover, that figure drops to 20% when students are assessed a week later. While
memorization is at the foundational level of Bloom’s taxonomy (1956) and is certainly a
necessary part of learning, this technique alone does not lead to crucial elements of
scientific practice such as developing and using models; problem solving and
computational thinking; and planning and implementing investigations (Reiser, Berland,
& Kenyon, 2012).
! As college students continue to leave the sciences in favor of other disciplines, often
reporting inferior teaching as the primary reason for switching majors (Herreid, 2007),
universities are turning towards research for new directions emphasizing a student-
centered environment where professors and instructors promote meaningful learning. A
recent study by Chaplin (2009) compared student performance in a lecture-based versus
active-engagement (case study) instruction. Chaplin’s study compared a biology course
that was taught using the lecture method in 1998 and again using a case-based teaching
method in 2006. Classroom size, time of day and instructional technology were all
similar. Student performance was evaluated to determine if the instructional method had
an impact on student achievement and higher-order thinking. The author compared data
from the first and last exams for both classes to examine this element. To account for an
increase in development of higher-order thinking, the percentage of incorrectly answered
questions was compared between the first and last exams. If students had improved their
skills in higher-order thinking, then the percentages of incorrectly answered questions
would be assumed to decrease. The last measure of performance examined was the
distribution of total exam points earned by students. Total points, broken down into
percentages (i.e. >90%, 80-90%, etc..) was compared between the classes using a Chi-
squared analysis.
! The most compelling data to come out of the Chaplin study (2009) was the difference
in improvements on exams. The 1998 class showed that only 50% of the students
increased their scores on the first and last exams by an average of 9 points, while the
other 50% of the students decreased their scores by 13 points. In comparison, 80% of the
25
students in the 2006 case-based course improved their score on the last exam by a mean
of 9 points, while only 20% of the students decreased their scores on the last exam by an
average of 3 points (Chaplin, 2009). Overall, the students in the lecture-based course did
improve in their ability to answer content-knowledge comprehension type questions.
However, the students in the case based course showed a higher, more consistent level of
performance on the same kinds of questions. In another study similar to Chaplin’s (2009),
Tschumi (1991) showed that students displayed higher levels of performance on exams as
a result of the use of group work. Tschumi (1991) conducted a comparison study in an
introductory computer science course, teaching the course three different times using
either group work or individual activities. Students in all three courses were given similar
exams. In the course where students worked individually, only 36% of these students
earned a C or better on exams, while an average of 62% of the students who participated
in group work had earned a C or better.
! Studies on the effects of group learning and use of discussions in the classroom are
not unique to the current literature and research done in the 1940’s found positive effects
from implementing student-centered teaching. Zeleny (1940) performed an innovative
study on college students comparing the effects of using a group-centered method. Zeleny
reported that the experimental group that used discussion showed higher cognitive
outcomes on exams and that this group exhibited higher levels of self-confidence and
leadership than students who did not have the discussion during class. In another study,
Faw (1949) compared the effects of using student-centered discussion versus using an
instructor-centered discussion. In the student-centered discussion, the instructor gave a
lecture followed by a session where students were free to express their thoughts and
opinions, without the instructor’s involvement in the discussion. In the instructor-
centered discussion, the session that followed the lecture was designed around a
particular topic chosen by the instructor. The instructor led the discussions in this second
method, answering questions and correcting mistakes made by students. Students in the
student-centered discussion displayed higher mean scores for all examinations as
compared to the instructor-centered group. Students in this group also reported that this
26

type of classroom structure also forced them to assume more responsibility for their
learning as one student expressed, “...More responsibility is placed upon the student’s
shoulders to get the proper amount of information out of the course. It’s up to the student,
not the teacher, to get what he wants out of college.” Faw (1949) commented that
student’s perception of greater responsibility may have also caused them to seek
additional text materials in an attempt to find answers to some of the issues posed in class
and this may have been the cause for the higher test scores in this group.
! Critical elements of group work activities are that they involve cooperation and
collaboration among the students and the instructors. Vygotsky (1978) viewed
cooperation and collaboration as fundamental to effective teaching, stating that the
student can achieve more through collaboration than through independent work. Faculty
who are unfamiliar with collaborative styles of learning are frequently reluctant to try
new techniques for fear that they will lose control of the class and that they will not be
able to cover all the material without lecturing (Felder & Brent, 1996). Boice (2000) has
shown that faculty who adopt methods of pacing and openness have more control over
their classrooms and their students are less inclined to arrive late or talk out of turn. Large
class sizes are another reason why faculty are reluctant to incorporate group work into
their teaching; designing activities, organizing the groups, and managing the process take
time and skill, especially when it involves a large number of students. When faculty do
use group work in their teaching it is usually in upper-division courses, where the class
sizes are much smaller and easier to manage.
! While group work may be easier to manage in smaller class sizes, research has shown
that large class sizes can just as easily accommodate a variety group activities that result
in positive outcomes. Trempy, Skinner, and Siebold (2002) used a large, lecture
microbiology course to study the effects of having students work in teams to analyze
current global health issues. Students were assigned to the role of an expert that would be
involved with the problem. The outcome of this study, which was conducted over an 8-
year period, showed that 90% of the students had high retention rates of the material as
evident by assessment, and 97% of them attended all classes and meetings. Similarly,
27
Hake (1998) performed a study with over 6,000 students enrolled in physics, which
showed that that use of interactive engagement enhanced students’ problem solving
abilities. Lastly, Babb and Ross (2009) showed that student attendance and participation
in class actually increased when detailed lecture notes were provided prior to class.
Considering the often low attendance rate in many large lecture courses and students’
reluctance to participate in discussions, these studies provide encouraging results.
! The research literature discussing active engagement techniques reports results that
are overwhelmingly positive and favor incorporation of collaborative learning. However,
this type of research warrants consideration of several factors for proper interpretation of
results: the definitions of the techniques used, the research design employed, assessment
of outcomes, and the significance and magnitude of the results (Prince, 2004). Much of
the research literature uses a variety of terms to describe techniques that are labeled as
“active engagement,” yet the term can mean different things. For example, the labels
“collaborative” and “cooperative” learning are often used synonymously, and while both
refer to students working together in small groups, cooperative learning implies that
students work on a shared goal but are assessed individually (Prince, 2004). The
outcomes for cooperative learning are that students learn to work together and not
competitively against one another. In contrast, collaborative learning involves students
working on a common goal with the focus of student interactions as the outcome and not
students working in isolation (Prince, 2004). Understanding specifically what techniques
the literature states are being examined is important for interpretation of results.
! Instructional techniques are multi-dimensional, and therefore can effect multiple
learning outcomes (Prince, 2004). Determining whether or not an active engagement
technique works depends on knowing all possible learning outcomes that may be
impacted, and many studies do not list this data. Additionally, some learning outcomes
may be difficult to measure, such as life-long learning (Prince, 2004). Life-long learning
would be impossible to measure in a study that was conducted over the course of a few
months or even a year. When the study outcomes include mixed results, this may be due
to the treatment or other external variables. Research designs that include control groups,
28
which do not receive the experimental instructional technique, are useful in comparing
the results. Lyon and Lagowski (2008) comparing the effects of using small learning
groups in a large, lecture chemistry course. The authors’ research design included a
control group of students who did not participant in the group learning. The reported
results included a comparison of the treatment versus the control group, with the
treatment group reporting a statistically higher level of achievement on exams than the
control group.
! Statistically significant results can be misleading, and data that includes effect sizes
can help the reader determine the magnitude of the treatment (Albanese, 2000; Prince,
2004). Effect sizes are generally reported in increments of .20, .50, and .80 with labels of
“small,” “medium,” and “large,” (Cohen, 1988). Albanese (2000) and Colliver (2000)
separately analyzed research studies done from 1993 to 1998 that used active learning
techniques and both reported that few of these studies had effect sizes of 0.80 or greater.
Colliver argued that effect sizes for active learning methods should exceed 0.80, based on
Benjamin Bloom’s (1984) study that the optimal instruction method was one-on-one
tutoring. In Bloom’s study, he compared tutoring to conventional teaching methods. His
results showed that the tutoring method was 2.0 standard deviations above the mean
when compared to the conventional method, and he reported an effect size of d=2.0
(Cohen, 1988). Bloom’s conclusion were that students in the tutoring group displayed a
high level of learning that most students could achieve, and that education research
involving active learning methods should be compared against the results seen in his
tutoring study.
! Based on Bloom’s recommendations, Colliver (2000) argued that any type of active
learning intervention would be expected to show a large effect size of d=.80. With
Bloom’s results as a reference standard, Colliver reasoned that an effect size of 1.0 would
be half as effective, which he states is “a reasonable level of effectiveness.” He
performed a review of the research and concluded that none of the literature reviewed
met Cohen’s (1988) “large” effect size of d=0.8, and that based on this standard of
measure, there is no convincing evidence that active learning techniques are effective. In
29
Albanese’s (2000) review, he counters with the argument that if effect sizes were set at a
minimum standard of d=.80 to be considered practical, over half of the research reported
in psychology, education, and a limited number of drug trials would be invalidated.
Albanese theorizes that the average effect size reported in the education literature is
around d=.50 and that many common medical procedures and therapies report effect sizes
below d=.50. He states that students are conditioned to the standard teaching methods
from a very early age and implementing active learning requires a “centralized
organizational structure” that is difficult to implement; with these barriers, students would
not be expected to do substantially better with an alternative form of instruction. He
concludes with the comment that as more research is done with active learning, it is likely
that higher scores will be realized.
! Simply placing students into groups does not mean that they will automatically
cooperate and collaborate, nor does it mean that their academic performance,
accountability, teamwork skills or motivation will increase. Students often initially resist
student-centered activities that force them to accept more responsibility for their own
learning (Felder and Brent, 1996; Woods, 1994). Woods has stated that some students
may even go through psychological stages that are typically associated with grief and
trauma, as they try to adopt to a style of learning that puts more of the obligation on their
own efforts. Some of this resistance is due to the cultural context in which students are
raised during childhood. For example, middle-class children in the US are taught to make
simple observations when learning and to rely on their parents (or teachers) to provide
theoretical explanations for the event being observed (Eberbach & Crowley, 2009). Their
observations are influenced by their preconceptions or expectations of the situation rather
than any objective study (Stofer, 2013). Children learn to accept this “transmissionist”
style of learning where they are told the what, when, and how of everything they need to
know (Wood, 2009), and believe that this is the canonical method of education.
! Students in the US are also conditioned to learn in a competitive and individualistic
environment, which makes it difficult for them to readily accept alternative learning
styles (Trempy, Skinner, & Siebold, 2002). Activities from school sports to science fair
30
projects become opportunities for students to compete against their classmates and others.
In addition, students are frequently encouraged throughout grade school to high school to
work alone on homework assignments, which does not create situations for them to learn
to work collaboratively. Students readily believe that their chances of achieving success
are higher if they work independently (Johnson, Johnson, and Smith, 1998), contrary to
research that refutes this belief. Qin, Johnson, and Johnson (1995) performed a meta-
analysis of 46 studies done between 1929 and 1993, which compared the results of
cooperative and competitive learning methods employed in several problem solving
tasks. Their findings indicated that 87% of the studies reported results that students using
cooperative methods outperformed students using competitive methods, with the other
13% reporting that students using competitive methods were superior. The authors’
conclusion was that despite the diversity in quality and context of the studies, the overall
implications were that students in cooperative groups performed better at interacting with
one another, exchanging ideas, and identifying errors. These are beneficial skills, both in
the classroom and for future employment. No conclusions could be drawn as to the
longitudinal effects on students through the use of these practices. Finally, those students
who are strong introverts or high academic achievers are likely to be the most resistant to
cooperative and collaborative learning techniques (Felder & Brent, 1996).
! Persuading students to accept that group work activities are beneficial is a difficult
task. Change is difficult and people will go to great lengths to avoid altering their
thinking (Perkins & Simmons, 1988). Johnson, Johnson, and Smith (1998) have made
several recommendations for faculty to help students transition into a cooperative
learning style: creating mutual goals for group work to establish positive interdependence
among group members; holding all group members accountable for the assignment to
establish individual accountability; and outlining behaviors that define effective team
work skills. Felder and Brent (1996) suggest explaining to students that working in
groups will benefit them in their future careers, as many employers rank team work as
first or second of required skills. Felder and Brent also advocate for emphasizing to
31

students that the process of explaining a concept to someone else, in other words
assuming the role of a “teacher,” will help the “teacher” to master the content.
! The idea of students assuming roles as teachers was studied by Palincsar and Brown
(1984). They developed a method called, “reciprocal teaching,” to study how students
learn from textbooks. In this method, students and teachers traded roles of leading a
discussion around sections of a book using techniques that included creating summaries,
making predictions, and generating questions. The method is intended to simulate the
natural learning process that would occur between an expert and a novice, in home,
school, and work environments. This novice-expert situation is supported by Lev
Vygotsky’s Zone of Proximal Development (ZPD) (Daniels, Cole, & Wertsch, 2007).
ZPD describes the cognitive process between what an individual can do on their own and
what that person can do with help from others (e.g. in collaborative group work) or from
a more experience person. Several authors have suggested that ZPD is a negotiation
process between the expert and the novice, but Moll (1990) suggested that the change
that occurs within the ZPD should be on the communication that occurs via collaboration.
Daniels, Cole, and Wertsch corroborate this statement by stating that teaching should
include active participation that is socially negotiated.
! Palincsar and Brown (1984) hypothesized that these skills would allow students to
integrate their prior knowledge with new information from the text and to anticipate the
structure of new information. More importantly, students would be able to utilize these
skills in cooperative and collaborative contexts. In a series of studies that collected pre
and post test scores on comprehensive exams, and students’ dialogue in interviews, these
two authors showed that students improved significantly in comprehension, retention, and
transfer of information over time when reciprocal teaching methods were used in the
classroom (Daniels, Cole, & Wertsch, 2007).
! The professor is the front line advocate who can help students achieve success
(Bunce, 1993). Large lectures are a fact of today’s institutions and will continue to be a
solution to the rising student enrollments and increasing costs. Because the lecture format
does not often include elements of active engagement, there is a danger of encouraging
32
student disinterest and detachment. Abandoning lecture completely is not the answer to
this problem and the solution may be in finding ways to make lecture more meaningful
and interactive. Instructors often hold the misconception that they cannot influence
student interest or motivation. Deci & Ryan (2000) have shown that instructors who
adopt an autonomous orientation (instead of a control orientation) elicit greater intrinsic
motivation and self-regulation behaviors from students. Hidi & Renninger (2006) have
stated that interest can have a powerful influence on learning in terms of attention, goal
setting, and levels of achieved learning. From a pedagogical standpoint, interest and
motivation should be viewed as a desired outcome, not just an independent factor of
learning (Schibeci & Riley, 1986; Schiefele, 1991). Students are most often impressed
and influenced by an enthusiastic and passionate teacher who loves teaching and the
subject matter (Csikszentmihalyi, 1997).
Motivation in undergraduate education
“A student’s evaluation that old knowledge is insufficient, inaccurate, or not useful can be
a powerful motivator for acquiring new knowledge.” (Brophy 1987)
! Students choose to attend college for a variety of motivations. Their motivations
affect the subjects they study, how they learn, and how well they do academically
(Pintrich, 2003). For example, a student with a strong interest and love of science, spends
extra time studying concepts outside the course curriculum. This student seeks out
knowledge for the sake of learning, beyond what is being taught in the course. In
contrast, another student has little interest in the subject being taught, as this is just a
required course that he must pass, but he is concerned about achieving high grades in
order to be competitive for a professional program. This student focuses on learning the
material for the reward of earning a high grade in the course. These two students exhibit
two different types of motivation: intrinsic and extrinsic motivation. In terms of
psychological well-being, intrinsic motivation can elicit feelings of competence, self-
33
efficacy, and self-esteem, while extrinsic motivation can promote feelings of
discouragement and depression in learning activities (Bye, Pushkar, & Conway, 2007).
! Intrinsic motivations emerge from individuals’ (or students’) basic psychological
needs, such as the need for competence and self-determination (Deci, Koestner, & Ryan,
2001). These are goal orientation behaviors that students engage in as a result of their
own curiosity and are in alignment with their sense of self or identity (Deci, Vallerand,
Pelletier, & Ryan, 1991). Students freely participate in activities that are of interest, with
a full sense of purpose and without receipt of material rewards, coercion, or constraints
(Deci & Ryan, 2000). This type of motivation is optimum for learning, often results in
deep learning approaches and is best used in situations that promote mastery rather than
competition (Salinas, 2008). McKeachie (1990) outlined research that showed that
student-led discussions increased students’ intrinsic motivation to learn when compared
to courses that used instructor-centered discussions or lecture. McKeachie, Lin, Forrin,
and Teevan (1960) also showed that students’ could be intrinsically motivated by learning
situations outside of the classroom. For this study, students were assigned to small groups
that met with the instructor on a weekly basis. Students involved in these group meetings
were found to be more motivated to complete the coursework and to continue learning
the material after the course was over.
! Intrinsic motivation has been shown to have a close association with positive affect
(Bye, Pushkar, & Conway, 2007; Deci & Ryan, 2000). Csikszentmihalyi (1993) defines
completely focused motivation as “flow.” His theory states that a person experiencing
flow is so entirely immersed in an activity that her emotions are positive and focused to
the task being performed. An example of this is Csikszentmihalyi’s (1997) autotelic
person. This is an individual who is intrinsically motivated such that she is completely
immersed in the activity, maintains a sustained interest without expectations of rewards
and enters a feedback loop of learning, interest, and enjoyment. A person wanting to
become a good golf player who spends a considerable amount of time practicing simply
because he enjoys the sport is a good example of autotelic behavior. In this instant, a
person does the activity for the activity itself, with no external rewards.
34
! Csikszentmihalyi (1997) suggested that activities that require optimal challenge
promote intrinsically motivated behaviors, such as achievement mastery goals which are
an individual’s desire to perfect competence at a skill or activity (like the golf player in
the previous example). A study by Harackiewicz and Elliot (1993) randomly selected
students at a university and placed them into an experimental and a control group.
Students were initially assessed for their achievement attitudes using an achievement
personality instrument. The experimental group was given the task of playing a pinball or
a puzzle game and told that their goal was to achieve performance (i.e. achieve a specific
outcome) or mastery (i.e. learning and being better at the task) versus the control group
who was not given any instructions. The results showed that university students who
adopted achievement mastery goals were more intrinsically motivated than the group
who adopted performance goals or the control group who did not adopt any goals for the
same task.
! Extrinsic motivation, in contrast, is defined as goal orientation behaviors that students
engage in as a result of anticipated rewards inherent to the activity, such as earning a high
grade in the course or receiving extra credit (Deci & Ryan, 2000). Students competing for
an award in a science fair competition would be an example of an extrinsically motivated
behavior; students are motivated to win the competition for the award and not necessarily
because they are interested in the project for the sake of project. Smith, Gould, and Jones
(2004) performed a survey of over 500 students enrolled in introductory biology and
physics courses and were asked to state their reasons for taking these courses. The
students, who were largely non-science majors, responded most often that these courses
were required for their degree or employment, or that they wanted to get a good job after
college. All reasons that seem to be driven by extrinsic motivation. Relatively few
students gave responses that could be deemed intrinsically motivated, such as taking the
course to learn more about science or the world and to become a better citizen. Research
like this that provides support for increasing students’ intrinsic motivation is favored by
organizations such as the National Academy of Science and the American Association for
35
the Advancement of Science, which both stress the importance of intrinsic motivation in
learning science.
! Deci & Ryan (2000) outline four types of extrinsic motivation based on the construct
of internalization. The four types of extrinsic motivation are: external, introjected,
identified, and integrated (Deci, Vallerand, Pelletier, & Ryan, 1991). The four types of
extrinsic motivation occur on a continuum of causality from least self-determined to most
self-determined (Deci & Ryan, 2000). Based on self-determination theory, internalization
is an energetic process by which individuals will internalize the regulation of
uninteresting tasks such that they are incorporated both personally and socially (Deci, et
al., 1991). Thus, external regulation is the least self-determined type of extrinsic
motivation and results from outside circumstances. An externally regulated student is
motivated by either rewards or punishment. Introjected regulation is somewhat self-
determined, but is still not completely integrated and often results from internal guilt and
self-depreciating thoughts. Identified regulation is somewhat internally self-determined,
such that the individual will feel more responsibility and autonomy for the behavior. A
student that is motived by identified regulation will view the behavior as useful and
necessary for success, not because it is fun or interesting. Integration regulation is the
most self-determined with a high level of internalization and autonomous behavior. A
student who exhibits integrated regulation is motivated by the fact that the activity is
important for a valued outcome, again, not because the student is overly interested (Deci
& Ryan, 2000).
!
Identity in undergraduate education
“We understand identity to refer to one’s understanding of herself in relation to both her
past and potential future. Identity refers to ways in which one participates in the world
and the ways in which others interpret that participation.” (Lave & Wenger, 1991)
! The word “identity” is a fairly new term, appearing in the social-science literature
during the 1950’s (Gleason, 1983). Early reference works like Seligman and Johnson’s
36

Encyclopaedia of the Social Sciences (1935) did not mention the concept of identity
related to personal development. The authors included a chapter entitled, “identification,”
but it discussed techniques of criminal investigations like fingerprinting. These
techniques all involved physical characteristics of the individual, characteristics which
are often genetically pre-determined. Subsequent volumes of this work published almost
thirty years later, renamed as the International Encyclopedia of the Social Sciences,
included lengthy chapters on the psychosocial aspects of identity (Sills and Merton,
1968). Prior to these works, noted philosopher Immanuel Kant (1724 - 1804) described
an individual’s sense of self to be composed of two parts. The first part is a transcendental
ego, that portion of a person’s self that exists beyond human thought and perception, and
precedes any type of experiences. This could be thought of as an inner-self or the “I,”
meaning that someone who doubts his existence, is by that very nature providing
evidence of the self. The second part of an individual’s self is an empirical ego. This is
the outer-self or the “me,” which encompasses all characteristics that a person sees within
herself upon introspection, and that others see about that person.
! William James (1890), a pioneering psychologist, gave meaning to the idea that
individuals possess an identity and continued with Kant’s view of an “I” and a “me,” by
viewing self as the “known-self,” and the “self-as-knower” (Falk, 2009). James felt that a
person’s emotions about objects, thoughts, or people and the social interactions that
occurred as a result, were what defined the self from non-self. Because people have
multiple interactions with others and hold multiple roles within society, for example self
as a mother, self as a teacher, self as a student, James’ referred to these as ‘multiple
selves” (Burke & Stets, 2009). James was the first to recognize that people have multiple
identities and that these identities are related to the interactions within society. Mead
(1934) echoed James’ definition by stating that the self develops out of social experiences
over a person’s life and the life experiences that an individual has with others results in
the development of multiple selves within that person. In Mead’s view, these multiple
selves could co-exist even if they were conflicting identities (e.g. being religious and
being pro-choice).
37

! Erik Erikson’s work on the stages of human development and his use of the
expression, identity crises, put the term identity into popular usage among psychologists
and social scientists in the 1950’s (Gleason, 1983). Thus, much of the early empirical
research done on identity revolved around Erikson’s (1950, 1968) stages of identity
development. These studies using Erikson’s framework have focused on the
psychological and developmental aspects of an individual rather than a sociological
perspective. These early studies of identity were referred to as “personality growth,” and
“stabilization of ego identity,” and “resolution of identity crises,” and often focused on
change between the classes (e.g. freshman to senior year) with either no predictions about
the nature of the change expected or with predictions that did not have a theoretical basis.
(Feldman, 1972). For example, Beach (1966) studied students at a religious based college
to determine students’ change in maturity and personality from freshman to senior year.
This study used the psychometric instrument, the Omnibus Personality Inventory (OPI) to
measure students on four scales: developmental status, impulse expression, social
maturity, and schizoid functioning and found that students’ patterns of change occur
within the first two years of college. Beach’s study predictions were based on similar
studies done on college students and his results did not take into account the social
aspects and experiences of college that might have influenced students’ developmental
changes.
! In a much earlier study, Bugelski and Lester (1940) studied attitude changes in
liberality of college students from freshman year to post-graduation, comparing attitudes
to class status, intelligence and major. Bugelski and Lester stated that attitudinal change
was statistically significant, but uncorrelated with these factors. They viewed the changes
among the students from a purely psychological standpoint, without a theoretical
framework, but based his predictions on similar research studies. Despite the lack of a
theoretical framework, Bugelski and Lester’s work did contribute to an aspect of
attitudinal research that was lacking at that time: longitudinal studies. Studies done in the
early 1930’s on college students probed student attitudes on a variety of topics, but
relatively few of these studies followed the same participants over a course of time.
38
Bugelski and Lester studied a group of 200 students over the course of their freshman to
senior year, in addition to selecting a representative sample of these students 2 and 3
years post graduation.
! Early identity studies focused on the characteristics of the individual from a
behaviorist viewpoint (e.g. ring the bell, drool, eat aka Skinner, 1938) and many centered
around gender differences. It was not until the late-1980’s that studies emerged focusing
on the psychosocial changes of identity achievement with the college experience. Many
of these studies utilized Marcia’s (1980) identity status model as a framework. Marica’s
model was an extension of Erickson's (1950) theory and saw two tasks to defining
identity: crises as a stimulus and as a commitment (making choices about direction,
goals, future, etc..). Marcia categorized individuals in a dichotomous fashion as either
being or not being in one of four categories: “foreclosure,” “diffusion,” “moratorium,” or
“achievement.” In a foreclosure state, an individual has made the commitments to goals
and beliefs, but has not undergone the crises element. In a diffusion state, an individual
has not yet experienced a crisis or made personal commitments to future goals and
beliefs. The moratorium state defines an identity crises, the individual is in a state of
crises and is struggling to define a personal identity. The last stage, achievement, the
individual has both undergone the crisis and resolved the identity.
! Pascarella and Terenzini (2005) reviewed several studies that used Marcia’s model
and found 13 studies that indicated students’ experienced identity achievement with
increased college attendance. One of those studies by Baxter Magolda (2000) follows
students eight years past their college graduation. The study results showed that students
continued to ask such questions as, “Who am I?” and “How do I know?” post-college,
that are reflective of the developmental changes that occur as students navigate their path
through college. Her conclusions were that the complex interactions of psychosocial
development are due to the relationships that students have in college with others and
with themselves, and that these effects may persist beyond the college years. In another
study, Josselson (1996) used both Marcia and Erickson’s theories as a framework to
follow students from college into their 40’s. She found that students in college moved
39
along four identity paths and that their identity did not remain fixed. Those students who
made some level of commitment to an identity while they were in college, had positive
identity resolution experiences later in life. She also found that regardless of the identity
that students had, they achieved it through a combination of competence and connections
with others.
! Few identity achievement studies in the late 1980’s focused on the relationships
between the college experience and academic outcomes such as grade point average
(GPA) and Scholastic Achievement Test (SAT) scores. Studies such as Berzonsky’s
(1985) examined the relationship between academic differences among 98 college
freshmen with Marcia’s (1980) four identity categories. He found that students with high
GPA’s were more likely to be in the diffusion category, while students with low GPA’s
were more likely to be in the foreclosure category, contradicting Marcia’s predictions that
adolescents have better adaption styles if they have achieved some measure of an identity
status. Berzonsky’s study also revealed a problem with measuring identity as contrasting
categories: one category identified too few participants for statistical analysis to be
performed. White and Hood’s (1989) study measured identity on a continuum using
Chickering’s (1969) theory of college student development as a framework. They found
that self-reported academic achievement was positively correlated with self-confidence
and sexual identity. Lastly, Lounsbury, Huffstetler, Leong, and Gibson (2005), also used
Chickering’s theory as a framework to assess over 400 college students on their sense of
identity and GPA. Results of this study showed a positive correlation between students’
sense of identity and GPA, and that identity uniquely contributes to GPA predictions over
other personality traits (e.g. emotional stability or extraversion). The authors speculate
that formation of students’ identities may be positively correlated with retention in
college and that this warrants further study.
! Similar to Chickering’s (1969) system of seven vectors interacting in the development
of a college students’ identity, James Gee (2000) views identity as requiring some type of
mechanism that supports the formation of a particular identity. Gee views identity as a
system of four constructs that he terms, “nature-identity,” “institution-identity,”
40
“discourse-identity,” and “affinity-identity.” Gee defines these as: an individual’s
historical and cultural views of nature; the institution’s rules and traditions; the discourse
and dialogue that an individual has with others; and the groups to which an individual
belongs (“affinity groups”). He states that any identity trait can be viewed from the
perspective of one of these four definitions and that an individual can modulate the same
identity in different ways through this system.
! Gee (2000) suggests that education can use these four lenses to view research on
identity. His nature-identity defines that aspect of an individual’s identity which has
historical or cultural context, like having brown eyes or being tall. The institution-identity
derives power from authorities who assign a particular label to an individual. These are
more likely to be professional labels, such as nurse or teacher, but they can be other
labels, such as aunt, friend, or neighbor. The discourse-identity describes an individual’s
traits, like being charismatic, loyal, or authoritative. These identities often emerge in
social contexts and interactions with others. Lastly, the affinity-identity can name an
individual to membership in particular groups, like a rowing club, a book club, or a fan
club for a rock group. Unlike Marcia’s (1980) divergent categories of identity, Gee’s
categories can all be applied to the same identity trait. As an example, an individual who
is an identical twin could be considered as having a nature-identity; this developed at
birth as a result of being a twin. This same individual could also be recognized as an
institution-identity where society views this person as being an identical twin. The
expectation for this identity is that the person dresses the same as their twin, talks the
same, behaves the same, etc... This same individual could have a discourse-identity of
being a twin, as a result of interactions with others. Classmates and friends may find it
difficult to distinguish this individual from their twin, even when they have known that
person for a period of time. The last identity, affinity-identity, can also be applied to this
individual if he joins a society or club specifically for identical twins.
! Considering James’ (1890) and Mead’s (1934) views that a person has multiple
identities, an approach to identity that considers an individual’s multiple identities from a
variety of perspectives, and that respond interpersonally and intrapersonally, allows for a
41

more comprehensive view of the variables that can effect development. Studies of the
past which have viewed identity from a purely biological perspective, might produce
different results when that same identity is viewed from an affinity or institutional
identity perspective. Likewise, studies that have measured identity within rigid categories
may have failed to achieve significant data because the identity was not considered in the
correct context. Research on identity in college students would benefit from multiple
angles that can account for the vast array of experiences that college affords.
College student development
“When a college commits to a student development framework as a guide for practice in
and out of the classroom, it is newsworthy.” (Chickering & Reisser, 1993)
! The transition from high school to college typically occurs during late adolescence
(e.g. ages 18-22 years), a time period that has been designated as critical to identity
development (Lounsbury, Huffstetler, Leong & Gibson, 2005). Arnett (2000) has named
this time period, “emerging adulthood,” to describe the fact that people in this age range
do not view themselves as either adolescents or adults. They delay the common
responsibilities of adulthood like marriage, employment and settling down. Erikson
(1968) and Margaret Mead (1961) had previously described this age period as an identity
moratorium, where individuals can test many roles before making commitments. Erikson
also viewed identity as being contextually constructed by a person’s social situations.
From this perspective, college offers a variety of opportunities that allow students to
develop both personal and professional identities. College experiences such as living on
campus, choosing a major, taking classes, and participating in campus organizations
present both social situations and chances to try different roles, any of which can
contribute to the development of a student’s identity.
! Students entering college believe that they will have more freedom and that university
classrooms will be less restrictive than high school (Byrne & Flood, 2005). Attending
42
college is certainly a voluntary act and affords many liberties, but students do not realize
they must also assume personal responsibility for their success and are often not prepared
for the high-school-to-college transition. Students must cope with the differences in
teaching methods of introductory college courses compared to their previous experiences
in high school; they often do not realize that failure in college is an option, and they do
not see a need to take ownership of the course material (Willcoxson, Cotter, & Joy, 2011;
Wood, 2009). As a result, students are often unprepared to handle the format and
demands of undergraduate coursework, which can lead to decreased interest in school and
motivation to learn (Seymour & Hewitt, 1997; Callele & Makaroff, 2006).
! Much of the research on student development in the last decade has centered on
retention of students in college and students’ sense of belonging. Tinto’s (1993) model for
predicting student dropout rates has centered the cause around a lack of student
integration into the academic process and social systems of college. Fischer (2007) has
stated that this process is mostly a function of the experiences, opportunities, and
interactions that students have while in college. Fischer states that students who do not
have positive experiences or adequate interactions to help them navigate the academic
process are likely to rethink their initial goals and values for attending college. McDaniel
and Graham (2001) study on students attending a historically Black college has placed
importance on the value of pre-matriculation programs, such as engagement experiences
that introduce students to faculty and college life prior to the first term of classes.
Fischer’s views and that of Tinto’s mirror Arthur Chickering’s (1969) seven
developmental vectors that students progress through in the process of identity
development.
! The emergence of Chickering’s (1969; 1993) views on education and identity were a
radical shift from the previous studies in college student development. Chickering’s work
focused on student’s personal values, ways of thinking, and experiences that students
encounter over the course of attending college. This research shifted the focus from
student development as a result of the individual to student development as a result of the
environment. However, Chickering’s views were not well received as the university was
43
considered a place for students to acquire skills and behaviors that would lead them to
find suitable employment and a satisfying life. The function of the university was not to
counsel or parent students, thus issues like self-esteem, developing relationships,
managing emotions were not believed to contribute to student development (Chickering
& Reisser, 1993).
! The research on student development as the result of the college environment has
included the hypothesis that there is a relationship between the aspects of school and
work (Bean, 1980; Lounsbury, Saudargas, and Gibson, 2004). Bean’s work has used
models of employee turnover as a foundational basis for viewing students’ attitudes and
behaviors as a cause for attrition. Students enter into the university with certain
expectations and beliefs that are either supported or denied through social interactions
with others on campus. These experiences help students develop attitudes and behaviors
that influence their decisions about attending college (Fischer, 2007). While research on
student departure from college is an emerging topic, several other disciplines such as
finance, economics, and industrial psychology have done studies in support of this idea.
! Lounsbury, Saudargas, and Gibson (2004) study on students’ intention to withdraw
focuses on the relationship of student attrition with certain personality traits. The
authors’ use the Big Five Model of personality traits: openness, conscientiousness,
extraversion, agreeableness, neuroticism (Tupes & Christal, 1993). Tupes and Christal
originally developed the model in 1961 as part of a military assessment to determine
future job performance. In addition, Lounsbury, Saudargas, and Gibson added seven traits
that they viewed as more narrow in scope than the Big Five and that they state as having
been used in numerous studies in academic settings. These narrow traits include:
aggression, career-decision, optimism, self-directed learning, sense of identity, tough-
mindedness, and work drive. The authors’ view these traits as important because they are
variables that students bring with them to college that influence their student development
and persistence in college.
! In their study, Lounsbury, Saudargas, and Gibson (2004) examined the relationships
between these twelve traits as predictors of college withdrawal and attempted to identify
44

which traits had the most influence on students’ intention to withdraw. Their results
showed that all the traits were significantly related to students’ intention to withdraw,
except tough-mindedness and openness. Those traits which had the most influence on
students’ attitudes and behaviors were emotional stability, work drive, and sense of
identity. Their conclusions were that these results were consistent with the findings of
Tinto (1993) and others who indicated that factors such as isolation and adjustment to
college are the primary reasons why students drop out of college. An implication of this
study is that personality traits could be used to accept or reject students into college.
While this seems unethical and problematic, many companies in industry already profile
candidates during job interviews, using processes that are in compliance with guidelines
set by the Equal Employment Opportunity Act of the U.S. Department of Labor, and
certain traits have been found to be significantly related to job performance (see
Lounsbury, Saudargas, and Gibson, 2004). The admissions process of all institutions use
a variety of measures such as personal essays, recommendation letters, resumes, and
academic transcripts that serve to make predictions about applicants traits and abilities.
Personality measures may be more equitable to all students than using standardized test
scores that measure only cognitive ability, as personality traits have been found to be
independent of measures of intelligence (Saklofske & Zeidner, 1995). Many have cited
the unfairness of standardized tests with underrepresented students and the use of
personality assessments may be a more objective measure that leads to an increase in the
diversity of students admitted into college.
!
45
CHAPTER 3
METHODS
! This study investigates the effects of active engagement strategies in a large, lecture
science course on students’ science identity formation and motivation as a mixed-
methods study, through the use of a demographic questionnaire, a survey, and individual
semi-structured interviews. Participants were enrolled in one of two undergraduate core-
curriculum physical science courses at a large public university in the Pacific Northwest
and were asked to complete a 20-question demographic questionnaire at the start of Fall
Term 2012. Participants were also asked to complete a 30-item motivation questionnaire
and a 13-item science identity questionnaire during weeks 1, 5 and 8 of the term, to be
used for pre-mid-post analysis. Individual interviews were obtained from a selected group
of participants over the course of the term. In one section of one of the courses, active
learning strategies were employed during lecture. In the other sections of this course and
in the comparison control course, the typical lecture methods were used.
Study Site
! The study site was a public research university in the western United States with
approximately 21,800 undergraduate students. The study obtained data from students
enrolled in one of two general chemistry courses during Fall Term 2012. The CH10x
course was the first course of a general chemistry three-sequence series for non-science
majors and the CH20x course was the first course of a general chemistry two-sequence
series for engineering majors. These chemistry courses at this university were appropriate
study sites for studying science identity in college students, as the courses were part of
the core physical science requirement for bachelor degree seeking students; they were
generally taken by a majority of freshmen in their first year of study; they were high
enrollment; and they were taught in a large, lecture format. Both series were designed as
freshmen entry-level courses and were taught by several instructors within the
university’s chemistry department. Average enrollment during fall term was
46
approximately 3000 students for both series combined and that number declines by about
500 students for the winter term. This university had a limited number of large
auditoriums and as such the classes were offered several times per day for each series
with the average class size at approximately 200 students per section of a course.
! For the CH10x course sections, lectures were given by one of two instructors, 50-
minutes in length, and held three times per week (Monday, Wednesday, Friday). The
CH10x had an accompanying 50-minute recitation held twice a week, that was moderated
by graduate teaching assistants. Lectures for the CH20x course sections were all given by
the same instructor, held twice a week (Tuesday and Thursday) for 1 hour and 20 minutes
total, and in the same auditorium as for the CH10x course sections. Attendance was not
mandatory, nor monitored in either course.
! The instructors for these courses had either a masters or a PhD degree in
chemistry. There were two female instructors for the CH10x course. The lead CH10x
instructor had a masters degree in chemistry and had been teaching the course series
at this university for 3 years and was responsible for administering the experimental
treatment. The other CH10x instructor had a PhD in biochemistry with 3-4 years
experience teaching organic and biochemistry. She was hired just prior to the start of
Fall Term 2012. The CH20x instructor was male and had been teaching the course
series at this university for 15 years.
! The typical curriculum design of the CH10x and CH20x courses was that the courses
use similar textbooks (by the same publisher), employ an online homework system, allow
students the use of a 3x5 index card of notes on exams, and administer multiple-choice
(via scantron bubble forms) and short-answer essay questions on exams. The online
homework system, Mastering Chemistry, was designed by Pearson Publishing (2012) and
was tailored to the specific textbook. The Mastering Chemistry software had an advisory
board of science educators and science professionals that met regularly to make
improvements to the system. The online homework system contained online practice
quizzes, generates weekly homework assignments with hints, virtual lectures, interactive
videos and provides an electronic copy of the text. All students in both courses were
47

required to purchase a copy of the textbook (hardcopy or electronic text) and a Mastering
Chemistry access code. Students were given suggestions for extra textbook problems to
practice as homework. All students in both courses had access to the chemistry
department’s open office hours. The open office hours were held in the university library
and were staffed by the chemistry teaching assistants, 11 hours per day, 6 days per week.
Participants
! The participants in this study were undergraduates enrolled in one of the following
general chemistry courses: General Chemistry (CH10x) or General Chemistry for
Engineers (CH20x) and were a sample of convenience. All students, ages 18 and over,
that were enrolled in one of the two courses were given the same opportunity to
participant in this research project and these participants represented a volunteer sample
from these two courses. For participating in this study, all volunteers were awarded up to
10 points extra credit for each section of the study completed which was applied to their
final number of points earned in their respective course. Because I did not know how
many students would volunteer to participate, and enrollment in each of the chemistry
courses was large, I set an upper limit of 3,000 participants for this study. I chose students
enrolled in the chemistry courses at this public university as my sample population,
because a majority of the students in these courses were first year college students and
between the ages of 18-25 years. This age range represents a key transformational point
in adolescence known as “emerging adulthood” and Arnett (2000) has shown that
emerging adulthood is a culturally constructed phenomenon that can make the transition
to college even more difficult as students are actively modifying and developing their
identities.
! There were some expected key similarities and differences between the
CH10x and CH20x students. The similarities were that both courses should contain
mostly first-year undergraduates, ages 18-25 years. Since both courses were designed
to be first-year, undergraduate, core-curriculum courses, most of the students in these
two courses were assumed to be first-year college students of the typical age range.
48

The gender grouping and level of science identity were expected to show differences
among the two courses. The demographics and science identity questionnaires were
given at the start of the study to assess differences and validate my assumptions
about those differences.
! The CH20x group was expected to contain mostly male students with
moderate to strongly developed science identities and the CH10x group was expected
to be mostly female students, with varying levels of emerging science identities. The
CH20x course was designed for students with a declared major in engineering. I
expected a majority of the students in this course to be male, as the demographics for
this university’s college of engineering, as well as national demographics for this
discipline, were historically largely male. I also hypothesized that because the
students in this course had a declared major in engineering, most of the students
would have a fairly well developed science identity. In contrast, the CH10x group
would be largely female, which was representative of the percentage gender
differences for all freshman enrolled at this public university. I also expected the
students in this course to have low to moderate science identities, because this course
was advertised to be for undeclared and non-science majors and was historically
populated by students with a variety of majors, undeclared majors and interests.
Data collection
! Data collection for this study included an online demographic questionnaire, an
online survey (consisting of two instruments presented together) given at weeks 1, 5 and
8 of the 10 week term, and individual, semi-structured open-ended interviews (See Figure
3.1). To encourage truthful responses to the questionnaire, survey, and the interviews,
students were assured that their responses would remain confidential. Students were told
that their instructors would not have access to their responses; that their participation,
refusal to participate or withdrawal from the study would not impact their grade; and that
they would not be graded on their responses.
! Prior to the first day of class during Fall Term 2012, I sent out an email announcing
49
the study and its purpose. On the first day of each class section, I presented a short
introduction to invite students to participate in the study and to explain the purpose of the
research. I also informed students of the links for the online demographic questionnaire
and the first instrument survey. The demographic questionnaire and the first online survey
was made available via Survey MonkeyTM to all students enrolled in the CH10x and
CH20x during Fall Term 2012. Survey announcements were posted to the BlackboardTM
course website. Follow up emails were sent to all students in the courses via
BlackboardTM at the end of the first week and during the middle of the second week of
classes. The online survey closed at the end of the second week of classes. The online
survey was again opened at approximately week 5 and the end of week 8 of Fall Term
2012. In each case, follow up emails were sent out via BlackboardTM to all students to
remind them of the survey availability.
! The online demographic questionnaire (see Appendix A) and the survey were
designed with a short introduction that included the informed consent form for
participation. If the student did not agree to consent, the questionnaire or survey would
end and show a short message thanking the participant. If the student agreed to consent,
then the questionnaire or survey would begin. Each survey was presented without the title
and had a short introduction of instructions, all of which included a statement indicating
that there are no right or wrong answers. To keep the online responses anonymous,
individuals were asked at the beginning of either the questionnaire or the survey for the
last four digits of their student identification number. For the survey, the participants were
presented with two instruments (see Appendices B and C): the Chemistry Motivation
Questionnaire (Glynn & Koballa, Jr., 2006), and the Science Identity
Questionnaire.!
! Individual, semi-structured interviews were taken over the course of Fall Term 2012
and Winter Term 2013. All students enrolled in the study were offered the same
opportunity to participate in the interviews. No additional extra credit compensation was
given for the interviews. Students were placed into categories (low, low-moderate,
moderate, and high) based on their responses to the Science Identity Questionnaire and
50
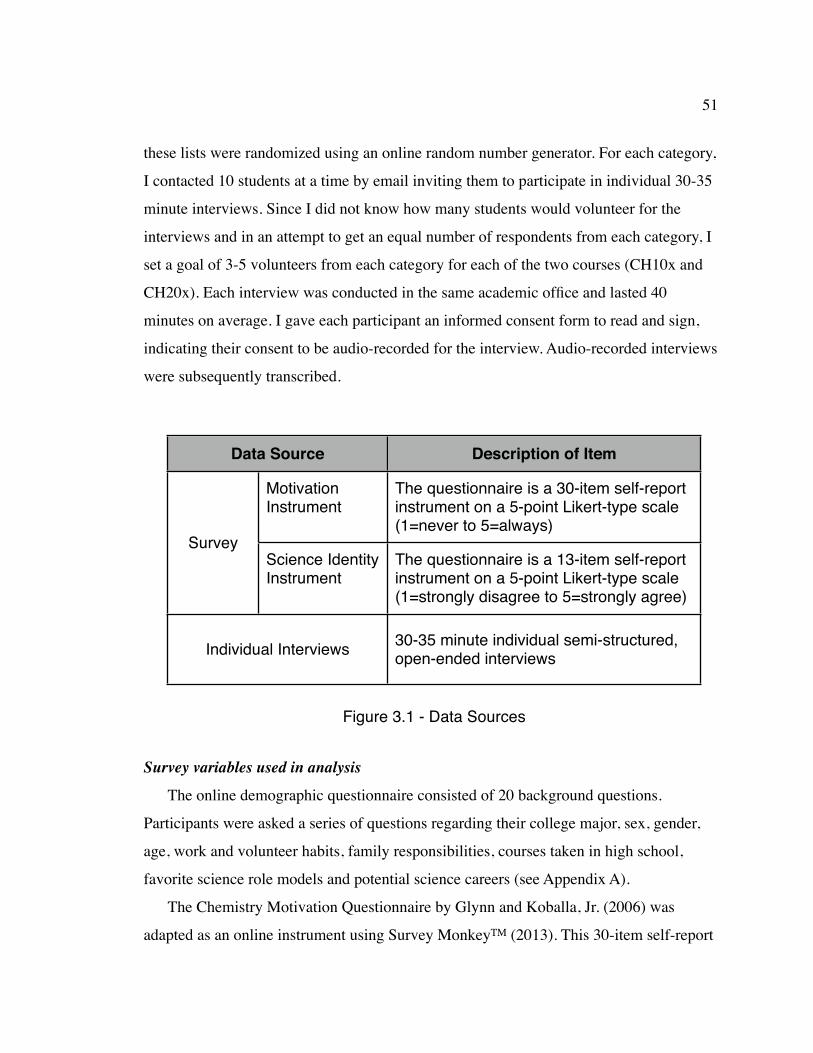
these lists were randomized using an online random number generator. For each category,
I contacted 10 students at a time by email inviting them to participate in individual 30-35
minute interviews. Since I did not know how many students would volunteer for the
interviews and in an attempt to get an equal number of respondents from each category, I
set a goal of 3-5 volunteers from each category for each of the two courses (CH10x and
CH20x). Each interview was conducted in the same academic office and lasted 40
minutes on average. I gave each participant an informed consent form to read and sign,
indicating their consent to be audio-recorded for the interview. Audio-recorded interviews
were subsequently transcribed.
!
Survey variables used in analysis
! The online demographic questionnaire consisted of 20 background questions.
Participants were asked a series of questions regarding their college major, sex, gender,
age, work and volunteer habits, family responsibilities, courses taken in high school,
favorite science role models and potential science careers (see Appendix A).
! The Chemistry Motivation Questionnaire by Glynn and Koballa, Jr. (2006) was
adapted as an online instrument using Survey MonkeyTM (2013). This 30-item self-report
51
Data Source Description of Item
Survey
Motivation Instrument
The questionnaire is a 30-item self-report instrument on a 5-point Likert-type scale(1=never to 5=always)
Science Identity Instrument
The questionnaire is a 13-item self-report instrument on a 5-point Likert-type scale (1=strongly disagree to 5=strongly agree)
Individual Interviews 30-35 minute individual semi-structured, open-ended interviews
Figure 3.1 - Data Sources

instrument measured motivation on a 5-point Likert-type scale (1=never to 5=always)
(see Appendix B). A sixth option was given as “skip/don’t answer,” that was included as
missing data in the final analysis. This questionnaire was designed and validated for use
with undergraduates to determine their motivation to learn chemistry (Glynn,
Taasoobshirazi, & Brickman, 2007; 2009). Poor motivation has been shown to lead to
low academic achievement (Deci, Vallerand, Pelletier, & Ryan, 1991), but group work
has been shown to improve student attitudes and increase academic performance and
retention in college (Crouch & Mazur, 2001; Hake, 1998). Ideally, students doing the
group engagement work would show an increase in their motivation to do chemistry over
the length of the course, as compared to the students in the control groups.
! Constructs outlined in the paper by Glynn, Taasoobshirazi, and Brickman (2007;
2009) as motivational components were used in this study. These components consisted
of factors of items from the 30-item questionnaire that identified motivational constructs
discussed in the self-regulation learning literature (Druger, 1998; Parjares, 2008;
Zimmerman & Schunk, 2008) and included: intrinsic motivation, extrinsic motivation,
self-efficacy, and self-determination, goal orientation, and anxiety about chemistry
(Glynn & Koballa, Jr., 2006). Glynn et al. (2007) tested the questionnaire with 980
students who were non-science majors and measured reliability (internal consistency) of
the students’ scores that produced a Cronbach’s alpha of 0.91; they also showed a strong
significant correlation between the science preparation a student received in high school
and their assessed motivation for future learning.
! I designed the science identity questionnaire based on the identity literature utilizing a
conceptual framework that situates identity as both individually and socially constructed
(see Appendix C). As a basis for framing the questions, I relied on work from researchers
in sociology and psychology, in particular the work of Reitzes and Burke (1980);
Kaufman and Feldman (2004); and Lounsbury, Huffstetler, Leong, and Gibson (2005),
who focused on identity development in college students. Reitzes and Burke used identity
theory to investigate how the role of being a college student, in addition to counter roles
that students interact with, influenced identity. Kaufman and Feldman used a symbolic
52

interactionist framework to describe how three components of a person’s identity (self-
concept, presented self, and recognition by others) interact within the context of the
social environment of college to affect development of student identity. Lounsbury, et al.
conceptualized students’ identity development through Chickering and Reisser’s (1993)
College Student Development theory using its seven vectors to view identity as a
continuum from low to high. Using this literature as a guide, I structured the instrument
questions to include identity topics related to student’s learning in the classroom: a sense
of community and belonging in science, goal orientation towards learning science topics,
and educational situations and leisure activities related to doing science.
! Lastly, I integrated concepts from Carlone and Johnson’s (2007) study as a means to
focus the questionnaire items specifically on science identity. In their study, Carlone and
Johnson investigated students in professional science programs and profiled a science
identity as consisting of three components: recognition of self as a “science person” (by
self and others), performance related to this identity, and competence (belief) their ability
to function as a science person. These three components tied closely with Kaufman and
Feldman’s (2004) symbolic interactionist viewpoint that development of a person’s
identity is a constant exchange between a person’s felt-identity, a person’s presentation of
her identity to others, and the identity that others attribute to this person. Kaufman and
Feldman’s model reflects Carlone and Johnson’s model in that these descriptive
components can be subsumed into three elements of identity: recognition, competence,
and performance. Because both Carlone and Johnson, and Kaufman and Feldman view
these components of identity to be inter-related, I structured the science identity
questionnaire to contain the three elements of performance, competence, and recognition.
I viewed these dimensions as overlapping and not functioning in isolation.
! As quantitative survey data can be limited in both the ability to detect interactions and
be subject to response bias, I developed a semi-structured, open-ended interview protocol
(See Appendix D) to analyze the data in conjunction with the survey data. The interview
protocol was pre-tested in August, 2012 and consisted of a series of 12 questions
developed from a conceptual framework based on the work by Gogolin and Swartz
53
(1992) who showed that student beliefs and perceptions, in addition to educational
environments (home, school and peer-group) were important in developing positive
attitudes towards science. The interview questions covered 5 subject areas (in order):
leisure and hobby activities, K12 school interests, perceptions of science (past and
present), future goals, and current classroom experiences. These subject areas were used
as an opportunity for students to talk about their childhood science experiences and how
they contributed (or not) to their development of interest in science.
! In developing this protocol, I employed a context-embedded approach similar to
methods used by Glynn, Taasoobshirazi, & Brickman (2007) and by Gogolin & Swartz
(1992) in developing their respective quantitative instruments. I aligned and expanded on
on the themes presented in the Science Identity Questionnaire (see Appendix C) to
investigate students’ prior family and educational environments, beliefs about science,
and thoughts concerning their chemistry lecture classroom. These qualitative interviews
provided students with an opportunity to reflect upon and express their thoughts about
science, their experiences with science both now and from their childhood, and their
experiences in the chemistry courses in much richer detail than could be represented in a
quantitative instrument. I compared these narratives with the student responses on the
science identity questionnaire to capture example quotes of low, moderate and high
science identities.
RESEARCH DESIGN
! In this research study, I used a pretest-posttest control group design (Campbell &
Stanley, 1963) to compare the differences between the pre-test to post-test online survey
results for both the CH10x experimental group, the CH10x control group, and the CH20x
positive science identity control group (see Figure 3.2).
54
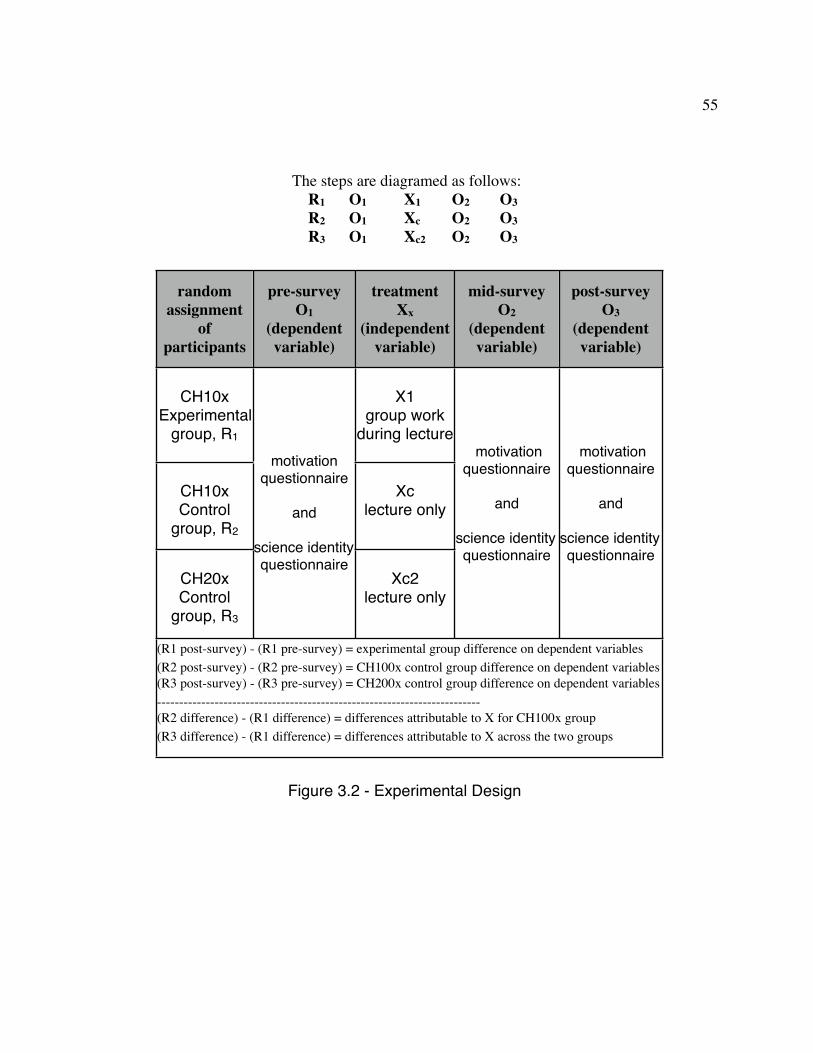
55
Figure 3.2 - Experimental Design
The steps are diagramed as follows:! R1 O1! X1! O2! O3! R2 O1! Xc! O2! O3! R3 O1! Xc2! O2! O3
random assignment
of participants
pre-surveyO1
(dependent variable)
treatmentXx
(independent variable)
mid-surveyO2
(dependent variable)
post-surveyO3
(dependent variable)
CH10x Experimental
group, R1
motivation questionnaire
and
science identity questionnaire
X1group work
during lecture motivation
questionnaire
and
science identity questionnaire
motivation questionnaire
and
science identity questionnaire
CH10x Control
group, R2
Xc lecture only
CH20x Control
group, R3
Xc2lecture only
(R1 post-survey) - (R1 pre-survey) = experimental group difference on dependent variables(R2 post-survey) - (R2 pre-survey) = CH100x control group difference on dependent variables(R3 post-survey) - (R3 pre-survey) = CH200x control group difference on dependent variables-------------------------------------------------------------------------(R2 difference) - (R1 difference) = differences attributable to X for CH100x group(R3 difference) - (R1 difference) = differences attributable to X across the two groups
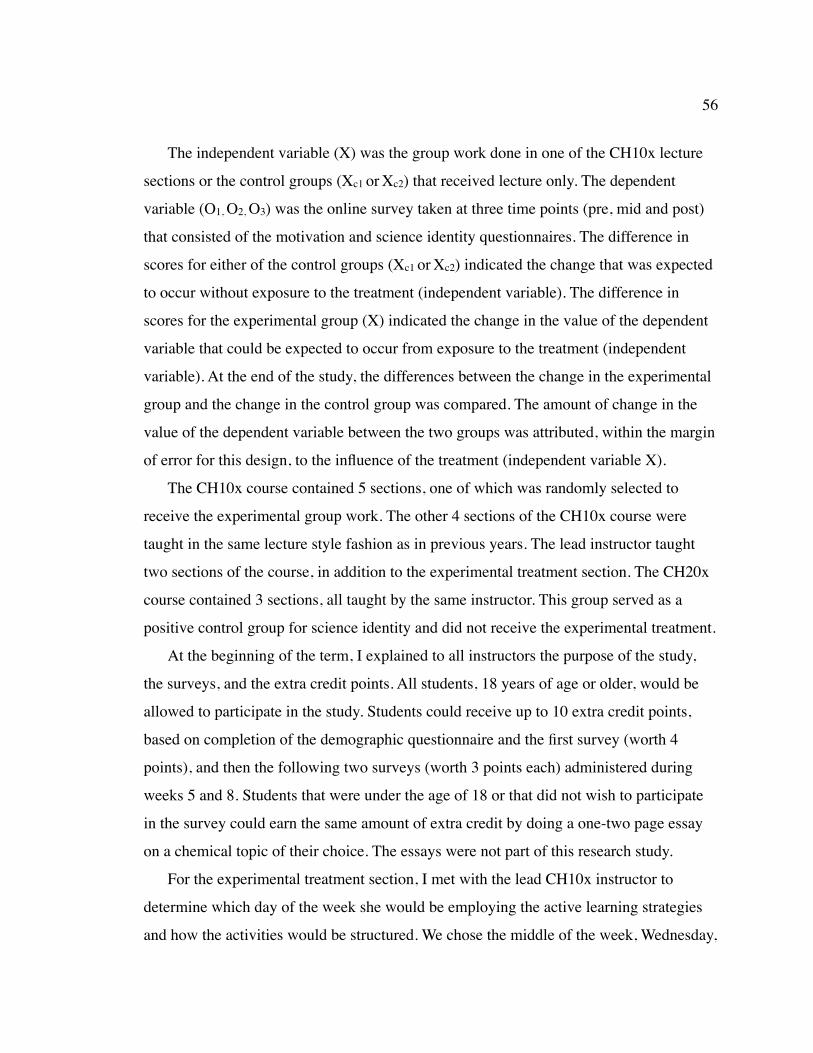
! The independent variable (X) was the group work done in one of the CH10x lecture
sections or the control groups (Xc1 or Xc2) that received lecture only. The dependent
variable (O1, O2, O3) was the online survey taken at three time points (pre, mid and post)
that consisted of the motivation and science identity questionnaires. The difference in
scores for either of the control groups (Xc1 or Xc2) indicated the change that was expected
to occur without exposure to the treatment (independent variable). The difference in
scores for the experimental group (X) indicated the change in the value of the dependent
variable that could be expected to occur from exposure to the treatment (independent
variable). At the end of the study, the differences between the change in the experimental
group and the change in the control group was compared. The amount of change in the
value of the dependent variable between the two groups was attributed, within the margin
of error for this design, to the influence of the treatment (independent variable X).
! The CH10x course contained 5 sections, one of which was randomly selected to
receive the experimental group work. The other 4 sections of the CH10x course were
taught in the same lecture style fashion as in previous years. The lead instructor taught
two sections of the course, in addition to the experimental treatment section. The CH20x
course contained 3 sections, all taught by the same instructor. This group served as a
positive control group for science identity and did not receive the experimental treatment.
! At the beginning of the term, I explained to all instructors the purpose of the study,
the surveys, and the extra credit points. All students, 18 years of age or older, would be
allowed to participate in the study. Students could receive up to 10 extra credit points,
based on completion of the demographic questionnaire and the first survey (worth 4
points), and then the following two surveys (worth 3 points each) administered during
weeks 5 and 8. Students that were under the age of 18 or that did not wish to participate
in the survey could earn the same amount of extra credit by doing a one-two page essay
on a chemical topic of their choice. The essays were not part of this research study.
! For the experimental treatment section, I met with the lead CH10x instructor to
determine which day of the week she would be employing the active learning strategies
and how the activities would be structured. We chose the middle of the week, Wednesday,
56

to administer the treatment in an attempt to avoid the low class attendance that is
prevalent on Fridays or Mondays near holidays or other events. We met once per week to
discuss the previous class sessions’ course material and to structure handouts to be used
in the Wednesday class. These handouts consisted of either a series of questions
representing concepts that students were expressing difficulty in learning and/or new
material that was being introduced.
! On the days that active strategies were being used, the lead instructor presented an
outline of the lecture and asked if anyone had questions from the previous lecture. Then,
the lead instructor would lecture for approximately 20-25 minutes and do a demonstration
related to that topic. At the end of the demonstration, I handed out the worksheets and the
instructor asked the students to get into groups of 2-3. Students were given a group
worksheet to turn in and individual sheets that they were to retain for their use and study.
Students were allowed to work on problems for 10-15 minutes. The lead instructor and I
were available to answer questions that students posed during this time period. At the end
of the 15 minute period, students were asked to turn in the group worksheets and the lead
instructor would go over the answers to the questions. I collected the worksheets for
scanning into a portable document format (PDF).
DATA ANALYSIS
All survey responses collected in Survey MonkeyTM were downloaded as Microsoft Excel
files for preparation to be imported into SPSS Statistics 19.0 software. The Likert-type
scales used for each of the questionnaires contained imbedded values (e.g. 1=strongly
disagree, 2=disagree, 3=neither agree or disagree, 4=agree, 5=strongly agree, 999= skip/
don’t answer). The “skip/don’t answer” responses were coded as missing values in SPSS.
Statistical analysis of the data is outline in this section and the results are discussed in
Chapter 4.
57

Validity
Exploratory Factor Analysis
! Exploratory factor analysis (EFA) employing the principle factor and orthogonal
varimax rotation was used to extract and confirm that the science identity statements were
measuring a single factor. I did not expect the variables in the instrument to load to
multiple factors, because the science identity dimensions on which this instrument is
based (i.e. performance, competence, and recognition) overlap and are not viewed as
stand-alone constructs (Carlone & Johnson, 2007). A scree plot of the correlation matrix
eigenvalues, which is the percent of variance explained by each component or question in
the instrument, was created to visually verify the total variation in the data. A scree plot
would show the number of components loading to individual factors (Field, 2009).
! EFA employing the principle factor and orthogonal varimax rotation was used to
extract and confirm that the Chemistry Motivation Questionnaire was measuring the six
motivational factors as outlined by Glynn and Koballa, Jr. (2006). I expected the
variables in the instrument to load to multiple factors, based on the similar college
population and context for which this instrument was designed.
Kaiser-Meyer Sampling Adequacy for Factor Analysis
! The Kaiser-Meyer-Olkin measure (KMO) was performed to verify the dataset
adequacy for factor analysis. The KMO measure was used to determine if a factor
analysis was appropriate for the science identity instrument variables. The KMO statistic
gives a value between 0 and 1 for each pairwise combination of variables and values
close to 1 indicate that the sum of partial correlations are small relative to the sum of the
correlations (Field, 2009). In order for distinct factors to emerge from the factor analysis,
the partial correlations should be small. All KMO values for individual items must be
above the minimum limit of 0.5 (Kaiser, 1974), with scale values between 0.5 and 0.7
being considered "mediocre", between 0.7 and 0.8 being considered "good", between 0.8
and 0.9 being considered "great", and values above 0.9 being considered as
"superb" (Hutcheson & Sofroniou, 1999).
58
Bartlett's Test of Sphericity
! Bartlett’s test of Sphericity tests the null hypothesis that the variables are
uncorrelated. This test is another measure of the relationship among the variables. If the
variables are uncorrelated or correlate poorly, the correlation matrix produced with the
KMO statistic is an identity matrix (meaning all correlation coefficients are zero).
Bartlett's test must be significant to indicate that the correlation matrix of the variables
differ significantly from an identity matrix. This pattern indicates that the items being
measured are all correlated and the items must have some level of correlation with other
items to be part of the same factor. Bartlett's test is also a good measure to determine if a
clustering analysis is appropriate for the dataset. Significance for this test must be p <0.05
(Field, 2009).
Reliability
! Measurement reliability of the 13 questions in the science identity questionnaire, the
30 questions in the Chemistry Motivation Questionnaire (Glynn & Koballa, Jr., 2006) and
the six motivational factor variables (see Appendix B) within the motivation survey was
performed using Cronbach’s alpha reliability coefficients. Cronbach’s alpha measures the
internal consistency of items within a scale, which is the extent to which participants’
responses correlate with each other on particular items (Vaske, 2008). Item total
correlations must be greater than or equal to 0.40 and alpha coefficients must be greater
than or equal to 0.65 in order for the items to be considered reliably measuring the same
construct and to justify combining the items into a single index (Nunnally & Bernstein,
1994). Items with item-total correlations of less than 0.40 are dropped from the
instrument. Cronbach’s alpha of less than 0.65, are assessed to determine if deletion of
items for that variable will raise the alpha value above 0.65, thus improving its internal
consistency.
59

Statistical Analysis
! Several statistical analyses were performed to assess the differences between the
CH10x and the CH20x courses and the differences in the experimental section with the
other course sections.
Bivariate Correlations
! Bivariate correlations were performed using Pearson’s correlation coefficient (r) as a
descriptive statistic to evaluate the linear relationship (how closely the two variables
group together about a straight line) between the science identity and the total motivation
variables. Pearson r characterize relationships as “minimal to typical” for values .10-.30,
“typical to substantial” for values .30-.50, and “substantial” for values >.50 (Vaske,
2008). Since the relationship between science identity and motivation was not predicted,
a two-tailed analysis was performed. Scatterplots were used to visually inspect the
relationship between the two variables and to detect any curvilinear relationships. Box
plots were used to identify outliers in the data, since extreme values can either
underestimate or overestimate the strength of the relationship between the two variables.
Analysis of Variance (ANOVA)
! A one-way analysis of variance (ANOVA) was performed to test the hypothesis that
there is a positive relationship between the use of active engagement work in a large
lecture and students’ development of a science identity over time. A second hypothesis
was also tested that there is a positive relationship between the use of active engagement
work in lecture and student’s development of motivation (intrinsic, self-determination,
and self-efficacy) in learning chemistry. The independent variables are the CH10x
experimental treatment group, the CH10x control group and the CH20x control group.
The two dependent variables for this analysis are the science identity and motivation
surveys taken at three time points (pre, mid and post) at weeks 1, 5 and 8. Histograms of
the dependent variables, science identity and motivation over time, were plotted and
visually examined to determine a normal (Gaussian) distribution among the data. Box
60
plots of the computed variables at each time point were examined to identify any outliers
in the data. Post-hoc comparisons were performed using the pairwise tests, Games-
Howell and Dunnett’s T3, to assess the differences in the means between the independent
variables at the various time points. The Games-Howell post-hoc test was used as the
sample sizes between the independent variables were unequal. Games-Howell is most
accurate when samples sizes are unequal. Dunnett’s T3 was used to compare the means of
the CH10x treatment group and CH10x control group to the mean of the CH20x control
group. The strength of statistically significant relationships was measured using the effect
size, eta (η). Pearson r interpretations are “minimal to typical” for values .100-.243,
“typical to substantial” for values .243-.371, and “substantial” for values >.371 (Vaske,
2008).
Participant Differences
Cluster analysis for science identity responders
! A K-means cluster analysis was used to partition the students in each of the chemistry
courses into groups based on their responses to the science identity instrument. K-means
cluster analysis is a multivariate technique used to empirically group individuals based on
the statistical patterns across variables or factors generated in collected data (MacQueen,
1967). I chose an initial three cluster solution based on the literature by several authors
who state that identity exists as multiplicities (James, 1890; Mead, 1934) and as a
continuum from low to high (Lounsbury, Huffstetler, Leong, & Gibson, 2005; Deaux &
Burke, 2010). I categorized participants on a continuum from low to high, to avoid
representing science identity as having a dichotomous aspect (yes or no). Cluster analysis
was performed on a range of two to five group clusters to determine the best fit solution
for the data. The cluster analysis results were used to identify interview participants and
to describe respondents on the Science Identity questionnaire.
! Validation of the final cluster solution was done using several different analyses. First,
random sorting of the data was done three times to determine if the final solution
achieved was stable and not a result of the order the data in the file. Second, 3-D
61
scatterplot graphs were created to show the distribution of the different cluster solutions.
Using the Bartlett factor scores from the principle components analysis of the Science
Identity instrument on the X- and Y-axes and the Z-axis being defined by the values
obtained from the individual cluster solutions (distance of the case from its classfication
cluster center), 3-D graphs were created for each cluster solution. Graphs were rotated in
50° increments along the X- and Y-axes to determine the spread of the clusters, if the
clusters were superimposed or separated, and to find the best angle at which to view the
clusters. Third, X-tab analysis was done for each pairwise combination of the group
transformations (i.e. 2x3, 3x4 and 4x5). X-tab tables were assessed to determine
separation of the participants from the lower cluster solutions into the higher cluster
solutions. Fourth, a total science identity score was computed based on summation of
respondent's answers to all 13 questions, excluding those respondents with missing data.
Computed scores would range from 12 to 60, based on the variables measured on a five-
point scale of 1-strongly disagree to 5-strongly agree. Analysis of frequencies of the total
science identity score with the four-group cluster solution was done to determine sorting
of the total science identity score among the clusters.
! A Chi-squared analysis was performed to test whether the science identity clusters
harbored certain demographic characteristics. The final science identity cluster solution
was tested against the independent, dichotomous variables of sex, if the participant took
chemistry in high school, and if the participant took physics in high school.
! A final categorical variable asking about the types of messages about science received
during childhood was also tested. This variable has a scale of negative, neutral, positive,
and other. Effect sizes for statistically significant values were measured using Cramer’s V.
Values for Cramer’s V are “minimal to typical” as .10-.30, “typical to substantial” as
.30-.50, and “substantial” as >.50 (Vaske, 2008).
62

Participant Interviews
! The interview protocol (see Appendix D) was used to gather students' thoughts in 5
subject areas that have been shown important to developing positive attitudes towards
science: leisure and hobby activities, K12 school interests, perceptions of science (past
and present), future goals, and current classroom experiences (Gogolin & Swartz, 1992).
Interview participants were categorized on a continuum from low to high based on the
results of the clustering analysis. The corresponding transcripts were coded according to
the 5 subject areas listed above. Quotes from participants in each of these categories were
used to represent example behavior and thinking of students with low, moderate and high
science identities.
63

CHAPTER 4 RESULTS
! This study had three main objectives defined by the following research questions:
RQ1: In what ways can the development of a student’s science identity be measured?
RQ2: How does group work in lecture affect development of a student’s science identity?
RQ3: How does group work in lecture effect a student’s motivation (intrinsic, self-
determination, and self-efficacy) in learning science?
! In the first research question, the objective was to determine how the development of
a student’s science identity could be measured and the related hypothesis was that all
students enter college with some measure of a science identity. In an attempt to answer
this question, I developed a science identity instrument consisting of questions focused
around three aspects of a science identity: recognition of one’s identity, performance
related to one’s identity, and competence in one’s ability (self-efficacy) to function in a
science identity role (Kaufman & Feldman, 2004; Carlone & Johnson, 2007). I analyzed
response patterns between and within individuals by: 1) combining responses of similar
individuals on the instrument in order to highlight patterns of a certain type of individual
(e.g. someone with a science identity) and 2) coordinating the instrument responses to
individual interviews to place participants on a scale of low, moderate, and high science
identity.
! In the second research question, the objective was to determine how active
engagement (e.g. group work) in a large lecture course would affect the development of a
student’s science identity. The hypothesis was that there would be a positive relationship
between the use of active engagement work in the large lecture course and the students’
development of a science identity. I used the science identity instrument to measure how
individual identity and behavior are being influenced by the social structures of using
group work in lecture.
64
! Lastly, for the third research question, the objective was to determine how the group
work in lecture would effect a student’s motivation (intrinsic, self-determination, and
self-efficacy) towards learning science. The hypothesis was that there would be a positive
relationship between the use of active group work in a large lecture and students’ self-
efficacy, motivation and affect. I used the Chemistry Motivation Questionnaire (Glynn &
Koballa, Jr., 2006) to measure student responses to six aspects of motivation related to
total motivation in learning chemistry. I also used responses from this instrument to
examine the relationship between motivation and science identity.
Participants
! From a total sample population of 1706 students in the two courses, 746 out of 986
students in the CH10x course and 500 out of 720 students in the CH20x course took the
demographics questionnaire (see Table 4.1). This equates roughly to a response rate for
the CH10x and CH20x courses of 76% and 69%, respectively. The response rates for the
motivation and science identity questionnaires varied, due to students either forgetting to
complete a questionnaire at that particular time point or duplicated efforts (e.g. took the
same questionnaire twice, thinking it was time point 1 and 2). The gender distribution
among the courses was approximately 66% female and 35% male in the CH10x course
and 16% female and 84% males in the CH20x course (See Table 4.2). The greater
number of women in the CH10x course is reflective of the overall gender distribution of
undergraduates in science and liberal arts majors across the campus, which is
approximately 60% female and 40% male. The greater number of men in the CH20x
course is reflective of the overall distribution of undergraduates with declared majors in
engineering, which is 85% male and 15% female for Fall Term 2012 enrollment and the
field of engineering is historically a male dominated field. Participants ages reflect the
overall demographics of freshmen across this institution, with 90% of students in the
18-22 year age category for both courses.
! Participants' year in school is largely comprised of freshmen (61% for CH10x, 78%
for CH20x), followed by sophomores (22% for CH10x, 13% for CH20x), juniors (14%
65

for CH10x, 13% for CH20x), seniors (2-3% for CH10x and CH20x) and post-
baccalaureates (<1%) (See Table 4.2). A majority of all students had prior chemistry
preparation, with the CH20x group showing a slightly higher percentage of students who
took chemistry in high school (71% of CH10x vs. 79% of CH20x respondents). Students
were also asked if they took a physics course in high school and the CH20x group had a
higher percentage of respondents with 69% of them stating they took physics in high
school. The CH10x respondents were vastly below this percentage, with only 28% of
them indicating that they took physics in high school. All respondents were asked if they
were repeating the current chemistry course and an average of 11% responded that they
were repeating the course.
Validity
! The online surveys used for this study included a 20-item demographics questionnaire
(see Appendix A), and the 30-item Chemistry Motivation Questionnaire (Glynn &
Koballa, Jr., 2006) (see Appendix B), and the 13-item Science Identity Questionnaire (see
Appendix C). The Chemistry Motivation Questionnaire was designed to measure the
extent to which a student is motivated to learn the science (Glynn, Taasoobshirazi, &
Brickman,2007). The motivational factors outlined in the paper by Glynn et al. were used
in this study and consisted of groups of items from the questionnaire that identified
motivational constructs discussed in the self-regulation learning literature (Druger, 2001;
Parjares, 2008; Zimmerman & Schunk, 2008). The variables included intrinsic
motivation, extrinsic motivation, self-efficacy, self-determination, and anxiety about
science assessment (Glynn & Koballa, Jr., 2006).
! Sample size for this study was determined by calculating the sampling error using a
95% confidence interval. Larger sample sizes generally produce a smaller margin of
error, but using an exact confidence interval all the margin of error to take into account
sampling and non-sampling errors. This method does not account for bias such as poorly
phrased questions, participants being untruthful, and non-responders. The margin of error
for this study at 95% confidence with 1706 participants was 2 percent (~ 0.98/√n ).
66

! Table 4.1 Response Rates of CH10x and CH20x participants
! ! Demographics! Time 1! Time 2! Time 3
! ! n (%)! n (%)! n (%)! n(%)!
! CH10x! 746 (76)! 570 (58)! 600 (61)! 653 (66)! (986 enrolled)
! CH20x! 500 (69)! 400 (56)! 409 (57)! 420 (58)! (720 enrolled)!
! Table 4.2 Demographics of CH10x and CH20x participants! ! !! ! CH10x (n=746) ! ! CH20x (n=500)
! ! Sample size! Percentage! Sample size! Percentage! ! (n)! (%) ! (n)! (%)
! Sex:! Female! 494 ! (66)! 80! (16)! Male! 252 ! (34)! 420! (84)
! Age:! ! 18-22 yrs! 671 ! (90)! 455! (91)! ! 23-26 yrs! ! 45 ! (6)! 25! (5)! ! >26 yrs! ! 30 ! (4)! 20! (4)
! Year in school:! ! Freshman! ! 455! (61)! 395! (79)! ! Sophomore! ! 164! (22)! 65! (13)! ! Junior! ! 104! (14)! 27! (6)! ! Senior! ! 22! (3)! 9! (2)! ! Post-bacc, other! ! 3! (<1)! 5! (<1)! Took chemistry in high school:!! ! No! ! 149! (20)! 50! (10)! ! Yes! ! 534! (71)! 393! (79)! Took physics in high school!:!! ! No! ! 474! (64)! 99! (20)! ! Yes! ! 209! (28)! 345! (69)
! Repeating this chemistry course:! 95! (12)! 45! (10)! Last school attended was high school:! 572! (72)! 363! (81)
67

! The response rates for these surveys were higher among the CH10x group than for the
CH20x group (see Table 4.1). The demographics questionnaire was administered as a
stand-alone survey and the response rate for the CH10x group was 80% compared to the
68% response rate for the CH20x group (see Table 4.1). Response rates for the
motivation and science identity instruments increased from time points 1 to 3, because
students were given extra credit for participation at each time point and the number of
students taking the surveys in an attempt to receive extra credit increased as the term
progressed.
Exploratory Factor Analysis
! An exploratory factor analysis employing the principle factor and orthogonal varimax
rotation was used on the Chemistry Motivation Questionnaire to determine if the
relationships among the 30 items were similar to the original published article by Glynn
and Koballa, Jr. (2006). I was particularly interested to learn if any new factors could be
identified beyond the six motivational factors as outlined by Glynn and Koballa, Jr.,
(2006). The resulting relationships appeared similar to the original published article with
no emergence of new factors.
! The exploratory factor analysis employing the principle factor was performed on the
Science Identity Questionnaire to determine that the questionnaire was measuring one
factor. The analysis produced only one component that was extracted which had an
eigenvalue over Kaiser’s (1974) criterion of 1 and explained 53.28% of the variance.
These results were confirmed with a scree plot which showed only one inflection that was
consistent with one extracted component (See Figure 4.1). These results were consistent
with the literature that states that dimensions of identity are overlapping and do not
function in isolation (Kaufman & Feldman, 2004; Carlone & Johnson, 2007).
! The Kaiser-Meyer-Olkin (KMO) measure was performed on the Science Identity
Questionnaire to verify the dataset adequacy for the exploratory factor analysis. All KMO
values for the individual items on the anti-image correlation matrix ranged from 0.90 to
0.96, which were above the minimum acceptable limit of 0.77 (Hutcheson & Sofroniou,
68
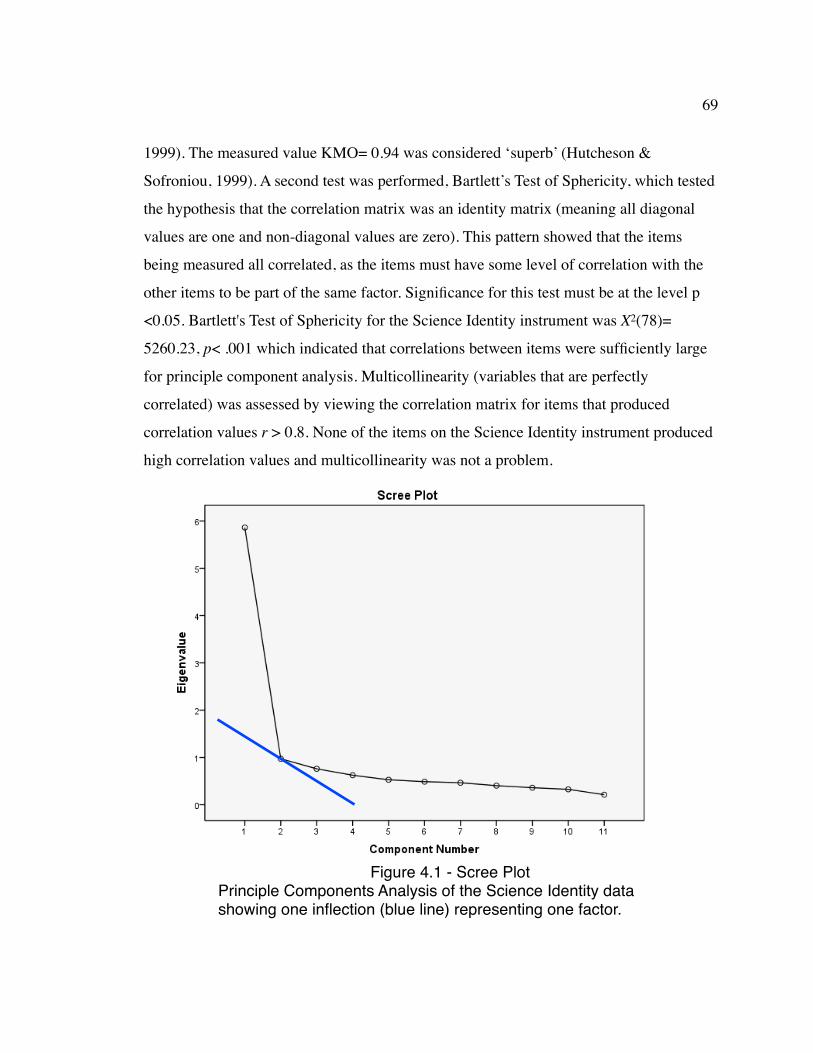
1999). The measured value KMO= 0.94 was considered ‘superb’ (Hutcheson &
Sofroniou, 1999). A second test was performed, Bartlett’s Test of Sphericity, which tested
the hypothesis that the correlation matrix was an identity matrix (meaning all diagonal
values are one and non-diagonal values are zero). This pattern showed that the items
being measured all correlated, as the items must have some level of correlation with the
other items to be part of the same factor. Significance for this test must be at the level p
<0.05. Bartlett's Test of Sphericity for the Science Identity instrument was X2(78)=
5260.23, p< .001 which indicated that correlations between items were sufficiently large
for principle component analysis. Multicollinearity (variables that are perfectly
correlated) was assessed by viewing the correlation matrix for items that produced
correlation values r > 0.8. None of the items on the Science Identity instrument produced
high correlation values and multicollinearity was not a problem.
69
Figure 4.1 - Scree PlotPrinciple Components Analysis of the Science Identity data showing one inflection (blue line) representing one factor.
Reliability
Reliability Analysis- Motivation Questionnaire
! Cronbach's alpha (α) was used to test reliability and internal consistency of the
multiple-item indices in the Chemistry Motivation questionnaire. Alpha coefficients
ranged from 0.87 to 0.89 on the 30-item total motivation questionnaire for the CH10x and
CH20x groups which were well above the minimum value of ≥ 0.65 for items to reliably
measure the same construct (Nunnally & Bernstein, 1994). Analysis of the item-total
statistics revealed several items that if deleted from the index would increase the
Cronbach's alpha to 0.92 and 0.91 for the CH10x and CH20x courses, respectively (see
Tables 4.3 and 4.4). Consequently, the following items were removed from the
questionnaire (see Appendix B) due to low item total correlation scores that fell below the
minimum value of 0.40 (Nunnally & Bernstein, 1994): "3-I like to do better than the
other students on the chemistry tests"; "5-If I am having trouble learning the chemistry, I
try to figure out why."; "7-Earning a good chemistry grade is important to me."; "15-I
think about how my chemistry grade will affect my overall grade point average."; "20-It
is my fault, if I do not understand the chemistry."
! The items that comprised the anxiety motivation index (see Tables 4.5 and 4.6) were
negatively correlated with many of the other items in the total motivation index,
producing item-total correlations below the 0.40 cutoff value. This result occurred despite
these items being reverse coded such that a higher score on these items indicated lower
anxiety. Removal of the anxiety items from the total motivation index increased the alpha
coefficients from 0.91 to 0.92 for the CH10x group and from 0.89 to 0.91 for the CH20x
group. Tables 4.3 and 4.4 reflected the Cronbach's alpha values after removal of these
items from the index.
! For the five motivational components, intrinsic, extrinsic, self-determination, goal
orientation, and anxiety, the alpha coefficients ranged from 0.57 to 0.90 (see Tables 4.5
thru 4.8). Alpha values that were ≥ 0.65 indicated that the items were reliably measuring
the construct. The alpha coefficient for the extrinsic variable increased from 0.69 to 0.90
70
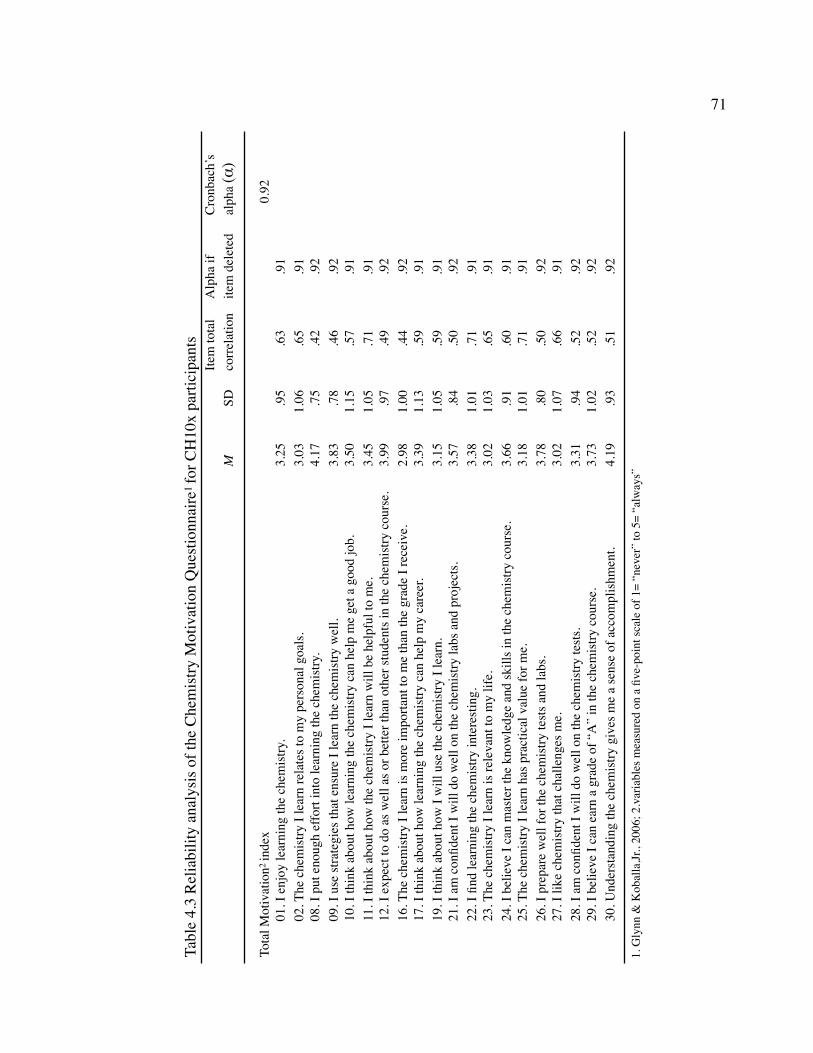
Tabl
e 4.
3 R
elia
bilit
y an
alys
is o
f the
Che
mis
try M
otiv
atio
n Q
uest
ionn
aire
1 fo
r CH
10x
parti
cipa
nts
!!
!!
Item
tota
l!A
lpha
if!
Cro
nbac
h’s!
!!
M!
SD!
corr
elat
ion!
item
del
eted!
alph
a (α
)
Tota
l Mot
ivat
ion2
inde
x!!
!!
!!
0.92
!01
. I e
njoy
lear
ning
the
chem
istry
. !!
3.25!
.95!
.63!
.91
!02
. The
che
mis
try I
lear
n re
late
s to
my
pers
onal
goa
ls. !
3.03!
1.06!
.65!
.91
!08
. I p
ut e
noug
h ef
fort
into
lear
ning
the
chem
istry
. !4.
17!
.75!
.42!
.92
!09
. I u
se st
rate
gies
that
ens
ure
I lea
rn th
e ch
emis
try w
ell. !
3.83!
.78!
.46!
.92
!10
. I th
ink
abou
t how
lear
ning
the
chem
istry
can
hel
p m
e ge
t a g
ood
job.!
3.50!
1.15!
.57!
.91
!11
. I th
ink
abou
t how
the
chem
istry
I le
arn
will
be
help
ful t
o m
e. !
3.45!
1.05!
.71!
.91
!12
. I e
xpec
t to
do a
s wel
l as o
r bet
ter t
han
othe
r stu
dent
s in
the
chem
istry
cou
rse.
!3.
99!
.97!
.49!
.92
!16
. The
che
mis
try I
lear
n is
mor
e im
porta
nt to
me
than
the
grad
e I r
ecei
ve. !
2.98!
1.00!
.44!
.92
!17
. I th
ink
abou
t how
lear
ning
the
chem
istry
can
hel
p m
y ca
reer
. !3.
39!
1.13!
.59!
.91
!19
. I th
ink
abou
t how
I w
ill u
se th
e ch
emis
try I
lear
n.!
3.15!
1.05!
.59!
.91
!21
. I a
m c
onfid
ent I
will
do
wel
l on
the
chem
istry
labs
and
pro
ject
s. !
3.57!
.84!
.50!
.92
!22
. I fi
nd le
arni
ng th
e ch
emis
try in
tere
stin
g. !
!3.
38!
1.01!
.71!
.91
!23
. The
che
mis
try I
lear
n is
rele
vant
to m
y lif
e. !
3.02!
1.03!
.65!
.91
!24
. I b
elie
ve I
can
mas
ter t
he k
now
ledg
e an
d sk
ills i
n th
e ch
emis
try c
ours
e. !
3.66!
.91!
.60!
.91
!25
. The
che
mis
try I
lear
n ha
s pra
ctic
al v
alue
for m
e. !
3.18!
1.01!
.71!
.91
!26
. I p
repa
re w
ell f
or th
e ch
emis
try te
sts a
nd la
bs. !
3.78!
.80!
.50!
.92
!27
. I li
ke c
hem
istry
that
cha
lleng
es m
e. !
!!
3.02!
1.07!
.66!
.91
!28
. I a
m c
onfid
ent I
will
do
wel
l on
the
chem
istry
test
s. !
3.31!
.94!
.52!
.92
!29
. I b
elie
ve I
can
earn
a g
rade
of “
A”
in th
e ch
emis
try c
ours
e. !
3.73!
1.02!
.52!
.92
!30
. Und
erst
andi
ng th
e ch
emis
try g
ives
me
a se
nse
of a
ccom
plis
hmen
t. !
4.19!
.93!
.51!
.92
1. G
lynn
& K
obal
la,Jr
., 20
06; 2
.var
iabl
es m
easu
red
on a
five
-poi
nt sc
ale
of 1
= “n
ever
” to
5=
“alw
ays”
71
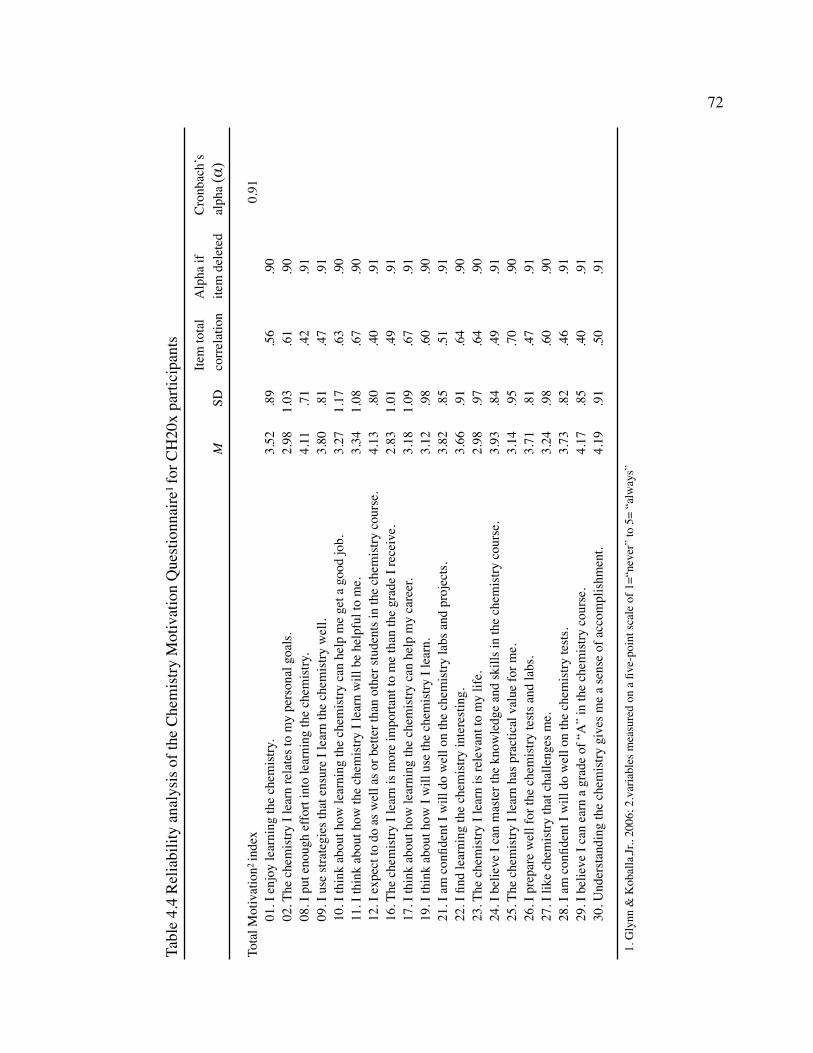
Tabl
e 4.
4 R
elia
bilit
y an
alys
is o
f the
Che
mis
try M
otiv
atio
n Q
uest
ionn
aire
1 fo
r CH
20x
parti
cipa
nts
!!
!!
Item
tota
l!A
lpha
if!
Cro
nbac
h’s!
!!
M!
SD!
corr
elat
ion!
item
del
eted!
alph
a (α
)
Tota
l Mot
ivat
ion2
inde
x!!
!!
!!
0.91
!01
. I e
njoy
lear
ning
the
chem
istry
. !!
3.52!
.89!
.56!
.90
!02
. The
che
mis
try I
lear
n re
late
s to
my
pers
onal
goa
ls. !
2.98!
1.03!
.61!
.90
!08
. I p
ut e
noug
h ef
fort
into
lear
ning
the
chem
istry
. !4.
11!
.71!
.42!
.91
!09
. I u
se st
rate
gies
that
ens
ure
I lea
rn th
e ch
emis
try w
ell. !
3.80!
.81!
.47!
.91
!10
. I th
ink
abou
t how
lear
ning
the
chem
istry
can
hel
p m
e ge
t a g
ood
job.!
3.27!
1.17!
.63!
.90
!11
. I th
ink
abou
t how
the
chem
istry
I le
arn
will
be
help
ful t
o m
e. !
3.34!
1.08!
.67!
.90
!12
. I e
xpec
t to
do a
s wel
l as o
r bet
ter t
han
othe
r stu
dent
s in
the
chem
istry
cou
rse.
!4.
13!
.80!
.40!
.91
!16
. The
che
mis
try I
lear
n is
mor
e im
porta
nt to
me
than
the
grad
e I r
ecei
ve. !
2.83!
1.01!
.49!
.91
!17
. I th
ink
abou
t how
lear
ning
the
chem
istry
can
hel
p m
y ca
reer
. !3.
18!
1.09!
.67!
.91
!19
. I th
ink
abou
t how
I w
ill u
se th
e ch
emis
try I
lear
n.!
3.12!
.98!
.60!
.90
!21
. I a
m c
onfid
ent I
will
do
wel
l on
the
chem
istry
labs
and
pro
ject
s. !
3.82!
.85!
.51!
.91
!22
. I fi
nd le
arni
ng th
e ch
emis
try in
tere
stin
g. !
!3.
66!
.91!
.64!
.90
!23
. The
che
mis
try I
lear
n is
rele
vant
to m
y lif
e. !
2.98!
.97!
.64!
.90
!24
. I b
elie
ve I
can
mas
ter t
he k
now
ledg
e an
d sk
ills i
n th
e ch
emis
try c
ours
e. !
3.93!
.84!
.49!
.91
!25
. The
che
mis
try I
lear
n ha
s pra
ctic
al v
alue
for m
e. !
3.14!
.95!
.70!
.90
!26
. I p
repa
re w
ell f
or th
e ch
emis
try te
sts a
nd la
bs. !
3.71!
.81!
.47!
.91
!27
. I li
ke c
hem
istry
that
cha
lleng
es m
e. !
!!
3.24!
.98!
.60!
.90
!28
. I a
m c
onfid
ent I
will
do
wel
l on
the
chem
istry
test
s. !
3.73!
.82!
.46!
.91
!29
. I b
elie
ve I
can
earn
a g
rade
of “
A”
in th
e ch
emis
try c
ours
e. !
4.17!
.85!
.40!
.91
!30
. Und
erst
andi
ng th
e ch
emis
try g
ives
me
a se
nse
of a
ccom
plis
hmen
t. !
4.19!
.91!
.50!
.91
1. G
lynn
& K
obal
la,Jr
., 20
06; 2
.var
iabl
es m
easu
red
on a
five
-poi
nt sc
ale
of 1
=“ne
ver”
to 5
= “a
lway
s”
72
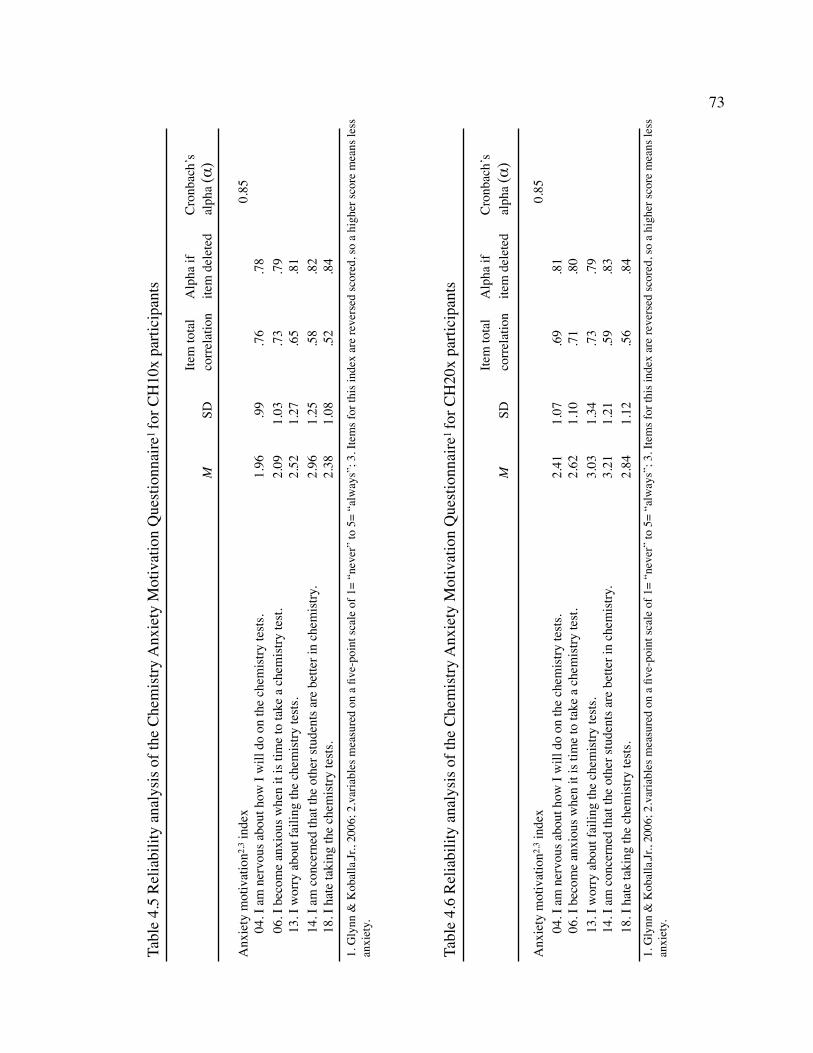
Tabl
e 4.
5 R
elia
bilit
y an
alys
is o
f the
Che
mis
try A
nxie
ty M
otiv
atio
n Q
uest
ionn
aire
1 fo
r CH
10x
parti
cipa
nts
!!
!!
Item
tota
l!A
lpha
if!
Cro
nbac
h’s!
!!
M!
SD!
corr
elat
ion!
item
del
eted!
alph
a (α
)
Anx
iety
mot
ivat
ion2
,3 in
dex!
!!
!!
!0.
85!
04. I
am
ner
vous
abo
ut h
ow I
will
do
on th
e ch
emis
try te
sts. !
1.96!
.99!
.76!
.78
!06
. I b
ecom
e an
xiou
s whe
n it
is ti
me
to ta
ke a
che
mis
try te
st. !
2.09!
1.03!
.73!
.79!
!13
. I w
orry
abo
ut fa
iling
the
chem
istry
test
s. !
2.52!
1.27!
.65!
.81
!14
. I a
m c
once
rned
that
the
othe
r stu
dent
s are
bet
ter i
n ch
emis
try. !
2.96!
1.25!
.58!
.82
!18
. I h
ate
taki
ng th
e ch
emis
try te
sts. !
2.38!
1.08!
.52!
.84
Tabl
e 4.
6 R
elia
bilit
y an
alys
is o
f the
Che
mis
try A
nxie
ty M
otiv
atio
n Q
uest
ionn
aire
1 fo
r CH
20x
parti
cipa
nts
!!
!!
Item
tota
l!A
lpha
if!
Cro
nbac
h’s!
!!
M!
SD!
corr
elat
ion!
item
del
eted!
alph
a (α
)
Anx
iety
mot
ivat
ion2
,3 in
dex!
!!
!!
!0.
85!
04. I
am
ner
vous
abo
ut h
ow I
will
do
on th
e ch
emis
try te
sts. !
2.41!
1.07!
.69!
.81
!06
. I b
ecom
e an
xiou
s whe
n it
is ti
me
to ta
ke a
che
mis
try te
st. !
2.62!
1.10!
.71!
.80!
!13
. I w
orry
abo
ut fa
iling
the
chem
istry
test
s. !
3.03!
1.34!
.73!
.79
!14
. I a
m c
once
rned
that
the
othe
r stu
dent
s are
bet
ter i
n ch
emis
try. !
3.21!
1.21!
.59!
.83
!18
. I h
ate
taki
ng th
e ch
emis
try te
sts. !
2.84!
1.12!
.56!
.84
1. G
lynn
& K
obal
la,Jr
., 20
06; 2
.var
iabl
es m
easu
red
on a
five
-poi
nt sc
ale
of 1
= “n
ever
” to
5=
“alw
ays”
; 3. I
tem
s for
this
inde
x ar
e re
vers
ed sc
ored
, so
a hi
gher
scor
e m
eans
less
an
xiet
y.
1. G
lynn
& K
obal
la,Jr
., 20
06; 2
.var
iabl
es m
easu
red
on a
five
-poi
nt sc
ale
of 1
= “n
ever
” to
5=
“alw
ays”
; 3. I
tem
s for
this
inde
x ar
e re
vers
ed sc
ored
, so
a hi
gher
scor
e m
eans
less
an
xiet
y.
73

Tabl
e 4.
7 Re
liabi
lity
anal
ysis
of th
e Ch
emist
ry M
otiv
atio
n Q
uesti
onna
ire1,
2 Fa
ctor
s for
CH
10x
parti
cipa
nts
!!
!!
Item
tota
l!A
lpha
if!
Cron
bach
’s!
!!
!!
corre
latio
n!ite
m d
elet
ed!
alph
a (α
)! !
Intri
nsic
mot
ivat
ion!
!!
!!
!0.
80!
01. I
enj
oy le
arni
ng th
e ch
emist
ry. !
!!
!.6
6!.7
2!
16. T
he c
hem
istry
I le
arn
is m
ore
impo
rtant
to m
e th
an th
e gr
ade
I rec
eive
. !!
!.4
2!.7
9!
22. I
find
lear
ning
the
chem
istry
inte
resti
ng. !
!!
!.7
4!.6
9!
27. I
like
che
mist
ry th
at c
halle
nges
me.
!!
!!
!.6
5!.7
2!
30. U
nder
stand
ing
the
chem
istry
giv
es m
e a
sens
e of
acc
ompl
ishm
ent. !
!!
.40!
.80
!Ex
trins
ic m
otiv
atio
n!!
!!
!0.
89!
10. I
thin
k ab
out h
ow le
arni
ng th
e ch
emist
ry c
an h
elp
me
get a
goo
d jo
b.!
!!
.80!
.84
!11
. I th
ink
abou
t how
the
chem
istry
I le
arn
will
be
help
ful t
o m
e. !
!!
.80!
.84
!17
. I th
ink
abou
t how
lear
ning
the
chem
istry
can
hel
p m
y ca
reer
. !!
!.7
7!.8
6!
Self-
Effic
acy!
!!
!!
0.87
!12
. I e
xpec
t to
do a
s wel
l as o
r bet
ter t
han
othe
r stu
dent
s in
the
chem
istry
cou
rse.
!!
!.6
1!.8
6!
21. I
am
con
fiden
t I w
ill d
o w
ell o
n th
e ch
emist
ry la
bs a
nd p
roje
cts. !
!!
.66!
.84
!24
. I b
elie
ve I
can
mas
ter t
he k
now
ledg
e an
d sk
ills i
n th
e ch
emist
ry c
ours
e. !
!!
.68!
.84
!28
. I a
m c
onfid
ent I
will
do
wel
l on
the
chem
istry
tests
. !!
!.7
6!.8
2!
29. I
bel
ieve
I ca
n ea
rn a
gra
de o
f “A
” in
the
chem
istry
cou
rse.
!!
!.7
3!.8
3!
Self-
Det
erm
inat
ion!
!!
!!
0.77
!08
. I p
ut e
noug
h ef
fort
into
lear
ning
the
chem
istry
. !!
!.6
5!.6
4!
09. I
use
stra
tegi
es th
at e
nsur
e I l
earn
the
chem
istry
wel
l. !
!!
.64!
.64
!26
. I p
repa
re w
ell f
or th
e ch
emist
ry te
sts a
nd la
bs. !
!!
.52!
.78
!G
oal O
rient
atio
n!!
!!
!0.
86!
02. T
he c
hem
istry
I le
arn
rela
tes t
o m
y pe
rson
al g
oals.
!!
!.6
8!.8
3!
19. I
thin
k ab
out h
ow I
will
use
the
chem
istry
I le
arn.!
!!
.65!
.85
!23
. The
che
mist
ry I
lear
n is
rele
vant
to m
y lif
e. !
!!
.73!
.81
!25
. The
che
mist
ry I
lear
n ha
s pra
ctic
al v
alue
for m
e. !
!!
.77!
.80
1. G
lynn
& K
obal
la,Jr
., 20
06; 2
.var
iabl
es m
easu
red
on a
five
-poi
nt sc
ale
of 1
=“n
ever
” to
5=
“alw
ays”
.
74
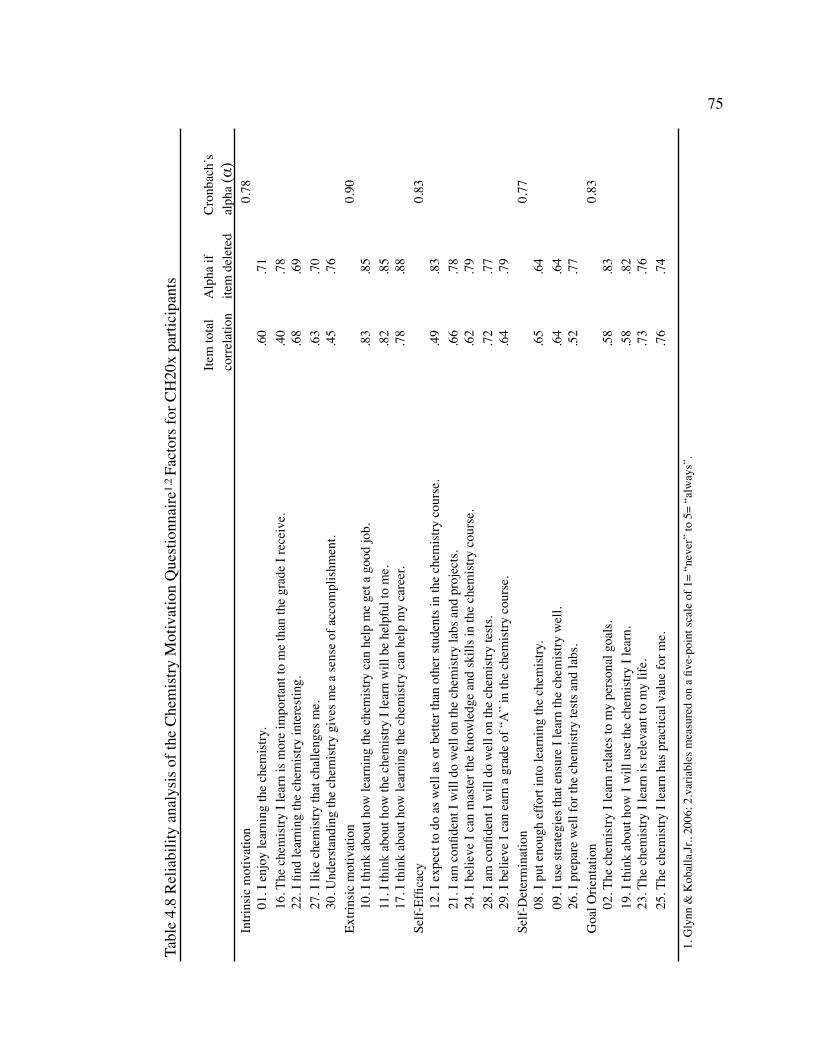
Tabl
e 4.
8 Re
liabi
lity
anal
ysis
of th
e Ch
emist
ry M
otiv
atio
n Q
uesti
onna
ire1,
2 Fa
ctor
s for
CH
20x
parti
cipa
nts
!!
!!
Item
tota
l!A
lpha
if!
Cron
bach
’s!
!!
!!
corre
latio
n!ite
m d
elet
ed!
alph
a (α
)!
Intri
nsic
mot
ivat
ion!
!!
!!
!0.
78!
01. I
enj
oy le
arni
ng th
e ch
emist
ry. !
!!
!.6
0!.7
1!
16. T
he c
hem
istry
I le
arn
is m
ore
impo
rtant
to m
e th
an th
e gr
ade
I rec
eive
. !!
!.4
0!.7
8!
22. I
find
lear
ning
the
chem
istry
inte
resti
ng. !
!!
!.6
8!.6
9!
27. I
like
che
mist
ry th
at c
halle
nges
me.
!!
!!
!.6
3!.7
0!
30. U
nder
stand
ing
the
chem
istry
giv
es m
e a
sens
e of
acc
ompl
ishm
ent. !
!!
.45!
.76
!Ex
trins
ic m
otiv
atio
n!!
!!
!0.
90!
10. I
thin
k ab
out h
ow le
arni
ng th
e ch
emist
ry c
an h
elp
me
get a
goo
d jo
b.!
!!
.83!
.85
!11
. I th
ink
abou
t how
the
chem
istry
I le
arn
will
be
help
ful t
o m
e. !
!!
.82!
.85
!17
. I th
ink
abou
t how
lear
ning
the
chem
istry
can
hel
p m
y ca
reer
. !!
!.7
8!.8
8!
Self-
Effic
acy!
!!
!!
0.83
!12
. I e
xpec
t to
do a
s wel
l as o
r bet
ter t
han
othe
r stu
dent
s in
the
chem
istry
cou
rse.
!!
.49!
.83
!21
. I a
m c
onfid
ent I
will
do
wel
l on
the
chem
istry
labs
and
pro
ject
s. !
!!
.66!
.78
!24
. I b
elie
ve I
can
mas
ter t
he k
now
ledg
e an
d sk
ills i
n th
e ch
emist
ry c
ours
e. !
!!
.62!
.79
!28
. I a
m c
onfid
ent I
will
do
wel
l on
the
chem
istry
tests
. !!
!.7
2!.7
7!
29. I
bel
ieve
I ca
n ea
rn a
gra
de o
f “A
” in
the
chem
istry
cou
rse.
!!
!.6
4!.7
9!
Self-
Det
erm
inat
ion!
!!
!!
0.77
!08
. I p
ut e
noug
h ef
fort
into
lear
ning
the
chem
istry
. !!
!.6
5!.6
4!
09. I
use
stra
tegi
es th
at e
nsur
e I l
earn
the
chem
istry
wel
l. !
!!
.64!
.64
!26
. I p
repa
re w
ell f
or th
e ch
emist
ry te
sts a
nd la
bs. !
!!
.52!
.77
!G
oal O
rient
atio
n!!
!!
!0.
83!
02. T
he c
hem
istry
I le
arn
rela
tes t
o m
y pe
rson
al g
oals.
!!
!.5
8!.8
3!
19. I
thin
k ab
out h
ow I
will
use
the
chem
istry
I le
arn.!
!!
.58!
.82
!23
. The
che
mist
ry I
lear
n is
rele
vant
to m
y lif
e. !
!!
.73!
.76
!25
. The
che
mist
ry I
lear
n ha
s pra
ctic
al v
alue
for m
e. !
!!
.76!
.74
1. G
lynn
& K
obal
la,Jr
., 20
06; 2
.var
iabl
es m
easu
red
on a
five
-poi
nt sc
ale
of 1
= “n
ever
” to
5=
“alw
ays”
.
75
for the CH10x group and from 0.74 to 0.89 for the CH20x group by deleting the
following items: "3-I like to do better than the other students on the chemistry tests"; "07-
Earning a good chemistry grade is important to me"; 15-I think about how my chemistry
grade will affect my overall grade point average." The alpha coefficient for the self-
determination variable increased from 0.58 to .77 for the CH10x group and from 0.57 to
0.77 for the CH20x group after deleting the following items: "05-If I am having trouble
learning the chemistry, I try to figure out why" and "20-It is my fault, if I do not
understand the chemistry."
Reliability Analysis - Science Identity
! For the Science Identity questionnaire, Cronbach's alpha (α) was used to test
reliability and internal consistency of the multiple-item indices. Alpha coefficients ranged
from 0.86 to 0.91 for the 13-item total motivation questionnaire for the CH10x and
CH20x groups (See Tables 4.9 and 4.10), which was above the minimum value of ≥ 0.65
for items to reliably measure the same construct (Nunnally & Bernstein, 1994). Analysis
of the item-total statistics revealed only one item in which the corrected-item total
correlation did not meet the minimum value of 0.40. The item "12-I am often discouraged
by others to pursue science," produced a correlation value of 0.20 and was deleted from
the index. The Cronbach's alpha coefficient was raised to 0.87 and 0.92 for the CH20x
and CH10x courses, respectively.
76

Tabl
e 4.
9 Re
liabi
lity
anal
ysis
of th
e Sc
ienc
e Id
entit
y Q
uesti
onna
ire1 fo
r CH
10x
parti
cipa
nts
!!
!!
Item
tota
l!A
lpha
if!
Cron
bach
’s!
!!
M!
SD!
corre
latio
n!de
lete
d!al
pha
(α)
!Sc
ienc
e Id
entit
y in
dex!
!!
!!
!0.
92!
01. I
feel
a c
onne
ctio
n to
the
scie
ntifi
c co
mm
unity
.!!
2.97!
1.04!
.69!
.91
!02
. I li
ke to
thin
k th
at I
am g
ood
at d
oing
scie
nce.!
3.53!
.92!
.73!
.91
!03
. My
hobb
ies a
re o
ften
scie
nce
rela
ted.!
2.95!
1.10!
.66!
.91
!04
. I c
onsid
er m
ysel
f to
be a
scie
nce
pers
on.!
3.05!
1.09!
.84!
.90
!05
. Lea
rnin
g sc
ienc
e co
ncep
ts of
ten
com
es e
asy
to m
e.!3.
03!
1.08!
.65!
.91
!06
. I a
m o
ften
enco
urag
ed b
y ot
hers
to p
ursu
e sc
ienc
e.!3.
10!
1.09!
.66!
.91
!07
. I e
njoy
lear
ning
new
scie
nce
topi
cs.!
3.63!
.96!
.77!
.90
!08
. Oth
er p
eopl
e (m
y fri
ends
, fam
ily, t
each
ers)
freq
uent
ly c
onsid
er
!!
me
to b
e a
scie
nce
pers
on. !
2.98!
1.13!
.79!
.90
!09
. I h
ave
parti
cipa
ted
in a
ctiv
ities
with
scie
nce
peop
le (t
each
ers,
men
tors
, frie
nds)
!!
!
w
ho a
re si
mila
r to
me
(eth
nici
ty, b
ackg
roun
d, c
omm
unity
, etc
...).!
3.08!
1.13!
.64!
.91
!10
. I c
onsid
er m
ost o
f my
frien
ds to
be
scie
nce
peop
le.!
2.59!
1.04!
.40!
.92
!11
. Thr
ough
thei
r wor
k, sc
ient
ists a
re a
ble
to im
prov
e th
e liv
es o
f oth
ers
!an
d th
e w
orld
in w
hich
we
live.!
4.18!
.84!
.40!
.92
!13
. I w
ant t
o be
long
to a
scie
ntifi
c co
mm
unity
.!!
3.25!
.98!
.68!
.91
!!
1.va
riabl
es m
easu
red
on a
five
-poi
nt sc
ale
of 1
= “s
trong
ly d
isagr
ee”
to 5
= “s
trong
ly a
gree
”.
77

Tabl
e 4.
10 R
elia
bilit
y an
alys
is of
the
Scie
nce
Iden
tity
Que
stion
naire
1 fo
r CH
20x
parti
cipa
nts
!!
!!
Item
tota
l!A
lpha
if!
Cron
bach
’s!
!!
M!
SD!
corre
latio
n!de
lete
d!al
pha
(α)
!Sc
ienc
e Id
entit
y in
dex!
!!
!!
!0.
87!
01. I
feel
a c
onne
ctio
n to
the
scie
ntifi
c co
mm
unity
.!!
3.31!
.91!
.62!
.86
!02
. I li
ke to
thin
k th
at I
am g
ood
at d
oing
scie
nce.!
3.87!
.69!
.59!
.86
!03
. My
hobb
ies a
re o
ften
scie
nce
rela
ted.!
3.25!
1.00!
.56!
.86
!04
. I c
onsid
er m
ysel
f to
be a
scie
nce
pers
on.!
3.45!
.95!
.77!
.85
!05
. Lea
rnin
g sc
ienc
e co
ncep
ts of
ten
com
es e
asy
to m
e.!3.
58!
.87!
.56!
.86
!06
. I a
m o
ften
enco
urag
ed b
y ot
hers
to p
ursu
e sc
ienc
e.!3.
34!
1.00!
.51!
.86
!07
. I e
njoy
lear
ning
new
scie
nce
topi
cs.!
3.88!
.73!
.68!
.86
!08
. Oth
er p
eopl
e (m
y fri
ends
, fam
ily, t
each
ers)
freq
uent
ly c
onsid
er
!m
e to
be
a sc
ienc
e pe
rson
. !!
3.50!
1.01!
.63!
.86
!09
. I h
ave
parti
cipa
ted
in a
ctiv
ities
with
scie
nce
peop
le (t
each
ers,
men
tors
, frie
nds)
!!
!!
who
are
sim
ilar t
o m
e (e
thni
city
, bac
kgro
und,
com
mun
ity, e
tc...
).!3.
37!
1.04!
.48!
.87
!10
. I c
onsid
er m
ost o
f my
frien
ds to
be
scie
nce
peop
le.!
2.79!
1.02!
.45!
.87
!11
. Thr
ough
thei
r wor
k, sc
ient
ists a
re a
ble
to im
prov
e th
e liv
es o
f oth
ers
!an
d th
e w
orld
in w
hich
we
live.!
4.32!
.73!
.40!
.87
!13
. I w
ant t
o be
long
to a
scie
ntifi
c co
mm
unity
.!!
3.47!
.89!
.58!
.86
!!
1.va
riabl
es m
easu
red
on a
five
-poi
nt sc
ale
of 1
= “s
trong
ly d
isagr
ee”
to 5
= “s
trong
ly a
gree
”.
78

Statistical Analysis
Bivariate Correlations
! An analysis using Pearson’s correlation coefficient (r) was performed to evaluate the
relationship between the science identity and the total motivation variables for all three
time points. A two-tailed analysis revealed a statistically significant relationship (p<.001)
between science identity and total motivation for all three time points (see Table 4.11).
The Pearson r characterized these relationships as a positive, “typical” relationship for
the initial time point and a positive, “substantial” relationship for last two time points
(Vaske, 2008). However, causation was not implied from these correlations, only the
strength and direction of the relationship between the two variables was determined.
Correlation values are directly related to the linear relationship such that as the
correlation value decreases dispersion from a straight line (a direct relationship)
decreases. Scatterplots were assessed for outliers as they can create false linear
relationships or dramatically reduce the computed correlation coefficient. Scatterplots
made of the computed variables showed a relatively linear relationship between the
science identity and the total motivation variables. However, sample patterns between
variables can be difficult to detect with large sample sizes (>1000), as the number of data
points obscures the linear trend (Vaske, 2008). The observed statistically significant
difference was likely due to the large sample size (n=713), because as the sample size
increases, the probability of finding a statistically significant relationship increases.
One-Way Analysis of Variance (ANOVA)
! A one-way analysis of variance (ANOVA) was performed to test two hypotheses. The
first hypothesis was that there would be a positive relationship between the use of active
engagement work in a large lecture and students’ development of a science identity over
time. The second hypotheses was that a positive relationship would exist between the use
of active engagement work in lecture and student’s development of motivation (intrinsic,
self-determination, and self-efficacy) in learning chemistry.
79
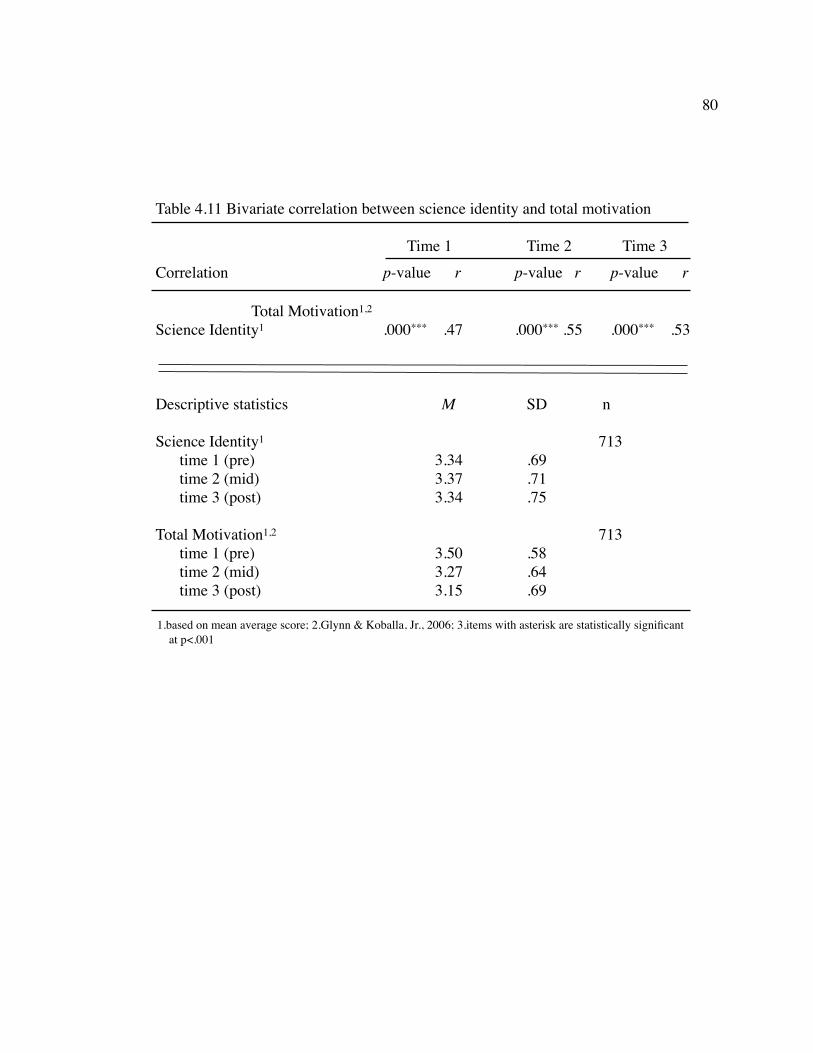
! Table 4.11 Bivariate correlation between science identity and total motivation!
! ! Time 1! Time 2! Time 3!! Correlation! ! p-value! r! p-value! r! p-value! r
! ! Total Motivation1,2
! Science Identity1! .000***! .47! .000***!.55! .000***! .53
!! Descriptive statistics! ! M! SD! n
! Science Identity1! ! ! ! ! 713! time 1 (pre)! ! 3.34! .69! time 2 (mid)! ! 3.37! .71! time 3 (post)! ! 3.34! .75
! Total Motivation1,2! ! ! 713! time 1 (pre)! ! 3.50! .58! time 2 (mid)! ! 3.27! .64! time 3 (post)! ! 3.15! .69
80
1.based on mean average score; 2.Glynn & Koballa, Jr., 2006; 3.items with asterisk are statistically significant at p<.001
! Histograms of the dependent variables, science identity and motivation over time
were assessed for skewness and kurtosis, and revealed a normal (Gaussian) distribution
among the student responses. Box-plots of the computed dependent variables showed
approximately 20 outliers. Responses for each outlier were visually assessed for coding
errors. No coding errors were found. The responses flagged as outliers because they
contained either all one value for that entire survey or a majority of one value at the
extreme ends of the scale. Assumptions could not be made about the validity of the
participants responses. Outliers were removed prior to analysis to help equalize the
variances in the data. A comparison analysis with and without the outliers showed little
differences in the final outcomes.
! The average mean score on the Science Identity questionnaire was found to be
statistically significant across the three chemistry sections (see Table 4.12). At the initial
time point, the CH10x experimental group (M=3.28) and the CH10x control group
(M=3.19) were similar in science identity average mean scores, with no statistically
significant difference between them. These two groups exhibited lower mean scores than
the CH20x control group (M=3.50) and this difference was statistically significant,
F(715)= 15.10, p<.001. Among three groups at the initial time point, there was “minimal
to typical” (Vaske, 2008) differences in science identity as suggested by the effect size
(eta, η= .22).
! Science identity for all three groups increased at the second time point, with the two
CH10x groups showing a larger increase than the CH20x group (see Table 4.12). The
differences seen in science identity between the CH10x control group (M= 3.25) and the
CH20x control group (M= 3.51) was statistically significant, F(715)= 10.95, p<.001. The
effect size indicated that this was a “minimal to typical” (Vaske, 2008) difference (eta,
η= .16). This pattern of statistically significant differences was repeated for the third time
point, despite science identity decreasing for all three groups. The CH10x experimental
group (M= 3.33) and the CH20x control group (M= 3.48) had the smallest decreases in
science identity, while the CH10x control group had the largest decrease (M=3.19). The
differences seen in science identity between the CH10x control group and the CH20x
81
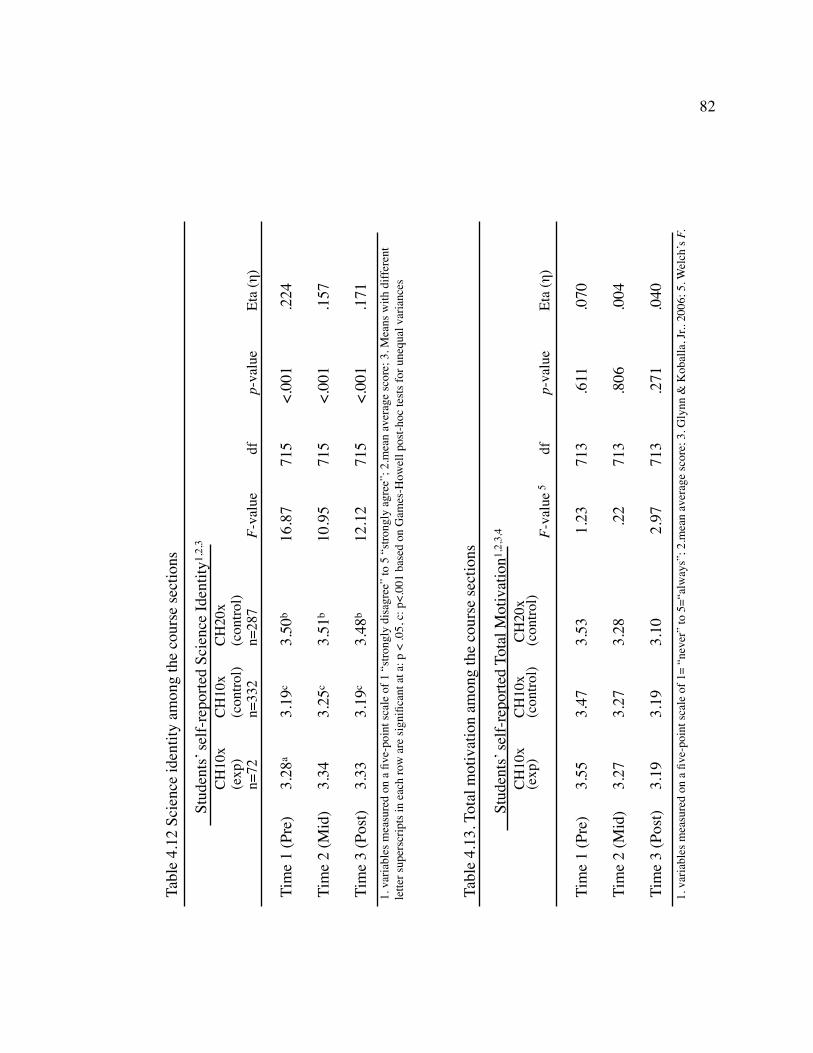
!Ta
ble
4.12
Sci
ence
iden
tity
amon
g th
e co
urse
sect
ions
!St
uden
ts’ s
elf-
repo
rted
Scie
nce
Iden
tity1
,2,3!
!!
CH
10x !
CH
10x!
CH
20x!
!!
(exp
)!(c
ontro
l)!(c
ontro
l)!
!n=
72!
n=33
2!n=
287!
F-va
lue!
df !
p-va
lue!
Eta
(η)!
!!
!!
!!
Tim
e 1
(Pre
)!3.
28a !
3.19
c !3.
50b !
16.8
7!71
5!<.
001!
.224!
!! !
Tim
e 2
(Mid
)!3.
34!
3.25
c !3.
51b !
10.9
5!71
5!<.
001!
.157
!!
!Ti
me
3 (P
ost)!
3.33!
3.19
c !3.
48b !
12.1
2!71
5!<.
001!
.171
!!
! !Ta
ble
4.13
. Tot
al m
otiv
atio
n am
ong
the
cour
se se
ctio
ns
!St
uden
ts’ s
elf-
repo
rted
Tota
l Mot
ivat
ion1
,2,3
,4!
!!
CH
10x !
CH
10x!
CH
20x!
!!
(exp
)!(c
ontro
l)!(c
ontro
l)!
!!
!!
!!
F-va
lue 5!
df !
p-va
lue!
Eta
(η)!
!!
!!
!!
Tim
e 1
(Pre
)!3.
55!
3.47!
3.53!
1.23!
713!
.611!
.070!
!! !
Tim
e 2
(Mid
)!3.
27!
3.27!
3.28!
.22!
713!
.806
!.0
04!
!!
Tim
e 3
(Pos
t)!3.
19!
3.19!
3.10!
2.97!
713!
.271
!.0
40
1. v
aria
bles
mea
sure
d on
a fi
ve-p
oint
scal
e of
1 “
stro
ngly
dis
agre
e” to
5 “
stro
ngly
agr
ee”;
2.m
ean
aver
age
scor
e; 3
. Mea
ns w
ith d
iffer
ent
lette
r sup
ersc
ripts
in e
ach
row
are
sign
ifica
nt a
t a: p
< .0
5, c
: p<.
001
base
d on
Gam
es-H
owel
l pos
t-hoc
test
s for
une
qual
var
ianc
es
1. v
aria
bles
mea
sure
d on
a fi
ve-p
oint
scal
e of
1=
“nev
er”
to 5
=“al
way
s”; 2
.mea
n av
erag
e sc
ore;
3. G
lynn
& K
obal
la, J
r.. 2
006;
5. W
elch
’s F.
82
control group was statistically significant, F(715)= 10.78, p<.001. This difference in
science identity for the latter time point was “minimal to typical” (Vaske, 2008), as
suggested by the effect size (eta, η= .17). The CH10x experimental group showed no
statistical difference between the other two groups at either time point.
! The three chemistry groups appeared to have similar total motivation as measured by
the Chemistry Motivation Questionnaire (Glynn & Koballa, Jr., 2006) at the initial time
point (M=3.47-3.55). The three groups reported decreasing total motivation over the
course of the study (see Table 4.13). These differences in total motivation among the
three groups were not statistically significant. Several differences were seen in the
motivational factors (see Tables 4.8 and 4.9) among the three groups over time.
Differences were seen in the computed extrinsic, self-determination, self-efficacy and
anxiety motivational factors. No statistical differences were seen for computed
components of intrinsic or goal orientation motivation (see Table 4.14). All groups
reported relatively moderate levels of extrinsic motivation, but were strongly motivated
in the concepts of self-determination and self-efficacy. The CH10x groups reported
relatively moderate levels of anxiety (M= 3.55, 3.65), with the CH20x group reporting a
higher level of anxiety (M= 3.19).
! Extrinsic motivation was moderate among the three groups, with similar levels
reported between the CH10x experimental (M= 3.39) and CH10x control groups (M=
3.32) (see Table 4.14). The CH20x group reported a lower level of extrinsic motivation
(M= 3.12) and this difference between the CH20x group and the two CH10x groups was
statistically significant, F(683)= 5.75, p<.01. This difference in extrinsic motivation was
“minimal to typical” (Vaske, 2008) as suggested by the effect size (eta, η= .10). Extrinsic
motivation decreased over the time period of the study, with the pattern of the two CH10x
groups being statistically different than the CH20x group remaining steady, F(683)= 4.97,
p<.01; F(683)= 6.70, p<.01. Effect sizes for these two remaining time points were
“minimal to typical” (Vaske, 2008).
! Self-determination motivation was reported to be quite high among the three groups
at the start of the course (See Table 4.14). Both CH10x groups reported a higher self-
83
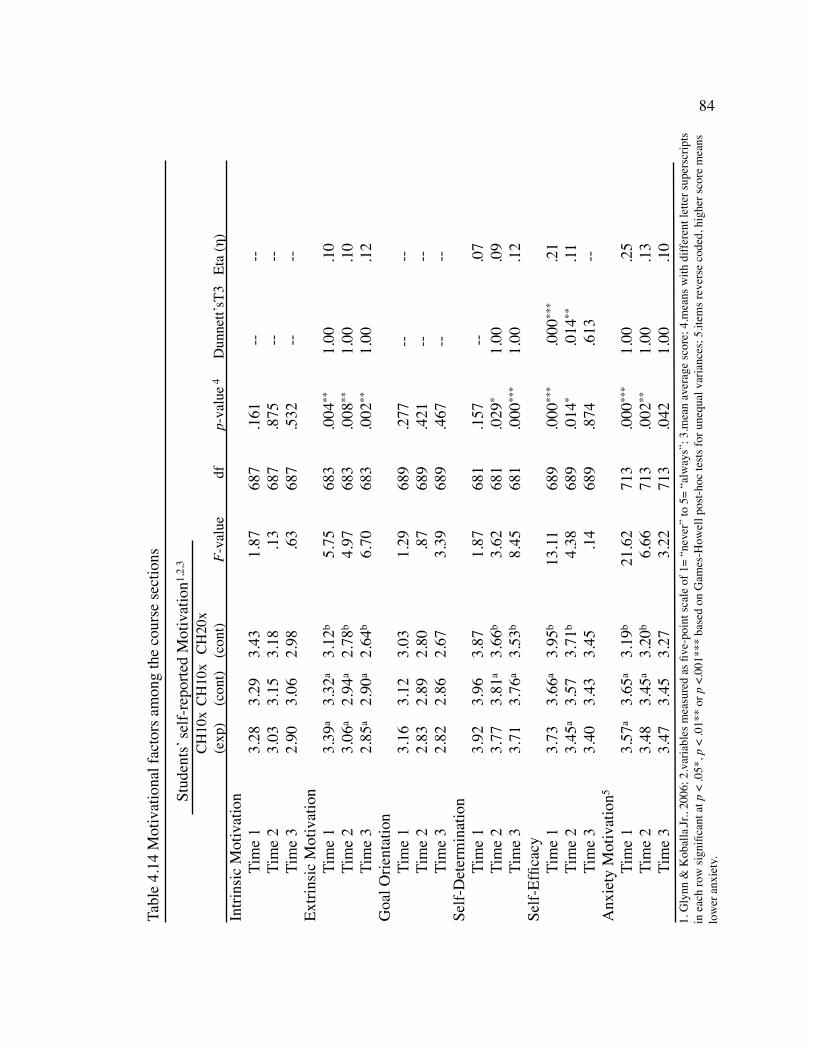
!Ta
ble
4.14
Mot
ivat
iona
l fac
tors
am
ong
the
cour
se se
ctio
ns
!St
uden
ts’ se
lf-re
porte
d M
otiv
atio
n1,2
,3!
!!
CH10
x !C
H10
x! C
H20
x!!
!(e
xp)!
(con
t)!
(con
t)!
F-va
lue!
df !
p-va
lue 4!
Dun
nett’
sT3!
Eta
(η)!
!In
trins
ic M
otiv
atio
n!
Tim
e 1!
3.28!
3.29!
3.43!
1.87!
687!
.161!
--!--!
!!
Tim
e 2!
3.03!
3.15!
3.18!
.13!
687!
.875
!--!
--!!
!Ti
me
3!2.
90!
3.06!
2.98!
.63!
687!
.532
!--!
--!!
Extri
nsic
Mot
ivat
ion !
!!
!!
Tim
e 1!
3.39
a !3.
32a !
3.12
b !5.
75!
683!
.004
**!
1.00!
.10!
!!
Tim
e 2!
3.06
a !2.
94a !
2.78
b !4.
97!
683!
.008
**!
1.00
!.1
0!!
Tim
e 3!
2.85
a !2.
90a !
2.64
b !6.
70!
683!
.002
**!
1.00
!.1
2!
Goa
l Orie
ntat
ion
!Ti
me
1!3.
16!
3.12!
3.03!
1.29!
689!
.277!
--!!
--!!
Tim
e 2!
2.83!
2.89!
2.80!
.87!
689!
.421
!--!!
--!
Tim
e 3!
2.82!
2.86!
2.67!
3.39!
689!
.467
!--!!
--!
Self-
Det
erm
inat
ion
!Ti
me
1!3.
92!
3.96!
3.87!
1.87!
681!
.157!
--!.0
7!!
!Ti
me
2!3.
77!
3.81
a !3.
66b !
3.62!
681!
.029
*!1.
00!
.09!
!Ti
me
3!3.
71!
3.76
a !3.
53b !
8.45!
681!
.000
***!
1.00
!.1
2!
Self-
Effic
acy
!Ti
me
1!3.
73!
3.66
a !3.
95b !
13.1
1!68
9!.0
00**
* !.0
00**
* !.2
1!!
Tim
e 2!
3.45
a !3.
57!
3.71
b !4.
38!
689!
.014
*!.0
14**!
.11
!Ti
me
3!3.
40!
3.43!
3.45!
.14!
689!
.874
!.6
13!
--!
Anx
iety
Mot
ivat
ion5
!Ti
me
1!3.
57a !
3.65
a !3.
19b !
21.6
2!71
3!.0
00**
* !1.
00!
.25!
!Ti
me
2!3.
48!
3.45
a !3.
20b !
6.66!
713!
.002
**!
1.00!
.13
!Ti
me
3!3.
47!
3.45!
3.27!
3.22!
713!
.042
!1.
00!
.10
1. G
lynn
& K
obal
la,Jr
., 20
06; 2
.var
iabl
es m
easu
red
as fi
ve-p
oint
scal
e of
1=
“nev
er”
to 5
= “a
lway
s”; 3
.mea
n av
erag
e sc
ore;
4.m
eans
with
diff
eren
t let
ter s
uper
scrip
ts in
eac
h ro
w si
gnifi
cant
at p
< .0
5*, p
< .0
1**
or p
<.0
01**
* ba
sed
on G
ames
-How
ell p
ost-h
oc te
sts fo
r une
qual
var
ianc
es; 5
.item
s rev
erse
cod
ed, h
ighe
r sco
re m
eans
lo
wer
anx
iety
.
84

determination level than did the CH20x group, with the CH10x control group stating they
had a slightly higher level of self-determination than did the CH10x experimental group.
These differences were not statistically significant. Levels of self-determination
decreased over time for all three groups, with the CH20x group reporting the biggest
decrease in this motivational factor. A statistically significant difference in the means
between the CH10x control group and the CH20x control group was noted at time points
2 and 3. At time 2, the CH20x control group (M= 3.66) reported lower levels of self-
determination than did the CH10x control group (M= 3.81) and this difference was
statistically significant, F(681)= 3.62, p<.05, with a “minimal” (Vaske, 2008) effect size
(eta, η= .09). Self-determination diminished further for the CH20x control group (M=
3.53) than for the CH10x control group (M= 3.76) and this difference was statistically
significant, F(683)= 8.45, p<.001. This difference was “minimal to typical” (Vaske, 2008)
as seen by the effect size (eta, η= .12).
! Self-efficacy among the chemistry students was moderate to high, with the CH20x
control group reporting the highest levels of self-efficacy at the start of the term (See
Table 4.14). Self-efficacy decreased over the course of the term, with the CH20x group
reporting the highest loss in self-efficacy as compared to CH10x groups. For the initial
time point, a difference between the CH10x control group (M= 3.66) and the CH20x
control group (M= 3.95) was statistically significant, F(689)= 13.11, p<.001, with an
effect size that was “minimal to typical” (Vaske, 2008). Although the self-efficacy of the
CH10x control group continued to decrease over the next two time points, the differences
in means between this group and the other two groups was not significant. At time 2, the
difference in the means between the CH10x experimental group (M= 3.45) and the
CH20x control group (M= 3.71) was statistically significant, F(681)= 8.45, p<.001, with
a “minimal to typical” effect size (eta, η= .11). At the end of the term, all three groups
reported similar levels of self-efficacy and these differences were not statistically
significant.
! Anxiety motivation related to taking chemistry at the start of the term was of
moderate concern to the CH10x groups, but was a much larger concern to the CH20x
85
group (see Table 4.14). The means of the three groups at the initial time point were
highest (indicating a lower level of anxiety) for the CH10x control group (M= 3.65) and
the CH10x experimental group (M= 3.57), with the CH20x control group reporting the
largest amount of anxiety (M= 3.19). The differences in anxiety levels between the
CH10x groups and the CH20x control group were statistically significant, F(713)= 21.64,
p<.001. Effect sizes for these differences was “typical to substantial” (Vaske, 2008) (eta,
η= .25). Anxiety about chemistry continued to increase for the two CH10x groups, but
decreased for the CH20x control group. Statistical differences in the means were seen
only between the CH10x control group and the CH20x control group at time points 2 and
3. At time 2, the CH10x control group (M= 3.45), reported a higher increase in anxiety
than did the CH20x group (M= 3.20), F(713)= 6.66, p<.01, with a “minimal to
typical” (Vaske, 2008) effect size (eta, η= .13). At time 3, anxiety levels for the CH10x
control group remained steady (M= 3.45), while anxiety levels for the CH20x group (M=
3.27) continued to taper off slightly. These differences were also statistically significant,
F(713)= 3.22, p<.05, with with a “minimal” (Vaske, 2008) effect size (eta, η= .10).
Chemistry Motivation Question Analysis
! At the start of the course, students in the CH10x group (79%) and in the CH20x
group (80%) responded positively (M= 4.19) to the statement “30-Understanding the
chemistry gives me a sense of accomplishment,” which is an intrinsic motivational factor
(see Table 4.3). Responses for both groups decreased over time, with the CH20x group
(58%) reporting a larger difference when compared to the CH10x group (69%). Student
responses at the initial time point in both groups were high among the self-determination
item: "08- I put enough effort into learning the chemistry" and the self-efficacy item: "12-
I expect to do as well or better than the other students in the chemistry course." Increased
mean scores for these factors indicated that students in this sample started the course with
an initial responsibility for learning chemistry and confidence in their ability to do
chemistry.
86
! The CH10x group which was comprised mostly of non-science majors, exhibited a
slightly higher mean score (M= 4.17) for the self-determination item: "08- I put enough
effort into learning the chemistry" than did the CH20x group (M= 4.11), but in both
groups this represented 84% of the respondents agreeing with this statement (see Table
4.3). Means for both groups decreased with time, with the CH20x group showing a larger
difference in the means over time. A majority of the students in both courses (average
75%) agreed with the self-efficacy statement: "12-I expect to do as well or better than the
other students in the chemistry course." Student's self-efficacy beliefs in chemistry
performance decreased over time with both groups beliefs decreasing approximately 20%
(see Table 4.3).
! The CH20x group was expected to exhibit higher self-efficacy and self-determination,
as this class is comprised entirely of engineering majors and is largely male. Males are
known to exhibit a higher self-efficacy than women; moreover, and as a discipline,
students in engineering tend to have a higher self-efficacy and self-determination as
compared to other majors (Reisberg et al., 2011).
! Responses for the anxiety motivation index showed the both groups scored the lowest
on item "04-I am nervous about how I will do on the chemistry tests," (CH10x, M=1.96;
CH20x, M=2.41) while the highest scored item for both groups was "14-I am concerned
that other students are better in chemistry," (CH10x, M=2.96; CH20x, M=3.21) (See
Tables 4.5 and 4.6). The CH10x group displayed a higher anxiety motivation mean
(M=2.37, SD=.896, N=552) than the CH20x group (M=2.83, SD= .952, N=394). Thus,
students in both groups perceived a large amount of anxiety in relation to taking
chemistry and were most concerned about their performance on chemistry tests, but were
least concerned about other students' performance.
Science Identity Question Analysis
! Overall, students in the CH20x course had higher mean responses to all items on the
Science Identity instrument than did the CH10x students (See Tables 4.9 and 4.10). This
pattern was expected, as the CH20x course is comprised of engineering students and this
87
group was hypothesized to have a higher science identity than the CH10x group. Analysis
of student responses at the start of the course on the Science Identity questionnaire
revealed that both the CH10x and the CH20x groups displayed high mean scores for the
items: "02- I like to think that I am good at doing science," "07- I enjoy learning science
topics," "11-Through their work, scientists are able to improve the lives of others and the
world in which we live," and "13-I want to belong to a scientific community." The item
"02- I like to think that I am good at doing science," represented a belief in one's ability
to perform science. Items "07- I enjoy learning science topics," and "13-I want to belong
to a scientific community," represented both an interest in science and a desire to belong
in science. Both groups had the highest mean scores for item "11-Through their work,
scientists are able to improve the lives of others and the world in which we live," which
suggested an overall positive belief in the work of scientists.
! Students in the CH10x course scored the lowest on the science identity items: "01- I
feel a connection to the scientific community," "03- My hobbies are often science related
(books, television, or activities)," "08- Other people (my friends, family, teachers)
frequently consider me to be a science person," as compared to the CH20x group. Items
"01- I feel a connection to the scientific community," and "03- My hobbies are often
science related (books, television, or activities)," demonstrated a current involvement in
science, while the item "08- Other people (my friends, family, teachers) frequently
consider me to be a science person," represented whether or not a participant was being
recognized for that involvement.
K-Means Cluster Analysis for Science Identity
! A K-Means cluster analysis was performed on the 13 dependent indices on the
Science Identity instrument. Cluster analysis classified the individuals into smaller,
homogenous groups based on their responses (statistical patterns) to the Science Identity
instrument. A series of 2 to 5 group K-Means cluster analysis were done to determine the
solution that best fit the data. This analysis addressed hypothesis 1, that all students enter
into college with some measure of a science identity and this hypothesis is supported by
88

the literature that states that identity can be viewed as a continuum from low to high
(Chickering and Reisser, 1993; Lounsbury, Huffstetler, Leong, and Gibson, 2005). An
initial two-group cluster solution separated the participants into categories of low and
high (see Figure 4.2-A). Further progression to a three-group solution sorted the two-
group solution into low, moderate and high categories (see Figure 4.2-B). Analysis of
four- and five-group solutions determined that the four-group solution was the best fit for
the data (see Figure 4.3-C), as determined by the inability of the five-group solution to
separate out the moderate and moderate-high categories (see Figure 4.3-D).
! Several different analyses were performed to validate the final four-group solution.
First, data were randomly sorted three different times and cluster analysis was performed
after each of the three random sorts to determine if the same solution was achieved each
time. Analysis of these three random sorts supported the stability of the four-group
solution identifying participants into four distinct groups based on their science identity.
! Second, 3-D scatterplot graphs were created to show the distribution of the cluster
solutions. Using the Bartlett factor scores from the principle components analysis of the
Science Identity instrument on the X- and Y-axes and the Z-axis being defined by the
values obtained from the individual cluster solutions (distance of the case from its
classfication cluster center), 3-D graphs were created for each cluster solution (see
Figures 4.2 and 4.3). Graphs rotated in 50° increments along the X- and Y-axes
determined that clusters were grouping to unique clusters and that the clusters were not
superimposed. Graphs rotated along the vertical axis at 125° provided a top down view of
the clusters showing distinct clusters with some overlap between the borders.
89
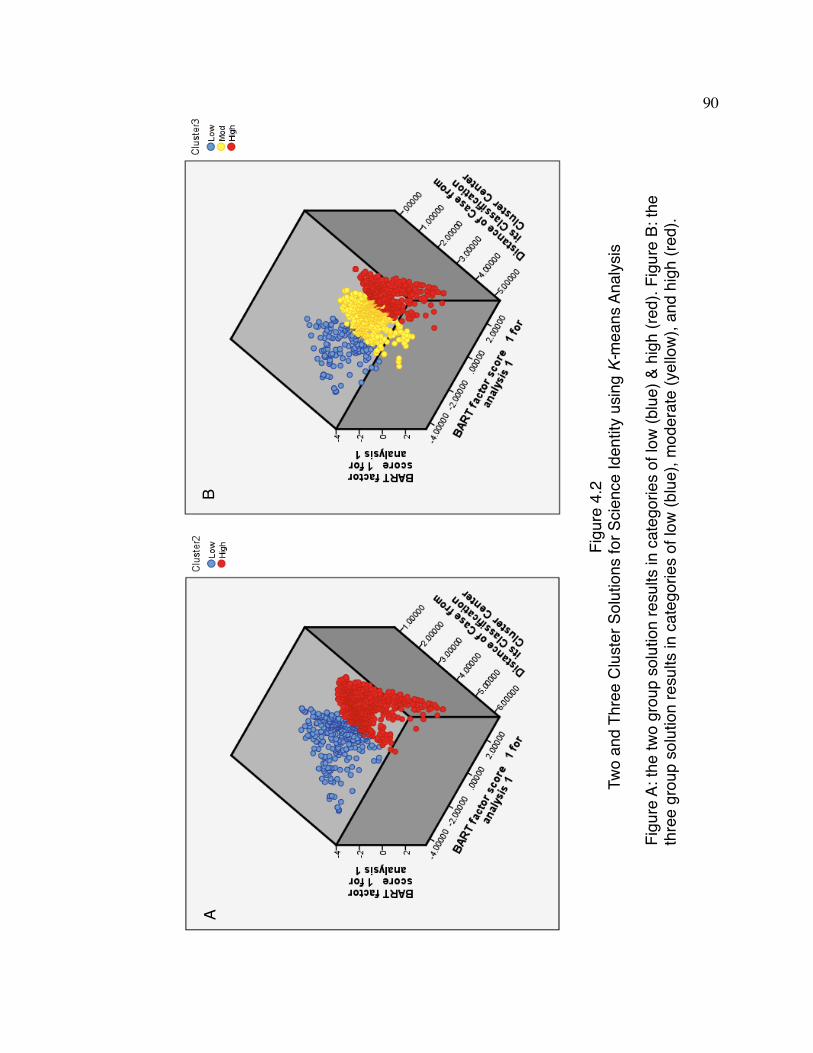
Figu
re 4
.2Tw
o an
d Th
ree
Clu
ster
Sol
utio
ns fo
r Sci
ence
Iden
tity
usin
g K-
mea
ns A
naly
sis
Figu
re A
: the
two
grou
p so
lutio
n re
sults
in c
ateg
orie
s of
low
(blu
e) &
hig
h (re
d). F
igur
e B:
the
thre
e gr
oup
solu
tion
resu
lts in
cat
egor
ies
of lo
w (b
lue)
, mod
erat
e (y
ello
w),
and
high
(red
).
AB
90
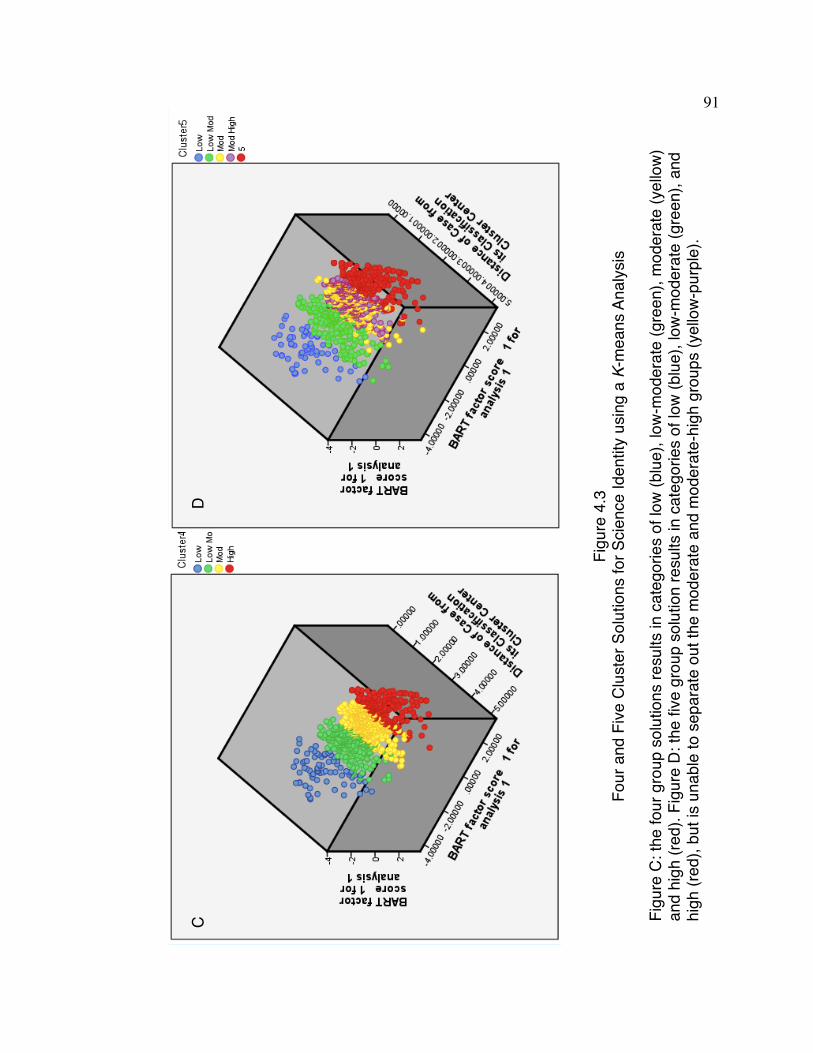
Figu
re 4
.3Fo
ur a
nd F
ive
Clu
ster
Sol
utio
ns fo
r Sci
ence
Iden
tity
usin
g a K-
mea
ns A
naly
sis
Figu
re C
: the
four
gro
up s
olut
ions
resu
lts in
cat
egor
ies
of lo
w (b
lue)
, low
-mod
erat
e (g
reen
), m
oder
ate
(yel
low
) an
d hi
gh (r
ed).
Figu
re D
: the
five
gro
up s
olut
ion
resu
lts in
cat
egor
ies
of lo
w (b
lue)
, low
-mod
erat
e (g
reen
), an
d hi
gh (r
ed),
but i
s un
able
to s
epar
ate
out t
he m
oder
ate
and
mod
erat
e-hi
gh g
roup
s (y
ello
w-p
urpl
e).
CD
91
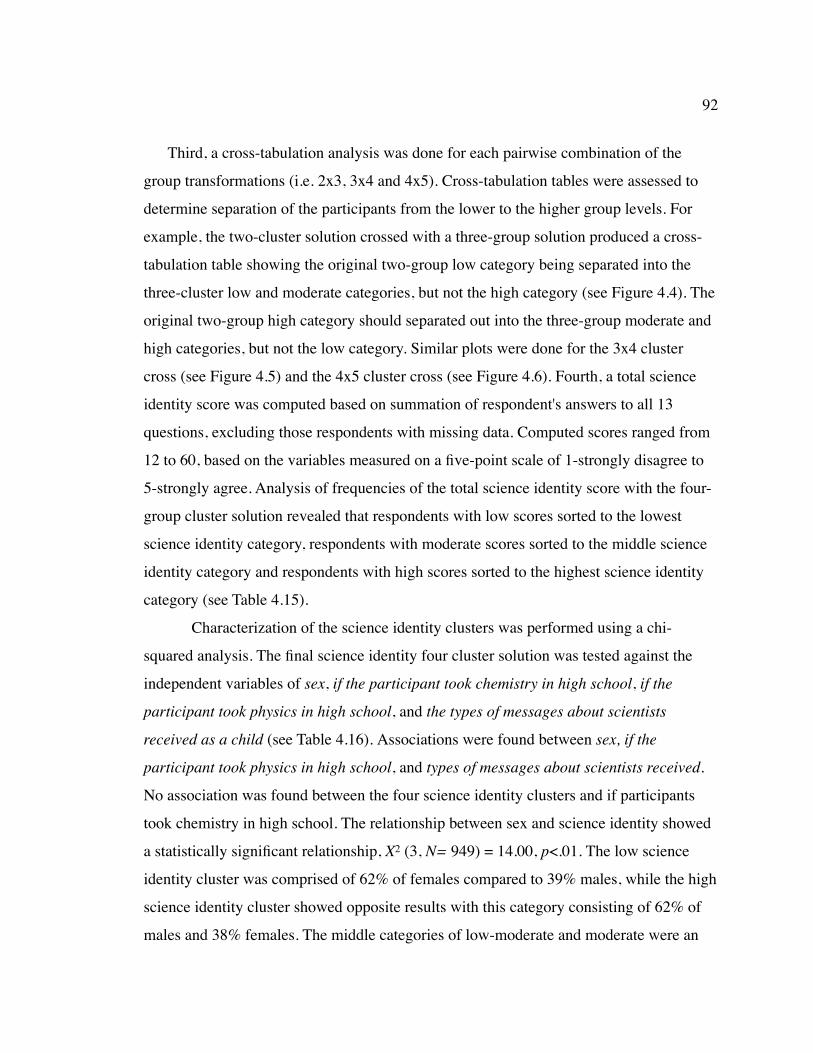
! Third, a cross-tabulation analysis was done for each pairwise combination of the
group transformations (i.e. 2x3, 3x4 and 4x5). Cross-tabulation tables were assessed to
determine separation of the participants from the lower to the higher group levels. For
example, the two-cluster solution crossed with a three-group solution produced a cross-
tabulation table showing the original two-group low category being separated into the
three-cluster low and moderate categories, but not the high category (see Figure 4.4). The
original two-group high category should separated out into the three-group moderate and
high categories, but not the low category. Similar plots were done for the 3x4 cluster
cross (see Figure 4.5) and the 4x5 cluster cross (see Figure 4.6). Fourth, a total science
identity score was computed based on summation of respondent's answers to all 13
questions, excluding those respondents with missing data. Computed scores ranged from
12 to 60, based on the variables measured on a five-point scale of 1-strongly disagree to
5-strongly agree. Analysis of frequencies of the total science identity score with the four-
group cluster solution revealed that respondents with low scores sorted to the lowest
science identity category, respondents with moderate scores sorted to the middle science
identity category and respondents with high scores sorted to the highest science identity
category (see Table 4.15).
! Characterization of the science identity clusters was performed using a chi-
squared analysis. The final science identity four cluster solution was tested against the
independent variables of sex, if the participant took chemistry in high school, if the
participant took physics in high school, and the types of messages about scientists
received as a child (see Table 4.16). Associations were found between sex, if the
participant took physics in high school, and types of messages about scientists received.
No association was found between the four science identity clusters and if participants
took chemistry in high school. The relationship between sex and science identity showed
a statistically significant relationship, X2 (3, N= 949) = 14.00, p<.01. The low science
identity cluster was comprised of 62% of females compared to 39% males, while the high
science identity cluster showed opposite results with this category consisting of 62% of
males and 38% females. The middle categories of low-moderate and moderate were an
92

almost equal split of females and males. Taking physics in high school also showed a
statistically significant relationship, X2 (3, N= 890) = 25.99, p<.001. In the low science
identity category, 65% of the respondents indicated that they did not take physics in high
school, while 64% of the respondents in the high category indicated that they did take
physics in high school. The middle categories of low-moderate and moderate were an
even split of students who did and did not take high school physics. Lastly, students who
received positive messages about science as a child were more likely to be in the
moderate to high science identity categories, with 73% of the students in the moderate
category and 89% of the students in the high category stating they received positive
messages about science growing up. Only 50% of the students in the low and low-
moderate categories received positive messages, with 3% of the students in the low
category receiving negative messages about science. Overall, less than 1% of all the
students that took the survey reported that they received negative messages about science
during childhood.
93
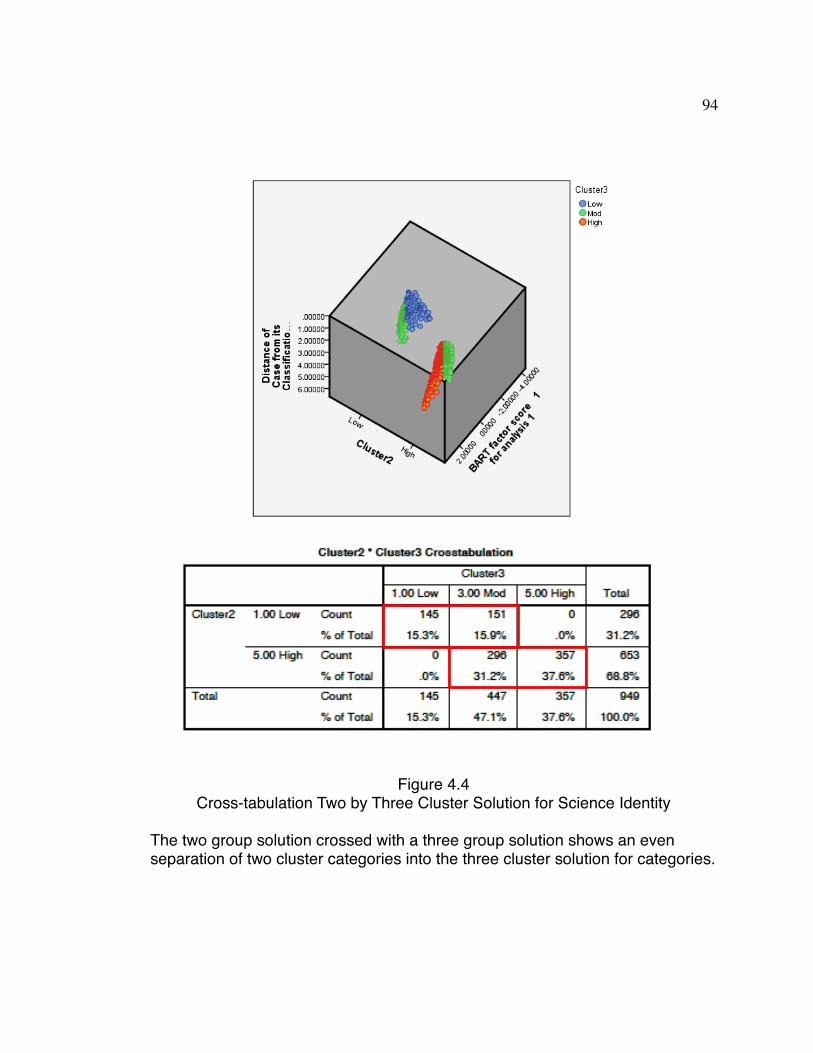
94
Figure 4.4Cross-tabulation Two by Three Cluster Solution for Science Identity
The two group solution crossed with a three group solution shows an even separation of two cluster categories into the three cluster solution for categories.
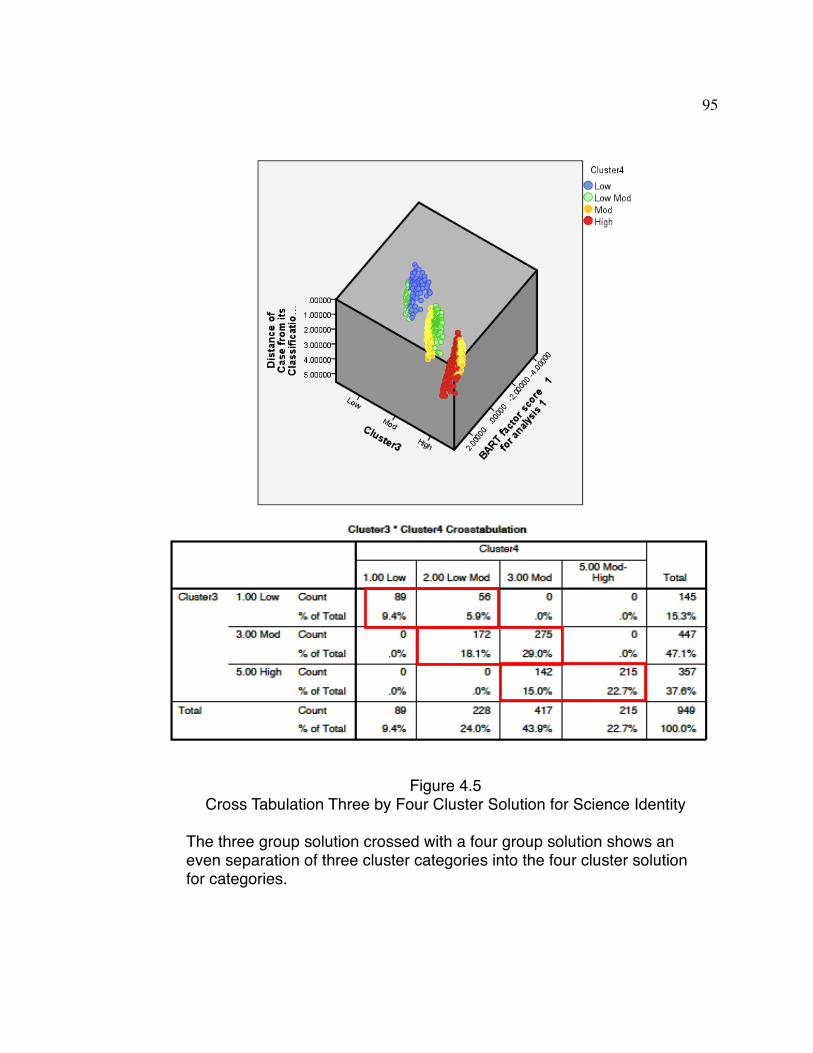
95
Figure 4.5Cross Tabulation Three by Four Cluster Solution for Science Identity
The three group solution crossed with a four group solution shows an even separation of three cluster categories into the four cluster solution for categories.
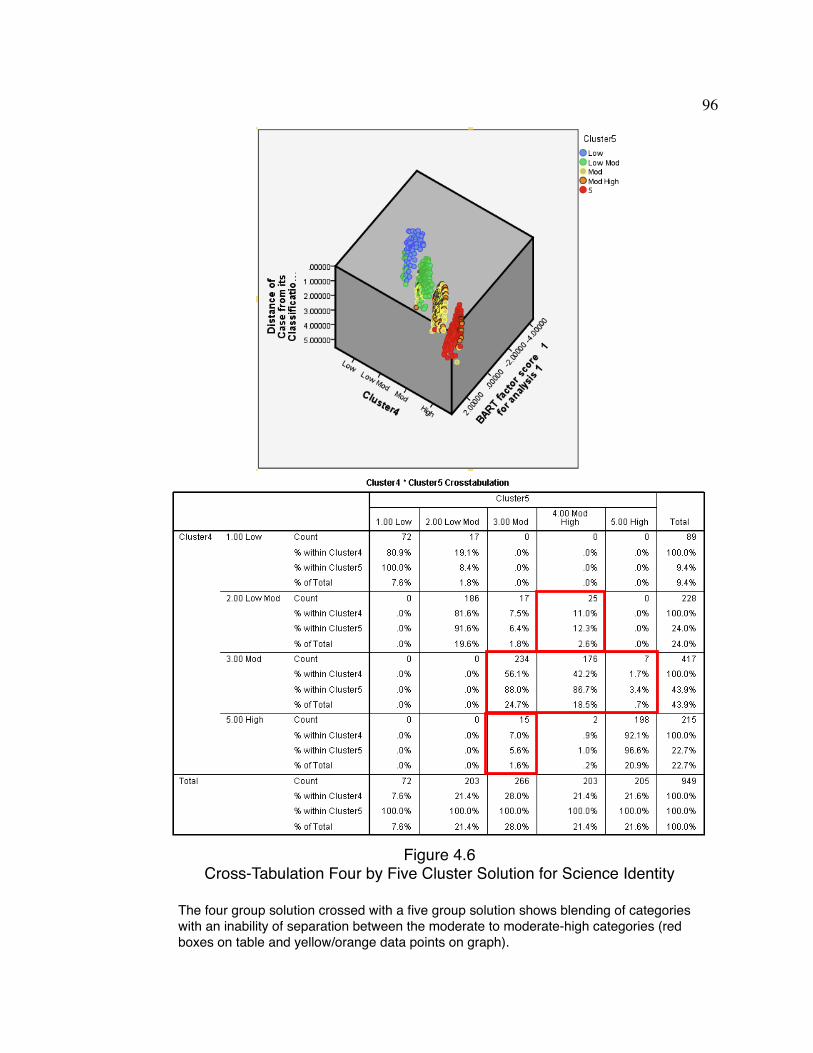
96
Figure 4.6Cross-Tabulation Four by Five Cluster Solution for Science Identity
The four group solution crossed with a five group solution shows blending of categories with an inability of separation between the moderate to moderate-high categories (red boxes on table and yellow/orange data points on graph).

! Table 4.15 Four cluster science identity solution by course type1
! ! !! ! CH10x! ! CH20x! Cluster Type! Sample size! Percentage! Sample size! Percentage! (Science Identity Score2,3) ! (n)! (%) ! (n)! (%)!! Low (12-27)! ! 75 ! (14)! 14! (4)
! Low-moderate (28-37)! ! 152! (27)! 76! (19)
! Moderate (38-47)! ! 230! (41)! 187! (48)
! High (48-60)! ! 99! (18)! 116! (30)
!! Table 4.16 Characteristics of science identity cluster types!! ! ! Science Identity!! ! Low! Low-Mod! Mod! High! X2! p-value1!Cramer's! ! (%) ! (%) ! (%) ! (%) ! V!!! Sex: ! ! ! 14.00! .003*! .12! ! Female! 61! 47! 45! 38!! ! Male! 39! 53! 55! 62! !
! Took HS Chemistry:! ! ! ! ! 1.18! .758! .04! ! No! 23! 18! 18! 17! ! Yes! 78! 82! 83! 83
! Took HS Physics:! ! ! ! ! 25.99! .001*! .20! ! No ! 65! 56! 50! 36! ! Yes! 35! 45! 50! 64
! Messages Received about Scientists2:! ! ! 88.50! .001*! .20! ! Negative! 3! 1! <1.0! <1.0! ! Neutral! 51! 41! 26! 10! ! Positive! 44! 58! 73! 89! ! Other! 3! <1! <1! <1!
97
! 1. X2(3, N=949) = 49.40, p< .001, V= .22; 2.variables measured on a five-point scale of 1= “strongly disagree” to 5= “strongly agree”; 3. score computed by summation of Likert-type value responses on first survey.
! 1. likelihood ratio, items marked with asterisk statistically significant; 2. student's self-reported messages received about scientists as a child.
Participant Interviews
! The semi-structured interview protocol (see Appendix D) which covered 5 subject
areas (in order): leisure and hobby activities, K12 school interests, perceptions of science
(past and present), future goals, and current classroom experiences, was used to interview
21 students about their childhood science experiences and how these experiences
contributed (or not) to their development of interest in science. I compared these
narratives with the student responses on the science identity questionnaire to capture
example quotes of low, moderate and high science identities. Based on the results of the
clustering analysis and the computed science identity scores, a total of 2 low, 5 low-
moderate, 8 moderate and 5 high category responders participated in the interviews (see
Table 4.17). The gender breakdown of the participants was an even split of males and
females, with a higher percentage of females responding in the CH10x group than the
CH20x group.
! Transcripts of the interviews were coded according the five subject areas (leisure and
hobby activities, K12 school interests, perceptions of science (past and present), future
goals, and current classroom experiences). Interviewees were categorized based on their
responses to the science identity questionnaire and were classified as ‘low,’ ‘low-
moderate,’ ‘moderate,’ and ‘high’ responders. Examples quotes from participants in each
of these categories were captured to reflect the example behavior and thinking that
represents the particular level of science identity. The end pages are sample explanations
of individual student responses in relation to their science identity score.
! Students in the low science identity category often stated that they had little or no
exposure to science as a child. They don’t really see science in their lives and don’t
necessarily have an interest. They use little scientific language in their descriptions. Their
future goals are not necessarily science related, but they express a desire to help others.
! Students in the low-moderate science identity category could relate science to a
specific role model. They described science in terms like “research,” “molecules,” or
“atoms,” or try to use scientific language in an appropriate context. They often equated
98
science to school or doing homework. They have thought about some kind of science
related career.
! Students in the moderate science identity category described having hobbies and
interests with some kind of science base or they conferred a sense of curiosity and inquiry
(e.g. “so I started doing stuff like research on my own”). They described science in terms
of being tied to research, using a lot of math, and describing theories. They express a
desire to do well in school and seem to display a sense of competition and concern
regarding their classmates grades. Their future goals have a science theme or have a sense
of self-determination (e.g. wanting to own their own business).
! Students in the high science identity category had interests and hobbies that had a
science theme (e.g. having interests in subjects like astronomy or reading science
magazines). They could describe science in complex, rather theoretical terms and give
rich details (e.g. “try to figure out future results based on data from previous
experiences”). They displayed a sense of curiosity curiosity and desire to know more
about what they are learning. They believe science is important to the world.
!
99

! Table 4.17 Demographics of CH10x and CH20x interview participants! ! !! ! CH10x (n=15) ! ! CH20x (n=7)
! ! Sample size! Percentage! Sample size! Percentage! ! (n)! (%) ! (n)! (%)
! Sex:! Female! 10 ! (67)! 1! (14)! Male! 5 ! (33)! 5! (71)
! Age:! ! 18-22 yrs! 13! (87)! 2! (29)! ! 23-26 yrs! ! 0! (0)! 1! (14)! ! >26 yrs! ! 2! (13)! 4! (57)
! Science Identity1:! ! Low (12-27)2! ! 2! (13)! 0! (0)! ! Low-moderate (28-37)! 5! (33)! 0! (0)! ! Moderate (38-47)! ! 4! (27)! 5! (71)! ! High (48-60)! ! 4! (27)! 2! (29)
100
1. categories based on results of clustering analysis; 2. values correspond to total computed science identity scores
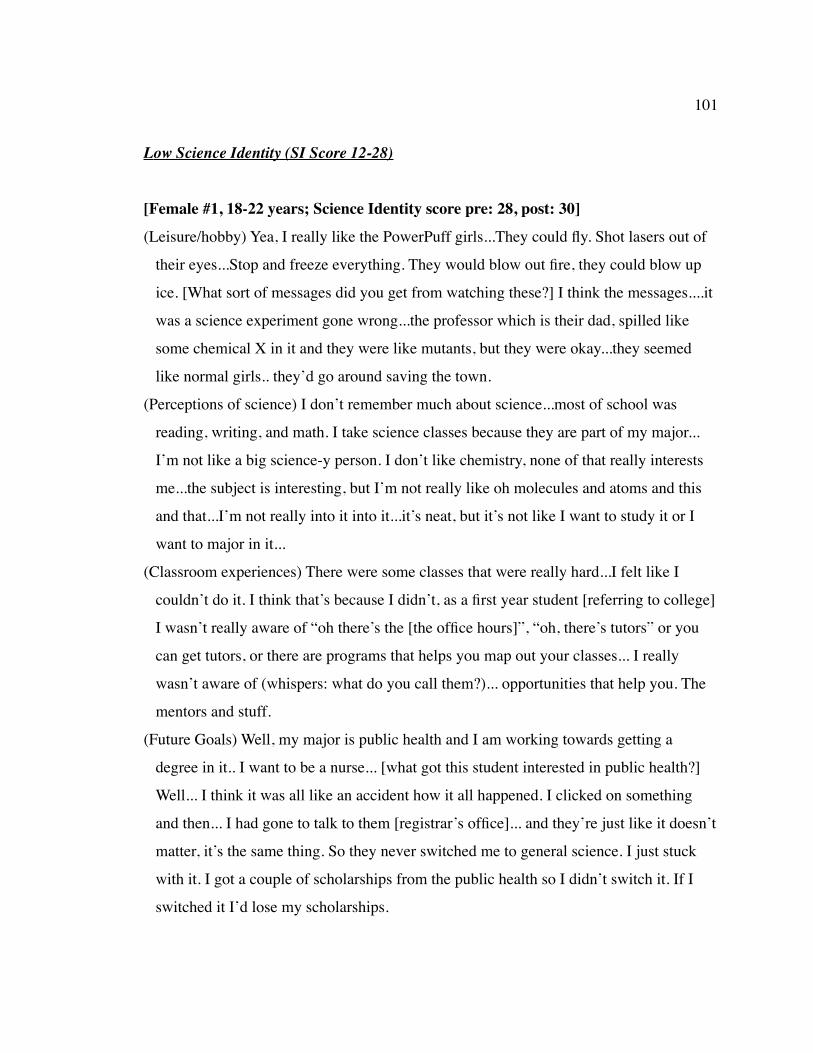
Low Science Identity (SI Score 12-28)
[Female #1, 18-22 years; Science Identity score pre: 28, post: 30]
(Leisure/hobby) Yea, I really like the PowerPuff girls...They could fly. Shot lasers out of
their eyes...Stop and freeze everything. They would blow out fire, they could blow up
ice. [What sort of messages did you get from watching these?] I think the messages....it
was a science experiment gone wrong...the professor which is their dad, spilled like
some chemical X in it and they were like mutants, but they were okay...they seemed
like normal girls.. they’d go around saving the town.
(Perceptions of science) I don’t remember much about science...most of school was
reading, writing, and math. I take science classes because they are part of my major...
I’m not like a big science-y person. I don’t like chemistry, none of that really interests
me...the subject is interesting, but I’m not really like oh molecules and atoms and this
and that...I’m not really into it into it...it’s neat, but it’s not like I want to study it or I
want to major in it...
(Classroom experiences) There were some classes that were really hard...I felt like I
couldn’t do it. I think that’s because I didn’t, as a first year student [referring to college]
I wasn’t really aware of “oh there’s the [the office hours]”, “oh, there’s tutors” or you
can get tutors, or there are programs that helps you map out your classes... I really
wasn’t aware of (whispers: what do you call them?)... opportunities that help you. The
mentors and stuff.
(Future Goals) Well, my major is public health and I am working towards getting a
degree in it.. I want to be a nurse... [what got this student interested in public health?]
Well... I think it was all like an accident how it all happened. I clicked on something
and then... I had gone to talk to them [registrar’s office]... and they’re just like it doesn’t
matter, it’s the same thing. So they never switched me to general science. I just stuck
with it. I got a couple of scholarships from the public health so I didn’t switch it. If I
switched it I’d lose my scholarships.
101

[Female #2, 18-22 years, Science Identity score pre: 28, post 26]
(Leisure/Hobby) I like photography...I’ve done it for 4 or 5 years... it started with a photo
of a bird, my parents encouraged me to enter it into the fair and I got first prize. So, I
got my first real camera... My art teacher in high school introduced me to different
concepts of photography. She helped me enter a scholastic art contest...I got a silver
award for it... I visit my family alot...I do like TV, NetFlicks...most of my activities I do
alone...I’m kinda a lone wolf... I get scared of being judged. (Perceptions of science)
science is what we see, how things hold together and how things are what they are. I
see science mostly in nature... I never heard much about science as a child...
(Perceptions of science) Science is what we see...how things hold together and how
things are what they are..I see science mostly in nature, trees, air, things that we are
constantly influenced by. I wasn’t really around science [as a child]. Both of my grade
schools were lacking in science and math; I have a weak science and math
background... at the schools I have been to, science and math have not been a huge
priority, most have focused on literature and history.
(Classroom experiences) I did poorly with chemistry in high school. When I knew I had
to take chemistry in college I was kinda freaked out...I don’t have much background in
it... so when I see it my mind just freezes, because it [her brain] doesn’t know what it is
looking at, doesn’t want to accept it..it’s kinda like a foreign language.
(Future Goals) I was previously an education major and I transferred into animal science.
Growing up I was always wanted to be a veterinarian..but I was very squeamish of
blood and guts... I knew wanted to be a veterinarian, so I started exposing myself to the
things that made me feel uncomfortable. I realized that I could do this and get over this
and I made the switch, since that is what I always wanted to do.
102
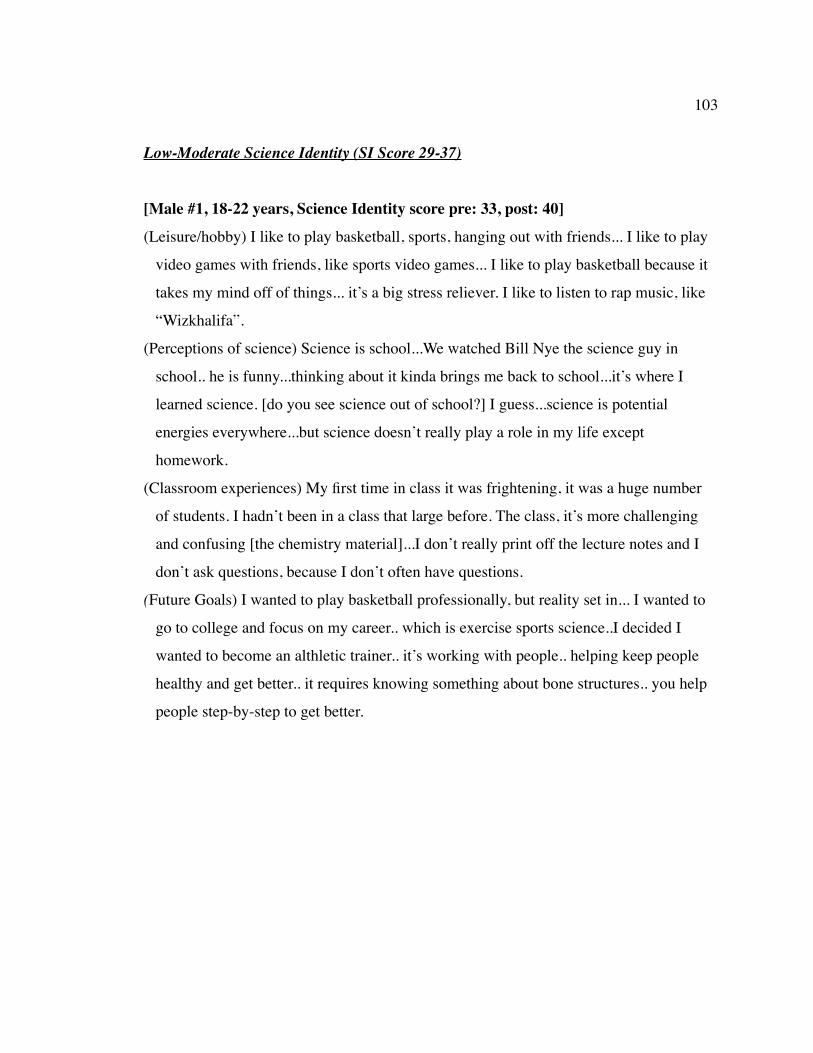
Low-Moderate Science Identity (SI Score 29-37)
[Male #1, 18-22 years, Science Identity score pre: 33, post: 40]
(Leisure/hobby) I like to play basketball, sports, hanging out with friends... I like to play
video games with friends, like sports video games... I like to play basketball because it
takes my mind off of things... it’s a big stress reliever. I like to listen to rap music, like
“Wizkhalifa”.
(Perceptions of science) Science is school...We watched Bill Nye the science guy in
school.. he is funny...thinking about it kinda brings me back to school...it’s where I
learned science. [do you see science out of school?] I guess...science is potential
energies everywhere...but science doesn’t really play a role in my life except
homework.
(Classroom experiences) My first time in class it was frightening, it was a huge number
of students. I hadn’t been in a class that large before. The class, it’s more challenging
and confusing [the chemistry material]...I don’t really print off the lecture notes and I
don’t ask questions, because I don’t often have questions.
(Future Goals) I wanted to play basketball professionally, but reality set in... I wanted to
go to college and focus on my career.. which is exercise sports science..I decided I
wanted to become an althletic trainer.. it’s working with people.. helping keep people
healthy and get better.. it requires knowing something about bone structures.. you help
people step-by-step to get better.
103
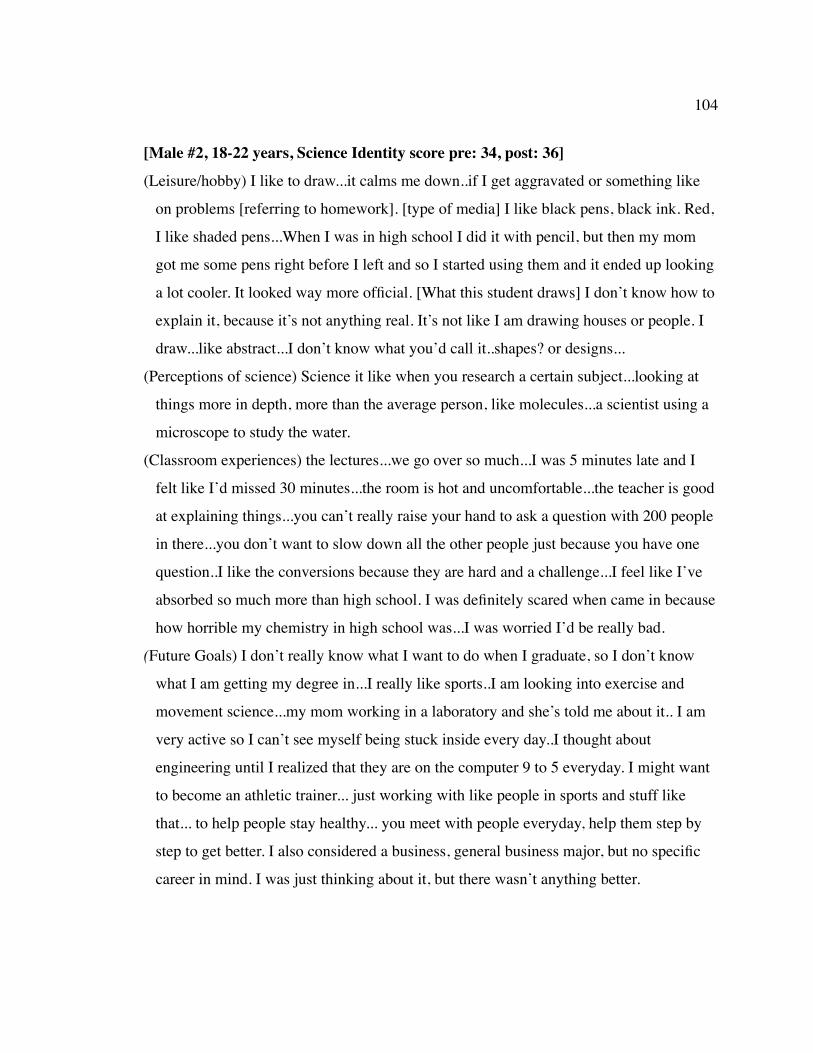
[Male #2, 18-22 years, Science Identity score pre: 34, post: 36]
(Leisure/hobby) I like to draw...it calms me down..if I get aggravated or something like
on problems [referring to homework]. [type of media] I like black pens, black ink. Red,
I like shaded pens...When I was in high school I did it with pencil, but then my mom
got me some pens right before I left and so I started using them and it ended up looking
a lot cooler. It looked way more official. [What this student draws] I don’t know how to
explain it, because it’s not anything real. It’s not like I am drawing houses or people. I
draw...like abstract...I don’t know what you’d call it..shapes? or designs...
(Perceptions of science) Science it like when you research a certain subject...looking at
things more in depth, more than the average person, like molecules...a scientist using a
microscope to study the water.
(Classroom experiences) the lectures...we go over so much...I was 5 minutes late and I
felt like I’d missed 30 minutes...the room is hot and uncomfortable...the teacher is good
at explaining things...you can’t really raise your hand to ask a question with 200 people
in there...you don’t want to slow down all the other people just because you have one
question..I like the conversions because they are hard and a challenge...I feel like I’ve
absorbed so much more than high school. I was definitely scared when came in because
how horrible my chemistry in high school was...I was worried I’d be really bad.
(Future Goals) I don’t really know what I want to do when I graduate, so I don’t know
what I am getting my degree in...I really like sports..I am looking into exercise and
movement science...my mom working in a laboratory and she’s told me about it.. I am
very active so I can’t see myself being stuck inside every day..I thought about
engineering until I realized that they are on the computer 9 to 5 everyday. I might want
to become an athletic trainer... just working with like people in sports and stuff like
that... to help people stay healthy... you meet with people everyday, help them step by
step to get better. I also considered a business, general business major, but no specific
career in mind. I was just thinking about it, but there wasn’t anything better.
104
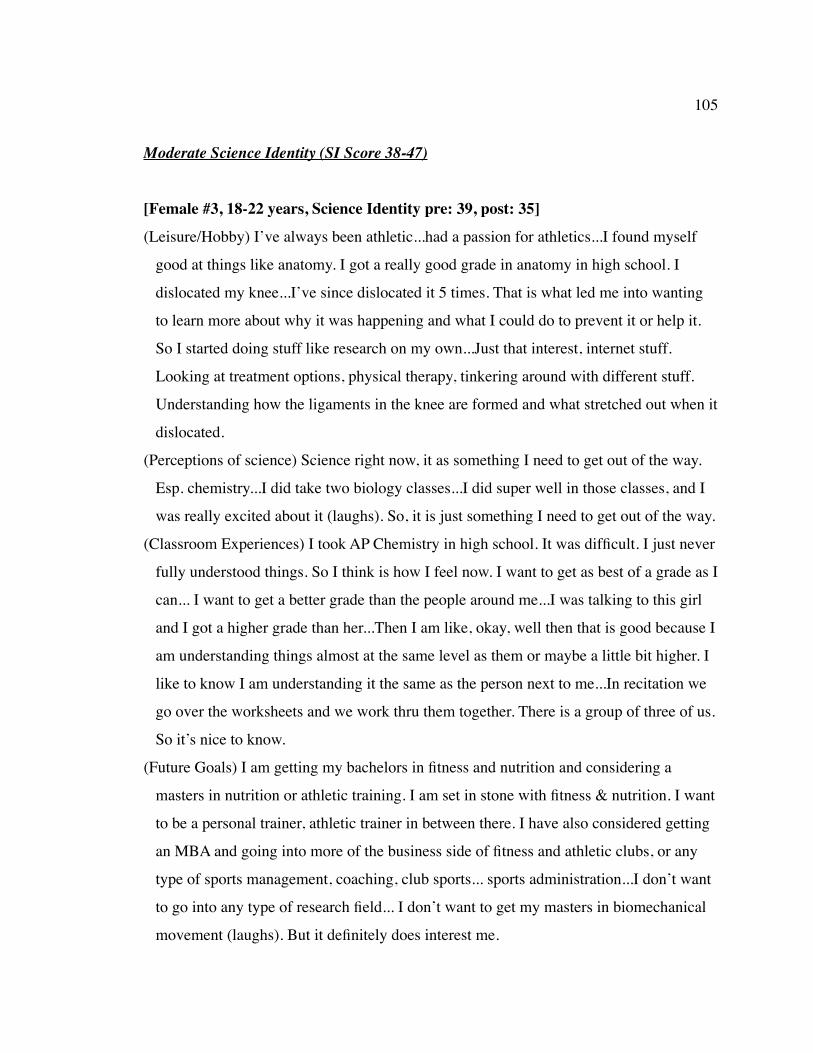
Moderate Science Identity (SI Score 38-47)
[Female #3, 18-22 years, Science Identity pre: 39, post: 35]
(Leisure/Hobby) I’ve always been athletic...had a passion for athletics...I found myself
good at things like anatomy. I got a really good grade in anatomy in high school. I
dislocated my knee...I’ve since dislocated it 5 times. That is what led me into wanting
to learn more about why it was happening and what I could do to prevent it or help it.
So I started doing stuff like research on my own...Just that interest, internet stuff.
Looking at treatment options, physical therapy, tinkering around with different stuff.
Understanding how the ligaments in the knee are formed and what stretched out when it
dislocated.
(Perceptions of science) Science right now, it as something I need to get out of the way.
Esp. chemistry...I did take two biology classes...I did super well in those classes, and I
was really excited about it (laughs). So, it is just something I need to get out of the way.
(Classroom Experiences) I took AP Chemistry in high school. It was difficult. I just never
fully understood things. So I think is how I feel now. I want to get as best of a grade as I
can... I want to get a better grade than the people around me...I was talking to this girl
and I got a higher grade than her...Then I am like, okay, well then that is good because I
am understanding things almost at the same level as them or maybe a little bit higher. I
like to know I am understanding it the same as the person next to me...In recitation we
go over the worksheets and we work thru them together. There is a group of three of us.
So it’s nice to know.
(Future Goals) I am getting my bachelors in fitness and nutrition and considering a
masters in nutrition or athletic training. I am set in stone with fitness & nutrition. I want
to be a personal trainer, athletic trainer in between there. I have also considered getting
an MBA and going into more of the business side of fitness and athletic clubs, or any
type of sports management, coaching, club sports... sports administration...I don’t want
to go into any type of research field... I don’t want to get my masters in biomechanical
movement (laughs). But it definitely does interest me.
105
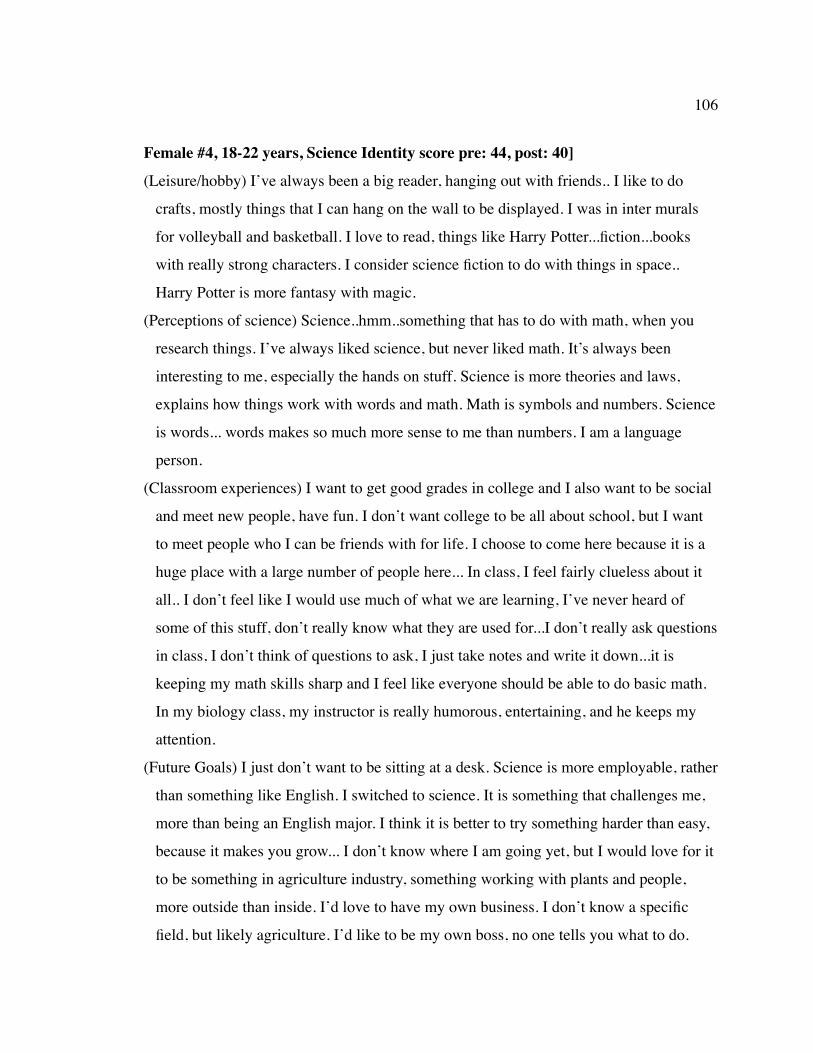
Female #4, 18-22 years, Science Identity score pre: 44, post: 40]
(Leisure/hobby) I’ve always been a big reader, hanging out with friends.. I like to do
crafts, mostly things that I can hang on the wall to be displayed. I was in inter murals
for volleyball and basketball. I love to read, things like Harry Potter...fiction...books
with really strong characters. I consider science fiction to do with things in space..
Harry Potter is more fantasy with magic.
(Perceptions of science) Science..hmm..something that has to do with math, when you
research things. I’ve always liked science, but never liked math. It’s always been
interesting to me, especially the hands on stuff. Science is more theories and laws,
explains how things work with words and math. Math is symbols and numbers. Science
is words... words makes so much more sense to me than numbers. I am a language
person.
(Classroom experiences) I want to get good grades in college and I also want to be social
and meet new people, have fun. I don’t want college to be all about school, but I want
to meet people who I can be friends with for life. I choose to come here because it is a
huge place with a large number of people here... In class, I feel fairly clueless about it
all.. I don’t feel like I would use much of what we are learning, I’ve never heard of
some of this stuff, don’t really know what they are used for...I don’t really ask questions
in class, I don’t think of questions to ask, I just take notes and write it down...it is
keeping my math skills sharp and I feel like everyone should be able to do basic math.
In my biology class, my instructor is really humorous, entertaining, and he keeps my
attention.
(Future Goals) I just don’t want to be sitting at a desk. Science is more employable, rather
than something like English. I switched to science. It is something that challenges me,
more than being an English major. I think it is better to try something harder than easy,
because it makes you grow... I don’t know where I am going yet, but I would love for it
to be something in agriculture industry, something working with plants and people,
more outside than inside. I’d love to have my own business. I don’t know a specific
field, but likely agriculture. I’d like to be my own boss, no one tells you what to do.
106
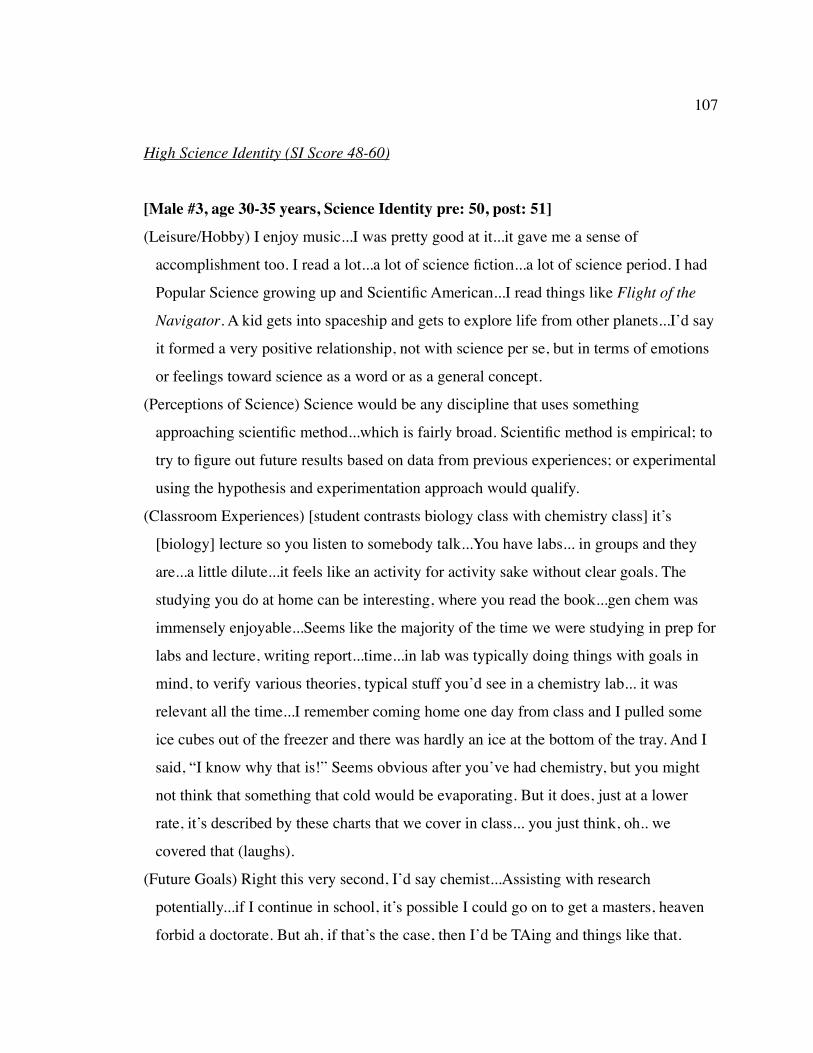
High Science Identity (SI Score 48-60)
[Male #3, age 30-35 years, Science Identity pre: 50, post: 51]
(Leisure/Hobby) I enjoy music...I was pretty good at it...it gave me a sense of
accomplishment too. I read a lot...a lot of science fiction...a lot of science period. I had
Popular Science growing up and Scientific American...I read things like Flight of the
Navigator. A kid gets into spaceship and gets to explore life from other planets...I’d say
it formed a very positive relationship, not with science per se, but in terms of emotions
or feelings toward science as a word or as a general concept.
(Perceptions of Science) Science would be any discipline that uses something
approaching scientific method...which is fairly broad. Scientific method is empirical; to
try to figure out future results based on data from previous experiences; or experimental
using the hypothesis and experimentation approach would qualify.
(Classroom Experiences) [student contrasts biology class with chemistry class] it’s
[biology] lecture so you listen to somebody talk...You have labs... in groups and they
are...a little dilute...it feels like an activity for activity sake without clear goals. The
studying you do at home can be interesting, where you read the book...gen chem was
immensely enjoyable...Seems like the majority of the time we were studying in prep for
labs and lecture, writing report...time...in lab was typically doing things with goals in
mind, to verify various theories, typical stuff you’d see in a chemistry lab... it was
relevant all the time...I remember coming home one day from class and I pulled some
ice cubes out of the freezer and there was hardly an ice at the bottom of the tray. And I
said, “I know why that is!” Seems obvious after you’ve had chemistry, but you might
not think that something that cold would be evaporating. But it does, just at a lower
rate, it’s described by these charts that we cover in class... you just think, oh.. we
covered that (laughs).
(Future Goals) Right this very second, I’d say chemist...Assisting with research
potentially...if I continue in school, it’s possible I could go on to get a masters, heaven
forbid a doctorate. But ah, if that’s the case, then I’d be TAing and things like that.
107

[Male #3, age 30-35 years, Science Identity pre: 51, post: 54]
(Leisure/hobby) I used to do a lot of theater, but I don’t really do that now. It was a fun,
creative outlet. I love listening to music. I am a bit entertainment person. I like sci-fi,
fantasy movies, Lord of the Rings. These interest me because I watch a movie, I don’t
really want it be set in real life, it is more of an escapism for me... something that I can
really immerse myself in, things that are not possible. I also like hanging out with
friends and family. I like being outside in nature, I love natural disasters, volcanoes,
earthquakes. I’ve always been interested in astronomy and stars.
(Perceptions of science) it’s just the way humans describe every aspect of the whole
world, the whole universe that we can see, feel and touch. How we figure out how it
works, what it does, why we see what do and why, how and why things happen.
Science is just a bit whole explanation of the whole universe, divided into endless
sections. It’s one of the big curiosity inducing subjects in education. I feel like science
is an important thing in the world...no matter what, you can’t stifle out science, even if
you don’t believe it, it is going to slap you in the face. It’s always changing and
changing how we view the world.
(Classroom experiences) I had really wonderful teachers throughout high school, that
really helped stimulate my interest in different subject areas, helped broaden my view. I
am not a big fan of chemistry, it’s math related, but my teacher in high school was
really impatient. Labs were stressful, I don’t like dealing with things that are dangerous,
acids, chemicals, toxic. I am really good at chemistry, even though I am not that good at
math. The chemistry math is being applied to something, I am doing something with it.
(Future Goals) I love history, but it’s hard to find a job in history that isn’t teaching or
being a professor. My dream job would be something like Indiana Jones, doing crazy
stuff. If I could do anything, I would go to film school and become a movie director, but
that isn’t very practical. I love nature documentaries, my dream job would be to become
a famous documentarian. I’d like to have some kind of a 9-5 job, in a zoo, animal rehab
center, where I can be with animals every day.
108
CHAPTER 5
DISCUSSION AND CONCLUSION
Synthesis of Results
! The purpose of this study was to determine how the development of a student’s
science identity could be measured through the use of a quantitative instrument. My
hypothesis was that all students enter college with some measure of a science identity, on
a continuum that reflects identity as existing in multiplicities and not as a dichotomous
variable. The second purpose of this study was to measure the effects of using active
engagement strategies on students’ development of a science identity and motivation to
do science within the context of a large lecture environment. I used data collected from
participants in two undergraduate chemistry courses to both test the instrument and gather
information on their developing science identities.
!
RQ1 In what ways can the development of a student’s science identity be measured?
! Consistent with the work by Kaufman and Feldman (2004) and Carlone and Johnson
(2007), I found a strong link between the student responses using the Science Identity
Questionnaire and the pattern in which students could be characterized by levels of a
science identity. Results of a K-means cluster analysis showed that students grouped
according to their total mean score on the Science Identity Questionnaire and that these
results were consistent with predictions that the CH20x students would exhibit higher
science identities, as they are mostly engineering majors. Significant differences were
seen between students’ science identity levels and several demographic questions: gender,
“Did you take physics in high school?”; “Did you take chemistry in high school?”; “What
type of messages did you receive about scientists as a child?” A higher percentage of
males than females scored among the higher levels of science identity which is consistent
with the literature that states men tend to associate with science and to pursue science and
engineering in college over women (Hazari, Sonnert, Sadler, Shanahan, 2009).
109
! A significant difference was seen between students who received positive messages
about scientists and ranked in the higher science identity levels as compared to students
who received neutral or negative messages about scientists. Negative messages about a
discipline would propel students to not choose a course of study in that field. Very few
students responded that they had received negative messages about science, which could
be a testament to the media’s efforts to promote science through children’s shows (e.g.
Sesame Street, Bill Nye the Science Guy) and television programs (e.g. NOVA,
Discovery Channel, and Myth Busters) that depict science and scientists in a positive or
fashionable manner. Hollywood movies that promote fictional characters such as Marvel
Comics’ Tony Stark and his superhero alter-ego, Iron Man, have also promoted the image
of being a scientist as something desirable and “cool.” Students who reported receiving
neutral messages about scientists were more likely to rank in the low to low-moderate
science identity levels than the higher levels and students in the low to low-moderate
levels were equally likely to have received either neutral or positive messages about
scientists (see Table 4.16, p. 97).
! There was a significant relationship between students’ level of science identity and
taking physics in high school, but not in taking chemistry in high school. The number of
students reporting that they took physics in high school compared to those who did not
was almost equal, a demographic finding that was higher than the national average of
36% as reported by the National Center for Education Statistics (NAEP, 2011). A higher
percentage of students scored in the “moderate” to “high” science identity categories if
they reported they took high school physics, while a higher percentage of students scored
in the “low” to “low-moderate” science identity categories if they reported they did not
take high school physics. In comparison, the percentage of students reporting that they
took chemistry in high school had no effect upon their level of science identity, as they
were evenly distributed among the varying levels of science identity. There are two
possible explanations for the findings regarding taking physics in high school. First, this
could be an artifact of sampling. This result could be due to the larger number of females
that scored in the lower science identity category and this is showing up in this question,
110
as women are typically underrepresented in physics. Second, this could be a curriculum
issue. Students were not polled on the location of where they attended high school.
Students coming from rural or under-funded school districts might not have had the
opportunity to take physics in high school.
RQ2: How does group work in lecture affect development of a student’s science identity?
! The CH10x experimental group displayed an overall increase in science identity level
than did the CH10x control group, a finding which may be reflective of the use of group
work. Science identity was statistically different between the CH10x and CH20x groups
at the start of the term, which could be attributed to the fact that the CH20x group
consisted of engineering majors while the CH10x group consisted of non-majors.
! Science identity increased at time two for the CH10x experimental and control
groups, but only the differences between the CH10x control group and the CH20x control
group were statistically significant (See Table 4.12 p. 82). The survey measure at time 2
was given prior to the first midterm, so student optimism regarding exam performance,
the course and their expectations in college were still potentially high. The significant
difference in science identity levels could be equated to the fact that students were
becoming more accustomed to college life and shedding their former roles as high school
students. This time period equated to around week 5 of the 10 week term, a period when
students were becoming more adjusted to college life, lecturing styles, forming new
friendships, and possibly even joining clubs or organizations around campus; these
experiences are both types of cultural interactions and aspects of identity development in
college (Chickering & Reisser, 1993).
! Gee (2004) posits for incorporating identity as an analytical lens, a concept that
Brown (2004) supports as a method of viewing students’ participation with new forms of
cultural interactions. Brown proposed that students progress along a range of scientific
discourse identities which shift as they become more familiar with the content and their
surroundings. Brown defined these discursive identities as four stages: Maintenance
Status, Incorporation Status, Proficiency Status, and Opposition Status. He framed these
111
identities using a sociocultural framework that attributes students’ challenges in the
science classroom with personal identity conflicts (e.g. gender, culture, ethnicity), similar
to the identities that Falk (2009) terms “big I” identities. If students in these chemistry
courses were at a stage where they were becoming comfortable with the course material,
the classroom environment, the instructor’s lecture style, etc... then they could be said to
have arrived at Brown’s (2004) Incorporation Status. Incorporation status means that
students would be actively trying to incorporate the content into their thinking and
behaviors patterns. Use of active engagement work in lecture would provide both a
means to practice incorporation of the content into their thinking and language, and
opportunities for peer-interactions that function as a support mechanism.
! Science identity decreased at time point three, but the decrease was largest for the
CH10x control group. While the CH10x experimental group started out at a slightly
higher level of science identity than the CH10x control group, a finding which is not
explainable by the demographics of this group as both groups had similar gender profiles,
the CH10x experimental group made a larger gain in overall levels of science identity
when compared to the CH10x control group; however, this result was not statistically
significant. The larger overall gain by the CH10x experimental group could be a factor of
using the group work in lecture, as the increased contact with the instructor and peer-to-
peer interactions would help to boost students’ self-efficacy and self-determination. Some
of the students who were interviewed indicated that the group work in lecture also forced
them to get to know their peers, a situation which resulted in the formation of study
groups outside of the classroom. All of these interactions that occurred through the use of
group work in lecture would support activities related to Brown’s (2004) Incorporation
status. Additionally, these group-work interactions are also forms of contextually
constructed social situations that Erikson (1968) viewed as important to the development
of identity and these would help support development of students’ science identity.
! The CH10x experimental group ceased to be statistically different from the CH20x
control group starting at time point two and the CH10x control group, which received the
standard lecture, arrived back at their initial science identity, a finding which was
112
statistically significant. The lack of significant difference between the CH10x
experimental group and the CH20x control group is notable, as this suggests that the
CH10x experimental group’s level of science identity became more like the CH20x
control group’s science identity. Students in the experimental group were given
opportunities via the group work to interact with their peers and the instructor in
practicing scientific discourse related to the chemistry content. These experiences were in
contrast to the CH10x control group who had little interaction with their peers or
instructor, as few students asked questions in class and peer-to-peer interactions were
nonexistent. Thus, the CH10x control group did not have opportunities to practice
scientific discourse or to incorporate the course content into their thinking during lecture.
! Lastly, the CH10x and CH20x groups were unaware of which section or class was the
control or the experimental group alleviating the potential for a Hawthorne effect.
Students were only aware that they were all participating in a research study related to
their chemistry course. I attended the lectures of every section on the days in which group
work was being performed in order to minimize any bias stemming from my presence in
the room. While the CH10x experimental group had a smaller number of participants in
this study compared to the other sections, attendance was not largely different than the
others. The fact that the CH10x experimental group maintained their higher level of
science identity through the end of the term is worthy of further study, especially a
longitudinal study over the course of an entire year or several years to graduation to
determine if students would maintain their gains in science identity.
RQ3: How does group work in lecture effect a student’s motivation (intrinsic, self-
determination, and self-efficacy) in learning science?
! Motivation among the three chemistry groups was not significantly different at any of
the time points. While it was evident from the mean scores for each group that motivation
among all students dropped drastically from the start of the course to the end of the
course, the differences between the groups were not found to be statistically significant.
A correlation of science identity with total motivation was found to be a statistically
113
significant positive relationship, which contradicts the findings of the students’
development of a science identity over time. If the relationship between science identity
and motivation was a positive, direct relationship, then increases in science identity
should reflect increases in motivation. One explanation for this could be that the
questionnaire on motivation was specifically directed at motivation to learn chemistry in
the context of their current class, while the science identity questionnaire was not related
to a specific college course, but focused on science in a person’s life.
! Students answering the science identity questionnaire may not have equated their
science identity specifically with their motivations in learning chemistry (an example of
intrinsic motivation), seeing the two as unrelated constructs. They may also have framed
their responses on the motivation survey in a context unrelated to their major or future
goals (an example of extrinsic motivation), but viewed the survey in terms of their
current experiences in the course (e.g. frustrations with the instruction, teaching assistant,
and exams). Several students in the interviews commented that the chemistry course was
just a requirement or “hurdle” they had to jump. They were just here to get a grade (an
extrinsic motivation). Some even commented that they saw no relevance of the chemistry
course content to their future goals or studies.
! Reitzes and Burke’s (1980) study on the relationship between college student
identities with varying roles (e.g. spouse, graduate student, career, friend) showed that a
person’s identity may motivate them to participate only in activities that the individual
perceives to be useful and valued for a future role. Thus, students in college may only
participate in an activity, whether in class or extra-curricular, that they perceive will
enhance a future role (could be future role as college student, graduate student, future
career role, etc..). Students may then only participate and excel in activities that they
perceive to be relevant to a particular role. If students are discouraged from pursuing
science, or have been convinced that they are not good at doing science (say in the
context of a course where they don’t receive adequate support), then they may abandon
activities and efforts toward that role. Their perceived identity has been disrupted and any
activities that support that former identity are abandoned or perceived to be a waste of
114
time and effort. They may also conclude that the science they are learning is not relevant
to their future role, such as the example from a student in the interviews who commented
that she was interested in becoming a nurse, but could not see how the chemistry she was
learning in the classroom would be useful in a role as a nurse.
! Analysis of the individual motivational factors reflected this view of doing chemistry
for the sake of “jumping a hurdle,” in that the extrinsic motivational factor was seen to be
significantly different between the CH10x and CH20x students. CH10x students
exhibited a higher level of extrinsic motivation than the CH20x students for all time
points, despite extrinsic motivation decreasing for all three groups. Deci, Koestner, and
Ryan (2001) found that extrinsic motivation would diminish intrinsic motivation, despite
their data showing that intrinsic motivation was a better predictor of learning and
achievement. Thus, students will abandon altruistic reasons for learning or taking on
extra study tasks if expected, tangible rewards were available. The intrinsic motivational
factor did not show any significant differences and this may have been due in part to the
extra credit being given for this study and the fact that many students reported taking
these courses merely as a requirement for their degree (an example of extrinsic
motivation).
! While Lin, McKeachie, and Kim (2001) have shown that students reporting high
levels of goal-orientation were also higher in self-efficacy, goal-orientation was not found
to be significantly different for the three groups in this study. Self-efficacy diminished for
all three groups over the time period of the study. The CH10x control and experimental
groups showed significant differences in self-efficacy from the CH20x control group, at
time points one and two respectively. The CH20x control group displayed a higher level
of self-efficacy that was statistically significantly different than the CH10x control group,
but not significantly different than the CH10x experimental group. The differences among
the three were not statistically different and all groups arrived at a similar level of self-
efficacy at the end of the term. !
! Self-efficacy is not a static construct and can be influenced by a variety of factors.
Vicarious experiences, like watching other peers be successful in an activity, can serve to
115
positively influence an individual’s self-efficacy (Bandura, 1977). Self-efficacy can also
be linked to the motivational construct of goal-orientation, in that individuals who believe
their abilities are dynamic and malleable (e.g. can be enhanced through learning) tend to
challenge themselves and pursue complex goals, while individuals who believe their
abilities are static and out of their personal control tend to pursue avoidance goals (e.g.
easily attainable successes, seeking approval from authority figures) (Bandura, 1977;
Deci & Ryan, 2000).
! The fluctuating levels of self-efficacy among the groups in this study are evidence of
the non-static condition of self-efficacy and may be a result of several factors. The
wording of the motivation questionnaire asked questions specifically about motivation to
learn and study in the context of the chemistry classroom. Students with lower levels of
self-efficacy who were pursuing avoidance goals might have found the context of the
large lecture course an obstacle to obtaining immediate approval from instructors.
Ostensibly, the experimental group doing the active engagement work should have
promoted interactions with instructors and provided opportunities for approval from
others, but the treatment was only given once per week. Students were not fastidious
about their attendance in lecture nor in the lectures that they attended. Since attendance
was not mandatory, students may have missed the group work experiences that would
have helped to promote their feelings of self-efficacy. Students who were experiencing
difficulties with the chemistry content, frustrations with the chemistry class, and or with
the instructors would likely have framed their survey responses to reflect these issues. For
example, the material being covered in the course at that time the students took the
surveys may have influenced the results. At the time the second survey was given, the
CH10x groups were learning ideal gas laws and partial pressures, difficult topics for first
year chemistry students that involve a series of math equations. In contrast, the CH20x
students were covering Lewis structures, a task that involves visualization of structural
models and does not require math equations. Math anxiety has been well studied in
college students and Pajares and Kranzler (1995) showed that mathematics self-efficacy
had a strong influence on academic performance. While it has been well-documented that
116
males tend to exhibit a higher self-efficacy than women, the the final self-efficacy scores
were not reflective of the gender distribution among the CH10x and CH20x courses.
Zusho, Pintrich, and Coppola (2003) determined that self-efficacy was a much better
predictor of final grades in a college chemistry course than SAT scores. Final
performance among the CH10x and CH20x courses was similar, reflecting the pattern of
non-significant self-efficacy scores seen at the end of the term. For both courses, students
earning a “C-” grade or higher comprised approximately 81% of the total scores at the
end of term.
! Self-determination, the students’ perceptions of their control over their learning,
decreased at all three time points for all courses. The CH10x control group reported the
highest initial level of self-determination compared to the other two groups, although this
finding was not statistically significant. At the second and third time points, only the
CH10x control group’s self-determination was statistically different from the CH20x
control group. The decreasing levels of self-determination among the groups could be
attributed to the statistically significant differences seen among the students’ extrinsic
motivation. For students that are extrinsically motivated their locus of control resides in
factors outside of themselves, in other words, they exhibit actions and behaviors that are
driven by external rewards and punishments (Bannier, 2010). Students who operate
continually for the sake of extrinsic rewards can experience feelings of both loss of
autonomy and control which often leads to decreased persistence in the activity
(Vansteenkiste, Lens, & Deci, 2006). Several of the students in the interviews commented
that they were taking chemistry only because it was required for their degree and they
were not overly interested in the content or in pursuing a career that required chemistry.
! The CH10x control group, who were not receiving the group work in lecture and did
not receive the added support from the instructors and peer-to-peer interactions, had
higher levels of extrinsic motivation that may have contributed to their differences in self-
determination from the CH20x control group. The CH10x control group may have been
viewing the chemistry only in terms of rewards that allowed them to pass the course in
order to progress in their degrees. For the CH20x control and the CH10x experimental
117
groups, the differences between their self-determination were not statistically significant.
Both of these groups exhibited extrinsic motivation scores that were lower than the
CH10x control group, indicating that these groups were placing less emphasis on external
rewards than the CH10x control group. Despite this finding, the CH10x experimental
group was not statistically different in self-determination from either the CH10x or
CH20x control groups, which may be a reflection of the active-engagement work giving
this group more of a sense of organization and support through the peer-to-peer and
instructor interactions.
! The CH20x exhibited the lowest levels of self-determination which could be
attributed to their engineering major and the required courses they must take their first
term on campus. The engineering curriculum has a pre-designed curriculum outlined for
students and the first term on campus requires these students to be enrolled in differential
calculus, an engineering specific course, the chemistry course and a general level writing
course. Three of these courses (math, chemistry, and writing) are large enrollment courses
and part of the baccalaureate core courses that students are required take to complete a
four year degree at this institution. Engineering students must pass these series of courses
to move on to the next term and stay on track with the program’s curriculum, thus giving
them less of sense of control over what courses they take during a particular term.
! The CH20x control groups’ lowered self-determination as a potential result of their
course curriculum is also expressed in their anxiety motivation scores. This group scored
the lowest out of the three groups for the first time point, indicating that the engineering
students had the highest levels of anxiety at the start of the term. While the CH20x group
started out with the highest levels of anxiety, this group was the only one out of the three
in which their anxiety levels diminished over the course of the term. For the CH10x
students, their anxiety levels continued to increase, although they did not achieve the
lower levels of anxiety being reported by the CH20x students. Again, this is likely due to
the curriculum that the engineering students are required to take. The expectation was
that the group work in lecture would help ease students’ anxiety in doing chemistry, but
this may have been overshadowed by the fact that students were having to adjust to the
118
social and environmental conditions of college which are vastly different from high
school. Students must adjust to differences in lecturing style, large classrooms filled with
students, pressures to achieve high grades, obstacles in forming friendships, and deciding
a path in life or future career. These experiences, when added to the other adjustments
required of first year students in college, are reflective of the crises that Erikson (1968)
viewed as necessary for identity development in adolescents and that Chickering and
Reisser (1993) viewed as necessary for student identity development.
Discussion
! In this study, I compared two groups of students in similar chemistry courses, the
CH10x general chemistry course and the CH20x general chemistry course for
engineering majors. One section of the CH10x course was randomly selected to receive
the experimental treatment of using active-engagement work during lecture. In order to
compare the groups across statistical measures, the comparison required that the groups
be equal. I made attempts to equate the groups and control for confounding variables by
selecting courses that had similar content and students. Both of these chemistry courses
were freshmen, entry-level courses that were part of the baccalaureate-core course
requirements at this institution. Demographics on the students were collected at the start
of the term to assess differences in age, gender, and class standing, which revealed that a
majority of the students in both courses were freshman, between the ages of 18-22 years,
and this was consistent with the demographics for first-year college students. I also relied
on my prior experiences as a teaching assistant in these courses to determine similarities
among the courses and the instructors teaching styles. Both of these courses used
textbooks by the same publisher, covered the same material within a comparable time
frame, were taught in the same lecture hall, and administered exams in a similar format
(e.g. multiple choice, short answer).
! Active-engagement work was chosen as the experimental treatment with the goal of
increasing students’ science identity. The use of active-engagement strategies within the
119

context of a large, lecture course provided an opportunity for students to become
members of a social group in which they could to practice incorporation of the scientific
content into their thinking and language. Being a member of a social group lays the
foundation for developing self-definitions that contribute to personal identities and the
goal was that students’ membership in these social groups would contribute to the
development of their science identity. One problem, however, is that students are often
resistant to active learning strategies, especially when they compare this new method of
instruction to their experiences in high school where they were often told only what they
need to know to pass the course (Felder & Brent, 1996). Students in the experimental
group may have felt they had less control over what and how they were learning, in
addition to frustration, when trying to adapt to this collaborative style of learning.
! Another compounding factor may have been that the frequency of the active-
engagement work was inadequate and posed a threat to students’ self-esteem and their
personal identities. James (1890) viewed self-esteem as a function of personal
achievement proportionate to goals. Thus, if a person’s achievements are high relative to
his goals, then his self-esteem will be high. Cast and Burke (2002) applied James’ view
of self-esteem to identity-verification, by stating that people will modify their identities to
match the perceived meaning of the context with their personal goals. Successful identity
verification results when an individual has matched their view of an identity ideal with
their perception of the environmental meanings to their self-performance in that context
(Cast & Burke, 2002). If students’ in the experimental group were not given time to
become comfortable with the social groups, these interactions may have been perceived
as threats to their identities (e.g. their identity as a competent person), which may have
resulted in a mismatch between their perceptions of how they thought they were doing
(relative to personal identity) and what they thought should be occurring in the situation.
! An individual’s perception of what is occurring in the situation often does not
immediately contribute to permanent identity change or shifts, however individuals do
construct their identities out of a combination of their surroundings, their relationships
with others, and their individual beliefs (Shanahan, 2009). An individual’s membership in
120
a social group may be supported or discouraged by the structure and agency that occurs
within that community, which may effect the formation of a particular identity (Carlone,
2004). While structure and agency can influence identity, a single interesting compelling
experience can also impact identity formation; extreme examples include near-death
experiences or surviving a car or plane accident. People that have lived through such
situations often report radical shifts in their behaviors, thoughts and perceptions of their
surroundings. Erikson (1968) and Marcia (1966) both viewed crisis as a challenge or
motivation for individuals. How an individual responded to the crisis would determine
the direction of their development. An individual’s respond could be commitment or
abandonment of goals, or development of new goals, all of which would lead to some
level of differentiation and individualization for that person (Prager, 1986).
! I viewed the use of the active-engagement in lecture and the resulting formation of
social groups as challenges and motivations similar to Erikson’s (1968) and Marica’s
(1966) perspective, but as a situation not a crisis, where students could explore their little
“i” identities (e.g. who they think they are as a student or what career they want to
pursue. Students enter into college with firm knowledge of their big “I” identities, but
may have limited knowledge of their little “i” identities, which are contextually situated
and can shift or change in response to the specific needs of the moment (Falk, 2009). In
the moment, people will alter their behavior in order to align their perception of
themselves with their identity standard. This process of maintaining an identity standard
is part of an individual’s self-verification process, which is ongoing and links the
individual to the situation (Stets & Burke, 2000). Because these identities are shifting in
context and can be influenced by encouragement or discouragement from self and others,
it may be difficult to capture a little “i” identity like science identity over the short time
frame in which this study was conducted.!
! The science identity instrument developed for this study was designed using a
conceptual framework that situated identity as both individually and socially constructed.
The instrument questions were structured around identity topics from the literature
related to students learning and understanding (a sense of community and belonging in
121
science, goal orientation towards learning science topics, and educational situations and
leisure activities related to doing science) and were situated in three aspects of identity:
performance, competence, and recognition (Carlone & Johnson, 2007; Kaufman &
Feldman, 2004). The questions posed in the instrument were general questions that
students answered in relation to themselves and their beliefs about themselves in science,
and were not tied to a particular course or university setting. Questions were designed to
be easy to comprehend and because they were administered online, students answered the
survey on their own time without authoritative or researcher influence.
! Student responses on the scientity identity instrument indicated a science identity
construct in varying levels on a continuum from low to high. A K-means cluster analysis
was able to group participants into four categories which indicated student responses
were not identical. Responses from the interview data supported the science identity
categories (see Chapter 4). Students in the CH20x group (chemistry for engineers) served
as a positive control for the science identity construct and scored higher on the science
identity instrument than did the CH10 x group (chemistry for non-science majors). While
the CH10x groups had fluctuating levels of science identity, the CH20x group maintained
their level of science identity over the course of the study which supported the hypothesis
that students in the CH20x group would display a higher science identity by virtue of
their engineering majors.
! The short time duration of the study limited the effects that could be generated by
using the experimental treatment. There were small increases in the CH10x control group
relative to the CH10x experimental group that returned to their initial value at the end of
the study. In contrast, the CH10x experimental group also displayed small increases in
their science identity that did not return to their initial baseline value. Because identity is
not a purely static construct, but constantly changing and evolving, there are challenges
associated with the measurement of a science identity construct. One potential challenge
in using a quantitative instrument is determining how much of a change in mean scores
equates to an identity shift. The changes in magnitude of participant mean scores in this
study ranged from .01 to .06, with effect sizes that were “minimal to typical” (Vaske,
122
2008). The responsiveness of an instrument will determine its senstivity in detecting
change over time and evaluating effect sizes is a measure to estimate the magnitude of the
differences. Because science identity has not been measured to any great extent
quantitatively, standard or reference values are not available to determine if the changes
in this study are remarkable. Small differences in students’ self-reported science identity
on a quantitative instrument may equate to rather large differences from a personal
standpoint.
Limitations of the study
! There are several limitations of this study. The sample population was a sample of
convenience and consisted of undergraduates enrolled in two chemistry courses at one
large, public, research institution. While the sample population was selected because a
majority of the participants in these two courses met the age and education level that is
representative of students transitioning into college from high school, this sample may
not be representative of undergraduate populations found at community colleges, small
teaching universities, or private colleges. Thus, generalizability of the results of this study
to these other types of institutions may not be possible without further study. Attendance
in lecture was another limitation in this study. Attendance was not mandatory nor
recorded for either course, so the possibility existed that students were attending different
sections of their respective course on different days. The time frame for both the
experimental treatment and the length of this study was of a short duration. Measuring
science identity over the course of one academic term (10 weeks) and using limited bursts
(25-30 minutes per week) of the experimental treatment may not have been enough time
to simultaneously see large effects from the treatment and to capture emergent science
identities in students. This project does represent an exploratory study that has produced a
novel instrument for tracking students’ science identity over time and has produced some
interesting findings regarding the use of active-engagement pedagogical strategies as a
means of influencing students’ developing science identity. The results from this study
provide a model for future research.
123
Future Work
! This project produced a unique instrument for measuring science identity in
undergraduates. This research contributes to the literature on student identity by
providing a quantitative reference standard for science identity. Further research will
determine the magnitude and frequency of this construct in relation to how a college
students’ science identity changes over time and how classroom experiences impact that
change. This study was conducted over a relatively short time span, which may have
impacted the ability to see large differences in students self-reported science identity.
Expanding this research to a longitudinal study, such as over the course of one or two
school years, and including repeated quantitative data and qualitative interviews would
provide additional evidence for establishing baseline and outcome scores.
! Implementing active-learning strategies in large, lecture courses is always a challenge
and one of the limitations in this study was attendance in these courses. Because the
possibility existed that students were attending different sections of their respective
courses, some students in the experimental group not have received the treatment every
week while some students in the control group may have received the treatment. As, the
intent of the group work was to facilitate social group interactions, further studies
implementing active-learning strategies under controlled attendance conditions are
necessary to determine the effects of the experimental treatment on students’ science
identity. Collaborative activities within social groups in a classroom may facilitate
interactions by pairing lone students with other more gregarious students. The resulting
transformation may be that the lone students are now outgoing, seem to be having fun,
and have shifted their identities based on the group dynamics. These situations provide an
instructor (or researcher) with a perspective on students’ identities with science,
knowledge which they can use to influence the learning environment (Foote & Gau
Bartell, 2011). This lens allows the instructor to develop a way of seeing that can inform
their actions and pedagogies. Being able to view individuals’ identities with this type of
lens helps practitioners see that identities are not static and can be defined by a multitude
124
of characteristics, some of which include location, ethnicity, class and gender (Foote &
Gau Bartell, 2011).
! Because this study was limited to one institution and one science subject, future
studies should examine the development of students’ science identity in different
contexts. Using sample populations from courses such a psychology, biology,
mathematics, and non-science courses like speech communication and writing would be
further contexts in which to explore students’ development of science identity in college.
Research studies done in other types of institutions such as a teaching-only university,
community colleges, and small private colleges are necessary in order to generalize the
results to undergraduates across the US. Additionally, transitioning this work to high
school settings and informal learning contexts would also provide additional validation
data for the instrument that would serve to establish baseline values for science identity.
The high school data would also be useful to STEM recruitment and retention programs
that are required to evaluate the effectiveness of their programs for federal funding. This
study provides a gateway for these types of future studies.
Implications
Science curriculum that supports and encourages students’ science identity addresses
the current atmosphere and problems that students face at that time. Science curriculum is
often treated as something static: a process of lecture, test, rinse, repeat; yet students’
science identity, similar to other little “i” identities (Falk, 2009), are not static, but are
constantly evolving and changing over time. Updating the curriculum would require an
evolution with each subsequent generation, a task that would entail constant monitoring
and adjusting (along with adequate resources for support). This type of framework would
be difficult to implement, because it would mean a paradigm shift from the status quo
curriculum in a period when the economy dictates that higher education institutions
operate efficiently and effectively with reduced resources. However, without some shift
that encourages more students to develop their science identity and embark in science, the
125
US is in danger of rapidly losing ground in maintaining a scientifically literate society.
Carl Sagan (1996) put it rather succinctly, “Science, I maintain, is an absolutely essential
tool for any society with a hope of surviving well into the next century with its
fundamental values intact...science understood and embraced by the entire human
community. And if the scientists will not bring about this, who will?”
! The use of active-engagement techniques (e.g. cooperative and problem based
learning) in large, lecture courses is one method to implement reform in science
education. University introductory science courses that encourage and empower students
to think and behave like scientists, and that include training linked to scientific practices,
could empower students’ development of a science identity. In their daily practice,
scientists conduct experiments, take measurable observations, and confer with colleagues
to make conclusions based on evidence. Designing science courses where students
practice the skills and dialogue of a scientific discipline, and gain an appreciation of
critical thinking, problem solving and decision making, would provide the resources for
non-science and science majors alike to graduate from college knowing how to ask and
answer scientific questions.
! Widespread reform with student centered instruction could also lead to overcoming
institutional and faculty resistance to new models. Implementing active-engagement
strategies in a college science course requires learning new skills for both instructor and
students; skills that take time and practice. There is convincing evidence that a competent
teacher, with good quality curricular materials and resources, makes a major difference in
student performance on standardized evaluations (Allen & Tanner, 2005), and results in
retention of students. In a weak economy, where institutions are striving to do more with
less, retaining students is a top priority. Retaining and recruiting students in STEM fields
has even more broader reaching effects. The outcome may be a more scientifically literate
society, as well as one with more home-grown U.S. STEM workers.
126
Conclusion
! The process by which students mature and develop emotionally in college (i.e.
Student Development Theory, Chickering, 1969; Chickering & Reisser, 1993) is an
important construct, as it can have downstream effects on their approaches to learning,
their conceptions of learning, the careers they choose, and the decisions they make after
college (Carlone & Johnson, 2007; Pascarella & Terezini, 2005). In this study, I used
Chickering’s theory that students progress along seven vectors as they attempt to
establish identity as a framework to understand how college students are in transition
from adolescence to adulthood and how this developmental stage represents a key period
for identity stabilization, specifically stabilization of a science identity.
! Foote (1951) argued that formation of an identity may be influenced by the
negotiation of meanings between individuals in a context (i.e. identity is influenced by
the situation and by others), a thought supported by McCall & Simmons (1978) who state
that identity formation is a give and take process occurring between individuals. Results
from this study suggest that using group work in lecture can create social situations where
students interact with other students, negotiating their understanding of content to
complete an assignment, and at the same time deriving new more robust conceptions.
These methods help students build social capital. Social capital is a characteristic of
settings where students see themselves as part of networks from which they obtain
information and guidance through participation in established social norms. Social capital
has been shown to be important for academic achievement, students’ self-efficacy and
self-esteem, and for retention in college (Brown, Flick, & Fiez, 2009). Students who
already envision themselves in a position as graduate student, professional worker,
doctor, scientist, etc., will seek social situations and network with people in similar
occupations who will help them succeed and reinforce their science image role.
Recognition of their science image role impacts their science identity (Carlone &
Johnson, 2007) which if encouraged and supported during the early stages of college, will
help to establish this identity within the student’s mind supporting the development of
social capital.
127

! If a student is to develop a science identity, then intrinsic motivation, the choices the
student makes, and the social context under which these choices are made will affect the
outcome. For example, the more motivated and outgoing students may sit at the front of a
class. Students, who appear removed from the group, sit at the back of the room and
rarely speak up or ask questions in class or during group work are the ones unlikely to
identity with the tasks and procedures. Instructors may be quick to label these lone
students as unmotivated, uninterested. In a science course, these students’ may have
identities that are reflective of their fears, egos, or inhibitions that make them feel as if
they are outsiders in a group to which they actually belong.
Carlone & Johnson (2007) view a science identity as “fragile, contingent and
situationally emergent” properties that only become stable if recognized as such, in
addition to being habitually accessed and performed. One hopeful outcome of work in
this area is that instructors become aware of personal identity formation as an important
development factor in academic pursuits in general and in science in particular. Such an
awareness among faculty would help decrease situations that influence a transitory
science identity construct and instead result in situations that promote development of a
more stable science identity. Carlone & Johnson do state that science identity is not
purely an emic construct. I extend this argument with the observation that if a science
identity is so easily broken then it is really a completely etic construct, one that is
situational and therefore transient, available to the influences of carefully crafted
curriculum and instruction.
! Lastly, an implication of the above line of reasoning is that science courses can be
designed to integrate students into a discipline’s community of practice (Lave & Wenger,
1991) with the intended result of influencing their science identity and their persistence in
relating to science. In a majority of undergraduate science courses, students are
participants in a learning environment that does not ask them to adopt a science (or
discipline specific) identity, nor does it teach them about the identities of practitioners
within the discipline being studied. Attending to science identity holds the prospect of
128
creating such situations where students can practice roles that they might not otherwise
attempt and to receive meaningful recognition from a scientific community of professors,
scientists, and their peers. Such experiences may influence students’ science identity
leading to continued motivation, persistence, and retention in school.
129
REFERENCES
Abes, E. S., Jones, S. R., & McEwen, M. K. (2007). Reconceptualizing the model of multiple dimensions of identity: The role of meaning-making capacity in the construction of multiple identities. Journal of College Student Development, 48(1), 1-22.
Albanese, M. (2000). Problem based learning: Why curricula are likely to show little effect on knowledge and clinical skills. Medical education, 34(9), 729-738.
Allen, D., & Tanner, K. (2005). Infusing active learning into the large-enrollment biology class: Seven strategies, from the simple to complex. Cell Biology Education, 4(4), 262-268.
Arnett, J. J. (2000). Emerging adulthood: A theory of development from the late teens through the twenties. American Psychologist, 55(5), 469-480.
Aud, S., Hussar, W., Johnson, F., Kena, G., Roth, E., Manning, E., et al. (2012). The Condition of Education 2012 (NCES 2012-045). Washington, DC: U.S. Department of Education, National Center for Education Statistics.
Ausubel, D. P. (1960). The use of advance organizers in the learning and retention of meaningful verbal material. Journal of educational psychology, 51(5), 267.
Babb, K. A., & Ross, C. (2009). The timing of online lecture slide availability and its effect on attendance, participation, and exam performance. Computers & Education, 52(4), 868-881.
Bandura, A. (1977). Self-efficacy: Toward a unifying theory of behavioral change. Psychological Review, 84, 191-215.
Bannier, B. J. (2010). Motivating and assisting adult, online chemistry students: A review of the literature. Journal of Science Education and Technology, 19(3), 215-236.
Barefoot, B. O. (2004). Higher education's revolving door: Confronting the problem of student drop out in US colleges and universities. Open Learning, 19(1), 9-18.
Baxter Magolda, M. B. (2000). Interpersonal Maturity: Integrating Agency and Communion. Journal of College Student Development, 41(2), 141-156.
130
Beach, L. R. (1966). Personality change in the church-related liberal arts college. Psychological Reports, 19(3f), 1257-1258.
Bean, J. P. (1980). Dropouts and turnover: The synthesis and test of a causal model of student attrition. Research in higher education, 12(2), 155-187.
Beede, D., & Langdon, D. (2011). Understanding and Expanding the STEM Workforce. Paper presented at the NASA One Stop Shopping Initiative (OSSI), Chantilly, VA.
Berzonsky, M. D. (1985). Diffusion within Marcia's identity-status paradigm: Does it foreshadow academic problems? Journal of Youth and Adolescence, 14(6), 527-538.
Bieron, J. F., & Dinan, F. J. (2008). Case studies across across a science curriculum. http://ublib.buffalo.edu/libraries/projects/cases/curriculum.html.
Biggs, J. (1996). Enhancing teaching through constructive alignment. Higher Education, 32(3), 347-364.
Blackburn, R. T., Pellino, G. R., Boberg, A., & O'Connell, C. (1980). Are instructional improvement programs off target? Current Issues in Higher Education, 2(1), 32-48.
Bliuc, A.-M., Ellis, R. A., Goodyear, P., & Hendres, D. M. (2011). Understanding student learning in context: Relationships between university students' social identity, approaches to learning, and academic performance. European journal of psychology of education, 1-17.
Bloom, B. S. (1984). The 2 sigma problem: The search for methods of group instruction as effective as one-to-one tutoring. Educational Researcher, 13(6), 4-16.
Bloom, B. S. (1956). Taxonomy of educational objectives: The classification of educational goals (1st ed.] ed. Vol. v.1). New York: Longmans, Green.
Blumer, H. (1969). Symbolic interactionism: Perspective and method. University of California Press.
Bodner, G. M., & Orgill, M. K. (2007). Theoretical Frameworks for Research in Chemistry/Science Education. Pearson Education.
Boice, R. (2000). Advice for new faculty members: Nihil nimus.
Bond, N., & Falk, J. H. (2012). Tourism and identity-related motivations: Why am I here (and not there)? International Journal of Tourism Research.
131

Bower, J. A. (2005). Scientists and science education reform: Myths, methods and madness. Pasadena Capsi Project http://www.nationalacademies.org/rise/backg2a.htm.
Bransford, J. D., Brown, A. L., & Cocking, R. R. (2000). How people learn. National Academy Press Washington, DC.
Brearley, H. C. (1959). College classroom teaching: Problems and procedures. Peabody Journal of Education, 37(2), 66-76.
Brophy, J. (1987). Synthesis of Research on Strategies for Motivating Students to Learn. Educational leadership, 45(2), 40-48.
Brown, B. A. (2004). Discursive identity: Assimilation into the culture of science and its implications for minority students. Journal of Research in Science Teaching, 41(8), 810-834.
Brown, S., Flick, L., & Fiez, T. (2009). An investigation of the presence and development of social capital in an electrical engineering laboratory. Journal of Engineering Education, 98(1), 93-102.
Bucholtz, M., & Hall, K. (2005). Identity and interaction: A sociocultural linguistic approach. Discourse studies, 7(4-5), 585-614.
Bugelski, R., & Lester, O. P. (1940). Changes in attitudes in a group of college students during their college course and after graduation. The Journal of Social Psychology, 12(2), 319-332.
Bunce, D. M. (1993). Symposium: Lecture and learning: Are they compatible? Journal of Chemical Education, 70(3), 179-180.
Burke, P. J., & Stets, J. E. (2009). Identity theory (1st ed. Vol. 1). New York: Oxford University Press, USA.
Burke, P. J. (1980). The self: Measurement requirements from an interactionist perspective. Social psychology quarterly, 18-29.
Burke, P. J., & Reitzes, D. C. (1991). An identity theory approach to commitment. Social Psychology Quarterly, 54(3), 239-251.
Burke, P. J. (1991). Identity processes and social stress. American Sociological Review, 56(6), 836-849.
132
Burmila, E., M. (2010). Graduate students as independent instructors: Seven things to know about teaching your own course while in graduate school. PS: Political Science & Politics, 43(03), 557-560.
Bye, D., Pushkar, D., & Conway, M. (2007). Motivation, interest, and positive affect in traditional and nontraditional undergraduate students. Adult Education Quarterly: A Journal of Research and Theory, 57(2), 141-158.
Byrne, M., & Flood, B. (2005). A study of accounting students’ motives, expectations and preparedness for higher education. Journal of Further and Higher Education, 29(2), 111-124.
Callele, D., & Makaroff, D. (2006). On teaching to the masses and the masters: Competing requirements for undergraduate education. Paper presented at the Western Canadian Conference on Computing Education (WCCCE), Calgary, AB, Canada.
Campbell, D. T., & Stanley, J. C. (1963). Experimental and quasi-experimental designs for research. Chicago: R. McNally.
Carlone, H. B. (2004). The cultural production of science in reform-based physics: Girls' access, participation, and resistance. Journal of Research in Science Teaching, 41(4), 392-414.
Carlone, H. B., & Johnson, A. (2007). Understanding the science experiences of successful women of color: Science identity as an analytic lens. Journal of Research in Science Teaching, 44(8), 1187-1218.
Cast, A. D., & Burke, P. J. (2002). A theory of self-esteem. Social forces, 80(3), 1041-1068.
Center for Institutional Data Exchange and Analysis [C-IDEA]. (2000). 1999-2000 SMET retention report. University of Oklahoma: Norman.
Chang, M. J., Eagan, M. K., Lin, M. H., & Hurtado, S. (2011). Considering the Impact of Racial Stigmas and Science Identity: Persistence among Biomedical and Behavioral Science Aspirants. Journal of Higher Education, 82(5), 564-596.
Chaplin, S. (2009). Assessment of the impact of case studies on student learning gains in an introductory biology course. Journal of College Science Teaching, 39(1), 72-79.
Chickering, A. W. (1969). Education and identity (1st ed.). San Francisco: Jossey-Bass.
133
Chickering, A. W., & Reisser, L. (1993). Education and identity (2nd ed.). San Francisco: Jossey-Bass.
Cobb, P. (2004). Mathematics, literacies, and identity. Reading Research Quarterly, 39(3), 333-337.
Cohen, J. (1988). Statistical power analysis for the behavioral sciences (2nd ed. ed.). Hillsdale, N.J.: L. Erlbaum Associates.
College Board. (2011). 2011 College-Bound Seniors: Total Group Profile Report. http://professionals.collegeboard.com/profdownload/cbs2011_total_group_report.pdf.
Colliver, J. A. (2000). Effectiveness of problem-based learning curricula: Research and theory. Academic Medicine, 75(3), 259-266.
Cooper, J. L., & Robinson, P. (Eds.). (2000). The argument for making large classes seem small.
Costin, F. (1972). Lecturing versus other methods of teaching: A review of research. British Journal of Educational Technology, 3(1), 4-31.
Craig, S., Graesser, A., Sullins, J., & Gholson, B. (2004). Affect and learning: An exploratory look into the role of affect in learning with AutoTutor. Journal of Educational Media, 29(3), 241-250.
Crouch, C. H., & Mazur, E. (2001). Peer instruction: Ten years of experience and results. American Journal of Physics, 69, 970.
Csikszentmihalyi, M. (1997). Finding flow: The psychology of engagement with everyday life. New York: HarperCollins.
Csikszentmihalyi, M. (1993). The Evolving Self: Psychology for the Third Millennium, A. HarperCollins.
Cuseo, J. (1998). Lectures: their place and purpose. Cooperative Learning and College Teaching, 9(1), 2.
Daniels, H. (1994). Literature circles: Voice and choice in the student-centered classroom. Stenhouse Publishers York, ME.
Daniels, H., Cole, M., & Wertsch, J. V. (2007). The Cambridge Companion to Vygotsky. Cambridge University Press.
134

Deaux, K., & Burke, P. (2010). Bridging Identities. Social Psychology Quarterly, 73(4), 315-320.
Deci, E. L., Koestner, R., & Ryan, R. M. (2001). Extrinsic rewards and intrinsic motivation in education: Reconsidered once again. Review of Educational Research, 71(1), 1-27.
Deci, E. L., & Ryan, R. M. (2000). The "what" and "why" of goal pursuits: Human needs and the self-determination of behavior. Pyschological Inquiry, 11(4), 227-268.
Deci, E. L., Vallerand, R. J., Pelletier, L. G., & Ryan, R. M. (1991). Motivation and education: The self-determination perspective. Educational Psychologist, 26(3), 325-346.
Druger, M. (1998). Creating a motivational learning environment in science. Journal of College Science Teaching, 30(4), 222-224.
Eberbach, C., & Crowley, K. (2009). From everyday to scientific observation: How children learn to observe the biologist’s world. Review of Educational Research, 79(1), 39-68.
Eccles, J. (2009). Who am I and what am I going to do with my life? Personal and collective identities as motivators of action. Educational Psychologist, 44(2), 78-89.
Ericsson, K. A., Krampe, R. T., & Tesch-Romer, C. (1993). The role of deliberate practice in the acquisition of expert performance. Psychological review, 100(3), 363.
Erikson, E. H. (1950). Childhood and society.
Erikson, E. H. (1968). Identity: Youth and crisis (7). WW Norton & Company.
Exeter, D. J., Ameratunga, S., Ratima, M., Morton, S., Dickson, M., Hsu, D. et al. (2010). Student engagement in very large classes: The teachers’ perspective. Studies in Higher Education, 35(7), 761-775.
Falk, J. H. (2009). Identity and the museum visitor experience. Left Coast Press.
Faw, V. (1949). A psychotherapeutic method of teaching psychology. American Psychologist, 4(4), 104.
Felder, R. M., & Brent, R. (1996). Navigating the bumpy road to student-centered instruction. College teaching, 44(2), 43-47.
135
Felder, R. M., Brent, R., & Prince, M. J. (2011). Engineering instructional development: Programs, best practices, and recommendations. Journal of Engineering Education, 100(1), 89-122.
Felder, R. M. (1993). Reaching the second tier: Learning and teaching styles in college science education. Journal of College Science Teaching, 22(5), 286-290.
Felder, R. M., & Silverman, L. K. (1988). Learning and teaching styles in engineering education. Engineering Education, 78(7), 674-681.
Feldman, K. A. (1972). Some theoretical approaches to the study of change and stability of college students. Review of Educational Research, 42(1), 1-26.
Field, A. (2009). Discovering statistics using SPSS. Sage Publications Limited.
Foote, M., & Gau Bartell, T. (2011). Pathways to equity in mathematics education: How life experiences impact researcher positionally. Educational Studies in Mathematics, 1-24.
Foote, N. N. (1951). Identification as the basis for a theory of motivation. American Sociological Review, 16(1), 14-21.
Gardiner, L. F. (1994). Redesigning Higher Education: Producing Dramatic Gains in Student Learning. ASHE-ERIC Higher Education Report No. 7. ERIC.
Gee, J. (2000). Identity as an analytic lens for research in education. Review of Research in Education, 25, 99-125.
Giddens, A. (1991). Modernity and self-identity: Self and society in the late modern age. Stanford, CA: Stanford University Press.
Gleason, P. (1983). Identifying identity: A semantic history. The Journal of American History, 69(4), 910-931.
Glynn, S. M., & Koballa, T. R., Jr. (2006). Motivation to learn in college science. In J. J. Mintzes & W. H. Leonard (Eds.), Handbook of college science teaching (pp. 25-32). Arlington, VA: National Science Teachers Association Press.
Glynn, S. M., Taasoobshirazi, G., & Brickman, P. (2007). Nonscience majors learning science: A theoretical model of motivation. Journal of Research in Science Teaching, 44(8), 1088-1107.
136
Glynn, S. M., Taasoobshirazi, G., & Brickman, P. (2009). Science motivation questionnaire: Construct validation with nonscience majors. Journal of Research in Science Teaching, 46(2), 127-146.
Gogolin, L., & Swartz, F. (1992). A quantitative and qualitative inquiry into the attitudes toward science of nonscience college students. Journal of Research in Science Teaching, 29(5), 487-504.
Gutierrez, K. D., & Rogoff, B. (2003). Cultural ways of learning: Individual traits or repertoires of practice. Educational Researcher, 32(5), 19-25.
Hake, R. R. (1998). Interactive-engagement versus traditional methods: A six-thousand-student survey of mechanics test data for introductory physics courses. American journal of Physics, 66, 64.
Harackiewicz, J. M., & Elliot, A. J. (1993). Achievement goals and intrinsic motivation. Journal of personality and social psychology, 65(5), 904.
Hazari, Z., Sonnert, G., Sadler, P. M., & Shanahan, M.-C. (2010). Connecting High School Physics Experiences, Outcome Expectations, Physics Identity, and Physics Career Choice: A Gender Study. Journal of Research in Science Teaching, 47(8), 978-1003.
Healey, J. E. (1950). The Medieval Univeristy. CCHA Report, 17, 65-77.
Herreid, C. F. (2007). Start with a story: The case study method of teaching college science. Arlington, Va: NSTA Press.
Hidi, S., & Renninger, K. A. (2006). The four-phase model of interest development. Educational Psychologist, 41(2), 111-127.
Hutcheson, G. D., & Sofroniou, N. (1999). The multivariate social scientist: Introductory statistics using generalized linear models. SAGE Publications Limited.
James, W. (1890). Principles of Psychology. New York: Holt Rinehart and Winston.
Johnson, D. W., Johnson, R. T., & Smith, K. A. (1998). Active learning: Cooperation in the college classroom. Edina, MN: Interaction Book Company.
Johnson, G. M. (1996). Faculty differences in university attrition: A comparison of the characteristics of arts, education and science students who withdrew from undergraduate programs. Journal of Higher Education Policy and Management, 18(1), 75-91.
137
Jones, S. R., & McEwen, M. K. (2000). A conceptual model of multiple dimensions of identity. Journal of College Student Development, 41(4), 405-414.
Josselson, R. (1996). Revising herself: The story of women's identity from college to midlife. Oxford University Press.
Kaiser, H. F. (1974). An index of factorial simplicity. Psychometrika, 39(1), 31-36.
Kaufman, P., & Feldman, K. A. (2004). Forming identities in college: A sociological approach. Research in Higher Education, 45(5), 463-496.
Kessels, U., & Taconis, R. (2012). Alien or alike? How the perceived similarity between the typical science teacher and a student's self-image correlates with choosing science at school. Research in Science Education, 42(6), 1049-1071.
Kozoll, R. H., & Osborne, M. D. (2004). Finding meaning in science: Lifeworld, identity, and self. Science Education, 88(2), 157-181.
Lave, J., & Wenger, E. (1991). Situated learning: Legitimate peripheral participation. New York, NY: Cambridge University Press.
Lin, Y.-G., McKeachie, W. J., & Kim, Y. C. (2001). College student intrinsic and/or extrinsic motivation and learning. Learning and Individual Differences, 13(3), 251-258.
Locke, J. (1693). Some thoughts concerning education. London: A. & J. Churchill.
Lounsbury, J. W., Huffstetler, B. C., Leong, F. T. L., & Gibson, L. W. (2005). Sense of identity and collegiate academic achievement. Journal of College Student Development, 46(5), 501-514.
Lounsbury, J. W., Saudargas, R. A., & Gibson, L. W. (2004). An investigation of personality traits in relation to intention to withdraw from college. Journal of College Student Development, 45(5), 517-534.
Lundeberg, M. A., & Yadav, A. (2006). Assessment of case study teaching: Where do we go from here? Part 1. Journal of College Science Teaching, 35(5), 10-13.
Luyckx, K., Goossens, L., & Soenens, B. (2006). A developmental contextual perspective on identity construction in emerging adulthood: Change dynamics in commitment formation and commitment evaluation. Developmental psychology, 42(2), 366.
138
Lyon, D. C., & Lagowski, J. J. (2008). Effectiveness of facilitating small-group learning in large lecture classes. Journal of Chemical Education, 85(11), 1571.
MacQueen, J. (1967). Some methods for classification and analysis of multivariate observations. Paper presented at the Proceedings of the fifth Berkeley symposium on mathematical statistics and probability.
Marcia, J. E. (1966). Development and validation of ego identity status. Journal of personality and social psychology, 3(5), 551-558.
Marcia, J. E. (1980). Identity in adolescence. Handbook of adolescent psychology, 9, 159-187.
Markus, H., & Kunda, Z. (1986). Stability and malleability of the self-concept. Journal Personal Social Psychology, 51(4), 858-866.
Mazur, E. (2009). Farewell, lecture. Science, 323(5910), 50-51.
McCall, G. J., & Simmons, J. L. (1978). Identities and interactions: An examination of human associations in everyday life (Rev. ed.).
McCaslin, M. (2009). Co-regulation of student motivation and emergent identity. Educational Psychologist, 44(2), 137-146.
McDaniel, C., & Graham, S. W. (2001). Student Retention in an Historically Black Institution. College Student Journal, 35, 143-154.
McKeachie, W. J. (1990). Research on college teaching: The historical background. Journal of Educational Psychology, 82(2), 189.
McKeachie, W. J., Lin, G. Y., Forrin, B., & Teevan, R. (1960). Individualized teaching in elementary psychology. Journal of Educational Psychology, 51(5), 285-291.
McKeachie, W. J. (2011). McKeachie's teaching tips: Strategies, research, and theory for college and university teachers (13th ed. ed.). Belmont, CA: Wadsworth, Cengage Learning.
McWilliam, E., Poronnik, P., & Taylor, P. (2008). Re-designing science pedagogy: Reversing the flight from science. Journal of Science Education and Technology, 17(3), 226-235.
Mead, G. H. (1934). Mind, self, and society from the perspective of a social behaviorist. University of Chicago, Chicago.
139

Mead, M. (1961). The human study of human beings. Science, 133, 163.
Meyer, D. K. (1993). Recognizing and changing students' misconceptions: An instructional perspective. College Teaching, 41(3), 104-08.
Mikkonen, J., Heikkila, A., Ruohoniemi, M., & Lindblom-Ylanne, S. (2009). "I study because I'm interested": University students' explanations for their disciplinary choices. Scandinavian Journal of Educational Research, 53(3), 229-244.
Moll, L. C. (1990). Vygotsky and education: Instructional implications and applications of sociohistorical psychology. Cambridge University Press.
Mulryan-Kyne, C. (2010). Teaching large classes at college and university level: Challenges and opportunities. Teaching in Higher Education, 15(2), 175-185.
Muuss, R. E. H. (1996). Theories of adolescence. New York: McGraw Hill.
National Assessment of Educational Progress (NAEP). (2011). Institute for a competitive workforce: STEM education talking points. U.S. Department of Education, Institute of Education Sciences, National Center for Education Statistics.
Nunnally, J. C., & Bernstein, I. H. (1994). Psychometric theory (3rd ed. ed. Vol. McGraw-Hill series in psychology). New York: McGraw-Hill.
Organization for Economic Co-operation and Development (OCED). (2010). PISA 2009 Results: What Students Know and Can Do - Student Performance in Reading, Mathematics, and Science (1). Washington, D.C.
Pajares, F. (2008). Motivational role of self-efficacy beliefs in self-regulated learning. In D. H. Schunk & B. J. Zimmerman (Eds.), Motivation and self-regulation: Theory, research, and applications (pp. 111-140). New York: Lawrence Erlbaum Associates.
Pajares, F., & Kranzler, J. (1995). Self-efficacy beliefs and general mental ability in mathematical problem-solving. Contemporary Educational Psychology, 20(4), 426-443.
Palinscar, A. S., & Brown, A. L. (1984). Reciprocal teaching of comprehension-fostering and comprehension-monitoring activities. Cognition and instruction, 1(2), 117-175.
Pascarella, E., & Terenzini, P. (2005). How college affects students: Findings and insights from twenty years of research. Volume 2. A third decade of research.
Pearson Publishing. (2013). Mastering Chemistry. http://www.pearsonhighered.com/.
140
Peddiwell, J. A. (1939). The saber-tooth curriculum. McGraw-Hill New York.
Perkins, D. N., & Simmons, R. (1988). Patterns of misunderstanding: An integrative model for science, math, and programming. Review of Educational Research, 58(3), 303-326.
Pintrich, P. R. (2003). A motivational science perspective on the role of student motivation in learning and teaching contexts. Journal of Educational Psychology, 95(4), 667-686.
Prager, K. J. (1986). Identity development, age, and college experience in women. The Journal of genetic psychology, 147(1), 31-36.
Prince, M. (2004). Does active learning work? A review of the research. Journal of engineering education, 93(3), 223-231.
Qin, Z., Johnson, D. W., & Johnson, R. T. (1995). Cooperative versus competitive efforts and problem solving. Review of educational Research, 65(2), 129-143.
Reisberg, R., Raelin, J. A., Bailey, M., Hamann, J. C., Whitman, D., & Pendleton, L. (2011). The Effect of Contextual Support in the First Year on Self-Efficacy in Undergraduate Engineering Programs. Paper presented at the 2011 American Society for Engineering Education Annual Conference.
Reiser, B., Berland, L., & Kenyon, L. (2012). Engaging students in the scientific practices of explanation and argumentation. Science and Children, 49(8), 8-13.
Reitzes, D. C., & Burke, P. J. (1980). College student identity: Measurement and implications. The Pacific Sociological Review, 23(1), 45-66.
Reuler, J. B., & Nardone, D. A. (1994). Role modeling in medical education. Western journal of medicine, 160(4), 335.
Rydell, R. J., McConnell, A. R., & Beilock, S. L. (2009). Multiple social identities and stereotype threat: Imbalance, accessibility, and working memory. Journal of personality and social psychology, 96(5), 949.
Sagan, C. (1996). The demon-haunted world: Science as a candle in the dark. Headline New York.
Saklofske, D. H., & Zeidner, M. (1995). International handbook of personality and intelligence. Springer.
141

Salinas, M. F. (2008). From Dewey to Gates: A Model to Integrate Psychoeducational Principles in the Selection and Use of Instructional Technology. Computers & Education, 50(3), 652-660.
Schachter, E. P., & Rich, Y. (2011). Identity Education: A Conceptual Framework for Educational Researchers and Practitioners. Educational Psychologist, 46(4), 222-238.
Schibeci, R. A., & Riley, J. P. (1986). Influence of Students' Background and Perceptions on Science Attitudes and Achievement. Journal of Research in Science Teaching, 23(3), 177-187.
Schiefele, U. (1991). Interest, learning, and motivation. Educational psychologist, 26(3-4), 299-323.
Seligman, E. R. A., & Johnson, A. S. (1935). Encyclopaedia of the social sciences (15v). New York: Macmillan Publishers.
Seymour, E., & Hewitt, N. M. (1997). Talking about leaving: Why undergraduates leave the sciences. Boulder, CO: Westview Press.
Shanahan, M.C. (2009). Identity in Science Learning: Exploring the Attention Given to Agency and Structure in Studies of Identity. Studies in Science Education, 45(1), 43-64.
Shanahan, M.C., & Nieswandt, M. (2011). Science Student Role: Evidence of Social Structural Norms Specific to School Science. Journal of Research in Science Teaching, 48(4), 367-395.
Sills, D. L., & Merton, R. K. (1968). International encyclopedia of the social sciences. New York: Macmillan Publishers.
Skinner, B. F. (1938). The behavior of organisms: An experimental analysis.
Smardon, R. (2004). Streetwise science: Toward a theory of the code of the classroom. Mind, Culture, and Activity, 11(3), 201-223.
Smith, W. S., Gould, S. M., & Jones, J. A. (2004). Starting the Semester at Odds: Educators' Versus Students' Reasons for Studying Science. Journal of College Science Teaching, 34(3), 44-49.
SPSS, (2011). IBM Statistical Package for the Social Sciences. www.spss.com.
142

Stets, J. E., & Burke, P. J. (2000). Identity theory and social identity theory. Social psychology quarterly, 224-237.
Stofer, K. A. (2013). Visualizers, visualizations, and visualizees: Differences in meaning-making by scientific experts and novices from global visualizations of ocean data.
Sunal, D. W., Hodges, J., Sunal, C. S., Whitaker, K. W., Freeman, L. M., Edwards, L. et al. (2001). Teaching science in higher education: Faculty professional development and barriers to change. School Science and Mathematics, 101(5), 246-257.
Svinicki, M. D., & McKeachie, W. J. (2011). McKeachie's teaching tips: Strategies, research, and theory for college and university teachers. Wadsworth Publishing Company.
Taber, K. S. (2004). Learning quanta: Barriers to stimulating transitions in student understanding of orbital ideas. Science Education, 89(1), 94-116.
Taconis, R., de, P.-S., Lesley G. M., Henry, S., den, B., Perry J., & Beijaard, D. (2010). The construction of a questionnaire to evaluate the science orientedness of students' identities as learners from a cognitive perspective. Educational Research and Evaluation, 16(4), 383-400.
Tajfel, H. (1978). Differentiation between social groups: Studies in the social psychology of intergroup relations (14). Academic Press London.
Thieke, W. S. (1994). Developmental Change in Freshman Students: Validating Chickering's Theory of Student Development. Paper presented at the ASHE Annual Meeting Paper, Syracuse University.
Tinto, V. (1993). Leaving college: Rethinking the causes and cures of student attrition. Chicago, IL: University of Chicago Press.
Tobias, S. (1990). They're not dumb, they're different: Stalking the second tier. Tucson, Ariz.: Research Corp.
Trempy, J. E., Skinner, M. M., & Siebold, W. A. (2002). Learning microbiology through cooperation: designing cooperative learning activities that promote interdependence, interaction and accountability. Microbiology Education, 3(1), 26-26.
Tschumi, P. (1991). ASEE Annual Conference Proceedings pp. 1987-1990. Washington, DC: Am. Society for Engr. Education.
143
Tupes, E. C., & Christal, R. E. (1993). Recurrent personality factors based on trait ratings. Journal of personality, 60(2), 225-251.
Vansteenkiste, M., Lens, W., & Deci, E. L. (2006). Intrinsic versus extrinsic goal contents in self-determination theory: Another look at the quality of academic motivation. Educational psychologist, 41(1), 19-31.
Vaske, J. (2008). Survey research and analysis: Applications in parks, recreation and human dimensions. Venture Publishing, Inc.
von Glasersfeld, E. (1989). Cognition, construction of knowledge, and teaching. Synthese, 80(1), 121-140.
Vygotsky, L. S., (1978). Mind in society: The development of higher psychological processes. Cambridge, MA: Harvard University Press.
Wenger, E. (1998). Communities of practice: Learning, meaning, and identity. New York, NY: Cambridge University Press.
White, D. B., & Hood, A. B. (1989). An Assessment of the Validity of Chickering's Theory of Student Development. Journal of College Student Development, 30(4), 354-361.
Willcoxson, L., Cotter, J., & Joy, S. (2011). Beyond the First-Year Experience: The Impact on Attrition of Student Experiences throughout Undergraduate Degree Studies in Six Diverse Universities. Studies in Higher Education, 36(3), 331-352.
Willms, J. D. (2003). Student engagement at school: A sense of belonging and participation: Results from PISA 2000. Paris: OECD.
Wood, W. B. (2009). Innovations in teaching undergraduate biology and why we need them. Annual Review of Cell and Developmental, 25, 93-112.
Woods, D. R. (1994). Problem-based learning: How to gain the most from PBL. DR Woods Waterdown, Canada.
Woolfolk, A. (2001). Educational psychology. Allyn and Bacon.
Yazedjian, A., & Kolkhorst, B. B. (2007). Implementing small-group activities in large lecture classes. College Teaching, 55(4), 164-169.
144
Zeleny, L. D. (1940). Experimental appraisal of a group learning plan. The Journal of Educational Research, 34(1), 37-42.
Zimmerman, B., & Schunk, D. (2008). An essential dimension of self-regulated learning. In D. H. Schunk & B. J. Zimmerman (Eds.), Motivation and self-regulation: Theory, research, and applications (pp. 1-31). New York: Lawrence Erlbaum Associates.
Zusho, A., Pintrich, P. R., & Coppola, B. (2003). Skill and will: The role of motivation and cognition in the learning of college chemistry. International Journal of Science Education, 25(9), 1081-1094.
145

APPENDICES
146
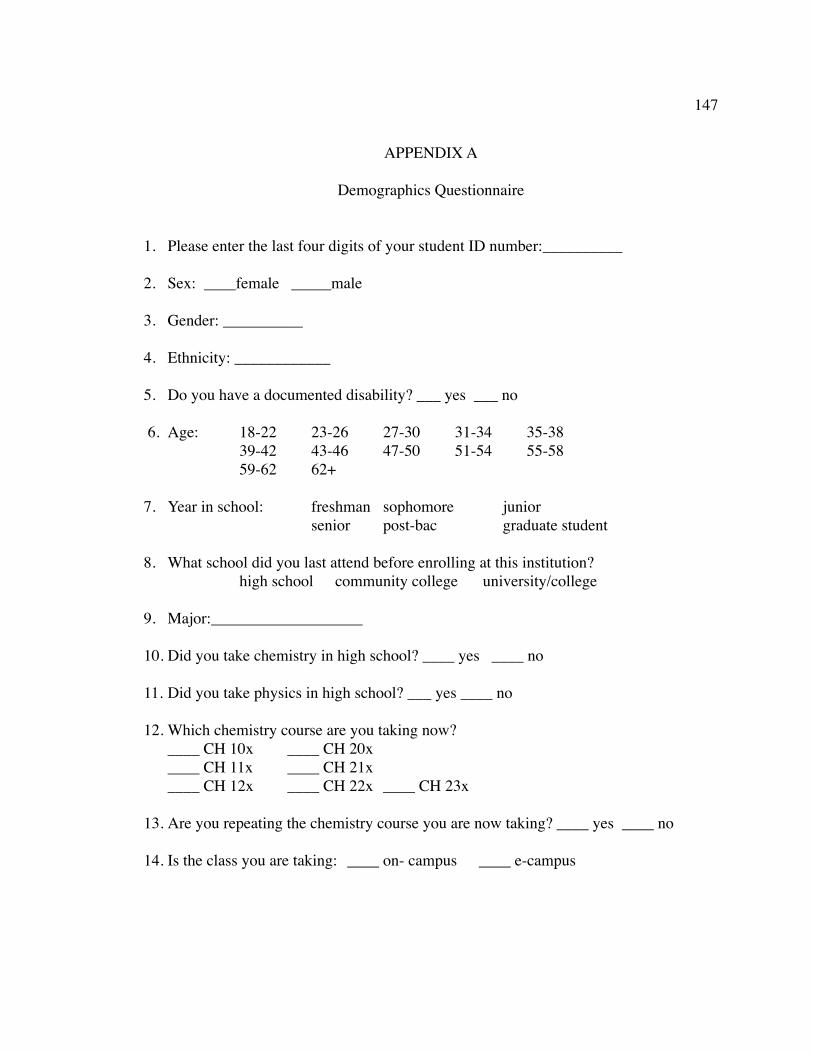
APPENDIX A
Demographics Questionnaire
1.! Please enter the last four digits of your student ID number:__________
2.! Sex: ____female _____male
3.! Gender: __________
4.! Ethnicity: ____________
5.! Do you have a documented disability? ___ yes ___ no
6.! Age:! 18-22! 23-26! 27-30! 31-34! 35-38! ! 39-42! 43-46! 47-50! 51-54! 55-58! ! 59-62! 62+
7.! Year in school: ! freshman! sophomore!! junior! ! ! senior! post-bac! ! graduate student
8.! What school did you last attend before enrolling at this institution?! ! ! high school! community college! university/college
9.! Major:___________________
10.!Did you take chemistry in high school? ____ yes ____ no
11.!Did you take physics in high school? ___ yes ____ no
12.!Which chemistry course are you taking now? ! ____ CH 10x! ____ CH 20x! ____ CH 11x! ____ CH 21x! ____ CH 12x! ____ CH 22x! ____ CH 23x
13.!Are you repeating the chemistry course you are now taking? ____ yes ____ no
14.!Is the class you are taking:! ____ on- campus! ____ e-campus
147
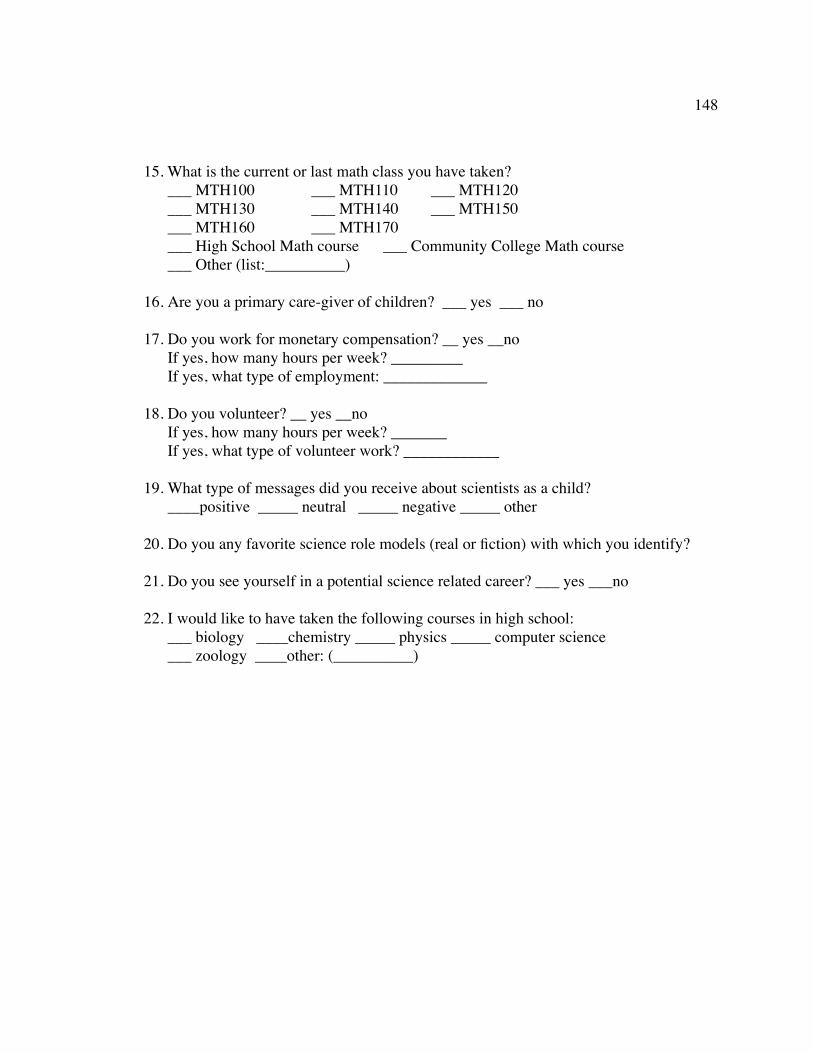
15. What is the current or last math class you have taken?! ___ MTH100! ___ MTH110! ___ MTH120! ___ MTH130! ___ MTH140! ___ MTH150! ___ MTH160! ___ MTH170! ___ High School Math course! ___ Community College Math course! ___ Other (list:__________)
16.!Are you a primary care-giver of children? ___ yes ___ no
17.!Do you work for monetary compensation? __ yes __no! If yes, how many hours per week? _________! If yes, what type of employment: _____________
18.!Do you volunteer? __ yes __no! If yes, how many hours per week? _______! If yes, what type of volunteer work? ____________
19.!What type of messages did you receive about scientists as a child?! ____positive _____ neutral _____ negative _____ other
20.!Do you any favorite science role models (real or fiction) with which you identify?
21.!Do you see yourself in a potential science related career? ___ yes ___no
22.!I would like to have taken the following courses in high school:! ___ biology ____chemistry _____ physics _____ computer science! ___ zoology ____other: (__________)
148

APPENDIX B
Chemistry Motivation Questionnaire (CMQ) ©2005 Shawn M. Glynn and Thomas R. Koballa, Jr.
Glynn, S. M., Taasoobshirazi, G., & Brickman, P. (2009). Science Motivation Questionnaire: Construct Validation with Nonscience Majors. Journal of Research in Science Teaching, 46(2), 127-146.
In order to better understand what you think and feel about your college chemistry courses, please respond to each of the following statements from the perspective of:
“When I am in a college chemistry course…”
01. I enjoy learning the chemistry. 02. The chemistry I learn relates to my personal goals. 03. I like to do better than the other students on the chemistry tests. 04. I am nervous about how I will do on the chemistry tests. 05. If I am having trouble learning the chemistry, I try to figure out why. 06. I become anxious when it is time to take a chemistry test. 07. Earning a good chemistry grade is important to me. 08. I put enough effort into learning the chemistry. 09. I use strategies that ensure I learn the chemistry well. 10. I think about how learning the chemistry can help me get a good job. 11. I think about how the chemistry I learn will be helpful to me. 12. I expect to do as well as or better than other students in the chemistry course. 13. I worry about failing the chemistry tests. 14. I am concerned that the other students are better in chemistry. 15. I think about how my chemistry grade will affect my overall grade point average. 16. The chemistry I learn is more important to me than the grade I receive. 17. I think about how learning the chemistry can help my career. 18. I hate taking the chemistry tests. 19. I think about how I will use the chemistry I learn. 20. It is my fault, if I do not understand the chemistry. 21. I am confident I will do well on the chemistry labs and projects. 22. I find learning the chemistry interesting. 23. The chemistry I learn is relevant to my life. 24. I believe I can master the knowledge and skills in the chemistry course. 25. The chemistry I learn has practical value for me. 26. I prepare well for the chemistry tests and labs. 27. I like chemistry that challenges me. 28. I am confident I will do well on the chemistry tests. 29. I believe I can earn a grade of “A” in the chemistry course. 30. Understanding the chemistry gives me a sense of accomplishment.
149
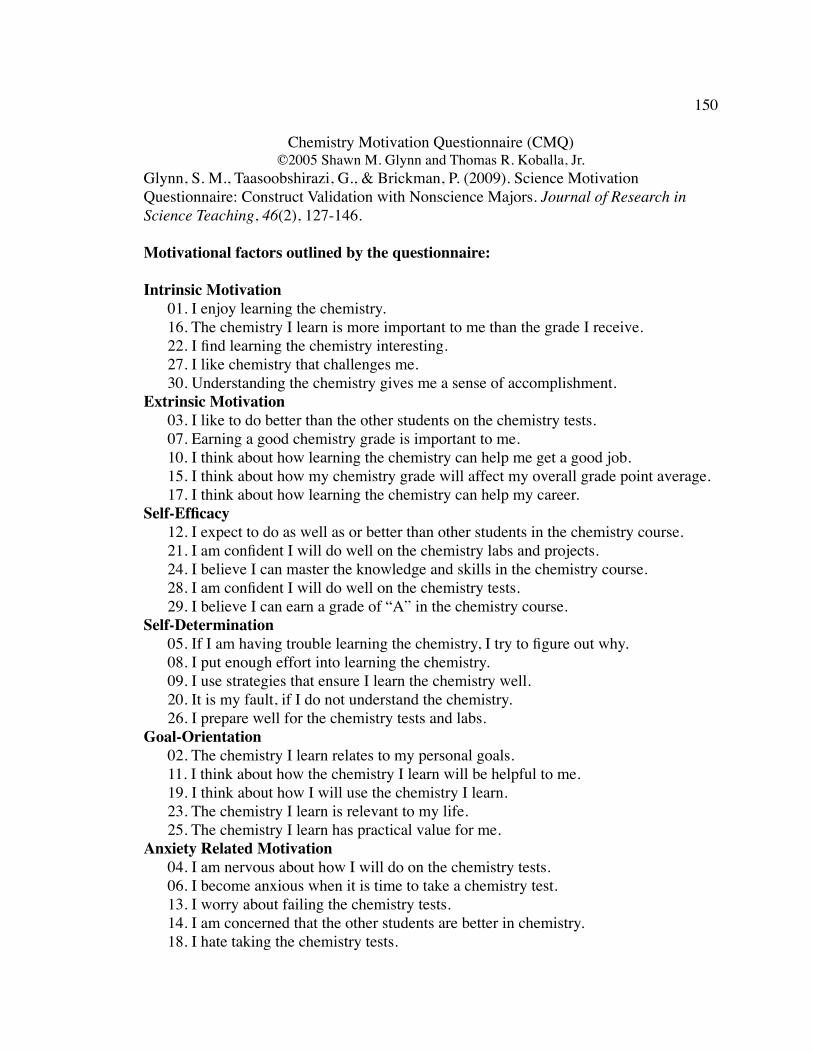
Chemistry Motivation Questionnaire (CMQ) ©2005 Shawn M. Glynn and Thomas R. Koballa, Jr.
Glynn, S. M., Taasoobshirazi, G., & Brickman, P. (2009). Science Motivation Questionnaire: Construct Validation with Nonscience Majors. Journal of Research in Science Teaching, 46(2), 127-146.
Motivational factors outlined by the questionnaire:
Intrinsic Motivation! 01. I enjoy learning the chemistry. ! 16. The chemistry I learn is more important to me than the grade I receive. ! 22. I find learning the chemistry interesting. ! 27. I like chemistry that challenges me. ! 30. Understanding the chemistry gives me a sense of accomplishment. Extrinsic Motivation! 03. I like to do better than the other students on the chemistry tests. ! 07. Earning a good chemistry grade is important to me. ! 10. I think about how learning the chemistry can help me get a good job. ! 15. I think about how my chemistry grade will affect my overall grade point average. ! 17. I think about how learning the chemistry can help my career. Self-Efficacy! 12. I expect to do as well as or better than other students in the chemistry course. ! 21. I am confident I will do well on the chemistry labs and projects. ! 24. I believe I can master the knowledge and skills in the chemistry course. ! 28. I am confident I will do well on the chemistry tests. ! 29. I believe I can earn a grade of “A” in the chemistry course. Self-Determination! 05. If I am having trouble learning the chemistry, I try to figure out why. ! 08. I put enough effort into learning the chemistry. ! 09. I use strategies that ensure I learn the chemistry well. ! 20. It is my fault, if I do not understand the chemistry. ! 26. I prepare well for the chemistry tests and labs. Goal-Orientation! 02. The chemistry I learn relates to my personal goals. ! 11. I think about how the chemistry I learn will be helpful to me. ! 19. I think about how I will use the chemistry I learn. ! 23. The chemistry I learn is relevant to my life. ! 25. The chemistry I learn has practical value for me. Anxiety Related Motivation! 04. I am nervous about how I will do on the chemistry tests. ! 06. I become anxious when it is time to take a chemistry test. ! 13. I worry about failing the chemistry tests. ! 14. I am concerned that the other students are better in chemistry. ! 18. I hate taking the chemistry tests.
150
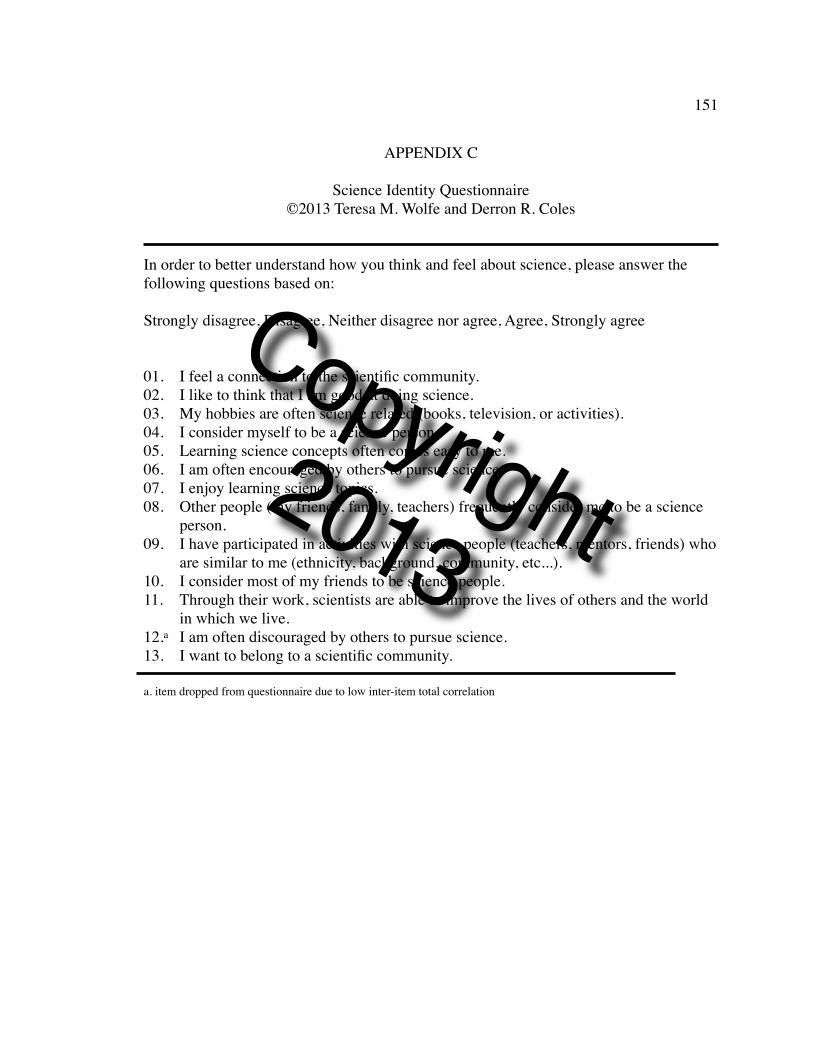
APPENDIX C
Science Identity Questionnaire©2013 Teresa M. Wolfe and Derron R. Coles
In order to better understand how you think and feel about science, please answer the following questions based on:
Strongly disagree, Disagree, Neither disagree nor agree, Agree, Strongly agree
01.! I feel a connection to the scientific community.02.! I like to think that I am good at doing science.03.! My hobbies are often science related (books, television, or activities).04.! I consider myself to be a science person.05.! Learning science concepts often comes easy to me.06.! I am often encouraged by others to pursue science.07.! I enjoy learning science topics.08.! Other people (my friends, family, teachers) frequently consider me to be a science
person.09.! I have participated in activities with science people (teachers, mentors, friends) who
are similar to me (ethnicity, background, community, etc...).10.! I consider most of my friends to be science people.11.! Through their work, scientists are able to improve the lives of others and the world
in which we live.12.a! I am often discouraged by others to pursue science.13.! I want to belong to a scientific community.
a. item dropped from questionnaire due to low inter-item total correlation
151
Copyright 2013
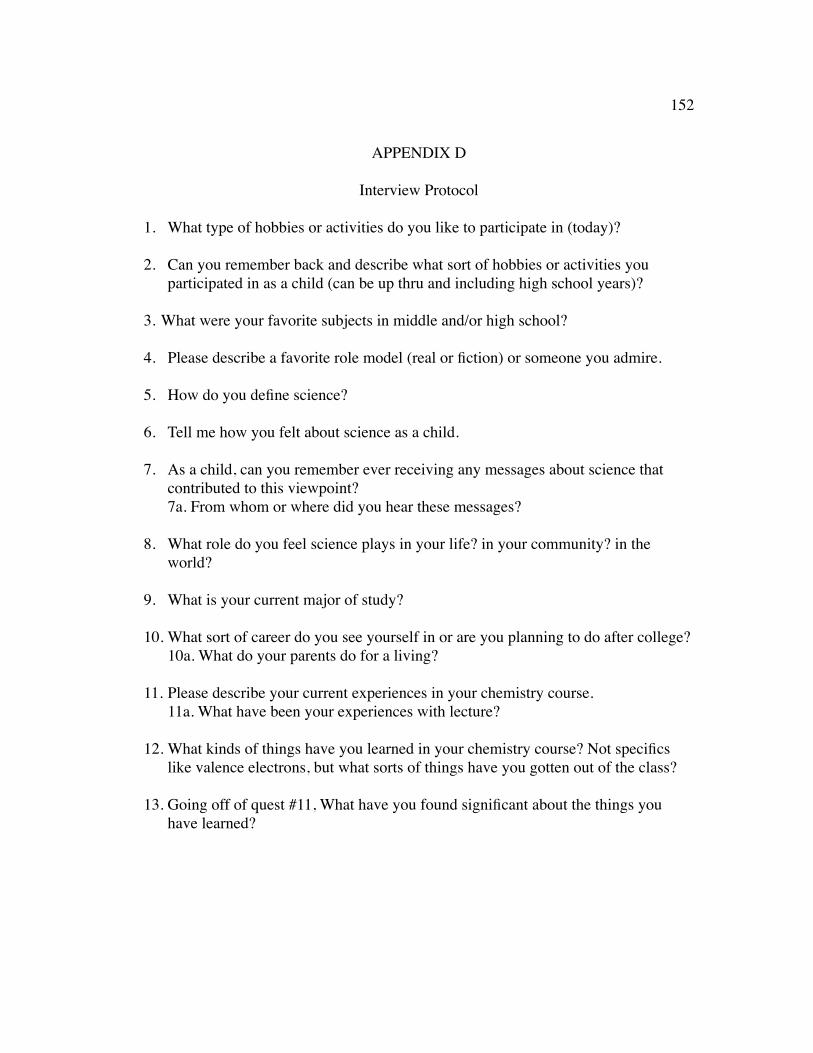
APPENDIX D
Interview Protocol
1.! What type of hobbies or activities do you like to participate in (today)?
2.! Can you remember back and describe what sort of hobbies or activities you participated in as a child (can be up thru and including high school years)?
!3. !What were your favorite subjects in middle and/or high school? !4.! Please describe a favorite role model (real or fiction) or someone you admire.
5. ! How do you define science?
6. ! Tell me how you felt about science as a child.
7.! As a child, can you remember ever receiving any messages about science that contributed to this viewpoint?
! 7a. From whom or where did you hear these messages?!8.! What role do you feel science plays in your life? in your community? in the
world?
9.! What is your current major of study?
10.!What sort of career do you see yourself in or are you planning to do after college?! 10a. What do your parents do for a living?
11.!Please describe your current experiences in your chemistry course.! 11a. What have been your experiences with lecture?!12.!What kinds of things have you learned in your chemistry course? Not specifics
like valence electrons, but what sorts of things have you gotten out of the class?
13.!Going off of quest #11, What have you found significant about the things you have learned?
152