Embed Size (px)
Citation preview
Community Assessment, Planning, and Education Unit Public Health Department
Alameda County Health Care Services Agency 1000 Broadway, Suite 500
Oakland, CA 94607
WEST OAKLAND Community Information Book 2001

WEST OAKLAND Community Information Book 2001
Prepared by: Alameda County Public Health Department
Community Assessment, Planning, and Education (CAPE) Unit Sandra Witt, Dr.P.H., Director
Lead Staff:
Sangsook Cho, Ph.D. Sonia Jain, MPH
Gem Le, MPH Jane Martin, Dr.P.H.
Nobuko Mizoguchi, MPH/MPP
August 2001

Alameda County Public Health Department Arnold Perkins, Director
Art Chen, M.D., Health Officer
Health Care Services Agency David Kears, Director
This report is available online at
http://www.co.alameda.ca.us/public health
For copies or comments, please contact:
Community Assessment, Planning, and Education (CAPE) Unit Alameda County Public Health Department
1000 Broadway, 5th Floor Oakland, CA 94607
Telephone: (510) 267-8020
Acknowledgements The Community Assessment, Planning, and Education (CAPE) Unit of the Alameda County Public Health Department wishes to thank the following individuals for their support and contributions. Community Assessment, Planning, and Education Unit Maria Hernandez Liz Maker Joan Mazzetti Hemal Parikh Darouny Somsanith Office of the Director Support Staff Priscilla Fung Gail Potier Margaret Rivas Information Systems Gary Oliver Health Education Review Committee Paul Cummings Zakiya Somburu Alameda County Social Services Agency Jim Cunniff

Table of Contents
Introduction 1 Community Maps
Neighborhood History 6
Demographics and Social Profile 9
Census 2000 • Population Characteristics • Households • Languages Spoken• Income • Poverty •
Employment and Occupations• Education • Housing
Health Indicators
Maternal and Child Health 24 Overall Births • Infant Deaths•
Low Birth Weight • Early Prenatal Care • Teen Births • Child Abuse and Neglect Hospitalization 34 Leading Causes • Asthma • Diabetes • Injury Overall Deaths 47 Leading Causes
Education 51 School Profiles
Government 57
City Council • Alameda County Board of Supervisors • State Assembly and Senate • U.S. Congress and Senate
References 72

West Oakland Community Information Book 2001
Alameda County Public Health Department Page 1
Introduction Why a community information book? The Alameda County Public Health Department is working together with neighborhood residents to build healthier communities. Partnerships are being formed for the Public Health Department to share health information with residents and for residents to share information on the assets and strengths of their communities with the Public Health Department. Information on the community assets, health problems, and community concerns are all important in order to make effective, long-term change and build healthier communities. This information book is meant to be a useful tool and a way to share Public Health information with the community. As Community Health Teams and residents join together to look at strengths of the community, information on community assets and strengths can be added to this book. The purpose of the community information book is to:
describe the geography of the community and those who live in it look at the health and social issues that are affecting the community.
Who is this book for? This book is for community health team members, public health nurses, community outreach workers, anyone who works or lives in the community and wants to find out about the neighborhood and its health issues, or wants to plan programs or activities in the community.
How should Community Health Teams and Community Partners use this book? Here are some ways that you can use the community information book:
Orient new staff to the community or reinforce the knowledge of old-timers
Prioritize and/or plan for programs and activities
Community Information Book 2001!

West Oakland Community Information Book 2001
Alameda County Public Health Department Page 2
Identify issues that are important to the community
Write grants
Use as a starting point for, or in addition to, your own collection of information about the community
We need your help! Community residents and people working in the community are the experts! Help us improve this community information book by letting us know what you think about it and how we can improve it. Please contact us at:
Alameda County Public Health Department Community Assessment, Planning and Education (CAPE) Unit
1000 Broadway, Suite 500 Oakland, CA 94607
Phone: (510) 267-8020 Fax: 267-3212
We encourage reproduction of this material, but please credit
the Community Assessment, Planning and Education Unit Alameda County Public Health Department.
Thank you!

West Oakland Community Information Book 2001
Alameda County Public Health Department Page 3
Community Maps Information contained in this community information book covers the West Oakland portion of Alameda County Public Health Department's Community Health Team Area in Supervisorial District 5. The map on the next page shows where all the Community Health Team Areas are located. The census tracts included in this information book are 4015-4019, 4021-4027. You can see this area shaded in light green on the map on the last page of this section.

0 2.5
miles5
CASTRO VALLEYSAN LEANDRO
ASHLAND
PIEDMONT
PLEASANTON
NEWARK
UNION CITY
SAN LORENZO
CHERRYLAND
HAYWARD
ALAMEDA
EMERYVILLE
ALBANY
BERKELEY
DUBLIN
FREMONT
LIVERMORE
OAKLAND
Source of population data: Claritas; Produced by Alameda County Public Health Department Information Systems CAPE Unit 9/02/99
1
34
2
5
North Oakland
West Oakland
Chinatown/San Antonio
Fruitvale
East Oakland
Ashland/Cherryland
South Hayward/Harder-Tennyson
Contempo and Decoto
Centerville
Livermore
Community Health Team Areas
Supervisorial District Boundaries
Census Tract Boundaries
Alameda County Public Health Department Community Health Team Areas
1 Supervisorial District Number
CommunityHealth TeamAreas - 1998Population andCensus TractDefinition: North Oakland
West Oakland
Chinatown/San Antonio
Fruitvale
East Oakland
Ashland/Cherryland
S Hayward/Harder-Tennyson
Contempo and Decoto
Centerville
Livermore
Population: 29,210Tracts: 4007-4014, 4028
Population: 19,052Tracts: 4015-4019, 4021-4027
Population: 38,217Tracts: 4030-4031, 4033 4054-4060
Population: 47,725Tracts: 4061-4063, 4065-4066, 4070-4072
Population: 75,054Tracts: 4073-4076, 4084-4089, 4091-4097, 4102-4104
Population: 29,593Tracts: 4337-4340, 4355-4356
Population: 32,782Tracts: 4374-4378, 4382.01, 4382.02
Population: 20,796Tracts: 4402,4403.04, 4403.06, 4403.08
Population: 47,439Tracts: 4417, 4419.02, 4425-4428, 4445
Population: 10,676Tracts: 4514
San Francisco Bay
Contra Costa County
Alameda County
Alameda County
Santa Clara County

94609
94607
94612
94608
4022
4023
4027
4017
4019
94606
94610
4015
4016
4018
4021
4024
40254026
West Oakland Community Health Team Area
West Oakland Census TractsZip Code BoundariesMajor FreewaysStreets
West Oakland Community Health Team Area
Broa
dway
Tele
grap
hI-9
80H
wy
24
San Pablo
I-580
I-80
W. Macarthur
West Grand
Mar
ket S
t
Woo
d St
7th St
Mar
tin L
uthe
r Kin
g Jr
Wy
28th St
14th St
Pera
lta
Adel
ine
RaimondiPark
BART
LakeMerritt
I-880

West Oakland Community Information Book 2001
Alameda County Public Health Department Page 6
Neighborhood History History of West Oakland
West Oakland has a long and colorful history. Here is a brief account of the history of West Oakland from Oakland Citizens Committee for Urban Renewal's (OCCUR) Neighborhood Profiles.
In the mid-1800’s, West Oakland was mostly marshland and Oak groves. The area quickly changed when Oakland developed into a major port town and became the gateway to San Francisco. Oakland Point, which is located about two miles from the earliest settlements in Oakland, started out as a commuter suburb. It marked the western terminus of the Transcontinental Railroad. In 1862, at the foot of what is now Seventh Street, a wharf/ferry terminal was built and West Oakland became the final stop on the railroad.
After the Civil War, the Pullman Company introduced the sleeping car on the Railroad. The company hired African-American males as the porters of these cars and in 1925 the Brotherhood of the Sleeping Car Porters was formed. African-American labor pioneers C.L. Dellums and A. Philip Randolph worked together to form this union, the first all-Black union in the country. West Oakland, being at the end of the line, became the home of many of the Pullman Porters and their families.
The daily streetcar service connected downtown Oakland to
the terminal and to downtown San Francisco. This helped stimulate commercial and residential development in West Oakland. The area between the ferry dock and downtown quickly filled with elegant Victorians built to house the rapidly growing population. These homes were converted into multiunit apartments in the late 1890’s as the population continued to grow. West Oakland’s population exploded in 1906 as thousands fled the San Francisco earthquake and fire.
Beth Eden Baptist Church, Filbert Street between 7th and 8th Streets, 1901 Courtesy of the Oakland History Room at the Oakland Public Library

West Oakland Community Information Book 2001
Alameda County Public Health Department Page 7
During these early years of development, many of Oakland’s most prominent institutions were established. The first Black church in Oakland, First AME (African Methodist Episcopal) was founded in 1852 at the home of Isaac and Elizabeth Flood. The church became the center of activity for one of California’s oldest Black middle class communities. Several other Black charities and self-improvement societies were also founded during the late 1800’s.
World War I prompted shipbuilding in West Oakland. This industry spurred new waves of migration and helped West Oakland evolve into a strong working class neighborhood. West Oakland became one of the most diverse districts in Oakland with high numbers of African, Irish, Italian, Dutch, Mexican, and Portuguese Americans working and living in the area.
The number of immigrants employed in the shipbuilding industries rose again in the 1940’s during World War II. African-Americans became the most prominent ethnic group in West Oakland. Their presence brought cultural activity and entertainment along Seventh Street. Jazz musician Horace Silver once referred to West Oakland as “the Harlem in California.” After World War II however, there was a substantial loss of jobs. The year
1945 marked the end of the shipyard boom and the termination of the rail service along Seventh Street. It was the beginning of the drastic decline of West Oakland’s economy.
As a result of the federal Urban Renewal programs in the late 1950’s and 1960’s, West Oakland experienced a series of devastating changes. New projects such as the Grove-Shafter and Cypress Freeways, BART, the Acorn Housing project, and the new Main Post Office brought significant economic and social change in the community. As a result of these projects, hundreds of families were displaced, the community was split into two, historic Victorian homes were demolished, and commercial activity along Seventh Street was weakened. The community organized in opposition to the displacement. Today although many of the issues that confronted it in the past still exist, great strides have been made towards revitalizing West Oakland.
The Loma Prieta earthquake of ’89 destroyed housing, displaced residents, and caused the collapse of the Cypress Freeway. The City’s
West Oakland Bandleader Sidney LeProtti (third from right) and his So Different Jazz Band, 1915 Courtesy of the Anthropological Studies Center at Sonoma State University

West Oakland Community Information Book 2001
Alameda County Public Health Department Page 8
plan to rebuild the freeway in its same location meant dividing the neighborhood once again. Local organizations, like the Citizens Emergency Relief Team (CERT) demanded an alternate route. The new route preserves the accessibility of Mandela Parkway, promotes commercial development and inspires the reconnection of the divided community.
Today, West Oakland is armed with strong visionary leadership and renewed dedication to its cultural legacy. Among the many active community based organizations are the West Oakland District Council and the Coalition for West Oakland Revitalization (CWOR). West Oakland is the oldest district in Oakland and is quickly rediscovering that it is also one of the most livable.
Source: OCCUR, “West Oakland Neighborhood Profiles”

West Oakland Community Information Book 2001
Alameda County Public Health Department Page 9
Demographic & Social Profile Knowing who lives in the neighborhood is one way to get to know the community in which you live or work. This section describes the social and demographic characteristics of West Oakland residents. Demographic characteristics are information about the population, such as race, ethnicity, age, and sex. The information contained in this section comes from different sources. We have used the most recent data available, including the new 2000 Census data. At this time, only the total population and race/ethnicity information are available through Census 2000. Therefore, we rely on 1999 estimates for other social and demographic information.

West Oakland Community Information Book 2001
Alameda County Public Health Department Page 10
Census 2000 The latest figures from Census 2000 show that 19,684 people live in West Oakland, an increase of 3% since 1990. The race and ethnicity information from the Census show that West Oakland is home to people of diverse cultures and backgrounds. West Oakland consists of 64% African Americans, 16% Latinos, 9%
Asian and Pacific Islanders, 7% Whites, 4% residents reporting twoor more races, and less than 1% American Indians. In AlamedaCounty, the racial and ethnic make-up is 41% Whites, 21%Asian/Pacific Islanders, 19% Latinos, 15% African Americans, 4%residents reporting two or more races, and less than 1% AmericanIndians.
Of the Asian and Pacific Islanders, approximately 2% are NativeHawaiians and other Pacific Islanders, and 98% are Asians.
West Oakland Racial and Ethnic Composition, 2000
African American
64%
Asian and Pacific
Islanders9%
Two or more races
4%American
Indian<1%
Latino16%
White7%
Source: Census, 2000
Total Population = 19,684

West Oakland Community Information Book 2001
Alameda County Public Health Department Page 11
The West Oakland Latino population grew 85% from 1990 to 2000 to3,098.
The White population also grew by 27% to 1,382 as well as the Asianand Pacific Islander population, which increased by 3%.
The African American population experienced a decrease of 14%between 1990 and 2000, to a population of 12,526.
West Oakland Racial and Ethnic Composition,
1990 vs. 2000
02,0004,0006,0008,000
10,00012,00014,00016,000
White Afr. Am. Asian/PI Latino Am.Indian
Other 2 ormore*
19902000
*Information on multiracial residents was collected for the first time in the 2000 Census. Therefore, 1990 comparison is not available. Source: Census, 1990 and 2000
Total Population 1990 = 19,181 Total Population 2000 = 19,684

West Oakland Community Information Book 2001
Alameda County Public Health Department Page 12
Population Characteristics
West Oakland is an intergenerational neighborhood with men and women of all ages. The 2000 Census data on age and sex is not yet available. The following information is based on 1999 estimates. In 1999, West Oakland had more women (52%) than men (48%). This was
similar to Alameda County, which had 51% women and 49% men.
Children under 14 years of age made up 29% of the community in West Oakland, as compared to 21% in Alameda County as a whole.
Seniors (65 and older) made up 11% of the West Oakland population, the same as countywide.
Households
In 1999, there were 7,603 households in the West Oakland community, a 6.4% increase over the 7,145 households counted in 1990.
West Oakland Age Distribution by Sex, 1999
30% 20% 10% 0% 10% 20%
< 5
15-24
35-44
55-64
75-84
Age
Male Female
Source: Claritas, 1999 Total = 10,676 Total = 9,874

West Oakland Community Information Book 2001
Alameda County Public Health Department Page 13
Languages Spoken
People in West Oakland speak many different languages. The most recent data for languages spoken in the neighborhoods is from 1990. While the population in West Oakland has changed significantly since 1990, this information provides a sense of the diversity of languages spoken in the neighborhood.
In 1990, 81% of West Oakland residents age 5 years and older spoke only
English at home.
About 8% spoke Spanish, 3% Chinese, 2% Mon-Khmer, and 1% Tagalog at home. These included people who can speak English in addition to other languages.
West Oakland Language Spoken at Home, 1990
English81%
Spanish8%
Chinese3%
Mon-Khmer2%
Tagalog1%
Other5%
Total Population Ages ≥ 5 years = 17,081
Source: Census, 1990

West Oakland Community Information Book 2001
Alameda County Public Health Department Page 14
Income
Income level is often associated with the health status of a community. Higher income is generally associated with better health status and access to health care, while lower income is often associated with poorer health status and less access to health care.
Over two-thirds (71%) of households in West Oakland earned an income of less than $30,000 in 1999, as compared to 28% in Alameda County as a whole.
In 1997, half of all households in Alameda County earned more than $46,795. In 1999, in West Oakland, half of the households in the richest census tract earned more than $36,618. Half of the households in the poorest census tract in West Oakland earned less than $11,339 (Claritas).
West Oakland Household Income Distribution, 1999
<$30K71%
>$100K3%
$75-100K2%
$50-75K8%
$30-50K16%
Source: Claritas, 1999
Total Number of Households = 7,603

West Oakland Community Information Book 2001
Alameda County Public Health Department
Page 15
CalWORKs and MediCal Only Participation West Oakland vs. Alameda County, 12/1999
13.0
3.8
10.5
5.6
0%
5%
10%
15%
20%
25%
West Oakland Alameda CountyPerc
ent P
rogr
am P
artic
ipan
ts
% MediCal Only% CalWORKs
Poverty
There are different ways to measure the number of people living in poverty. One way is through their participation in government programs that are available to low-income families. This section discusses people's participation in two programs: CalWORKs and Medi-Cal. The percent of people who participate in these two programs helps us estimate the number of people who are living in poverty in West Oakland. Because not everyone who is poor participates in these programs, the estimates are conservative. CalWORKs and Medi-Cal Participation
In December 1999, about 23.5% of West Oakland residents were participating in either CalWORKs or Medi-Cal only. This compares to about 9.4% county-wide.
CalWORKs: California's welfare program is called California WorkOpportunity and Responsibility to Kids or CalWORKs. It gives cash aid andservices to eligible families with children. It was previously known as AFDC(Aid to Families with Dependent Children) and GAIN (Greater Avenues toIndependence). The number of people who participate in CalWORKs is anestimate of the number of children and parents living in poverty. Medi-Cal provides health insurance coverage to low-income families andindividuals who are elderly or disabled. More people are eligible for Medi-Calthan for CalWORKs. The Medi-Cal data presented here represents peoplewho participate only in Medi-Cal. All CalWORKs participants are eligible forMedi-Cal. However, Medi-Cal participants who are also enrolled inCalWORKs are not included here to prevent overlap. Looking at the numberof people who participate in Medi-Cal in addition to CalWORKs participationwill give us a sense of the number of people living in poverty.
Source: Alameda County Social Services Agency
Total Pop. = 20,550 Total Pop. = 1,408,813

West Oakland Community Information Book 2001
Alameda County Public Health Department
Page 16
About 29% of children under 18 in West Oakland were participating in CalWORKs, as compared to 10.8% countywide.
CalWORKs participants were 80% African American, 13% Asian/Pacific Islander, 5% Latino, 2% White, and less than 1% American Indian. Among the Asian/Pacific Islanders, participants were primarily Vietnamese, Cambodian, and Chinese.
About 71% of Medi-Cal participants were African American, 17% were Latino, 10% were Asian/Pacific Islander, 2% were White, and less than 1% were American Indian. Of the Asian and Pacific Islanders, most were Chinese, Vietnamese, Cambodian, and Pacific Islanders.
Children Living in Poverty Another way to look at poverty is through a ceiling (maximum income) established by the federal government. According to this method, people living under a certain income level are considered poor. At this time, only 1990 data is available on poverty by census tract. The map on the following page shows the percent of children living in poverty in 1990. While a lot has changed since 1990, the map gives us a sense of where poor children live.
West Oakland Race/Ethnicity of Medi-Cal Only Participants, 12/1999
Asian/PI10%
American Indian<1%
African American
71%
Latino17%
White2%
West Oakland Race/Ethnicity of CalWORKs Participants, 12/1999
Asian/PI13%
African American
80%
American Indian<1%
White2%
Latino5%
*Estimates based on 1999 population
Source: Alameda County Social Services Agency, Claritas 1999
Total Medi-Cal Only Participants = 2,158* Total CalWORKs Participants = 2,680 *

Cabrillo/Centerville
West Oakland
Chinatown
San Antonio
North Oakland
Fruitvale
East Oakland
Ashland/Cherryland
South Hayward
Contempo/Decoto
Livermore
Percent of Children in Poverty by Census Tract, Alameda County 1990
Source of Data: 1990 Census; Produced by: Alameda County Public Health Department CAPE Unit and Information Systems March, 2000
Percent of Children < 18 years old Living in Poverty
15% to 29%
45% to 59%60% or greater
County Average = 15.32%
Community Health Team AreasCensus Tract Boundary
30% to 44%

West Oakland Community Information Book 2001
Alameda County Public Health Department Page 18
Employment and Occupations
About 5,205 people in West Oakland age 16 years and older were employed in
1999 and held a variety of jobs. Approximately 30% of
employed West Oakland residents worked in technical, sales, and administrative occupations. These included electrical technicians, computer programmers, retail workers, secretaries, and postal clerks.
Firefighters, police, housekeepers, childcare workers, cooks, waiter/ waitresses, janitors, and hairdressers were categorized as service jobs and made up 26% of West Oakland workers.
About 18% were employed in executive, administrative, managerial, and
professional occupations. These included executives, engineers, teachers, lawyers, and nurses.
Machine operators, fabricators, transportation operators, and laborers made up 16% of the workers in West Oakland. These included assemblers, truck drivers, crane and tower operators and construction laborers.
About 7% of West Oakland workers were employed in precision production, craft, and repair occupations. These included mechanics, skilled construction workers, sheet metal workers, and bakers.
A few (3%) worked in farming, forestry, and fishing occupations.
West Oakland Occupations, 1999
Technical, Sales, Admin.
30%
Machine Operators,
Fabricators, Transport., Laborers
16%
Service Jobs26%
Farming, Forestry, Fishing
3%
Executive, Admin.,
Managerial, Prof.18%
Precision Prod., Craft
& Repair7%
Total Population Ages 16+ years Employed = 5,205
Source: Claritas, 1999

West Oakland Community Information Book 2001
Alameda County Public Health Department Page 19
Neighborhood unemployment rates were not available. However, we can look at unemployment trends for the City of Oakland.
In 1999, approximately 5.5% of Oakland residents age 16 or older were
unemployed and were looking for work. This is compared to 3.4% in Alameda County as a whole.
Unemployment in Oakland has declined steadily since 1993.
Average Annual Unemployment Rate, Oakland, 1990-1999
6.4
8.4
5.56.57.0
7.89.0
9.610.310.1
0%
2%
4%
6%
8%
10%
12%
14%
1990 1991 1992 1993 1994 1995 1996 1997 1998 1999
Une
mpl
oym
ent R
ate
Source: California Dept. of Finance, 2000

West Oakland Community Information Book 2001
Alameda County Public Health Department Page 20
Education
Education is an important part of neighborhood well-being. People in West Oakland had varying levels of education.
In West Oakland, about 8% of residents aged 25 and older had completed college (bachelor’s degree) or held a graduate/professional degree. For Alameda County as a whole, this figure was 29%.
About 17% in West Oakland had completed some college (but had not graduated) and 5% had completed an associate degree, as compared to 22% who had attended some college and 8% who had completed an associate degree in Alameda County as a whole.
Almost a quarter (24%) of West Oakland residents had graduated from high school or passed the General Educational Development (GED) exam. In Alameda County as a whole, 23% had finished high school or held a GED certificate.
Almost half (45%) of West Oakland residents ages 25 and over did not have a high school degree. This figure was 18% in Alameda County as a whole.
West Oakland Educational Attainment, 1999
7
11
23
22
11
18
8
19
26
24
17
2
6
5
0% 5% 10% 15% 20% 25% 30%
< 9th grade
9th-12th grade, No diploma
High Sch Grad/GED
Some college, no degree
Associate
Bachelor's
Graduate/ Professional West OaklandAlameda Co.
Source: Claritas, 1999
Total Adults Ages 25+ = 11,739

West Oakland Community Information Book 2001
Alameda County Public Health Department Page 21
Housing The Bay Area's housing situation has changed rapidly within the past few years. Up-to-date information on housing in the neighborhoods is not available at this time, but here is some city-level information.
In Oakland, there were about 155,676 housing units in the year 2000. This was almost 30% of the total housing units in Alameda County.
Approximately 6.7% of housing units in Oakland were vacant in 2000.
On average, there were 2.7 persons per household in Oakland.
Oakland/Alameda County Housing Estimates, 2000
Area Number of Housing
Units Vacancy Average Number of
Persons per Household
Oakland 155,676 6.7 % 2.7
Total Alameda County 536,495 5.0 % 2.8 Source: California Department of Finance, 2000

West Oakland Community Information Book 2001
Alameda County Public Health Department Page 22
Health Indicators This section covers health information on 1) maternal and child health, 2) hospitalization and 3) deaths. Each topic includes several indicators. For each indicator, we have used the most recent data available for the neighborhood and made comparisons to Alameda County. Also, whenever possible, we have included comparisons to the Healthy People 2000 objective, age and race breakdowns, and trends. In presenting neighborhood level information, we faced many limitations due to the small number of cases. Sometimes we were not able to provide breakdowns by age and race, so we present the overall rates only. In some instances, we could not calculate a reliable rate and only provide the number of cases. We also use three-year averages for some indicators to make rates from small numbers more reliable.
What is a Health Indicator? A measure of health and wellbeing in a population. Why Look at Health Indicators?
To help identify areas of need To monitor changes and trends in the health of the community To serve as a guide in planning programs
What are Healthy People 2000 Objectives? Healthy People 2000 objectives are benchmarks developed by the U.S.Department of Health and Human Services to measure and improve thepublic's health. Many local, state, and national organizations use theseobjectives for health planning and action. Healthy People 2000 objectives are organized into three main goals: 1. Increase the years of healthy life for Americans, 2. Reduce health disparities among Americans, and 3. Achieve access to preventive services for all Americans. To achieve these goals, Healthy People 2000 has set objectives for specific health indicators.

West Oakland Community Information Book 2001
Alameda County Public Health Department Page 23

West Oakland Community Information Book 2001
Alameda County Public Health Department
Page 24
Maternal and Child Health
Pregnant women and their infants are key members of the community. The health of mothers and their babies is often used as an important measure of the overall health of a community. Factors associated with healthy mothers and babies include: Receiving early quality prenatal care
Giving birth between ages 19 - 34
Non-smoking mothers and fathers
Drug and alcohol-free parents
Good nutrition
This section discusses indicators traditionally chosen to represent the status of maternal and child health in a community. These include overall births, infant deaths, low birth weight, early entry into prenatal care, teen births, and child abuse/neglect.

West Oakland Community Information Book 2001
Alameda County Public Health Department
Page 25
Overall Births Births contribute to the general growth of the community, and tell us about the future make-up of the community.
In 1999, there were 332 live births in West Oakland.
The birth rate in 1999 was 16.2 births per 1,000 people, as compared to 14.1
births per 1,000 people in Alameda County as a whole. In the last decade, the birth rate in West Oakland decreased by 47%, from
30.3 births per 1,000 people in 1990 to 16.2 per 1,000 in 1999.
In 1999, the greatest number of births in West Oakland was to African Americans (64.2%); one fifth to Latinas (20.9%), and 7.3% each to Whites and Asian/Pacific Islanders.
The majority (75%) of births were to
mothers ages 20 to 34 years, 14% were to teen girls ages 19 or under and 11% were to women ages 35 and older.
In 1999, about 62% of the mothers
had at least a high school diploma, compared to the County rate of 79%.
Birth Rate: Number of babiesborn alive per1,000 people.
Source: Birth Files, ACPHD
Source: Birth Files, Alameda County Public Health Department(ACPHD); Claritas 1999 pop estimates
Race/ Ethnicity of All Births, West Oakland 1999
Total Births = 332
American Indian0.3%
Asian/ Pacific
Islander7.3%
Latino20.9%
White7.3%
African American
64.2%
Birth Rate, West Oakland vs. Alameda County 1990 and 1999
30.3
18.1 16.214.1
0
10
20
30
40
1990 1999
Rat
e pe
r 1,0
00 p
eopl
e
West OaklandAlameda County

West Oakland Community Information Book 2001
Alameda County Public Health Department
Page 26
Infant Deaths Rate of infant deaths is often used to measure the health status of a community, as it signifies the overall health of mothers and their ability to access health care. It is highly sensitive to changes in the social, physical, and economic environment of the community. Some infant deaths, such as those caused by congenital
anomalies (i.e. problems with formation of the baby before birth), are difficult to prevent. However, many infant deaths can be prevented. Examples include deaths caused by car crashes, abuse, poor nutrition, and accidents at home. Also, inadequate prenatal care, substance abuse and smoking by mother during pregnancy, preterm birth, low birth weight, and complications during pregnancy are associated with high risk of infant deaths. From 1990 to 1998, there were 49 infant deaths in West Oakland.
Over the last decade, Sudden Infant
Death Syndrome (SIDS) accounted for 34.7% of infant deaths in West Oakland.
Almost one third of infant deaths
(32.7%) were due to problems that develop around the time of birth (perinatal conditions), such as infections in the mother, malnutrition and slow growth of the unborn baby, and birth trauma.
Congenital anomalies accounted for
8.2% of infant deaths and 24.5% were due to some other causes.
Over the last decade, the majority of
infant deaths were to African Americans (83.7%) in the West Oakland community. About 10% of the infant deaths were among Whites, 4.1% among Latinos, and 2% among Asian/Pacific Islanders.
Race/Ethnicity of Infant Deaths West Oakland, 1990-98
Total Infant Deaths = 49
White10.2%
African American
83.7%Asian/ Pacific
Islander2.0%
Latino4.1%
Infant Death: The death of ababy before thefirst birthday.
Source: Death Files, ACPHD
Causes of Infant Deaths West Oakland 1990-98Total Infant Deaths = 49
Perinatal Conditions
32.7%
SIDS34.7%
Other24.5%
Congenital Anomalies
8.2%
Source: Death Files, ACPHD

West Oakland Community Information Book 2001
Alameda County Public Health Department
Page 27
Low Birth Weight Achieving a healthy weight is crucial for a newborn's survival. Babies born with low birth weight (LBW) have a greater risk of illness and death. Therefore, improvements in infant birth weight can contribute substantially to reducing a baby's risk of illness and death. From 1997 to 1999, about 10.5% of the babies
born in West Oakland were low birth weight, higher than the County rate of 6.9%. There were about 36 low birth weight births in West Oakland per year. The National Objective for Year 2000 for percent of babies born low birth weight is 5%.
In the last decade, percent of babies born weighing less than 2,500 grams
in West Oakland was highest in 1993. Since then, the percent LBW births remained constant, and decreased in the last two years, down to 7.9% in 1998, the lowest since 1990.
About 13% of babies born to African Americans were born low birth
weight.
Low Birth Weight Infants: Babies weighing lessthan 2,500 grams (5 lbs, 8 oz) at birth.
Source: Birth Files, ACPHD
Percent Low Birth Weight Babies W. Oakland, 1997-99 (3-year Average)
10.5%
6.9%
0%
4%
8%
12%
West Oakland Alameda County
Perc
ent L
BW
Percent Low Birth Weight Babies, West Oakland 1990 - 1999
0%5%
10%15%20%
1990 1991 1992 1993 1994 1995 1996 1997 1998 1999
% L
BW
Bab
ies
Source: Birth Files, ACPHD
HP 2000=5%

West Oakland Community Information Book 2001
Alameda County Public Health Department
Page 28
Early Prenatal Care Pregnant women are encouraged to get prenatal care during the first three months of their pregnancy. Early prenatal care is important in: identifying and treating health problems early in the
pregnancy to reduce future complications; recognizing risk factors in the mother’s behavior
such as drug and alcohol abuse that put the fetus at risk for poor birth outcomes;
providing a healthy start for newborns.
Many factors affect a woman's ability to receive early prenatal care. These include the lack of culturally appropriate pregnancy testing sites, young age of mother, and multiple previous pregnancies. Domestic violence, cultural beliefs, drug abuse, single parenthood, and poverty also can prevent women from receiving timely prenatal care.
Between 1997 and 1999, 78.3% of pregnant women in West Oakland
received early prenatal care. This was lower than the County rate of 87.4% and the National Year 2000 Objective of 90%.
Prenatal Care: Pregnancy- related health care provided to women during pregnancy.
Source: Birth Files, ACPHD
Early Entry into Prenatal Care 1997-99 (3-year Average)
78.3%87.4%
0%
30%
60%
90%
W est Oakland Alameda County
% E
arly
Pre
nata
l Car
e HP 2000 =90%
West Oakland Community Information Book 2001
Alameda County Public Health Department
Page 29
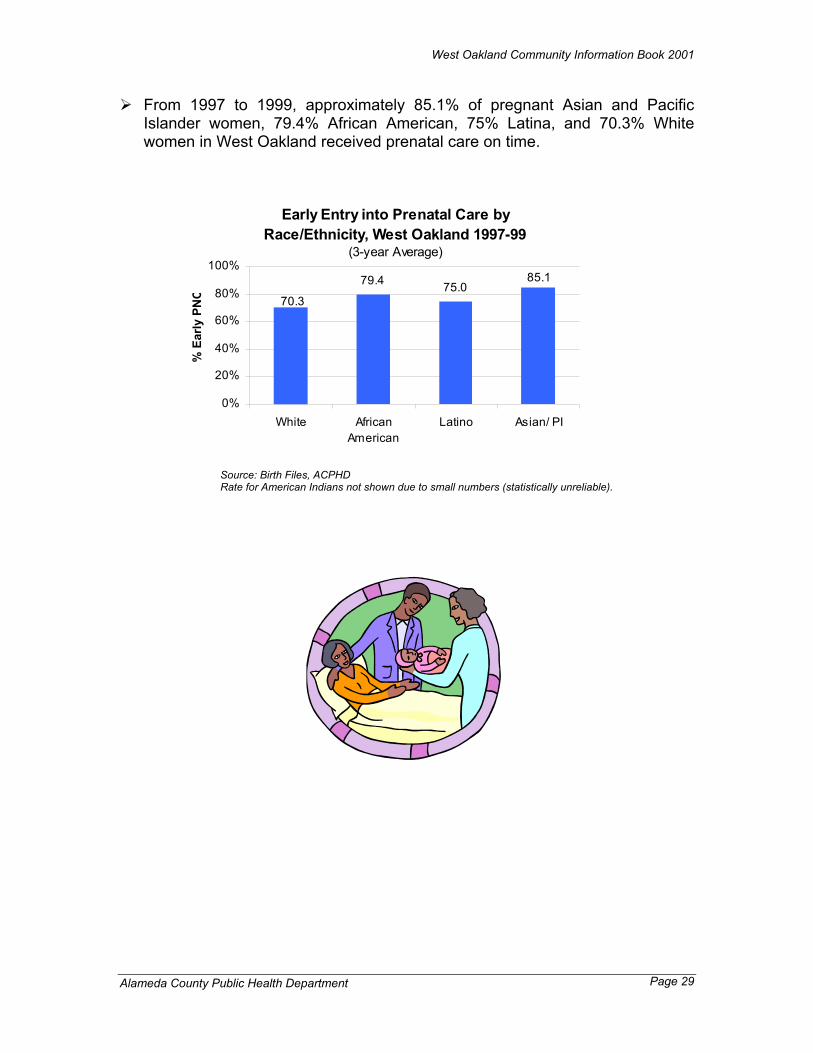
From 1997 to 1999, approximately 85.1% of pregnant Asian and Pacific Islander women, 79.4% African American, 75% Latina, and 70.3% White women in West Oakland received prenatal care on time.
Early Entry into Prenatal Care by Race/Ethnicity, West Oakland 1997-99
(3-year Average)
85.175.079.4
70.3
0%
20%
40%
60%
80%
100%
White AfricanAmerican
Latino Asian/ PI
% E
arly
PN
C
Source: Birth Files, ACPHD Rate for American Indians not shown due to small numbers (statistically unreliable).

West Oakland Community Information Book 2001
Alameda County Public Health Department
Page 30
Teen Births Youth are an important part of the community. They bring to the community many assets, including their energy and creativity. Helping young people grow up to be healthy, caring, and responsible adults is one way to build a healthy community. The more assets young people have, the more likely they are to be healthy, succeed in school, resist danger, and persevere in difficult times. These assets include support from caring adults, high self-esteem, positive role models, and a positive view of his or her future. These assets help youth overcome the many challenges including lack of accessible health care, poverty, lack of after-school and community activities, violence and substance abuse. One of the major challenges teenagers face is unintentionally becoming a parent. Being a teen parent makes it more difficult for teens to achieve their educational goals, get a good job, and become financially independent. From 1997 to 1999, there was an
average of 22 births per year to girls ages 15-17 in West Oakland. The rate was 47.4 births per 1,000 girls, almost twice the County rate of 24.7.
Teen Birth Rate1997-99 (3-year Average)
24.7
47.4
0
1020
3040
50
West Oakland Alameda County
Birt
hs p
er 1
,000
Girl
s 15
-17
Understanding Teen Births Teen births are the number of babiesborn to girls ages 15-17. The number of teen births is not thesame as the number of teenpregnancies. One study showed thatabout half (51%) of all teenpregnancies end in birth, 35% inabortion, and 14% in miscarriage(Guttmacher Institute, 1994).Therefore, the number of teenpregnancy may be much higher thanteen birth.
Source: Birth Files, ACPHD; Claritas 1999 estimates

West Oakland Community Information Book 2001
Alameda County Public Health Department
Page 31
In the last decade, births per 1,000 teen girls in West Oakland has dropped
significantly from the peak rate of 133.0 per 1,000 in 1990. In 1999, the teen birth rate was the lowest in the last decade at 38.4 per 1,000 teen girls.
Teen Birth Rate 1990 - 1999 West Oakland vs. Alameda County
0
27
54
81
108
135
1990 1991 1992 1993 1994 1995 1996 1997 1998 1999
Birt
h R
ate
per 1
,000
Fem
ales
15-
17
W est Oakland Alameda County
Source: Birth Files, ACPHD; Claritas 1999 estimates

West Oakland Community Information Book 2001
Alameda County Public Health Department
Page 32
Child Abuse and Neglect Child abuse and neglect are complex issues that need to be addressed in a multitude of ways. Child abuse consists of any act that endangers or impairs a child's physical or emotional health and development. Child abuse includes physical, emotional, and sexual abuse, as well as physical and emotional neglect. Child abusers are found among people of all income levels, religious and ethnic groups, and are often ordinary people who are having problems coping with their own stressful life situation. It is very difficult to measure the actual number of child abuse cases in a community. Data reported
here is the number of cases that were investigated and confirmed by the Alameda County Social Services Agency as child abuse. Since many child abuse cases are not reported, this figure may underestimate the actual rate. The rate of child abuse cases in West Oakland cannot be calculated reliably.
However, in West Oakland as of December 1999, 13.1 out of 1,000 children were confirmed as abused or neglected, compared with about 6 out of 1,000 children in Alameda County.
Source: Social Services Agency, Alameda County
Rate of Child Abuse/ Neglect: Number of abused orneglected childrenages 0-17 per 1,000.
Rate of Child Abuse/Neglect, West Oakland vs. Alameda County 12/99
5.9
13.1
0
3
6
9
12
15
West Oakland Alameda County
Rat
e pe
r 1,0
00
Chi
ldre
n U
nder
18

West Oakland Community Information Book 2001
Alameda County Public Health Department
Page 33

West Oakland Community Information Book 2001
Alameda County Public Health Department Page 34
Hospitalization
Information on hospitalization provides important clues to a population’s health problems. In this section, leading causes of hospitalization are shown for the zip code that covers the West Oakland Community Health Team area. This is followed by sections on asthma, diabetes and injury hospitalizations. The West Oakland area lies in zip code 94607. This zip code also includes Chinatown.
What do the hospitalization data tell us? They tell us about those illnesses or injuries that are serious enough to get
people admitted to the hospital. They tell us the number of hospital discharges. Thus, a person hospitalized
twice is counted twice. They give us information at the zip code level, so if a zip code covers a large
area, we cannot know if the illnesses are evenly dispersed within that zip code or if they are concentrated in certain areas.
They do not tell us about the prevalence of a given illness in the population
since many who have the illness are not hospitalized for it.

West Oakland Community Information Book 2001
Alameda County Public Health Department Page 35
Leading Causes of Hospitalization There was an average of 3,172 hospitalizations per year (1996-1998) in the
West Oakland/Chinatown area.
Childbirth and complications of pregnancy was the leading cause of
hospitalization. Many such births are completely normal deliveries or deliveries with routine complications. Others involve more serious complications.*
Respiratory disorders were the second leading cause, followed by heart
disease, mental disorders and injuries. Respiratory Disorders commonly include upper respiratory infections, bronchitis, pneumonia, and asthma.
* Common complications include tubal pregnancy, miscarriage, maternal high blood pressure, early labor, late delivery, breech presentation, problems with placenta or umbilical cord, cesarean or previous cesarean, fetal distress, perineal tearing, forceps or vacuum delivery.
Source: Office of Statewide Health Planning and Development
3-Year average number hospitalizations=3172
Leading Causes of Hospitalization, West Oakland (94607)
12.5
10.2
8.6
7.9
7.6
0 5 10 15 20
Childbirth & Complications ofPregnancy
Respiratory Disorders
Heart Disease
Mental Disorders
Injuries
Percent of Total

West Oakland Community Information Book 2001
Alameda County Public Health Department Page 36
Heart Disease commonly includes high blood pressure, heart attack, blood clot in the lungs, irregular heart beat, heart failure and other kinds of heart disease, both acute and chronic.
Mental disorders commonly include alcohol and drug dependence and
associated psychotic states, schizophrenic disorders, other types of psychotic disorders, depression, and adjustment reaction disorders.
The most common types of injuries were fractures, followed by head injuries,
other types of wounds, and poisoning. Digestive system disorders, which are seen among the five leading causes of
hospitalization for some race/ethnic groups in the next section, commonly include ulcers, appendicitis, abdominal hernias, gastroenteritis, colitis, chronic liver disease, diseases of the gall bladder and pancreas.

West Oakland Community Information Book 2001
Alameda County Public Health Department Page 37
The leading causes of hospitalization vary among different racial/ethnic groups and by community. The table below shows the leading causes of hospitalization for each race/ethnic group. The numbers in parentheses reflect the yearly average number of hospitalizations for a given cause.
Among Latinos, childbirth and complications of pregnancy was the leading
cause of hospitalization, followed by injuries, digestive system disorders, respiratory disorders, and mental disorders.
Among African Americans, respiratory disorders were the leading cause of
hospitalization, followed by childbirth and complications of pregnancy, heart disease, mental disorders and injuries.
Among Asian/Pacific Islanders, childbirth and complications of pregnancy was
the leading cause of hospitalization, followed by respiratory disorders, heart disease, digestive system disorders, and cancer.
Among Whites, mental disorders were the leading cause of hospitalization,
followed by injuries, heart disease, respiratory disorders, childbirth and complications of pregnancy, and digestive system disorders. Whites were the only group for whom mental disorders were the leading cause of hospitalization.
Asian/Pacific Islanders were the only racial/ethnic group for which cancer
ranked in the top five. Further work is needed to see if Asian/Pacific Islanders have higher rates of hospitalization for cancer or if cancer ranks in the top five simply because other illnesses seen in other racial/ethnic groups, such as mental disorders, do not.
Note: Ranks for American Indians are not shown due to the small number of hospitalizations.*Includes complications of both childbirth and pregnancy.
Leading Causes of Hospitalization by Race/Ethnicity (3-Year Average,1996-98), Zip Code 94607African Asian/
Rank Latino American Pacific Islander White1 Childbirth/Comp Preg* (52) Respiratory Disorders (232) Childbirth/Comp Preg* (70) Mental Disorders (45)
2 Injuries (15) Childbirth/Comp Preg* (222) Respiratory Disorders (52) Injuries (28)
3 Digestive system (12) Heart Disease (198) Heart Disease (47) Heart Disease (21)
4 Respiratory Disorders (11) Mental Disorders (177) Digestive system (45) Respiratory Disorders (20)Childbirth/Comp Preg* (20)
5 Mental Disorders (8) Injuries (165) Cancer (27) Digestive system (19)Injuries (27)

West Oakland Community Information Book 2001
Alameda County Public Health Department Page 38
Hospitalization for Asthma Asthma is a serious respiratory condition that affects about 10 million people in the United States. It is more common among children than adults. The level of asthma in the population is thought to be increasing. Environmental factors, including both indoor and outdoor air pollution, may have contributed to this increase. Access to health services is important for proper treatment of asthma.
From 1996 to 1998, asthma
hospitalization rates were highest among children 14 years and under. There was an average of 88 asthma hospitalizations per year in the 94607 zip code (West Oakland and Chinatown). Among these, 44 (50%) were children 14 and under.
The age-adjusted rate of
asthma hospitalizations in the 94607 zip code was 969 per 100,000 children age 14 and under.
This community rate was
2.7 times higher than that for children in the county as a whole, and it was more than 4 times the national Healthy People 2000 objective of 225 per 100,000 children 14 and under.
Age-Adjusted Rates of Asthma Hospitalization Children Age 14 and Under
(1996-98 Three-Year Average)
969
364
0
200
400
600
800
1000
1200
94607 Alameda County
Rat
e pe
r 100
,000
What is an age-adjusted rate? It is a single, summary number thatreflects the rate of hospitalizationsacross different age groups, but in away that is comparable to otherpopulations (communities, counties orstates) with age groups of differentsizes. (See note in section on overalldeaths).
HP2000 Objective =225
Source: Office of Statewide Health Planning and Development

West Oakland Community Information Book 2001
Alameda County Public Health Department Page 39
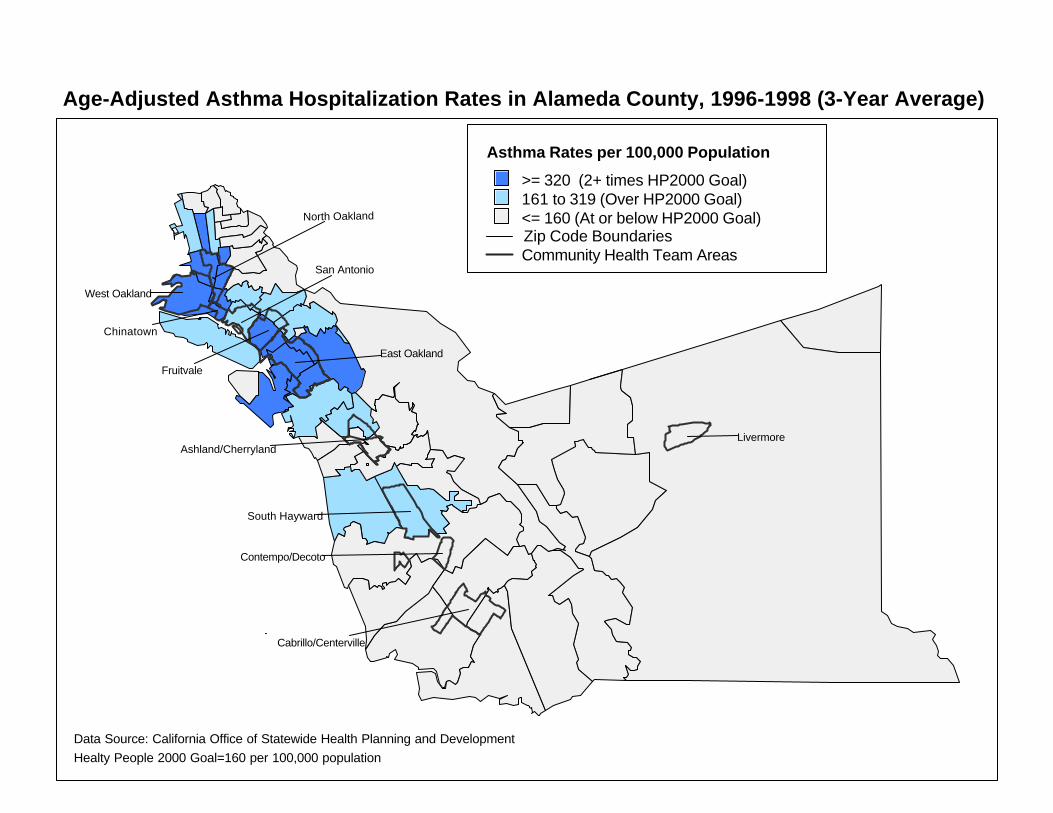
A map of asthma hospitalization rates for all Alameda County zip codes is shown on the next page. These are age-adjusted rates per 100,000 people and are for the total population. The age-adjusted rate for all asthma hospitalizations in the 94607 zip code
was 512.5 per 100,000 population (based on a three-year average of 88 hospitalizations per year).
This rate is three times the Healthy People 2000 national objective of 160
asthma hospitalizations per 100,000 population for all ages (note that this objective is slightly lower than that established for children 14 and under).
For Alameda County the comparable rate was 175, not far above the national
objective. Higher rates of hospitalization for asthma may mean that there is more asthma in the population. It may also mean that those who have asthma do not obtain the medical care they need to manage their asthmatic condition. Without proper health care, asthmatics are more likely to have a severe attack that results in admission to the hospital.
North Oakland
San Antonio
West Oakland
Cabrillo/Centerville
Livermore
Contempo/Decoto
East OaklandFruitvale
South Hayward
Ashland/Cherryland
Chinatown
Asthma Rates per 100,000 Population>= 320 (2+ times HP2000 Goal)161 to 319 (Over HP2000 Goal)<= 160 (At or below HP2000 Goal)
Data Source: California Office of Statewide Health Planning and Development
Age-Adjusted Asthma Hospitalization Rates in Alameda County, 1996-1998 (3-Year Average)
Zip Code BoundariesCommunity Health Team Areas
Healty People 2000 Goal=160 per 100,000 population
West Oakland Community Information Book 2001
Alameda County Public Health Department Page 41
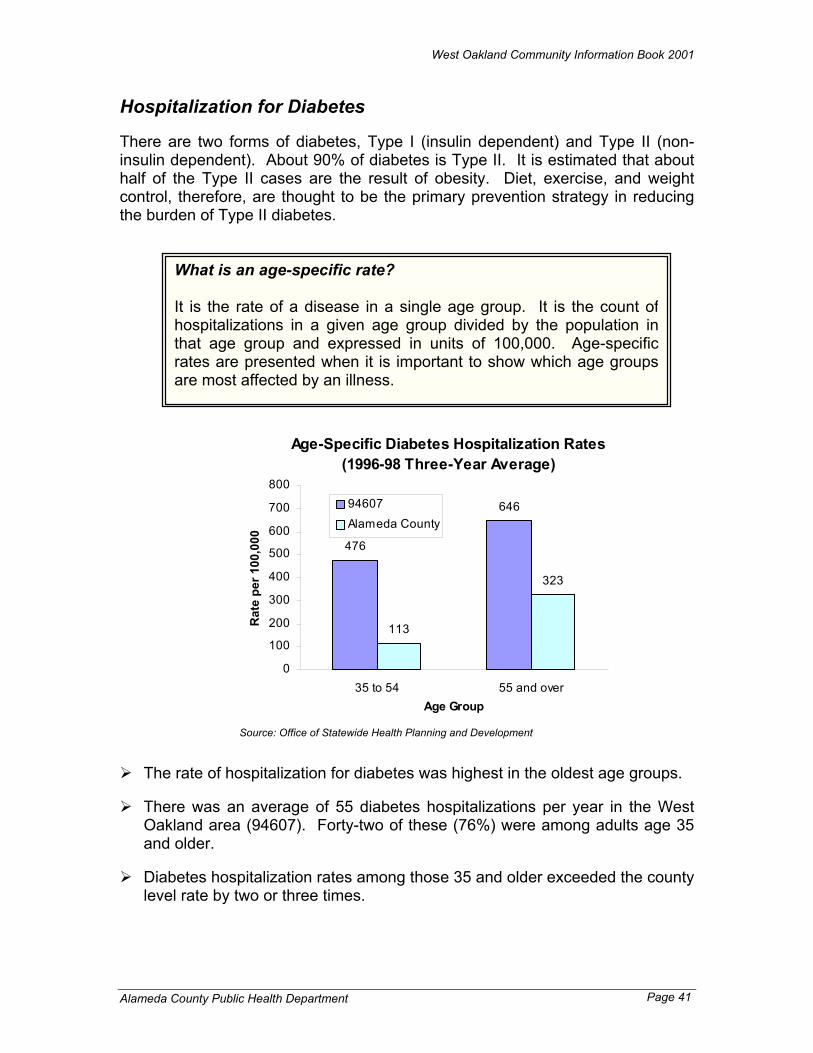
Hospitalization for Diabetes There are two forms of diabetes, Type I (insulin dependent) and Type II (non-insulin dependent). About 90% of diabetes is Type II. It is estimated that about half of the Type II cases are the result of obesity. Diet, exercise, and weight control, therefore, are thought to be the primary prevention strategy in reducing the burden of Type II diabetes.
The rate of hospitalization for diabetes was highest in the oldest age groups.
There was an average of 55 diabetes hospitalizations per year in the West
Oakland area (94607). Forty-two of these (76%) were among adults age 35 and older.
Diabetes hospitalization rates among those 35 and older exceeded the county
level rate by two or three times.
Age-Specific Diabetes Hospitalization Rates (1996-98 Three-Year Average)
476
646
113
323
0
100
200
300
400
500
600
700
800
35 to 54 55 and overAge Group
Rat
e pe
r 100
,000
94607Alameda County
What is an age-specific rate? It is the rate of a disease in a single age group. It is the count ofhospitalizations in a given age group divided by the population inthat age group and expressed in units of 100,000. Age-specificrates are presented when it is important to show which age groupsare most affected by an illness.
Source: Office of Statewide Health Planning and Development

West Oakland Community Information Book 2001
Alameda County Public Health Department Page 42
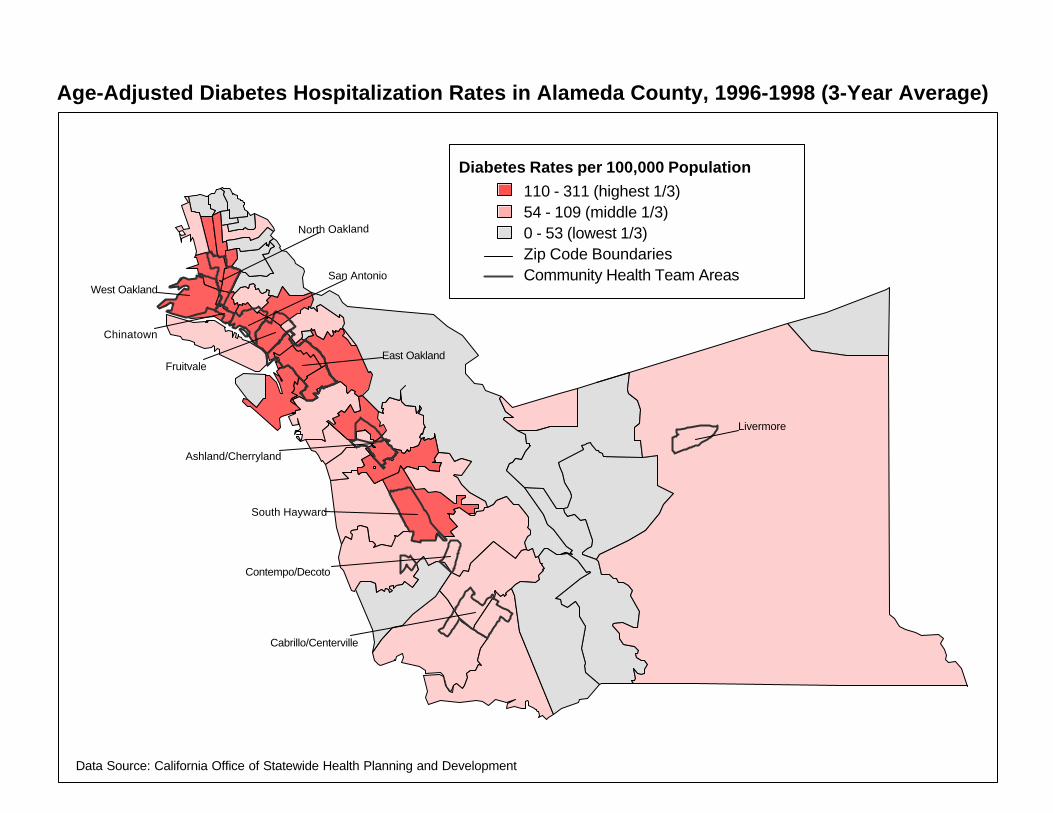
A map of diabetes hospitalization rates for all Alameda County zip codes is shown on the next page. These are age-adjusted rates per 100,000 people and are for the total population. The age-adjusted rate for diabetes hospitalization in the 94607 zip code area
was 300.4 per 100,000 population (based on a three-year average of 55 hospitalizations per year).
For Alameda County the comparable rate was 100.4 per 100,000 population,
one-third the community rate.
Cabrillo/Centerville
Contempo/Decoto
South Hayward
Livermore
North Oakland
San AntonioWest Oakland
Chinatown
FruitvaleEast Oakland
Ashland/Cherryland
Age-Adjusted Diabetes Hospitalization Rates in Alameda County, 1996-1998 (3-Year Average)
Diabetes Rates per 100,000 Population110 - 311 (highest 1/3)54 - 109 (middle 1/3)0 - 53 (lowest 1/3)Zip Code Boundaries
Data Source: California Office of Statewide Health Planning and Development
Community Health Team Areas

West Oakland Community Information Book 2001
Alameda County Public Health Department Page 44
Hospitalization for Injury Every year there are about 2.5 million injuries in the United States that require hospitalization. Among young people, males are hospitalized more often than females for injury, while among elderly people, females are hospitalized more often than males. The most common types of injuries are fractures, followed by poisonings, open wounds and head injuries.
An average of 218 injury hospitalizations occurred each year in the 94607 zip
code area. The highest rate of injuries requiring hospitalization was among those aged
55 and older, most often from fractures. While the rates of injury hospitalization in the West Oakland/Chinatown area
exceeded those in the rest of Alameda County, the most notable differences were in the 15-34 and the 35-54 age groups.
In West Oakland, 41% of injury hospitalizations in the 15-34 age group and
34% in the 35-54 age group were due to assault (intentional harm), while in the other age groups 11% or fewer injury hospitalizations were due to assault.
By comparison, in Alameda County, 22% of injury hospitalizations in the 15-
34 age group and 15% in the 35-54 age group were due to assault, while in the other age groups 6% or fewer injury hospitalizations were due to assault.
Age-Specific Injury Hospitalization Rates (1996-98 Three-Year Average)
423
1070
16771938
250
554 514
1540
0
500
1000
1500
2000
2500
14 & under 15 to 34 35 to 54 55 & over
Age Group
Rat
e pe
r 100
,000
94607
Alameda County
Source: Office of Statewide Health Planning and Development

West Oakland Community Information Book 2001
Alameda County Public Health Department Page 45
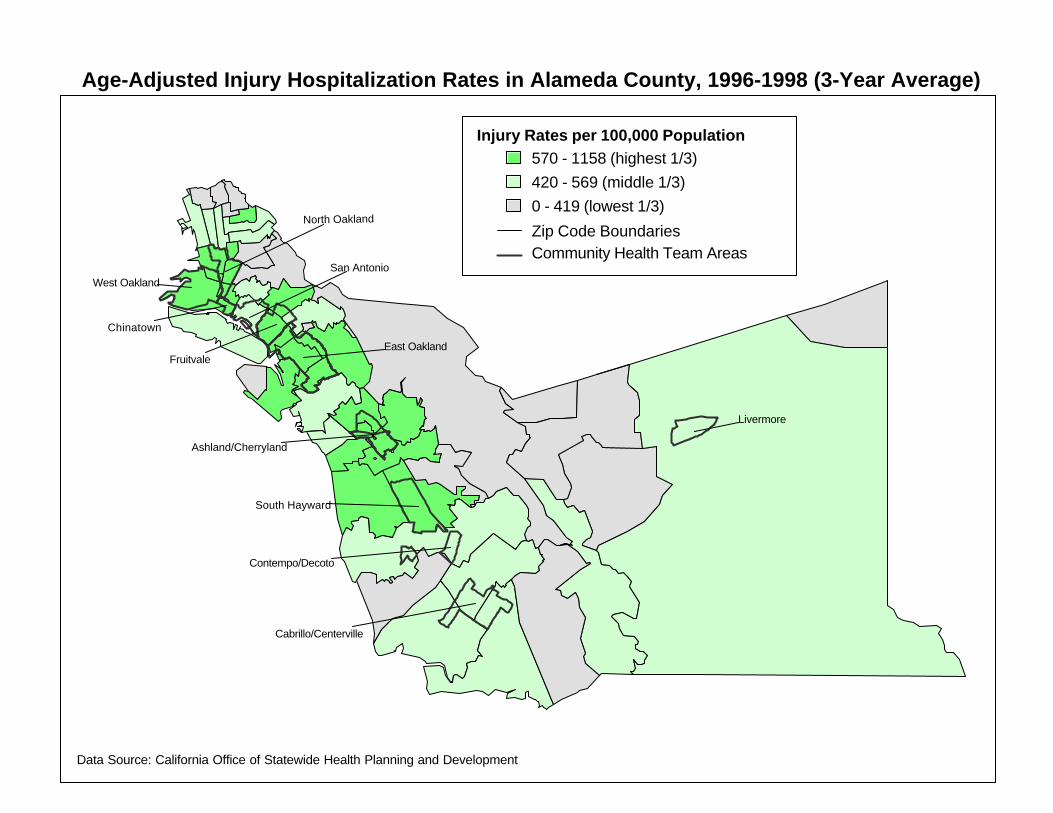
A map of injury hospitalization rates for all Alameda County zip codes is shown on the next page. These are age-adjusted rates per 100,000 people and are for the total population. The age-adjusted rate of injury hospitalization was 1158.3 per 100,000 total
population in 94607 (based on a three-year average of 9,115 hospitalizations per year.
For Alameda County the comparable rate was 553.5 per 100,000 population,
one-half the West Oakland/Chinatown rate.
Cabrillo/Centerville
Contempo/Decoto
South Hayward
Livermore
North Oakland
San AntonioWest Oakland
Chinatown
FruitvaleEast Oakland
Ashland/Cherryland
Age-Adjusted Injury Hospitalization Rates in Alameda County, 1996-1998 (3-Year Average)
Injury Rates per 100,000 Population570 - 1158 (highest 1/3)420 - 569 (middle 1/3)0 - 419 (lowest 1/3)
Community Health Team Areas
Data Source: California Office of Statewide Health Planning and Development
Zip Code Boundaries

West Oakland Community Information Book 2001
Alameda County Public Health Department Page 47
Overall Deaths
Information on deaths plays an important role in assessing the health status of a community. Data collected from death certificates can provide information about the frequency and the seriousness of disease or injury as it occurs in a community and can guide prevention efforts. In this section, we examine how many people are dying, who is dying and of what causes, and present the overall age-adjusted death rate and the leading causes of death.
The overall age-adjusted death rate in West Oakland for the years 1996-98
was 741.2 deaths per 100,000 residents per year.♣ This rate was much higher than Alameda County’s rate of 431.7 deaths per 100,000.
♣ Adjusted to 1940 US standard population
Age-Adjusted Death Rate: An age-adjusted death rate is a measure of the number of deaths in acommunity that takes into account the age distribution of the population. It isexpressed as the number of deaths per 100,000 people. The main purposefor using age-adjusted death rates is to compare the rates from onepopulation to that of another population. For example, one community mayhave a large population of seniors, while another community may have a lot ofyoung families with children. The community with more seniors is more likelyto have a higher number of deaths than the younger community. Therefore, itis difficult to compare these two communities without taking into account thedifferent age make-up of each community. By using this measure, we adjustfor the differences in the age make-up of the community so that we cancompare across different communities.
Source: Alameda County Public Health Department Vital Statistics
Overall Age-Adjusted Death Rate West Oakland and Alameda County
1996-98 (3-year Average)741.2
431.7
0
200
400
600
800
West Oakland Alameda County
Dea
ths
per 1
00,0
00

West Oakland Community Information Book 2001
Alameda County Public Health Department Page 48
In West Oakland, there were 564 deaths between 1996-1998, an average of 188 deaths per year. Among those who died, 52% were males and 48% were females.
Twelve percent of all deaths were among those aged 25 to 44.
Twenty-five percent of all deaths were among those aged 45 to 64.
Fifty-nine percent of those who died were 65 years of age and older.
Eighty-six percent of those who died were African Americans, 6% were Whites, 5% were Asian/Pacific Islanders, and 3% were Latinos.
Source: Alameda County Public Health Department Vital Statistics
Overall Deaths by Race/EthnicityWest Oakland, 1996-98
(Average Annual Deaths=188)
African American86%
White6%Asian/Pacific
Islander5%
Latino3%

West Oakland Community Information Book 2001
Alameda County Public Health Department Page 49
Leading Causes of Death The number one cause of death in West Oakland during 1996-98 was heart
disease, which accounted for 27% of all deaths.
The second leading cause of death was cancer, which made up 22% of all deaths, followed by stroke, which made up 8% of all deaths.
The three leading causes of death accounted for 58% of all deaths in West Oakland during 1996-98.
Influenza and pneumonia ranked fourth and homicide was fifth.
The top four causes of death in West Oakland were the same as those in Alameda County as a whole.
Leading Causes of Death by Age
For adults aged 25 to 44, the two leading causes of death were AIDS and homicide, which accounted for 39% of all deaths in this age group.
For adults aged 45 to 64, cancer was the number one cause of death and
accounted for 35% of all deaths in this age group. For seniors aged 65 and older, heart disease was the leading cause of death
and accounted for 34% of all deaths in this age group.
Source: Alameda County Public Health Department Vital Statistics
Leading Causes of Death in West Oakland, 1996-98(Total 3-year Deaths=564)
4%
4%
8%
22%
27%
0% 5% 10% 15% 20% 25% 30%
Homicide
Influenza and Pneumonia
Stroke
Cancer
Heart Disease
Percent of Deaths

West Oakland Community Information Book 2001
Alameda County Public Health Department Page 50
Leading Causes of Death by Sex
Heart disease and cancer were the top two causes of death for both sexes, the same as in the overall group.
For males, homicide was the third leading cause of death, followed closely by
stroke. Influenza/pneumonia and unintentional injuries (except motor vehicle accidents) ranked together as fifth.
For females, stroke and diabetes were the third and fourth leading causes of
death. Influenza and pneumonia ranked fifth. Leading Causes of Death by Race and Ethnicity
Heart disease and cancer were the top two causes of death for African Americans and Whites in West Oakland.
For African Americans, stroke ranked third, influenza and pneumonia ranked
fourth, and AIDS, homicide, and mental disorder together ranked fifth in leading causes of death.
For Asian/Pacific Islanders, cancer was the number one cause of death,
followed by stroke. Leading Causes of Death by Race/Ethnicity in West Oakland, 1996-98
Rank White African American Asian/Pacific Islander
1 Heart Disease (6) Heart Disease (141) Cancer (10)
2 Cancer (5) Cancer (109) Stroke (6)
3 * Stroke (37) *
4 * Influenza and Pneumonia (17)
*
5 * AIDS (16) Homicide (16) Mental Disorder (16)
*
Note: Ranks for Latinos and American Indians are not shown due to the small number of deaths. The numbers in ( ) are 3-year total number of deaths. * Fewer than 5 cases during the 3-year period Source: Alameda County Public Health Department Vital Statistics

West Oakland Community Information Book 2001
Alameda County Public Health Department Page 51
Education
School Profiles
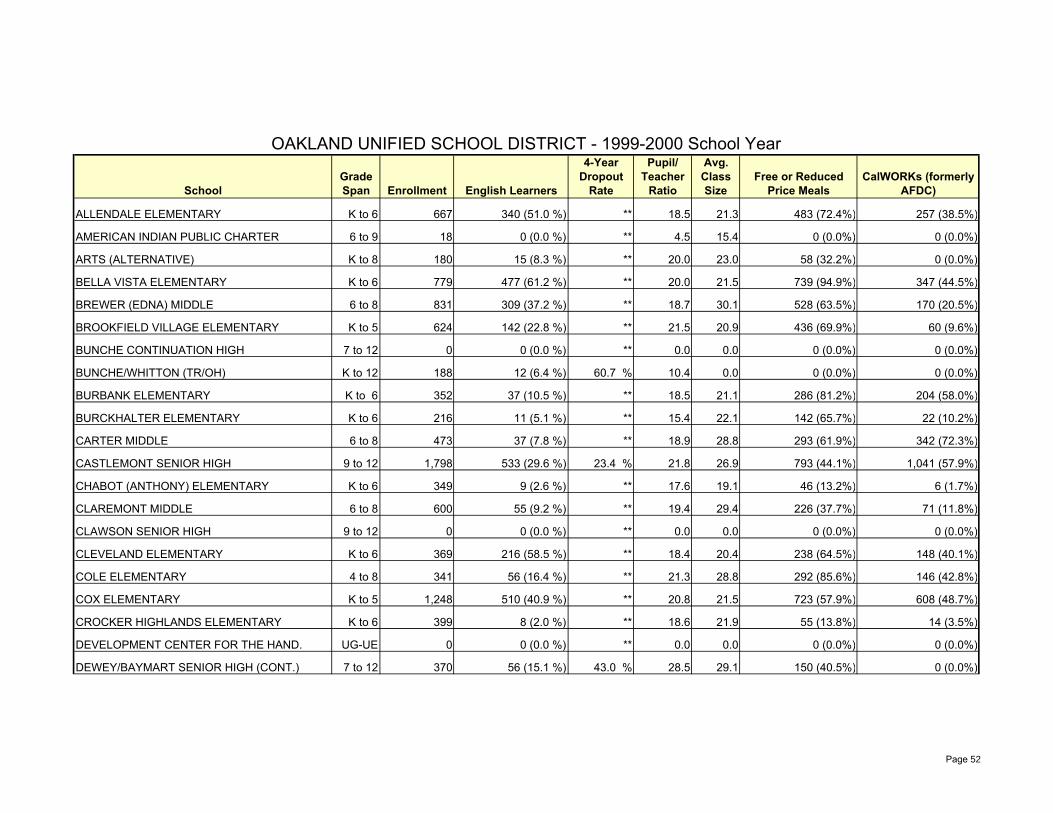
Schools are core institutions in the neighborhood. The table that follows contains information on schools in the Oakland Unified School District. The information is provided by the California Department of Education and is based on enrollment for the 1999-2000 school year. Terms used in the school profile tables are defined in the box below. Each school in the district is listed in alphabetical order by name.
Grade Span is the range of grade levels attending a given school. ‘UG’ thatappears in some cases stands for ‘Ungraded.’ Enrollment is the number of students formally enrolled in the school. English Learners are those students whose primary language is not Englishand who are not proficient in a range of English language skills. Four-Year Drop-out Rate is an estimate of the percent of students who woulddrop out in a four year period based on the single year dropout rate of 9th
through 12th graders. The information is only presented for schools that havegrades 9-12 attending. All other schools have ‘**’ in the column. Pupil/Teacher Ratio is the school enrollment divided by the number of full-time teachers. Average Class Size is the school enrollment divided by the number ofclasses. Free or Reduced Price Meals. This is the number of eligible economicallydisadvantaged students who are signed up for the program. CalWORKs is the number of students participating in the California WorkOpportunity and Responsibility to Kids welfare reform program.
SchoolGrade Span Enrollment English Learners
4-Year Dropout
Rate
Pupil/ Teacher
Ratio
Avg. Class Size
Free or Reduced Price Meals
CalWORKs (formerly AFDC)
ALLENDALE ELEMENTARY K to 6 667 340 (51.0 %) ** 18.5 21.3 483 (72.4%) 257 (38.5%)
AMERICAN INDIAN PUBLIC CHARTER 6 to 9 18 0 (0.0 %) ** 4.5 15.4 0 (0.0%) 0 (0.0%)
ARTS (ALTERNATIVE) K to 8 180 15 (8.3 %) ** 20.0 23.0 58 (32.2%) 0 (0.0%)
BELLA VISTA ELEMENTARY K to 6 779 477 (61.2 %) ** 20.0 21.5 739 (94.9%) 347 (44.5%)
BREWER (EDNA) MIDDLE 6 to 8 831 309 (37.2 %) ** 18.7 30.1 528 (63.5%) 170 (20.5%)
BROOKFIELD VILLAGE ELEMENTARY K to 5 624 142 (22.8 %) ** 21.5 20.9 436 (69.9%) 60 (9.6%)
BUNCHE CONTINUATION HIGH 7 to 12 0 0 (0.0 %) ** 0.0 0.0 0 (0.0%) 0 (0.0%)
BUNCHE/WHITTON (TR/OH) K to 12 188 12 (6.4 %) 60.7 % 10.4 0.0 0 (0.0%) 0 (0.0%)
BURBANK ELEMENTARY K to 6 352 37 (10.5 %) ** 18.5 21.1 286 (81.2%) 204 (58.0%)
BURCKHALTER ELEMENTARY K to 6 216 11 (5.1 %) ** 15.4 22.1 142 (65.7%) 22 (10.2%)
CARTER MIDDLE 6 to 8 473 37 (7.8 %) ** 18.9 28.8 293 (61.9%) 342 (72.3%)
CASTLEMONT SENIOR HIGH 9 to 12 1,798 533 (29.6 %) 23.4 % 21.8 26.9 793 (44.1%) 1,041 (57.9%)
CHABOT (ANTHONY) ELEMENTARY K to 6 349 9 (2.6 %) ** 17.6 19.1 46 (13.2%) 6 (1.7%)
CLAREMONT MIDDLE 6 to 8 600 55 (9.2 %) ** 19.4 29.4 226 (37.7%) 71 (11.8%)
CLAWSON SENIOR HIGH 9 to 12 0 0 (0.0 %) ** 0.0 0.0 0 (0.0%) 0 (0.0%)
CLEVELAND ELEMENTARY K to 6 369 216 (58.5 %) ** 18.4 20.4 238 (64.5%) 148 (40.1%)
COLE ELEMENTARY 4 to 8 341 56 (16.4 %) ** 21.3 28.8 292 (85.6%) 146 (42.8%)
COX ELEMENTARY K to 5 1,248 510 (40.9 %) ** 20.8 21.5 723 (57.9%) 608 (48.7%)
CROCKER HIGHLANDS ELEMENTARY K to 6 399 8 (2.0 %) ** 18.6 21.9 55 (13.8%) 14 (3.5%)
DEVELOPMENT CENTER FOR THE HAND. UG-UE 0 0 (0.0 %) ** 0.0 0.0 0 (0.0%) 0 (0.0%)
DEWEY/BAYMART SENIOR HIGH (CONT.) 7 to 12 370 56 (15.1 %) 43.0 % 28.5 29.1 150 (40.5%) 0 (0.0%)
OAKLAND UNIFIED SCHOOL DISTRICT - 1999-2000 School Year
Page 52

SchoolGrade Span Enrollment English Learners
4-Year Dropout
Rate
Pupil/ Teacher
Ratio
Avg. Class Size
Free or Reduced Price Meals
CalWORKs (formerly AFDC)
EAST BAY CONSERVATION CORPS CH K to 12 0 0 (0.0 %) ** 0.0 22.3 0 (0.0%) 0 (0.0%)
ELMHURST MIDDLE 6 to 8 1,014 371 (36.6 %) ** 23.0 30.9 577 (56.9%) 407 (40.1%)
EMERSON ELEMENTARY K to 5 378 73 (19.3 %) ** 19.9 21.6 275 (72.8%) 378 (100.0%)
FAR WEST (CONT.) 9 to 12 92 15 (16.3 %) 18.2 % 19.2 18.6 15 (16.3%) 0 (0.0%)
FOSTER MIDDLE 5 to 8 403 99 (24.6 %) ** 21.2 17.8 378 (93.8%) 232 (57.6%)
FRANKLIN YEAR-ROUND ELEMENTARY K to 6 911 648 (71.1 %) ** 18.0 20.1 793 (87.0%) 341 (37.4%)
FREMONT SENIOR HIGH 10 to 12 2,258 953 (42.2 %) 35.9 % 23.6 30.0 895 (39.6%) 1,020 (45.2%)
FRICK MIDDLE 7 to 9 760 193 (25.4 %) ** 20.0 30.6 395 (52.0%) 407 (53.6%)
FRUITVALE ELEMENTARY K to 6 701 286 (40.8 %) ** 17.7 21.3 558 (79.6%) 250 (35.7%)
GARFIELD YEAR-ROUND ELEMENTARY K to 6 1,025 692 (67.5 %) ** 19.7 21.6 658 (64.2%) 375 (36.6%)
GLENVIEW ELEMENTARY K to 6 436 137 (31.4 %) ** 17.4 22.6 242 (55.5%) 76 (17.4%)
GOLDEN GATE ELEMENTARY K to 6 349 28 (8.0 %) ** 16.6 21.1 314 (90.0%) 157 (45.0%)
GRANT SENIOR HIGH 9 to 12 0 0 (0.0 %) ** 0.0 0.0 0 (0.0%) 0 (0.0%)
GRASS VALLEY ELEMENTARY K to 6 243 1 (0.4 %) ** 18.7 22.1 89 (36.6%) 6 (2.5%)
HARTE (BRET) MIDDLE 7 to 9 1,013 312 (30.8 %) ** 17.2 27.5 554 (54.7%) 166 (16.4%)
HAVENSCOURT MIDDLE 6 to 8 794 407 (51.3 %) ** 19.8 29.0 492 (62.0%) 363 (45.7%)
HAWTHORNE YEAR-ROUND ELEMENTARY K to 6 1,431 1,108 (77.4 %) ** 18.4 21.1 1,222 (85.4%) 324 (22.6%)
HIGHLAND ELEMENTARY K to 6 904 455 (50.3 %) ** 20.1 20.4 702 (77.7%) 386 (42.7%)
HILLCREST ELEMENTARY K to 7 265 9 (3.4 %) ** 17.7 22.9 13 (4.9%) 10 (3.8%)
HOOVER ELEMENTARY K to 4 508 67 (13.2 %) ** 20.3 21.4 475 (93.5%) 344 (67.7%)
HOWARD ELEMENTARY K to 6 317 4 (1.3 %) ** 15.8 21.2 204 (64.4%) 35 (11.0%)
OAKLAND UNIFIED SCHOOL DISTRICT - 1999-2000 School Year - Continued
Page 53

SchoolGrade Span Enrollment English Learners
4-Year Dropout
Rate
Pupil/ Teacher
Ratio
Avg. Class Size
Free or Reduced Price Meals
CalWORKs (formerly AFDC)
HUERTA (DOLORES) LEARNING ACADEMY 0- 6 130 127 (97.7 %) ** 18.6 18.9 107 (62.9%) 0 (0.0%)
JEFFERSON YEAR-ROUND ELEMENTARY K to 6 1,064 735 (69.1 %) ** 17.2 20.7 908 (85.3%) 331 (31.1%)
KING (MARTIN LUTHER JR.) ELEMENTARY K to 3 418 59 (14.1 %) ** 18.2 19.0 372 (89.0%) 154 (36.8%)
KING ESTATES MIDDLE 6 to 8 556 35 (6.3 %) ** 17.9 30.6 311 (55.9%) 103 (18.5%)
LA ESCUELITA ELEMENTARY K to 6 303 229 (75.6 %) ** 21.6 21.6 206 (68.0%) 0 (0.0%)
LAFAYETTE ELEMENTARY K to 6 519 148 (28.5 %) ** 19.2 21.6 385 (74.2%) 199 (38.3%)
LAKEVIEW ELEMENTARY K to 6 423 62 (14.7 %) ** 19.2 20.4 223 (52.7%) 97 (22.9%)
LANEY MIDDLE (OPPORTUNITY) 6 to 8 82 15 (18.3 %) ** 10.2 7.0 55 (67.1%) 0 (0.0%)
LAUREL ELEMENTARY K to 6 522 240 (46.0 %) ** 18.9 20.3 409 (78.4%) 68 (13.0%)
LAZEAR ELEMENTARY K to 6 457 380 (83.2 %) ** 16.9 21.2 361 (79.0%) 64 (14.0%)
LINCOLN ELEMENTARY K to 6 650 500 (76.9 %) ** 20.3 21.3 506 (77.8%) 60 (9.2%)
LOCKWOOD ELEMENTARY K to 6 910 404 (44.4 %) ** 19.0 21.0 694 (76.3%) 342 (37.6%)
LONGFELLOW ELEMENTARY K to 6 368 20 (5.4 %) ** 16.7 20.9 245 (66.6%) 237 (64.4%)
LOWELL MIDDLE 7 to 8 679 114 (16.8 %) ** 19.4 28.2 418 (61.6%) 209 (30.8%)
MADISON MIDDLE 6 to 8 560 215 (38.4 %) ** 18.7 29.7 382 (68.2%) 142 (25.4%)
MANN (HORACE) ELEMENTARY K to 6 542 239 (44.1 %) ** 19.4 21.1 421 (77.7%) 287 (53.0%)
MANZANITA ELEMENTARY K to 6 950 465 (48.9 %) ** 19.4 21.5 728 (76.6%) 479 (50.4%)
MARKHAM ELEMENTARY K to 6 638 231 (36.2 %) ** 18.7 21.0 571 (89.5%) 339 (53.1%)
MARSHALL ELEMENTARY K to 6 189 26 (13.8 %) ** 16.4 20.0 128 (67.7%) 0 (0.0%)
MAXWELL PARK ELEMENTARY K to 6 524 92 (17.6 %) ** 18.1 21.2 405 (77.3%) 118 (22.5%)
MCCLYMONDS SENIOR HIGH 9 to 12 670 112 (16.7 %) 46.2 % 16.2 21.5 319 (47.6%) 588 (87.8%)
OAKLAND UNIFIED SCHOOL DISTRICT - 1999-2000 School Year - Continued
Page 54

SchoolGrade Span Enrollment English Learners
4-Year Dropout
Rate
Pupil/ Teacher
Ratio
Avg. Class Size
Free or Reduced Price Meals
CalWORKs (formerly AFDC)
MELROSE ELEMENTARY K to 6 498 404 (81.1 %) ** 20.4 22.7 468 (94.0%) 113 (22.7%)
MERRITT MIDDLE COLLEGE HIGH 9 to 12 105 4 (3.8 %) 32.5 % 13.1 21.5 22 (21.0%) 0 (0.0%)
MONTCLAIR ELEMENTARY K to 6 351 6 (1.7 %) ** 18.6 21.5 29 (8.3%) 2 (0.6%)
MONTERA MIDDLE 6 to 8 897 54 (6.0 %) ** 19.2 29.1 169 (18.8%) 8 (0.9%)
MUNCK (CARL B.) ELEMENTARY K to 6 334 31 (9.3 %) ** 19.6 21.8 158 (47.3%) 0 (0.0%)
OAK TREE CHARTER 0- 8 341 312 (91.5 %) ** 0.0 0.0 0 (0.0%) 0 (0.0%)
OAKLAND CHARTER ACADEMY 6 to 8 175 0 (0.0 %) ** 16.2 24.4 170 (97.1%) 0 (0.0%)
OAKLAND SENIOR HIGH 10 to 12 2,320 1,071 (46.2 %) 18.5 % 23.1 29.7 1,200 (51.7%) 847 (36.5%)
OAKLAND SPECIAL PROGRAMS K to 12 0 0 (0.0 %) ** 0.0 0.0 0 (0.0%) 0 (0.0%)
OAKLAND TECHNICAL SENIOR HIGH 9 to 12 1,970 381 (19.3 %) 24.7 % 22.0 28.4 672 (34.1%) 497 (25.2%)
PARKER ELEMENTARY K to 6 544 57 (10.5 %) ** 20.9 21.1 449 (82.5%) 233 (42.8%)
PERALTA YEAR-ROUND ELEMENTARY K to 5 232 15 (6.5 %) ** 17.1 19.3 109 (47.0%) 32 (13.8%)
PIEDMONT AVENUE ELEMENTARY K to 6 315 45 (14.3 %) ** 17.5 20.3 177 (56.2%) 59 (18.7%)
PRESCOTT ELEMENTARY K to 6 638 175 (27.4 %) ** 21.3 21.6 483 (75.7%) 277 (43.4%)
REDWOOD HEIGHTS ELEMENTARY K to 6 268 2 (0.7 %) ** 16.8 20.3 33 (12.3%) 6 (2.2%)
REEMS (ERNESTINE C.) ACADEMY 0- 6 269 3 (1.1 %) ** 20.7 20.7 211 (78.4%) 0 (0.0%)
ROOSEVELT MIDDLE 6 to 8 1,009 636 (63.0 %) ** 19.0 29.7 712 (70.6%) 517 (51.2%)
RUDSDALE SENIOR HIGH 9 to 12 0 0 (0.0 %) ** 0.0 0.0 0 (0.0%) 0 (0.0%)
SANTA FE ELEMENTARY K to 6 358 11 (3.1 %) ** 16.7 20.4 271 (75.7%) 180 (50.3%)
SEQUOIA ELEMENTARY K to 6 379 94 (24.8 %) ** 19.3 22.2 194 (51.2%) 59 (15.6%)
SHERMAN (ELISABETH) ELEMENTARY K to 6 281 12 (4.3 %) ** 18.7 20.4 162 (57.7%) 77 (27.4%)
OAKLAND UNIFIED SCHOOL DISTRICT - 1999-2000 School Year - Continued
Page 55

SchoolGrade Span Enrollment English Learners
4-Year Dropout
Rate
Pupil/ Teacher
Ratio
Avg. Class Size
Free or Reduced Price Meals
CalWORKs (formerly AFDC)
SIMMONS (CALVIN) MIDDLE 7 to 9 1,222 771 (63.1 %) ** 18.8 27.5 645 (52.8%) 582 (47.6%)
SKYLINE SENIOR HIGH 10 to 12 2,264 350 (15.5 %) 8.6 % 21.0 28.6 522 (23.1%) 57 (2.5%)
SOBRANTE PARK ELEMENTARY K to 5 365 166 (45.5 %) ** 20.5 20.2 207 (56.7%) 166 (45.5%)
STREET ACADEMY (ALTER) 9 to 12 166 16 (9.6 %) 5.3 % 23.7 0.0 50 (30.1%) 0 (0.0%)
SWETT (JOHN) ELEMENTARY K to 8 261 31 (11.9 %) ** 18.6 23.0 174 (66.7%) 23 (8.8%)
THORNHILL ELEMENTARY K to 6 335 25 (7.5 %) ** 19.9 22.1 27 (8.1%) 2 (0.6%)
TILDEN ELEMENTARY (DEAF EDUCATION) K 0 0 (0.0 %) ** 0.0 0.0 0 (0.0%) 0 (0.0%)
TOLER HEIGHTS ELEMENTARY K to 3 137 7 (5.1 %) ** 21.1 22.8 109 (79.6%) 11 (8.0%)
WASHINGTON ELEMENTARY K to 6 306 17 (5.6 %) ** 18.0 20.8 241 (78.8%) 123 (40.2%)
WEBSTER ACADEMY K to 6 1,070 377 (35.2 %) ** 18.0 19.6 900 (84.1%) 539 (50.4%)
WEST OAKLAND COMMUNITY 6 to 8 50 0 (0.0 %) ** 25.0 21.0 0 (0.0%) 0 (0.0%)
WESTLAKE MIDDLE 6 to 8 686 270 (39.4 %) ** 17.2 27.6 442 (64.4%) 257 (37.5%)
WHITTIER ELEMENTARY K to 6 720 399 (55.4 %) ** 19.5 21.3 538 (74.7%) 349 (48.5%)
WHITTON (OH) (CHARLES) CENTER K to 12 0 0 (0.0 %) ** 0.0 0.0 0 (0.0%) 0 (0.0%)
District Total: K to 12 55,051 19,344 ( 35.1 %) 24.1 % 19.0 26.5 32,705 (59.9%) 17,779 (32.5%)
County Total: 217,080 44,437 ( 20.5 %) 9.3 % 20.0 26.3 71,328 (32.6%) 28,075 (12.8%)
State Totals: 5,951,612 1,480,527 (24.9%) 11.1 % 20.9 26.7 2,809,186 (47.3%) 850,379 (14.3%)Source: California Department of Education, Educational Demographics Unit (http://www.cde.ca.gov)
OAKLAND UNIFIED SCHOOL DISTRICT - 1999-2000 School Year - Continued
Page 56

West Oakland Community Information Book 2001
Alameda County Public Health Department Page 57
Government There are many levels of government, including city, county, state, and national. Below is a partial listing of elected officials that represent West Oakland. For additional information about the officials and how to contact them, please see the following pages. Government Districts Elected Official Oakland City Council City Council District 3 Nancy Nadel
Alameda County Board of Supervisors
County Supervisorial District 5
Keith Carson
California State Assembly
State Assembly District 16
Wilma Chan
California State Senate State Senate District 9 Don Perata
U.S. Congress U.S. Congress District 9 Barbara Lee
U.S. Senate Barbara Boxer Dianne Feinstein

West Oakland Community Information Book 2001
Alameda County Public Health Department Page 58
Oakland City Council Districts and Representatives
Source: adapted from http://www.oaklandnet.com/maproom/gallery/council.html
Danny Wan
Moses Mayne, Jr. .

city officials document
http://www.oaklandnet.com/government/council/city-officials.html Page 59
CITY OF OAKLAND OFFICIALS:
Standing: Danny WanDistrict 2
Roland E. SmithCity Auditor
Henry ChangAt-Large
Nancy NadelDistrict 3
Robert C. BobbCity Manager
John RussoCity Attorney
Larry ReidDistrict 7
Seated:
Dick SpeesDistrict 4
Ceda FloydCity Clerk
Jerry BrownMayor
Jane BrunnerDistrict 1
Ignacio De La FuenteDistrict 5
Moses L. Mayne, Jr.District 6

Councilmember Nadel's Home Page
http://www.oaklandnet.com/government/council/coun_mem/nadel/nadelhp.html Page 60
Nancy J. Nadel
CouncilmemberDistrict 3
One Frank Ogawa Plaza(One City Hall Plaza), 2nd Floor
Oakland, CA 94612Phone: (510) 238-7303 FAX: (510) 238-6129
E-mail: [email protected]
This is a PDF file.You will need Adobe Acrobat reader to view this file.
Download the Acrobat Reader

Board of Supervisors - Alameda County
http://www.co.alameda.ca.us/board/index.shtmlPage 61
Alameda County is governed by a five-member Board of Supervisors, each of whom is elected on a nonpartisan basis from a separate district where he/she lives. Within the broad limits established by the State Constitution, State General Law, and the Alameda County Charter, the Board exercises both the legislative and the executive functions of government. The Board of Supervisors is also the governing body for a number of "special districts" within Alameda County.
Coming SoonAudio Broadcast - Board of Supervisors Meeting
Tuesdays at 9:30a.m. District 1 District 2 District 3 District 4 District 5
Scott Haggerty Gail Steele Alice Lai-Bitker Nate Miley Keith Carson
Alameda County Public Hearings on Redistricting Tuesday, July 24, 2001 11:00 a.m.
Board of Supervisors Chambers1221 Oak Street, 5th Floor, Oakland.
Click Here for More Information
MeetingsLive Audio BroadcastCalendar
Regular AgendaPlanning AgendaMinutes
CommitteesCalendar
Special TopicsChildren and Families CommissionBoard Vacancy Report
Site Search
Department List
Select One

Board of Supervisors - Alameda County
http://www.co.alameda.ca.us/board/index.shtml Page 62
To make the supervisorial districts equal in population, the boundaries are adjusted every ten years through the process called "redistricting." That process is underway (click here for more information). Terms of office for the Supervisors are four years. Alternate elections are held every two years for threesupervisors and then for two supervisors. The salary of the Board members is fixed by the Board itself.A President of the Board, chosen from the membership of the Board every two years, presides at all meetings of the Board and appoints committees to handle work involving the major programs of the County.
! As defined by the Alameda County Charter, the duties of the Board of Supervisors are as follow! Appoint most County officers and employees, except elected officials! Provide for the compensation of all County officials and employees! Create officers, boards, and commissions as needed, appointing the members and fixing the
terms of office! Award all contracts for public works! Adopt an annual budget! Provide, publish, and enforce a complete code of rules prescribing the duties and the systems o
office and management, accounts, and reports for each County department! Have an annual audit made of all County accounts, books, and records! Supervise the operations of departments and exercise executive and administrative authority
throughout County government! Serve as appellate body for employee grievances, planning and zoning
The Board of Supervisors meets at 8:30 a.m. for closed sessions and at 9:30 a.m. for regular calendar on Tuesday mornings at the County Administration Building, 1221 Oak Street, Oakland, in the 5th FlooBoard Chambers. All meetings are open to the public, and residents are encouraged to attend. Clickhere for specific agenda information, or contact the Clerk, Board of Supervisors, at (510) 272-6347.
Sister Site
Alameda County has a sister county in Taiwan! Learn more about Taoyuan, our Sister County.
Alameda County Home | Board of Supervisors | Departments | Services | Employment

About - Supervisor Keith Carson - Alameda County District 5
http://www.co.alameda.ca.us/board/keith.shtml Page 63
Keith Carson was elected to the Board of Supervisors in 1992, on a platform dedicated to inclusive and accessible government. He brings his experience as an activist, a small businessman, a congressional aide and a community liaison to his work as representative of the 5th District. He seeks to bring together the wealth of talent and creative resources that exist in this area to find solutions to the problems of access to health care, poverty, homelessness, crime, business retention, and scarcity of jobs in our community.
Keith also sits on the Board of Directors for the East Bay Conversion and Reinvestment Commission and chairs its Public Involvement Committee.
Keith currently serves as Chair of the Alameda County Economic Development Alliance for Business (EDAB), chairs its
Urban Revitalization Authority; and vice-chair of the Alameda County Transportation Authority.
Alameda County Public Hearings on Redistricting Tuesday, July 24, 2001 11:00 a.m.
Board of Supervisors Chambers1221 Oak Street, 5th Floor, Oakland.
Click Here for More Information
Alameda County Home | Board of Supervisors | Departments | Services | Employment
Board Home
About Keith Carson
Initiatives
Leadership
News
Get Involved
Contact Us
Site Search
Department List
Select One

California Assembly District 16
http://www.assembly.ca.gov/acs/makebio.asp?district=16 Page 64
AssemblywomanWilma Chan 16th Assembly District
[email] District Address
1515 Clay Street Suite 2204
Oakland, CA 94612Phone: (510) 286-1670
Fax: (510) 286-1888
Capitol AddressP.O. Box 942849
Room 4098 Sacramento, CA 94249-0001
Phone: (916) 319-2016
Committees! Committee on Jobs, Economic
Development, and the Economy !
! Committee on Banking and Finance ! Committee on Health
! Committee on Public Employees,Retirement and Social Security
! Select Committee on CaliforniasChildrens Health
! Committee on Aging and Long-Term Care
! Select Committee on California -Mexico Affairs
Biography
Wilma Chan represents the cities of Oakland, Alameda and Piedmont in the California State Assembly. Ms. Chan's legislative priorities include health care, senior services, children's programs, environmental health and sustainable economic development.
Ms. Chan is the Assembly Majority Floor Whip and is a member of the Assembly Committees on Health; Human Services; Aging and Long Term Care; Public Employees, Retirement and Social Security; and Banking and Finance. Chan is Chair of the Select Committee on Childrens Health.
Ms. Chan is a tireless advocate for children and youth. She has taken a leadership role in developing collaborative programs for children in Oakland and Alameda. She has also led trade delegations to Asia to encourage business development and trade with the San Francisco East Bay region.
Ms. Chan was elected to the Board of Supervisors in 1994 and re-elected without opposition in 1998. On the Board of Supervisors, Ms. Chan chaired the Health Committee and served as a member of the Budget Committee and the Personnel, Administration and Legislative Committee. Ms. Chan was the first Chair of the Children and Families Commission, which is distributing $20 million in new funds for the children's services. Ms. Chan also served on the Alameda Retirement Board.
Her accomplishments at the Board of Supervisors include:
! Expanding the number of school-based health clinics from 4 to 7. ! Working with local officials to gain release of 220 acres of the
Alameda Naval Air Station land for local needs. ! Leading lobbying efforts to restore benefits to legal immigrants. ! Championing efforts to build a new Emergency Room and Critical
Care Building for the Alameda County Medical Center, Highland Hospital - Oakland Campus
! Initiating a pilot welfare-to-work project in Oakland's San Antonio neighborhood.

California Assembly District 16
http://www.assembly.ca.gov/acs/makebio.asp?district=16 Page 65
Return to California Assembly Home Page
! Developing the strategic plan on the future of health care services in Alameda County.
! Ms. Chan was the first Asian American to serve on the Board of Supervisors and the Oakland School Board.
Ms. Chan has been honored by numerous organizations for her work, including:
! California Hospital Council County Meals-on-Wheels ! Community Bank of the Bay ! National Asian Women's Health Assn. ! Native American Health Center ! Rotary International - Paul Harris Award ! High-Risk Infant Follow Up Network ! Sons in Retirement ! Alameda Breakfast Lions Club ! East Bay Asian Youth Center
Prior to her election to the Board of Supervisors, Ms. Chan was elected to the Oakland Board of Education in 1990. She also worked as Program Coordinator for Effective Parenting Information for Children, a nationally recognized school-based prevention program.
Ms. Chan holds a BA from Wellesley and an MA in Education Policy from Stanford University. She lives in Alameda with her husband, a public school teacher, and her two children.
Updated: 2/08/2001

Senate Majority Caucus Member
http://democrat.../gov.ca.senate.democrats.pub.members.memDisplayHome?district=sd0 Page 66
Don PerataD-East BaySenate District 09
Greetings:
Thank you for visiting my web page. I use this site as a virtual meeting place where constituents can access all of the resources my office provides. Most information is updated daily and comments or requests are responded to promptly! I encourage you to bookmark this site.
My top priority is to improve our schools, especially in Oakland. I am also proposing new ways to reduce traffic congestion, maintain a safe and clean environment, expand healthcare for children and seniors, and create economic opportunities for urban residents.
To see the bills I am carrying, click on Legislation. For daily news, click on Press Room. To be kept up to date by e-mail on a specific topic, click on Feedback. Click on E-mail to send me a message or make a request. You can also reach local government agencies and media outlets through the Links page.
Don Perata
Perata Holds PressConference at EastmontMall
California's Energy CrisisEnergy Update (Vol. 16)Energy Update (Vol. 17)Energy Update (Vol. 18)Energy Update (Vol. 19)Energy Update (Vol. 20)Energy Update (Vol. 21)Energy Update (Vol. 22)Energy Update (Vol. 23)Simple Ways To SaveEnergy And Money
RELEVANT WEB LINKSBlackout Alerts Via E-MailCalifornia's IndependentSystem OperatorEnergy Saving TipsGovernor's EnergyConservation Tips/RebatesPG&E Homepage
State Capitol, Room 4061Sacramento, CA 95814(916) 445-6577Fax (916) 327-1997
1515 Clay Street #2202Oakland, CA 94612(510) 286-1333Fax (510) 286-3885

Congresswoman Barbara Lee - 9th District of California Representative
http://www.house.gov/lee/index.html Page Page 67
Biography Constituent Services
Our District
Lee in Congress
Press Room Issues Links Home
> Visit the > Visit the Kid's Kid's Page! Page!
Hello Friend,
Welcome to California’s 9th Congressional District website. This site will provide you with
information about my activities as a member of Congress as well as a variety of links to other
important federal, state, and local government websites.
As your representative, I would like to keep you informed on current topics affecting our
district, the nation, and the world. The internet provides great tools for individuals needing
access to quick and valuable information. Please continue to visit this website for updates on
issues and current events.
Thank you for taking the time to visit my website. I hope it proves to be a valuable and
informative online resource tool.
Please do not hesitate to contact any of my offices if we can be of assistance.
Barbara LeeM.C.
BiographyBiography | ServicesServices | DistrictDistrict | In CongressIn Congress | PressPress | IssuesIssues | LinksLinks | HomeHome
Write Your Representative
Washington Office:426 Cannon House Office Bldg.
Washington, DC 20515Phone:(202) 225-2661Fax:(202) 225-9817
District Office:1301 Clay Street, Suite 1000N
Oakland, CA 94612Phone:(510) 763-0370Fax:(510) 763-6538
This Page has been accessed since September 21, 1998

U.S. SENATOR BARBARA BOXER | CALIFORNIA
http://www.senate.gov/~boxer/contact/index.html Page 68
About Barbara Boxer | Issues | Newsroom | Photo Gallery | Contact Us | FAQ | SiteGuide
CONTACT US
E-MAIL SENATOR BOXER | CONSTITUENT SURVEY | CONGRESSIONAL DOCUMENTS | E-MAIL LIST
Home
Services
The U.S. Senate
California Links
D.C. Tours
Federal Links
Kids Corner
En Español
Senator Boxer wants to hear from you.
E-MAIL SENATOR BOXER
Click here to send an e-mail to Senator Boxer. Please note that because of the high volume of e-mails she receives, it may take up to three weeks to receive a response.
CONSTITUENT SURVEY
COMING SOON
E-MAIL LIST
Click here to subscribe to Senator Boxer's e-mail list.
WashingtonD.C.112 Hart Senate
Office BuildingWashington, D.C. 20510(202) 224-3553
Sacramento501 I Street, Suite 7-600
Sacramento, CA 95814(916) 448-2787(916) 448-2563 fax
San Francisco1700 Montgomery Street, Suite 240
San Francisco, CA 94111(415) 403-0100(415) 956-6701 fax
Los Angeles312 N. Spring Street, Suite
1748Los Angeles, CA 90012(213) 894-5000(213) 894-5012 fax
Fresno1130 O Street, Suite 2450
Fresno, CA 93721(559) 497-5109(559) 497-5111 fax
San Diego600 B Street, Suite 2240
San Diego, CA 92101(619) 239-3884(619) 239-5719 fax

U.S. SENATOR BARBARA BOXER | CALIFORNIA
http://www.senate.gov/~boxer/contact/index.html Page 69
Inland Empire201 North E Street, Suite 210
San Bernardino, CA 92401(909) 888-8525(909) 888-8613 fax
E-MAIL SENATOR BOXER | CONSTITUENT SURVEY | CONGRESSIONAL DOCUMENTS | E-MAIL LIST

Senator Dianne Feinstein - Contact Senator Feinstein
http://www.senate.gov/~feinstein/contact.html Page 70
Main Page | What's New | Tours, Flags & Services | Contact Senator Feinstein | En Español
Legislation & Historical Documents | Federal Resources | Biography | Photo Gallery | Press OfficeCalifornia Links | For Young People | Questions (FAQ) | Comments | Privacy Notice | Site Map
Contact Senator Feinstein Phone or Fax - If you wish to phone or fax the Washington, D.C. office:
Phone: (202) 224-3841Fax: (202) 228-3954
TTY/TDD: (202) 224-2501
Write a letter - You can send an email using my New e-mail web form or send postal mail to:
Senator Dianne FeinsteinUnited States Senate
331 Hart Senate Office BuildingWashington, DC 20510
All electronic mail sent is tallied and your opinions are noted and appreciated. If you wish a response to your email, please include your California postal mailing address in the text of your message. Due to the volume of email we receive, we are only able to respond to messages that contain a California postal address. Please ensure that your email is in plain text format and does not include any attachments.
California offices - Contact one of my offices in California.
Requests for Casework assistance - If you are writing because you are having difficulty with a government agency and wish to request help, please send a letter including your name, address, phone number, Social Security number, and information about your problem and a Privacy Release form to:
Senator Dianne FeinsteinUnited States Senate
One Post Street, Suite 2450San Francisco, CA 94104

Senator Dianne Feinstein - Contact Senator Feinstein
http://www.senate.gov/~feinstein/contact.html Page 71
Return to Menu
Or call (415) 393-0707Fax (415) 393-0710
Email issue briefs - Subscribe to one of my issue email briefs.
Tour information and ticket requests - To request Washington tour information or tickets, call (202) 224-3841 or send an email. Please include the dates you will be in Washington and your postal address. Also, please indicate in the subject of your email that you are requesting tour information. Please note that tours should be booked at least six months in advance to guarantee availability.
U.S. Flags - Purchase a flag flown over the U.S. Capitol.
Internships - Information on internships in my Washington, DC or California offices.

Community Information Books 2001 References Healthy People 2000: National Health Promotion and Disease Prevention Objectives. US Department of Health and Human Services, Public Health Service. DHHS Publication No. (PHS) 91-50212. US Government Printing Office: Washington, DC (1991). School Profiles Source: California Department of Education, Educational Demographics Unit (http://www.cde.ca.gov), March, 2001. Sex and America’s Teenagers. New York: The Alan Guttmacher Institute, 1994. United States Census Bureau, Department of Commerce (http://www.census.gov;http://factfinder.census.gov). Quality of Life Benchmarks Report 2000. Alameda County Social Services Agency, 2001. (http://www.co.alameda.ca.us/assistance/publications_reports.shtml) County Health Status Report 2000. Alameda County Public Health Department Community Assessment, Planning and Education Unit. July, 2000 (http://www.co.alameda.ca.us/publichealth) Page 72