Embed Size (px)
Citation preview
1
Wind’s Role in the Global Energy Market
Athens 28-2-2006
Prof. Arthouros Zervos Chairman Global Wind Energy Council President European Wind Energy Association
2
Global representation for the wind energy sector
Wind energy is increasingly becoming an international business sector, spreading beyond its original markets in a few European countries, India and the United States. The major manufacturers and project developers now operate across all five continents. At the same time, the leading wind power Associations around the world have become increasingly linked through overlapping membership and bilateral activities.
The Global Wind Energy Council (GWEC) has been established to be the global forum for the wind energy sector, uniting the wind industry and its representative associations.
3
The Members of GWEC
GWEC represents a broad sectorial and geographical cross section of the Global wind energy community.
Members are the leading national and continental associations representing the different continents, plus the major turbine and components manufacturers, developers and energy companies.
The members of GWEC operate in over fifty countries and represent:
• Over 1500 companies, organisations and institutions• 99% of the world’s 59.000 MW installed wind power
capacity
5
The mission of GWEC
GWEC’ s mission is to ensure that wind power establishes itself as one of the world’s leading energy sources, providing substantial environmental and economic benefits. The main objective is to promote the development and growth of wind energy around the world through:
Policy developmentTo participate in policy and regulatory forums that can assist the
creation of frameworks for wind power development.Business leadershipTo provide the strategic and business leadership needed to engage
external stakeholders.Global outreachTo work with emerging markets to transfer know-how and strengthen
the development of wind energy worldwide.Information and education To serve as a platform for providing quality information, expertise,
analysis and data about wind energy.
6
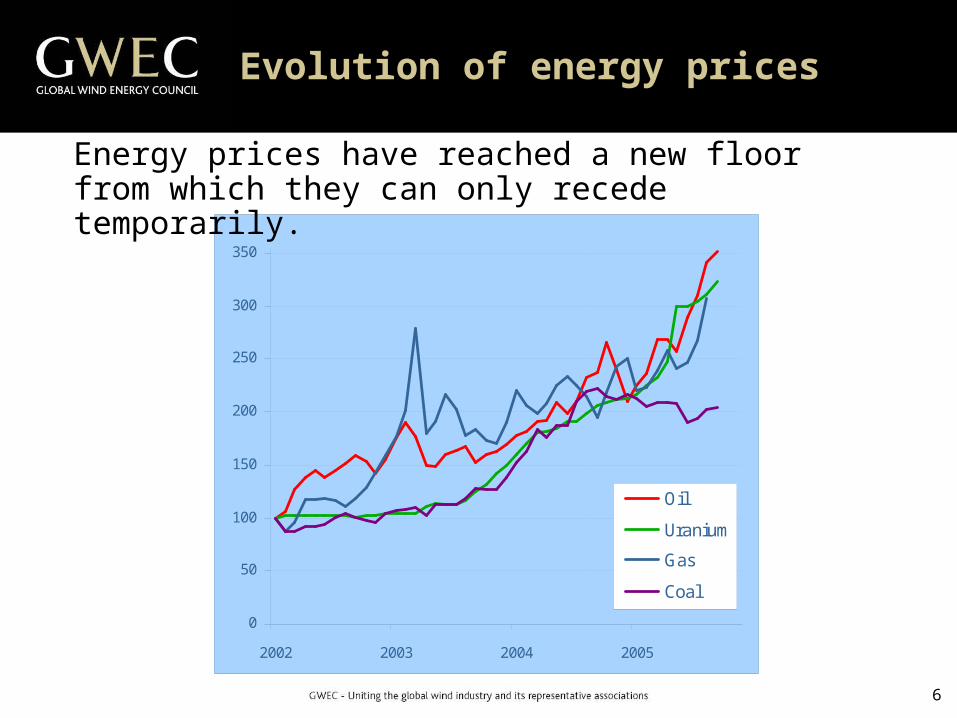
Evolution of energy prices
0
50
100
150
200
250
300
350
2002 2003 2004 2005
Oil
Uranium
Gas
Coal
Energy prices have reached a new floor from which they can only recede temporarily.
7
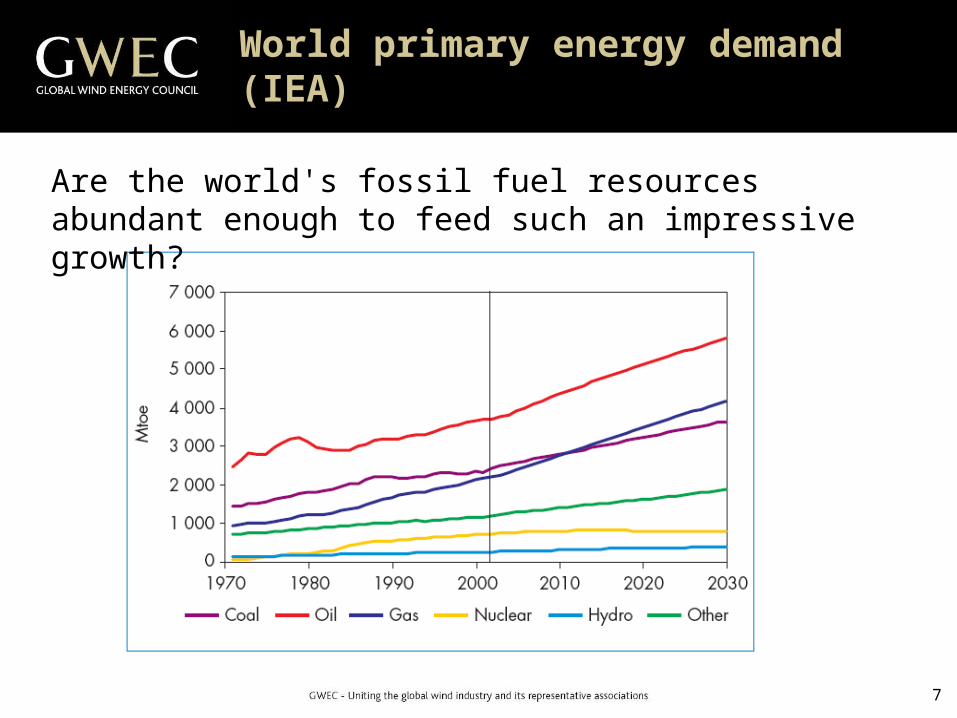
World primary energy demand (IEA)
Are the world's fossil fuel resources abundant enough to feed such an impressive growth?
8
Adequacy of Resources
The energy outlook studies from government bodies and trans-national organisations present, in consonance, a comforting picture looking to the future:
soaring energy needs will be met by an ever expanding supply base.
These studies, trusted and quoted by key business players and policy makers, have lately been challenged by a growing faction of dissenters who question their basic assumptions.
Concerns over the adequacy of resources have been stirred in the context of consistently rising energy prices
9
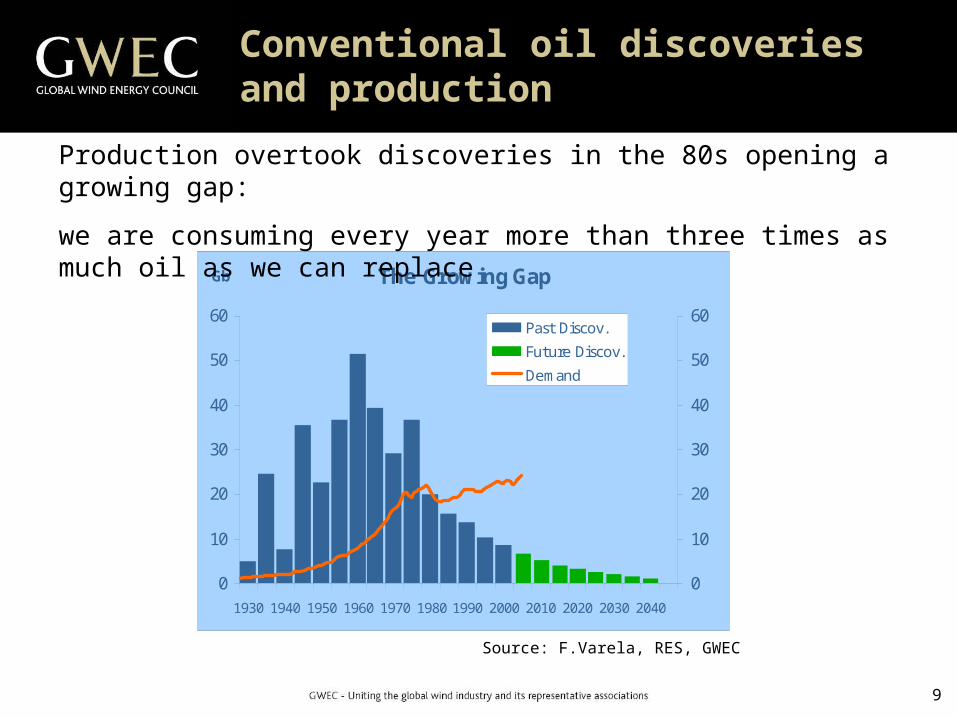
Conventional oil discoveries and production
The Growing Gap
0
10
20
30
40
50
60
1930 1940 1950 1960 1970 1980 1990 2000 2010 2020 2030 2040
Gb
0
10
20
30
40
50
60Past Discov.
Future Discov.
Demand
Production overtook discoveries in the 80s opening a growing gap:
we are consuming every year more than three times as much oil as we can replace
Source: F.Varela, RES, GWEC
10
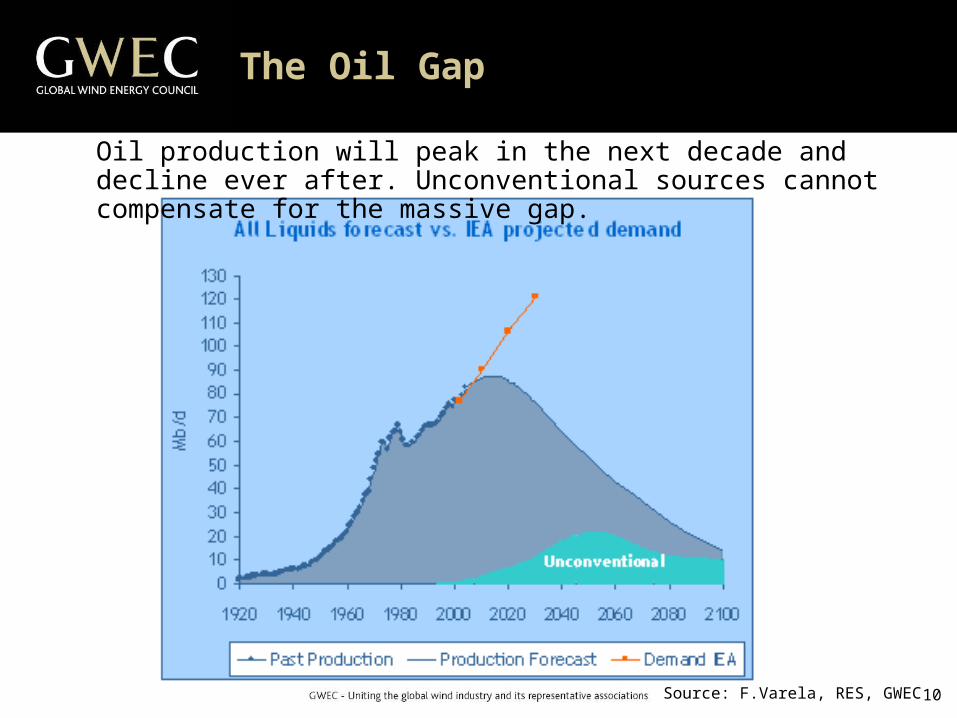
The Oil Gap
Oil production will peak in the next decade and decline ever after. Unconventional sources cannot compensate for the massive gap.
Source: F.Varela, RES, GWEC
11
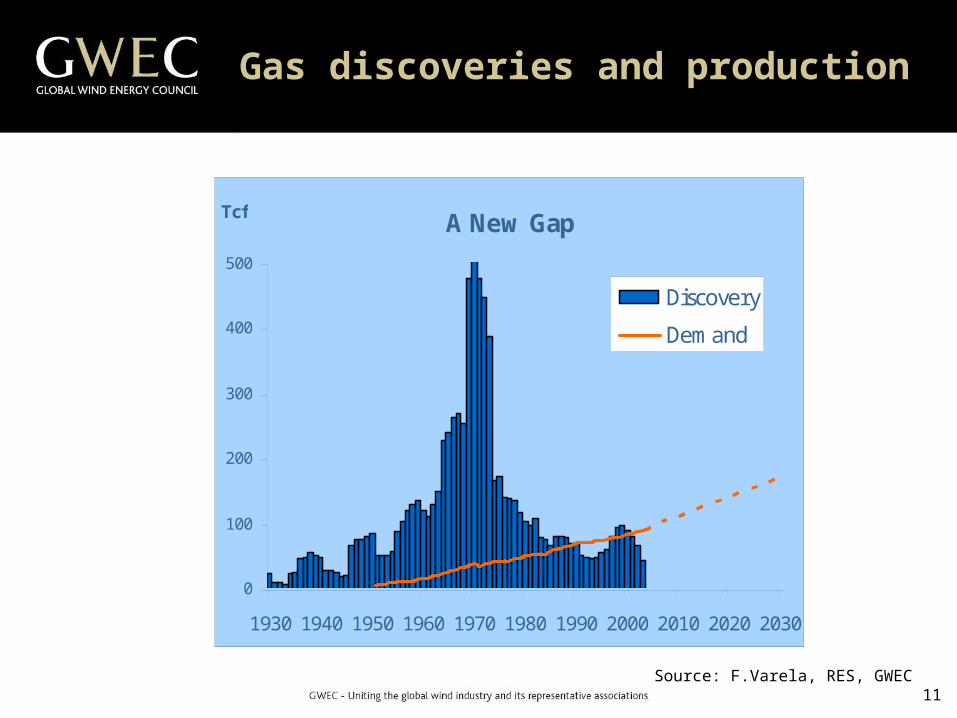
Gas discoveries and production
A New Gap
0
100
200
300
400
500
1930 1940 1950 1960 1970 1980 1990 2000 2010 2020 2030
Tcf
Discovery
Demand
Source: F.Varela, RES, GWEC
12
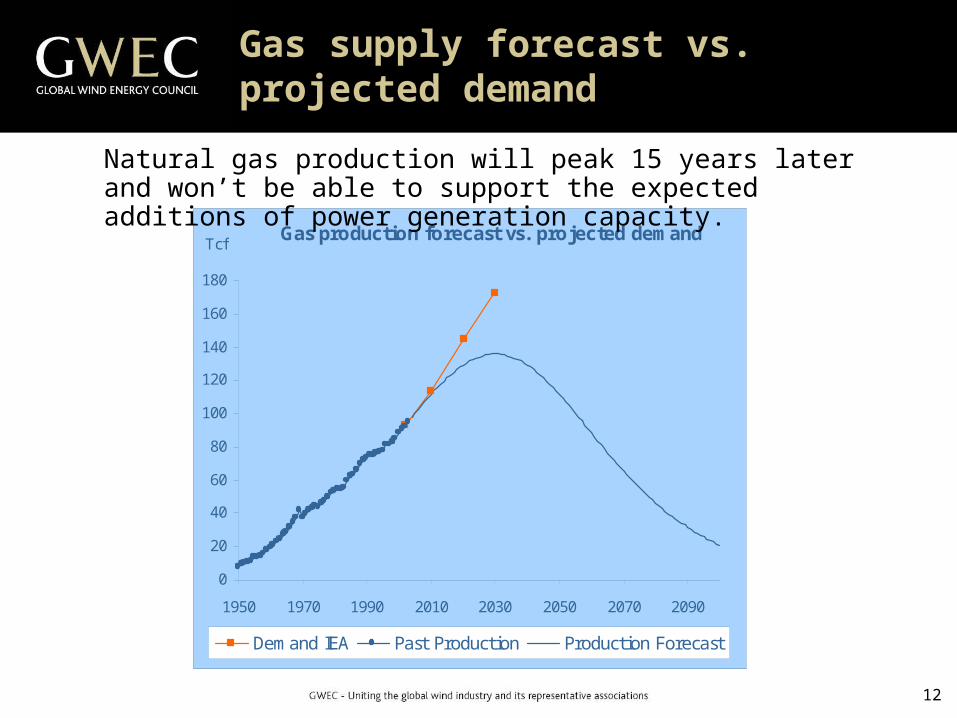
Gas supply forecast vs. projected demand
Gas production forecast vs. projected demand
0
20
40
60
80
100
120
140
160
180
1950 1970 1990 2010 2030 2050 2070 2090
Tcf
Demand IEA Past Production Production Forecast
Natural gas production will peak 15 years later and won’t be able to support the expected additions of power generation capacity.
13
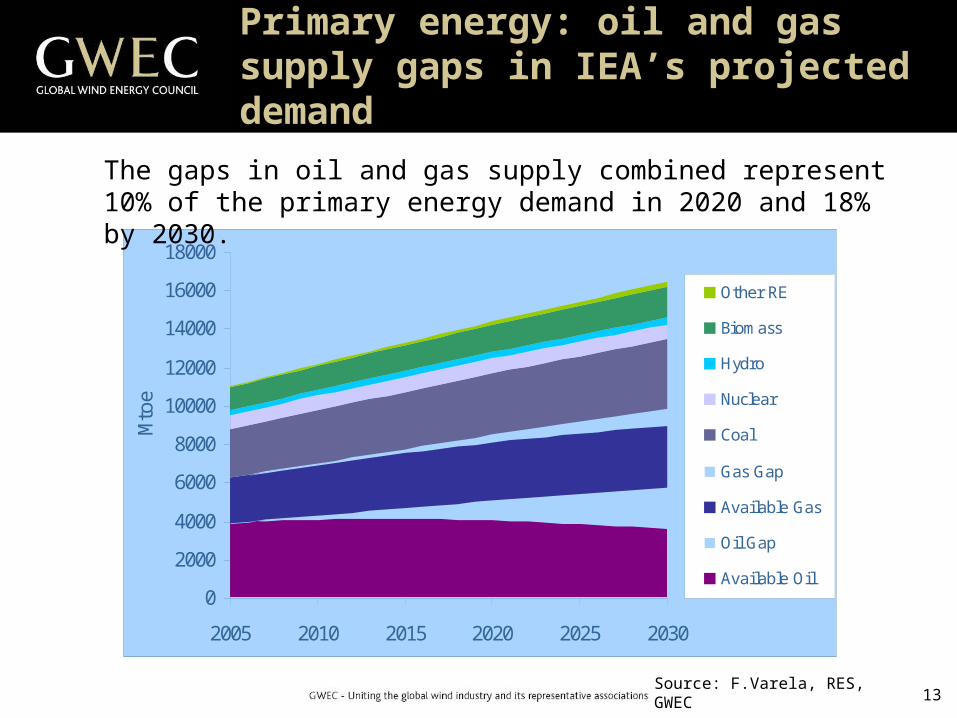
Primary energy: oil and gas supply gaps in IEA’s projected demand
0
2000
4000
6000
8000
10000
12000
14000
16000
18000
2005 2010 2015 2020 2025 2030
Mto
e
Other RE
Biomass
Hydro
Nuclear
Coal
Gas Gap
Available Gas
Oil Gap
Available Oil
Source: F.Varela, RES, GWEC
The gaps in oil and gas supply combined represent 10% of the primary energy demand in 2020 and 18% by 2030.
14
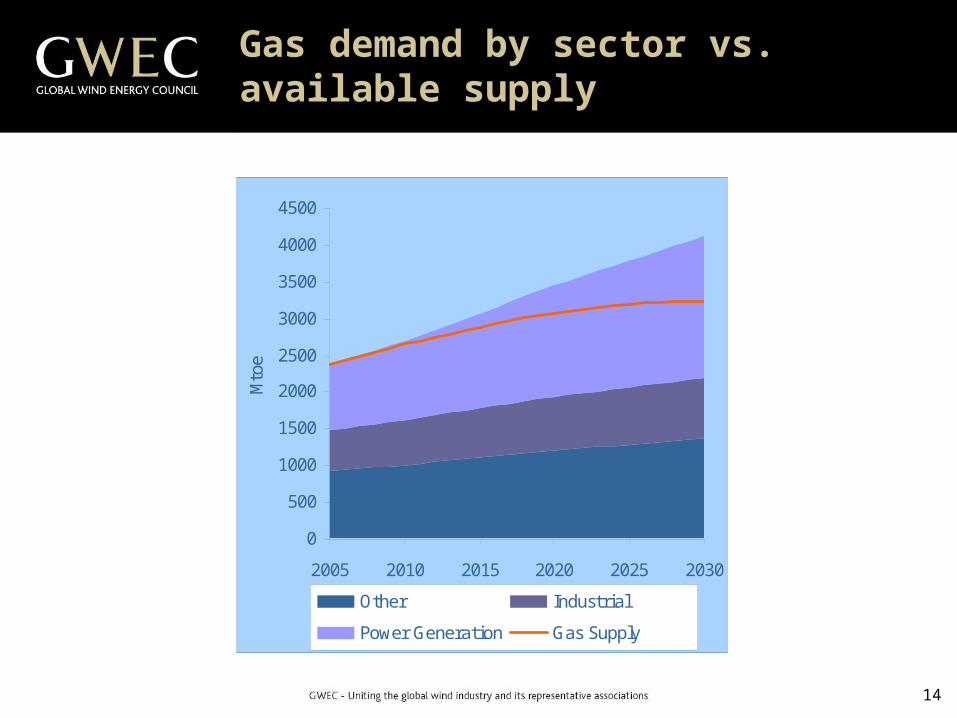
Gas demand by sector vs. available supply
0
500
1000
1500
2000
2500
3000
3500
4000
4500
2005 2010 2015 2020 2025 2030
Mto
e
Other Industrial
Power Generation Gas Supply
15
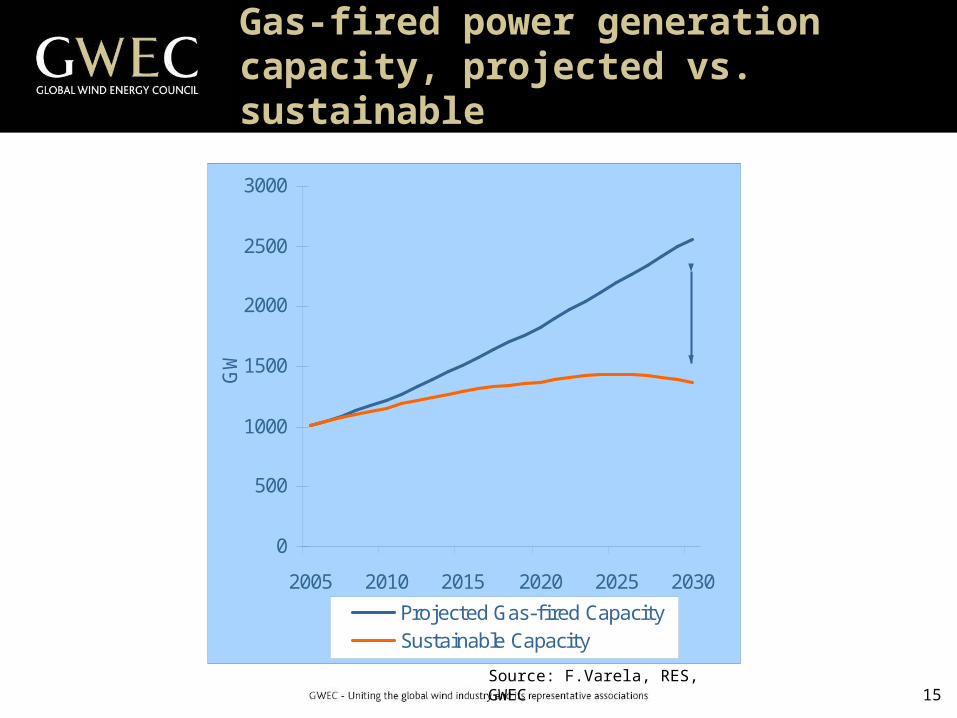
Gas-fired power generation capacity, projected vs. sustainable
0
500
1000
1500
2000
2500
3000
2005 2010 2015 2020 2025 2030
GW
Projected Gas-fired CapacitySustainable Capacity
1200
GW
Source: F.Varela, RES, GWEC
16
Conclusions
The world’s energy resources are not sufficient to sustain the expected growth trends. The current fuel mix will change significantly in the mid term future as a growing gap develops between the expected demand and the available supply of hydrocarbons.
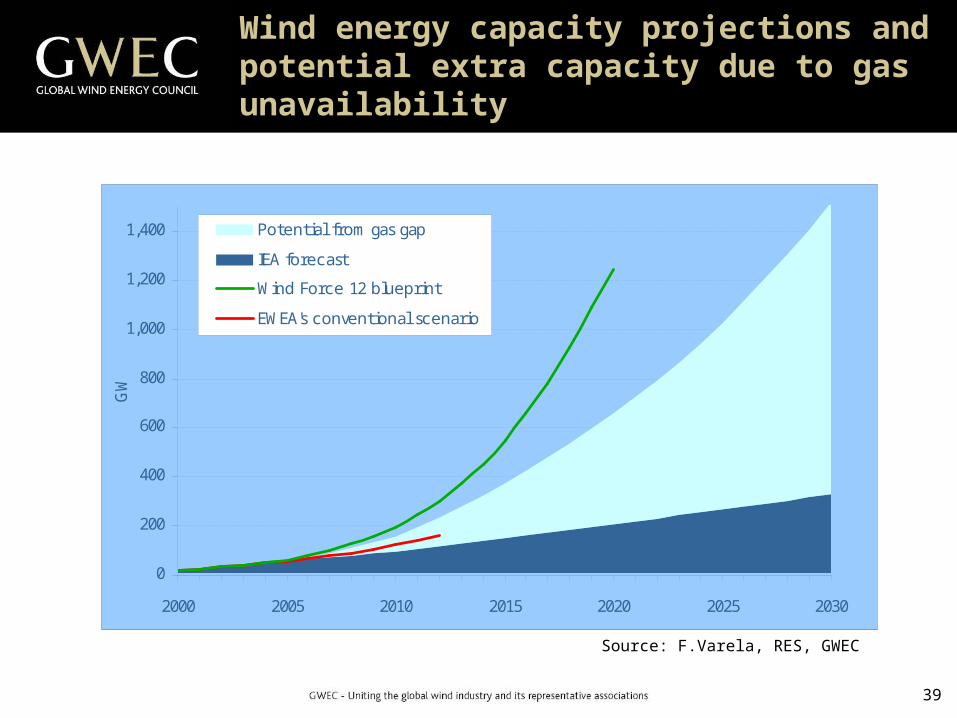
There will be no such thing as a “business as usual” future. An unforeseen potential will become available to wind energy as a result of gas supply limitations. Up to 1200 GW of extra capacity could potentially be installed by 2030 without major policy efforts as wind power enters its “market era” sooner than expected.
17
The Candidates to Fill the Gas Gap
• Coal• Nuclear• Wind• Other renewables (PV, Solar Thermal Power, Biomass,
Geothermal)
The gas gap offers an enormous additional potential for wind power that was not foreseen in the traditional wind capacity forecasts. Not only is this potential technically realizable, but it wouldn't require any extraordinary policy efforts.
Although wind power would have to vie against other alternatives for this new market, it clearly stands in a privileged position as one of the most cost-effective.
18
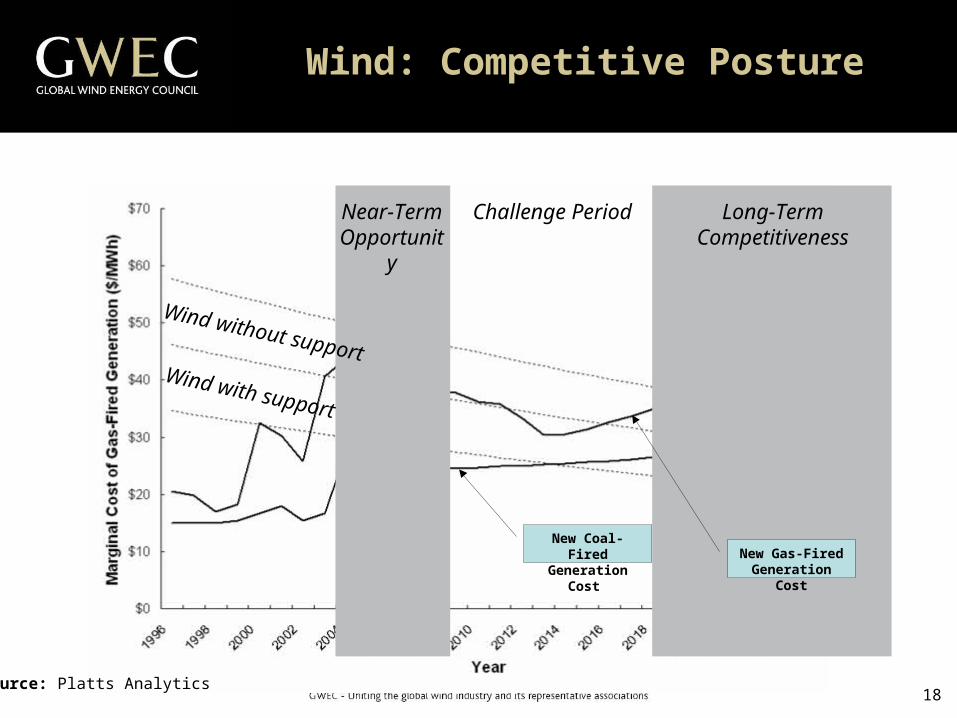
Wind: Competitive Posture
Source: Platts Analytics
Near-TermOpportunity
Wind without supportWind with support
New Coal-FiredGeneration Cost
Long-TermCompetitiveness
Challenge Period
New Gas-FiredGeneration Cost
19
Short Term Projections
20
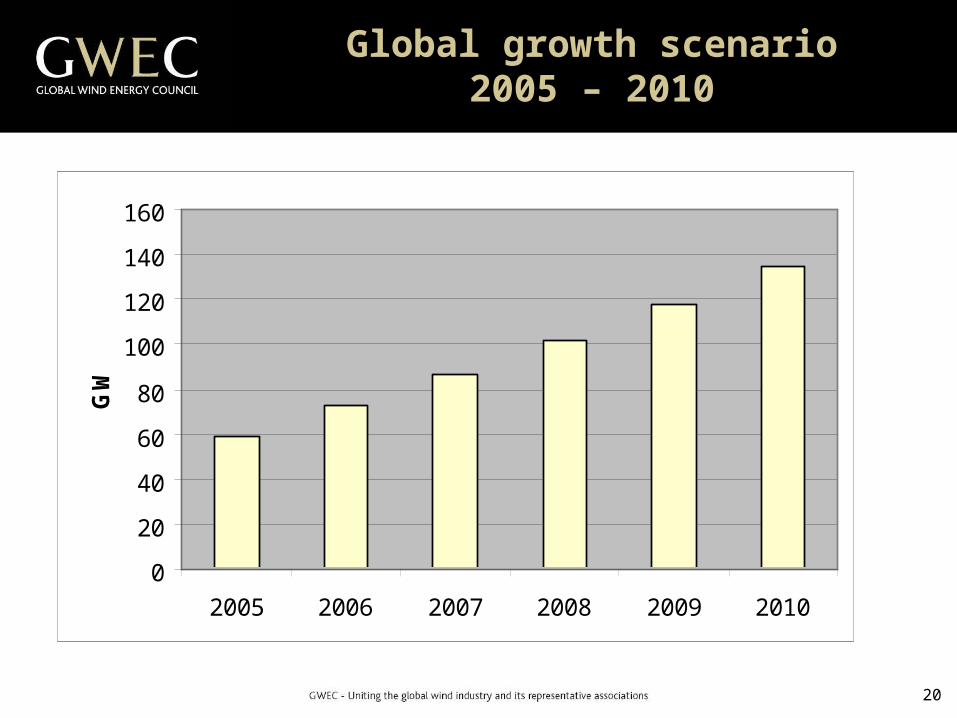
Global growth scenario 2005 – 2010
0
20
40
60
80
100
120
140
160
2005 2006 2007 2008 2009 2010
GW
21
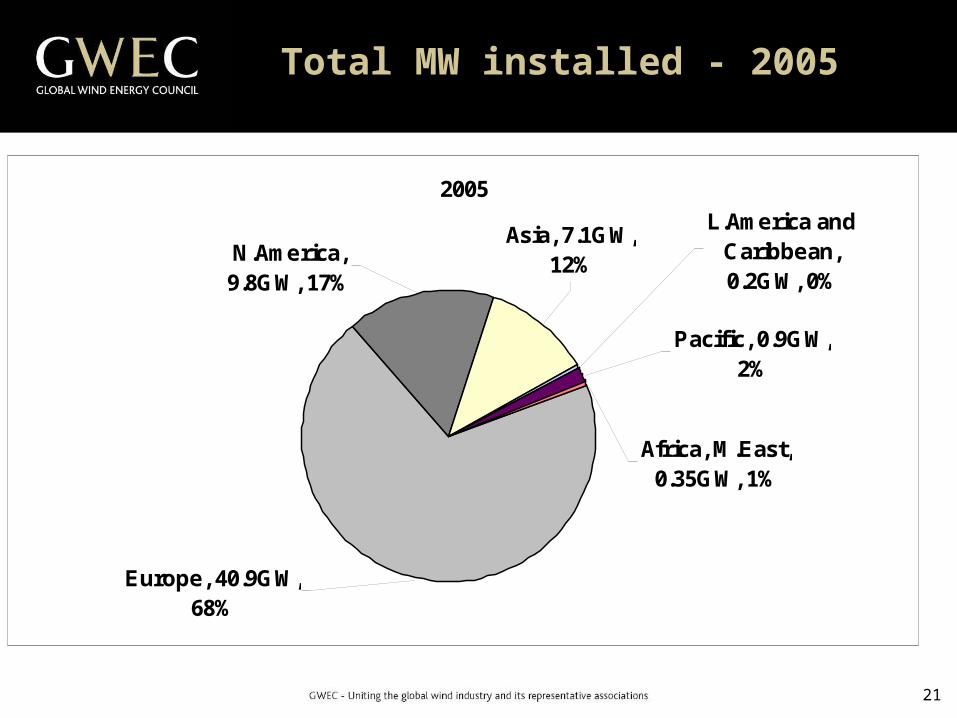
Total MW installed - 2005
2005
N.America, 9.8GW, 17%
L.America and Caribbean, 0.2GW, 0%
Asia, 7.1GW, 12%
Pacific, 0.9GW, 2%
Africa, M.East, 0.35GW, 1%
Europe, 40.9GW, 68%
22
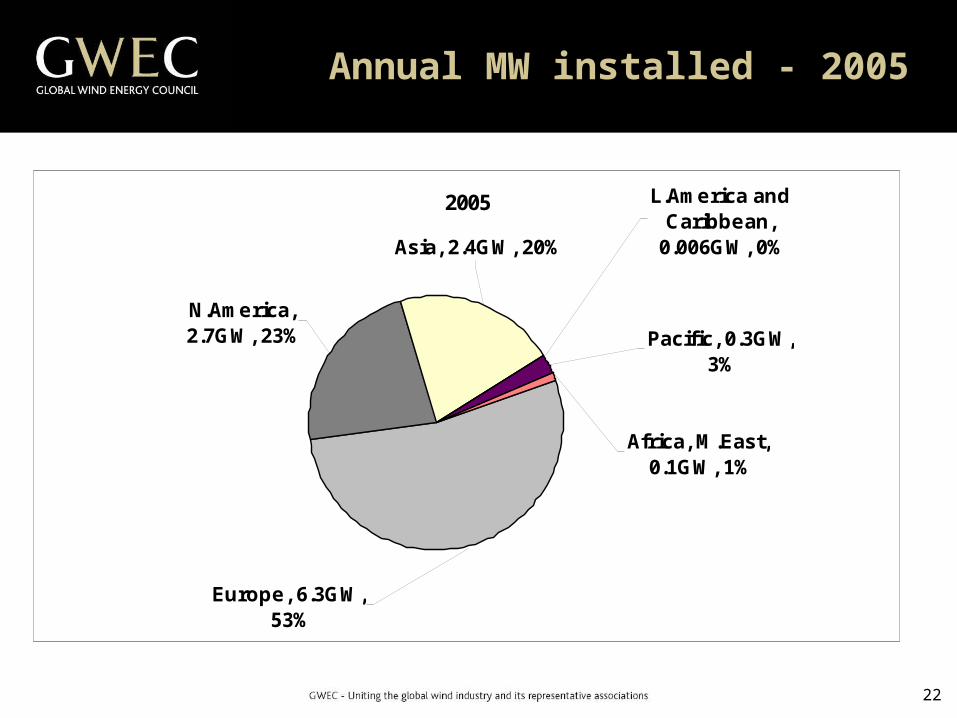
Annual MW installed - 2005
2005
Asia, 2.4GW, 20%
Africa, M.East, 0.1GW, 1%
Pacific, 0.3GW, 3%
L.America and Caribbean,
0.006GW, 0%
N.America, 2.7GW, 23%
Europe, 6.3GW, 53%
23
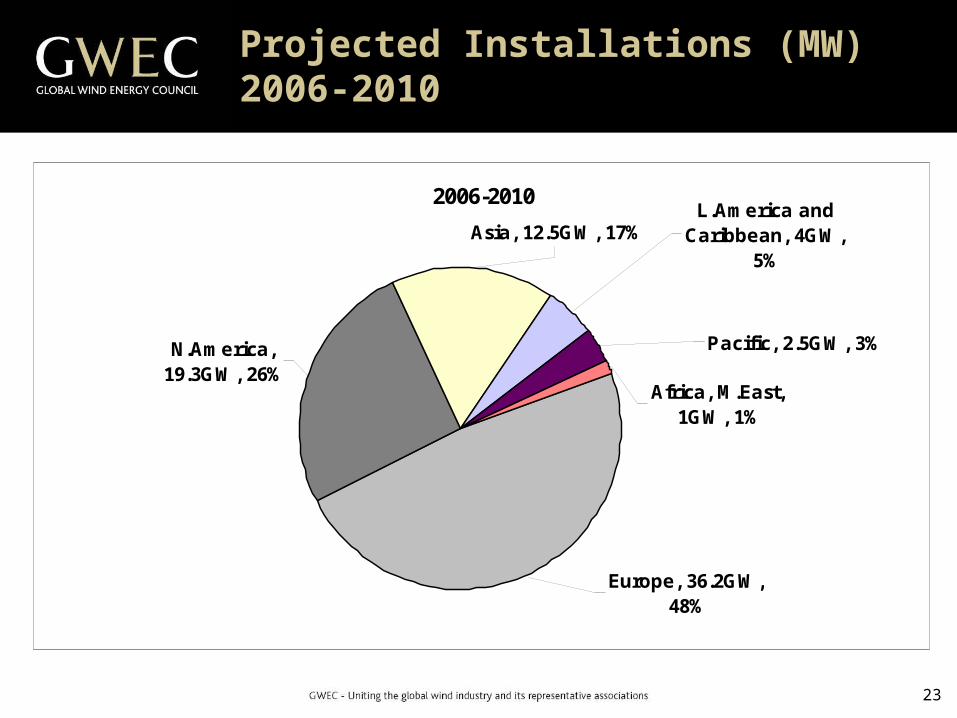
Projected Installations (MW) 2006-2010
2006-2010
N.America, 19.3GW, 26%
Asia, 12.5GW, 17%L.America and
Caribbean, 4GW, 5%
Pacific, 2.5GW, 3%
Africa, M.East, 1GW, 1%
Europe, 36.2GW, 48%
24
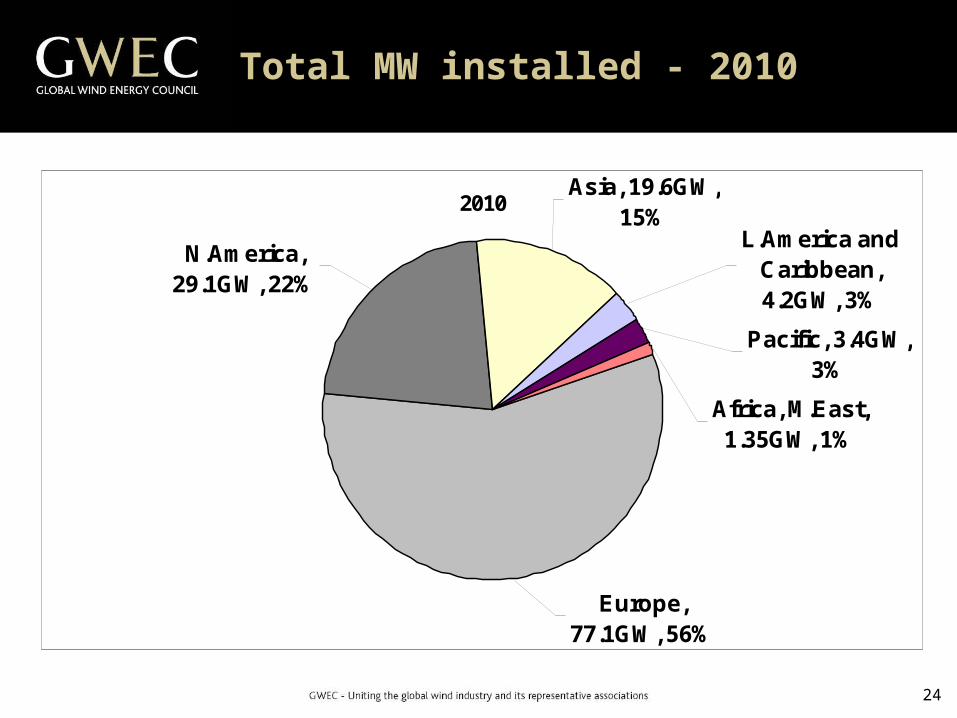
Total MW installed - 2010
2010
N.America, 29.1GW, 22%
Africa, M.East, 1.35GW, 1%
Pacific, 3.4GW, 3%
L.America and Caribbean, 4.2GW, 3%
Asia, 19.6GW, 15%
Europe, 77.1GW, 56%
25
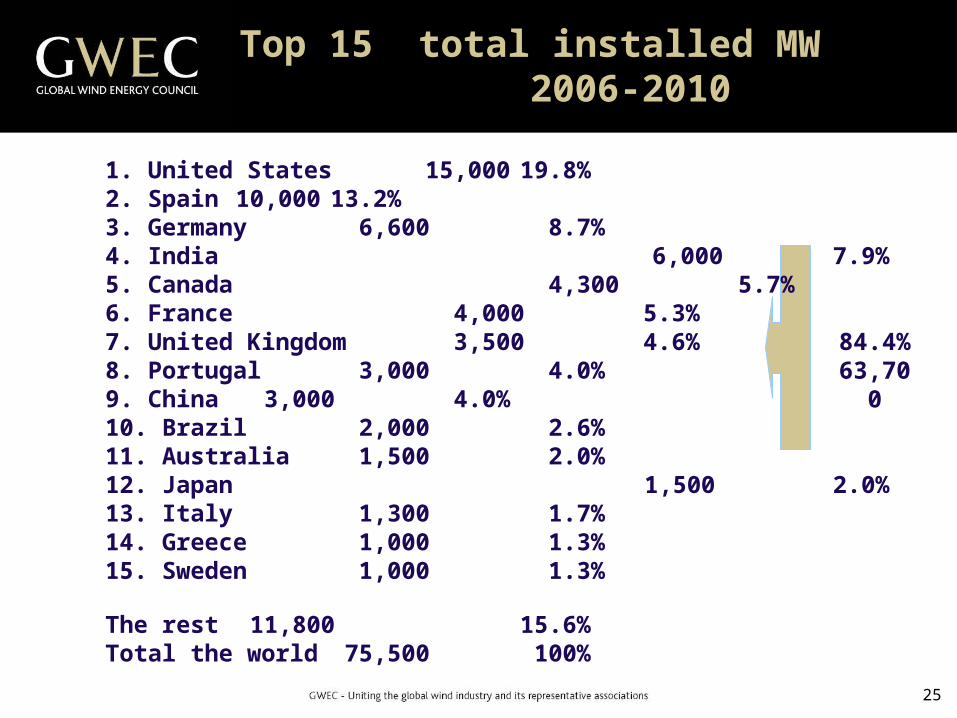
Top 15 total installed MW 2006-2010
84.4%
63,700
1. United States 15,000 19.8%2. Spain 10,000 13.2%3. Germany 6,600 8.7%4. India 6,000 7.9%5. Canada 4,300 5.7%6. France 4,000 5.3%7. United Kingdom 3,500 4.6%8. Portugal 3,000 4.0%9. China 3,000 4.0%10. Brazil 2,000 2.6%11. Australia 1,500 2.0%12. Japan 1,500 2.0%13. Italy 1,300 1.7%14. Greece 1,000 1.3%15. Sweden 1,000 1.3%
The rest 11,800 15.6%Total the world 75,500 100%
26
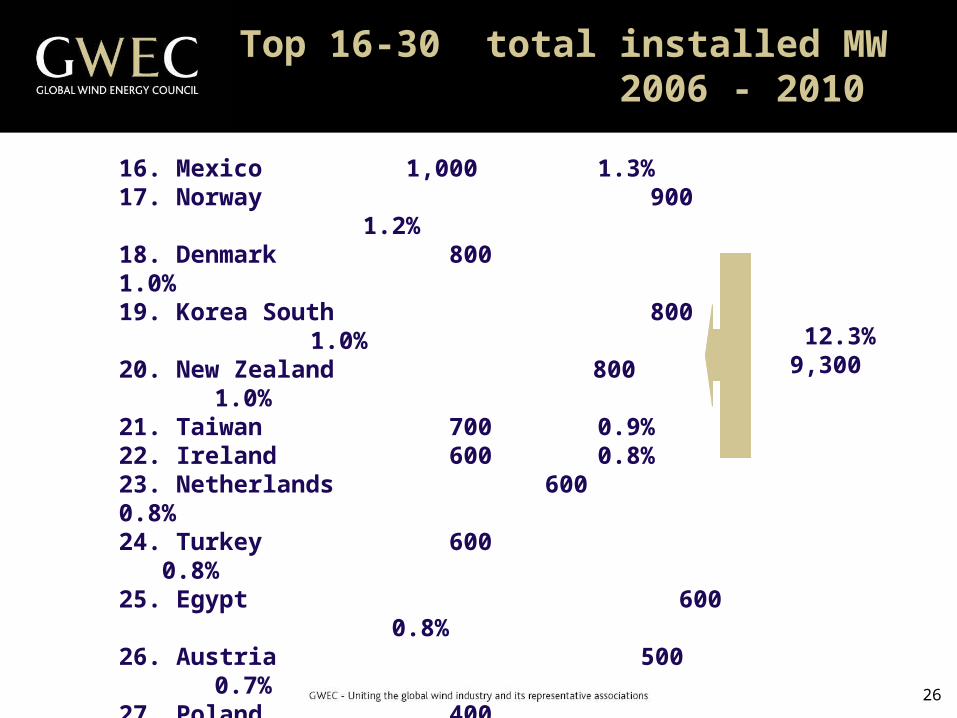
Top 16-30 total installed MW 2006 - 2010
16. Mexico 1,000 1.3%17. Norway 900 1.2%18. Denmark 800 1.0%19. Korea South 800 1.0%20. New Zealand 800 1.0%21. Taiwan 700 0.9%22. Ireland 600 0.8%23. Netherlands 600 0.8%24. Turkey 600 0.8%25. Egypt 600 0.8%26. Austria 500 0.7%27. Poland 400 0.5%28. Argentina 400 0.5%29. Belgium 300 0.4%30. Finland 300 0.4%
The rest 2,500 3.3%
12.3%9,300
27
WIND FORCE 12
28
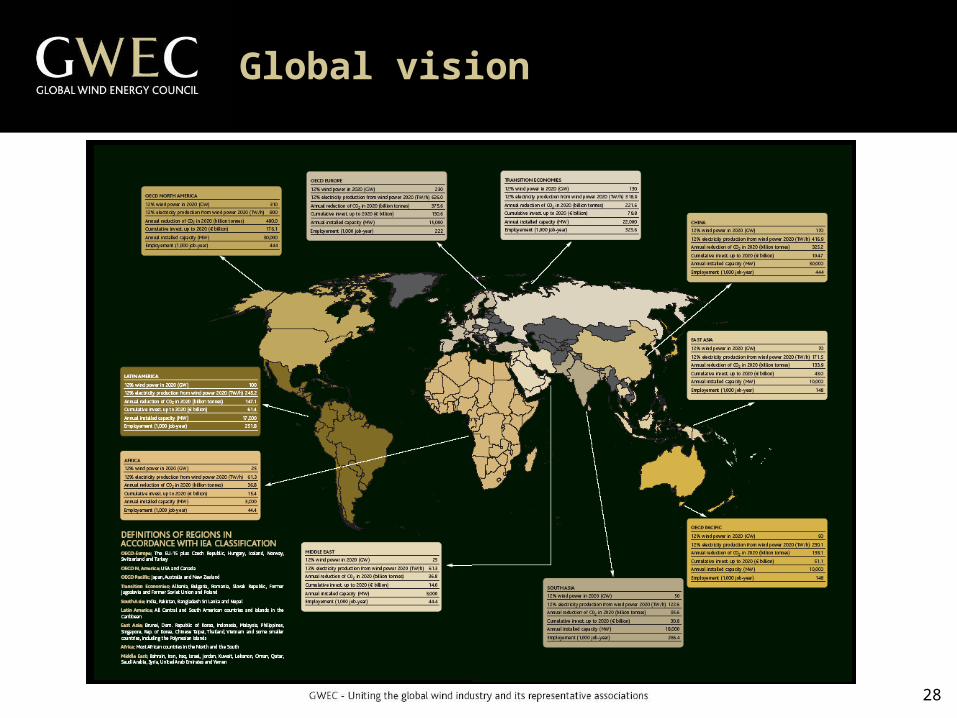
Global vision
29
Why Scenarios?
• images of alternative futures• neither predictions nor forecasts• image of how the future could unfold• useful tools for investigating alternative future
developments and their implications
Scenarios can create a vision for the future and guide decision makers
30
•Are the world’s wind resources large enough and appropriately distributed geographically to achieve a level of 12% penetration?•What level of electricity output will be required and can this be accommodated in the existing grid systems?•Is wind technology sufficiently developed to meet this challenge?•With the current status of the wind industry, is it feasible to satisfy a substantially enlarged demand and what growth rates will be required?
Methodology
31
•The world’s wind resources are estimated to be 53.000 TWh/year.•2001 global electricity consumption is 15.578TWh/year.•This is predicted to rise to 25.579 TWh/year by 2020 (IEA).•Lack of resource is unlikely ever to be a limiting factor.•The total global wind resource that is technically recoverable is more than twice as large as the projection for the world’s entire electricity demand by 2020.
Is There Enough Wind?
32
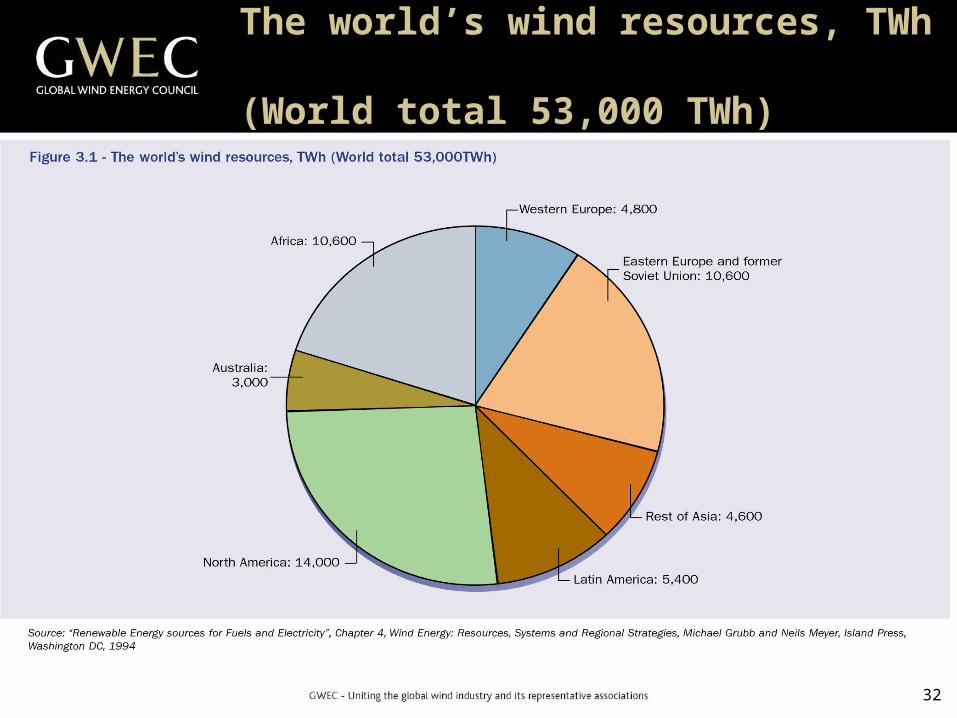
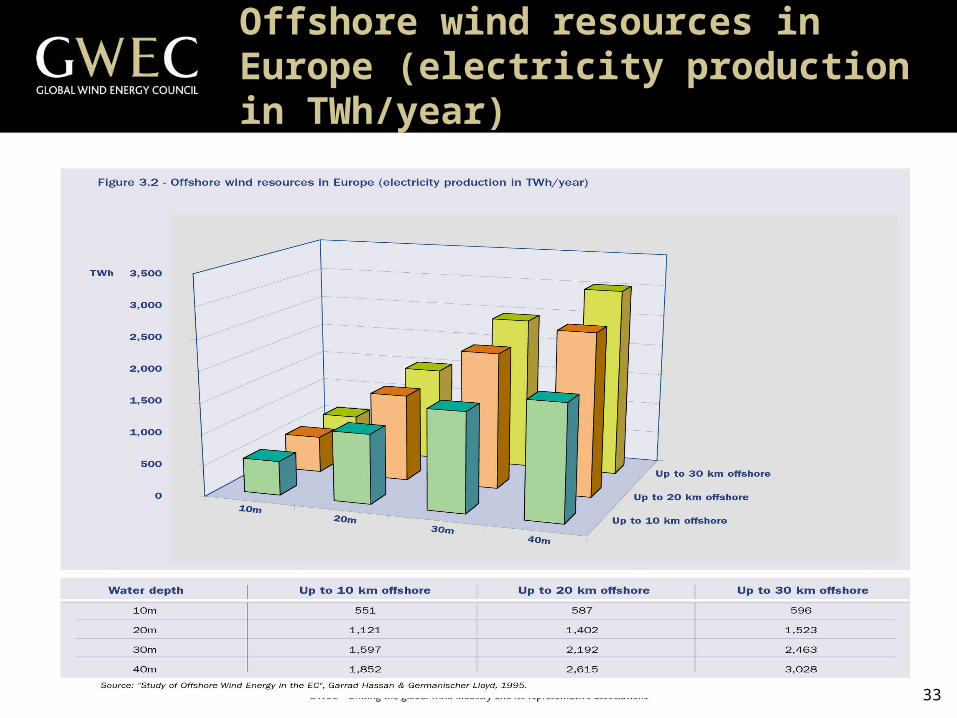
The world’s wind resources, TWh (World total 53,000 TWh)
33
Offshore wind resources in Europe (electricity production in TWh/year)
34
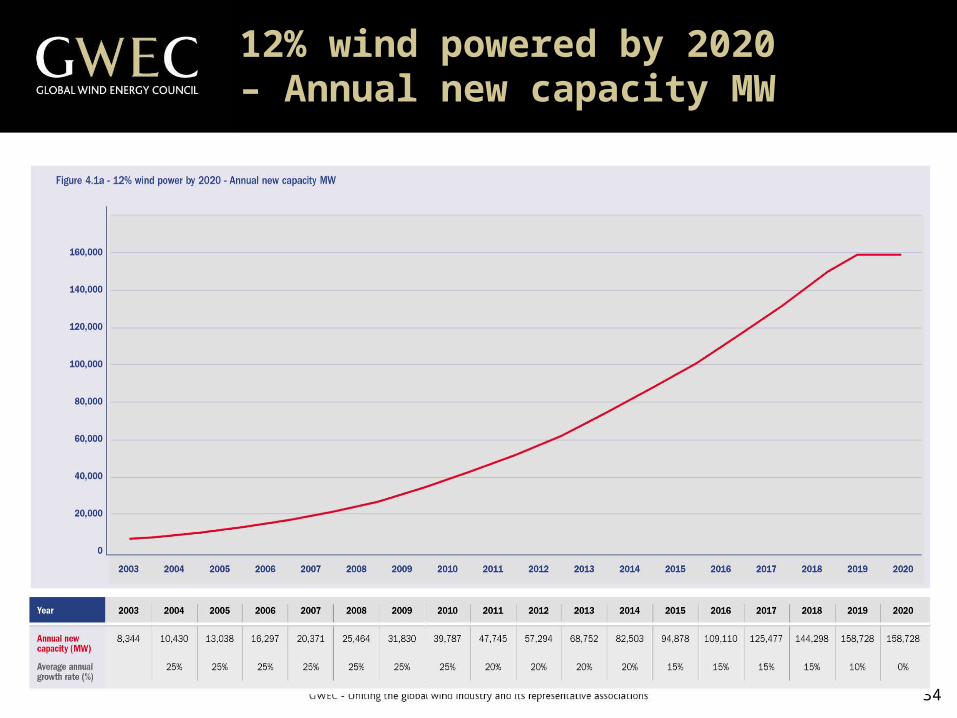
12% wind powered by 2020 – Annual new capacity MW
35
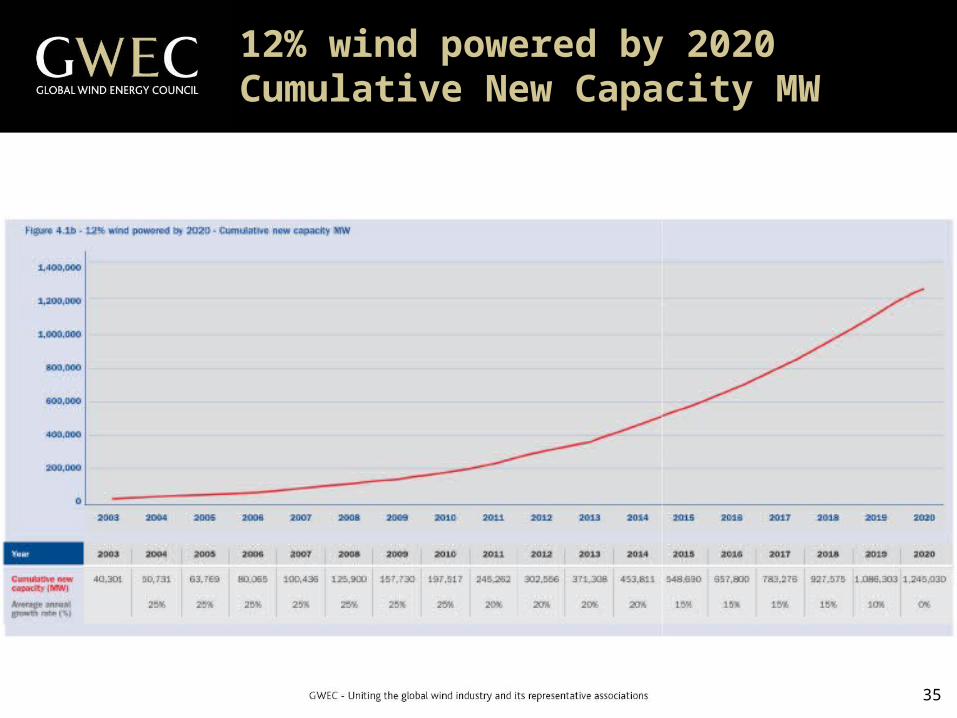
12% wind powered by 2020 Cumulative New Capacity MW
36
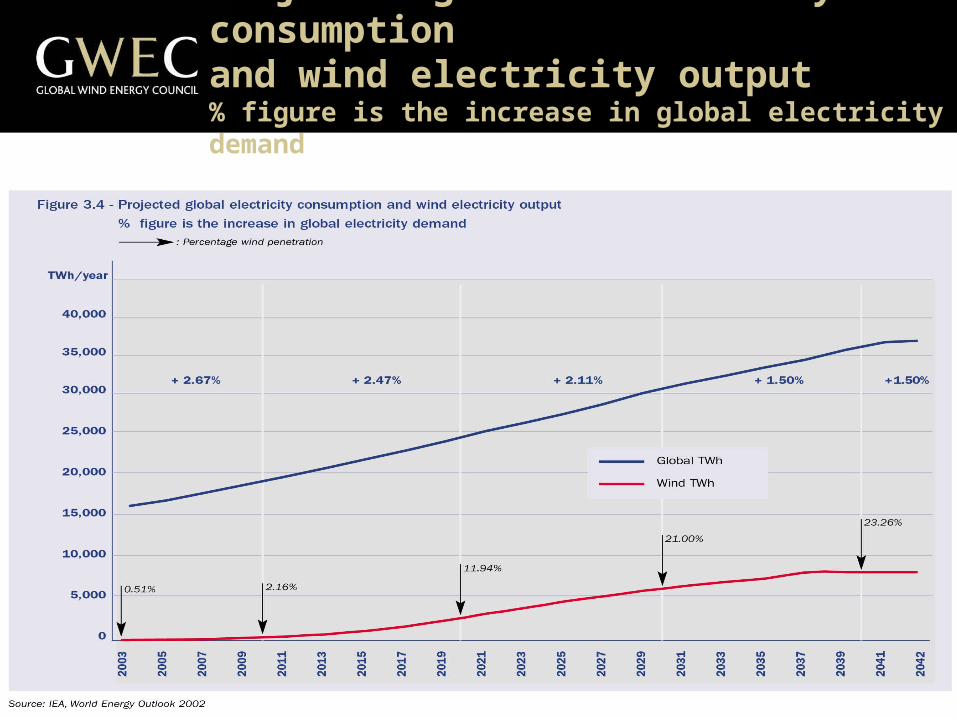
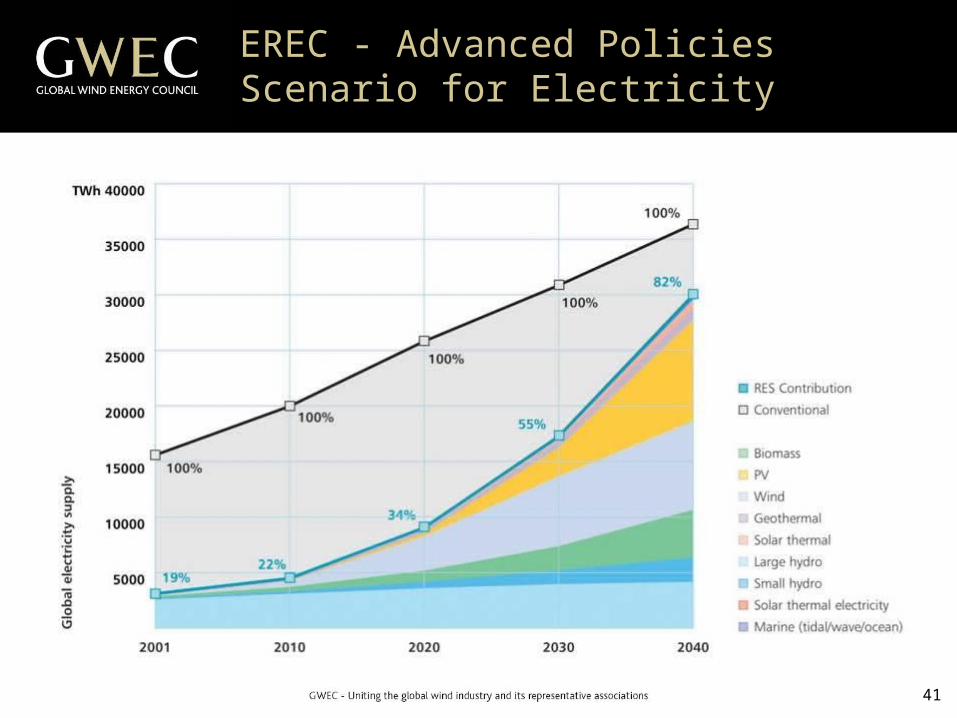
Projected global electricity consumption and wind electricity output % figure is the increase in global electricity demand
37
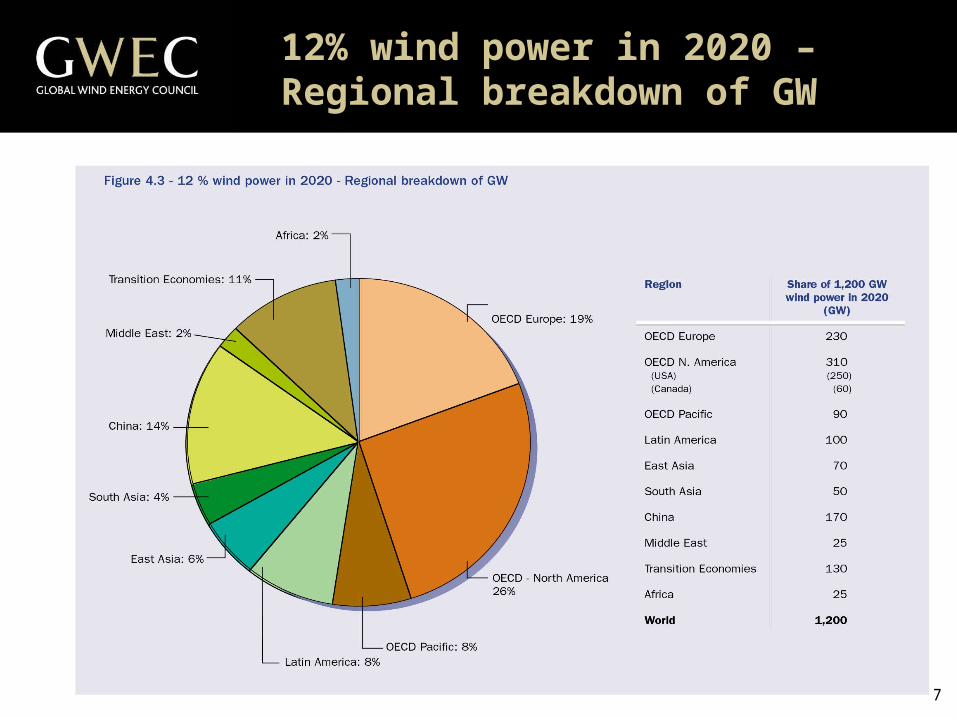
12% wind power in 2020 – Regional breakdown of GW
38
•12% global electricity demand.•716,491 wind turbines installed.•3,054 TW hours of wind powered electricity.•1,245,030 MW wind installed.•Cost reduction to 2.45 eurocents/kWh, installation cost of 512 euro/kW.•2,338,000 jobs. •Annual investment of 82 billion euro.
•Cumulative savings of 10,771 million tons of CO2.
Global Summary for the Year 2020
39
Wind energy capacity projections and potential extra capacity due to gas unavailability
0
200
400
600
800
1,000
1,200
1,400
2000 2005 2010 2015 2020 2025 2030
GW
Potential from gas gap
IEA forecast
Wind Force 12 blueprint
EWEA's conventional scenario
Source: F.Varela, RES, GWEC
40
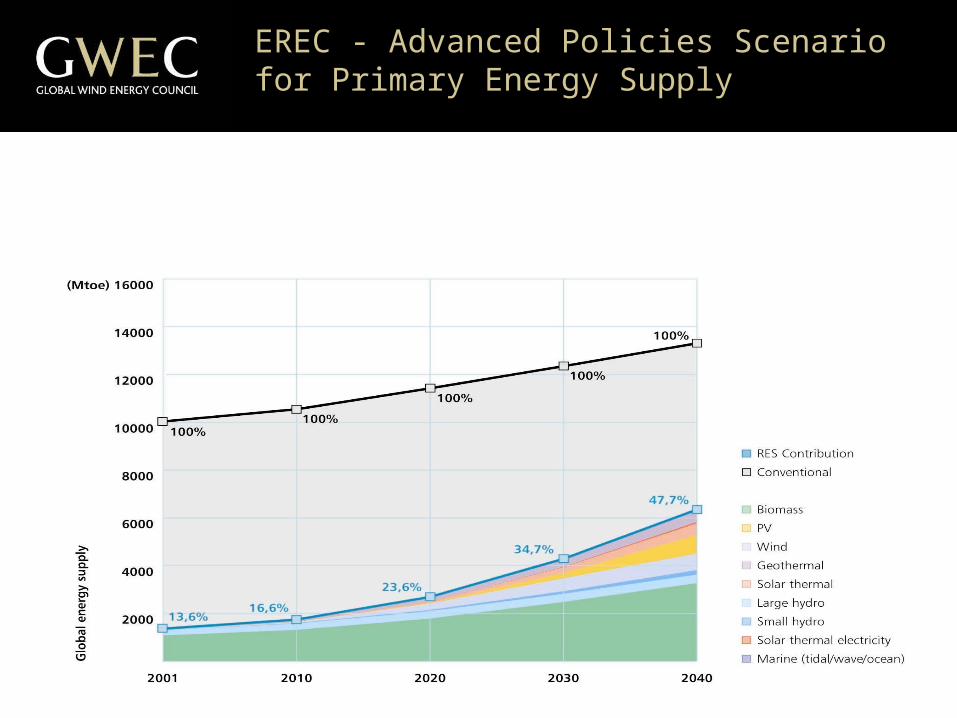
EREC - Advanced Policies Scenario for Primary Energy Supply
41
EREC - Advanced Policies Scenario for Electricity
42


![arXiv:2011.07487v1 [physics.pop-ph] 15 Nov 2020the Solar System by the solar wind’s electric eld. In this paper we study the possibility of attaching the spinning habitats to a xed](https://img.pdfslide.us/doc/110x75/610ef8b381f30d65d67ac517/arxiv201107487v1-15-nov-2020-the-solar-system-by-the-solar-windas-electric.jpg)


![The Standing Stone & Dragons [multi]/3rd... · 2018. 8. 25. · Over tumbled graves, about the chapel There is the empty chapel, only the wind’s home. It has no windows, and the](https://img.pdfslide.us/doc/110x75/60a5b45562e9b32f025c72ba/the-standing-stone-dragons-multi3rd-2018-8-25-over-tumbled-graves.jpg)