Embed Size (px)
Citation preview
1
What is Front-of-Pack Labelling?
Codex Committee on Food Labelling
FAO/WHO Information Meeting on
Front-of-Pack Nutrition Labelling
Charlottetown PEI, May 11, 2012
Mary R. L’Abbé, PhD
Earle W. McHenry Professor and Chair
Teri Emrich, PhD Candidate
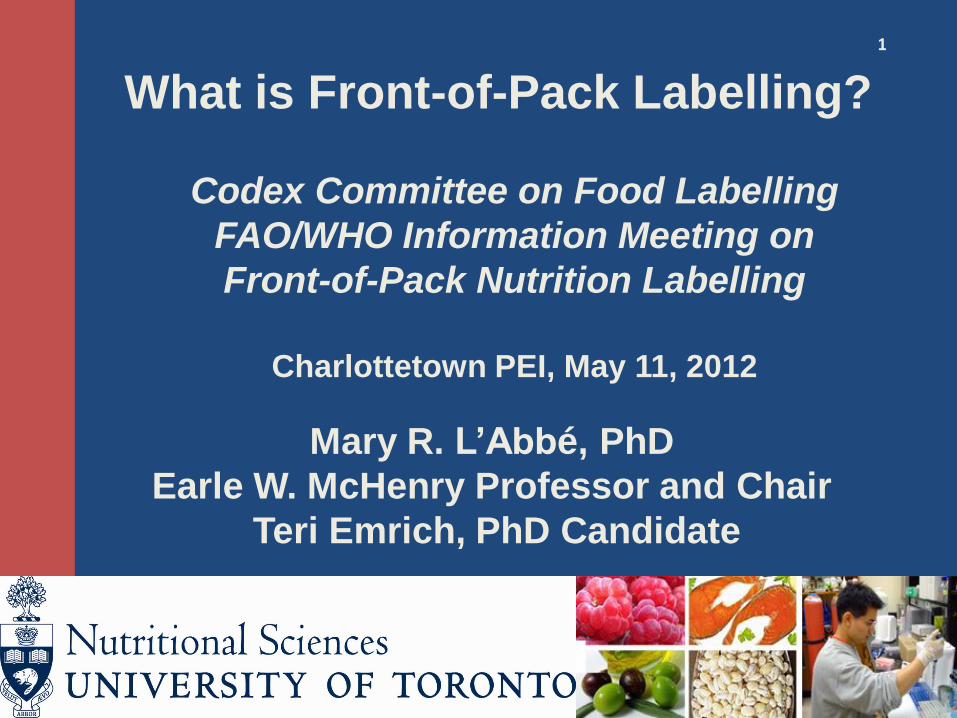
Background
Burden of diet-related chronic disease1
Account for 60% of deaths worldwide2
Unhealthy diet is a preventable risk factor
Individuals and populations should limit1,3:
Total calories
Saturated and trans fat
Sugar
Salt
1. WHO. Diet, Nutrition and the Prevention of Chronic Disease (2003); 2. WHO. Preventing chronic diseases: a
vital investment. 2005.; 3. WHOWHO. Global Strategy on Diet, Physical Activity and Health (2005)
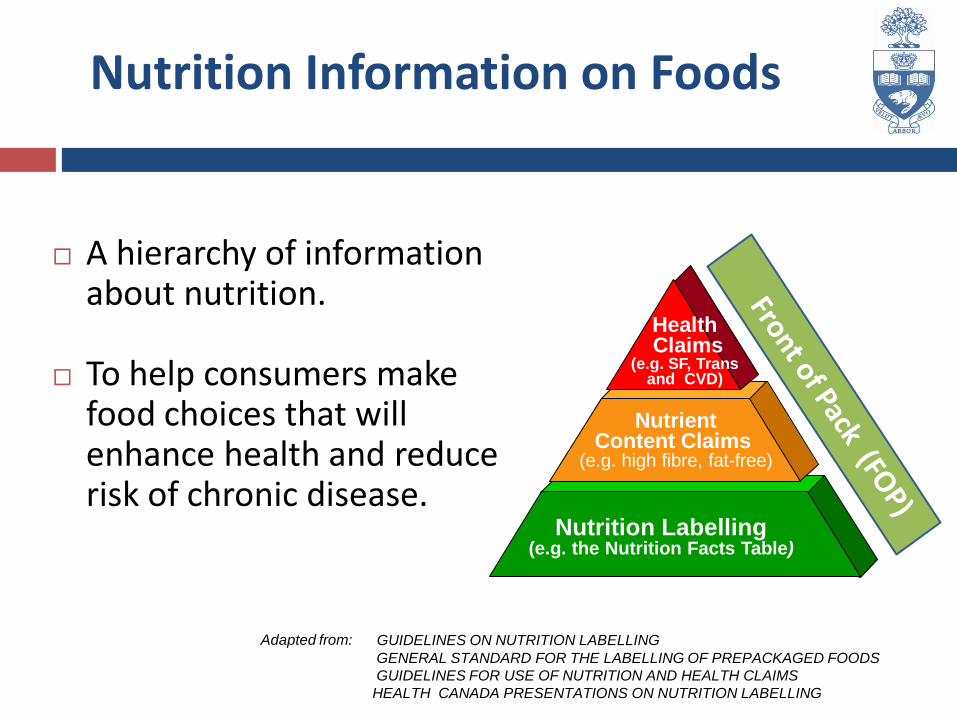
Nutrition Information on Foods
A hierarchy of information about nutrition.
To help consumers make
food choices that will enhance health and reduce risk of chronic disease.
Nutrition Labelling (e.g. the Nutrition Facts Table)
Nutrient Content Claims
(e.g. high fibre, fat-free)
Health Claims
(e.g. SF, Trans and CVD)
Adapted from: GUIDELINES ON NUTRITION LABELLING
GENERAL STANDARD FOR THE LABELLING OF PREPACKAGED FOODS
GUIDELINES FOR USE OF NUTRITION AND HEALTH CLAIMS
HEALTH CANADA PRESENTATIONS ON NUTRITION LABELLING
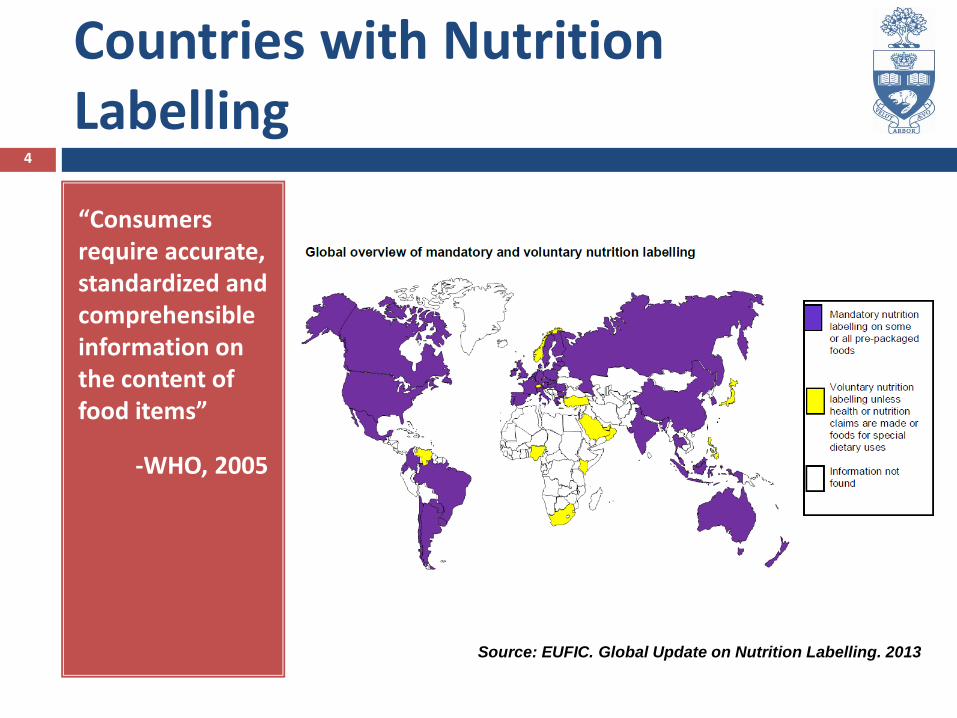
Countries with Nutrition Labelling
“Consumers require accurate, standardized and comprehensible information on the content of food items”
-WHO, 2005
4
Source: EUFIC. Global Update on Nutrition Labelling. 2013
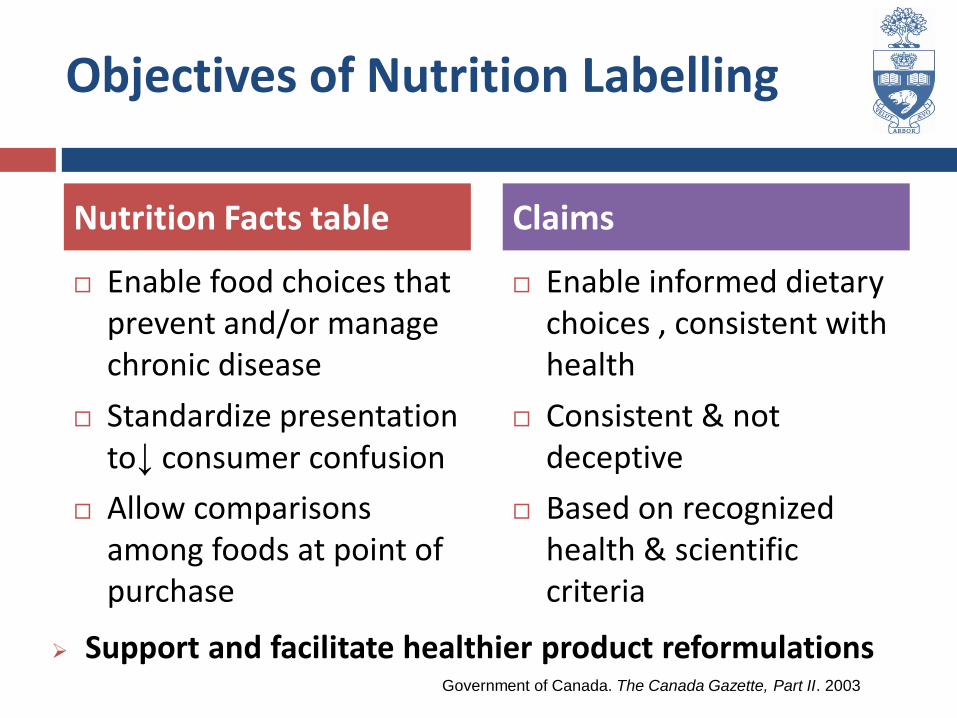
Objectives of Nutrition Labelling
Enable food choices that prevent and/or manage chronic disease
Standardize presentation to↓ consumer confusion
Allow comparisons among foods at point of purchase
Enable informed dietary choices , consistent with health
Consistent & not deceptive
Based on recognized health & scientific criteria
Nutrition Facts table Claims
Government of Canada. The Canada Gazette, Part II. 2003
Support and facilitate healthier product reformulations
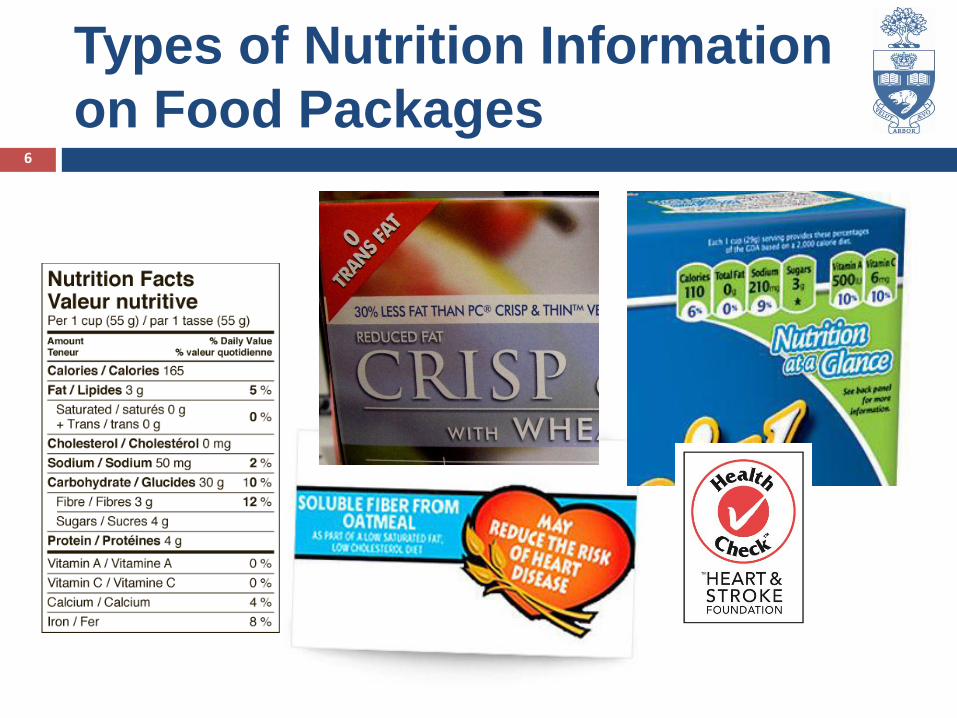
Types of Nutrition Information
on Food Packages 6
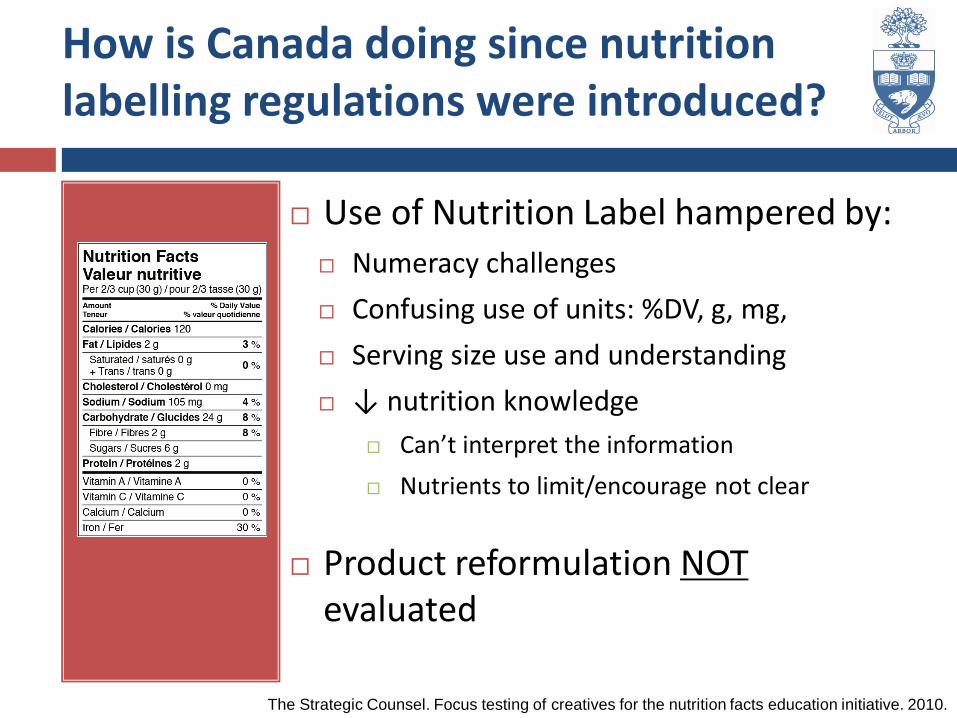
Use of Nutrition Label hampered by: Numeracy challenges
Confusing use of units: %DV, g, mg,
Serving size use and understanding
↓ nutrition knowledge
Can’t interpret the information
Nutrients to limit/encourage not clear
Product reformulation NOT evaluated
The Strategic Counsel. Focus testing of creatives for the nutrition facts education initiative. 2010.
How is Canada doing since nutrition labelling regulations were introduced?
Simplified information on the key
nutritional aspects/characteristics of foods
Potential to improve dietary intake and reduce
diet-related chronic disease? 1-3:
Help consumers select healthier foods
Stimulate healthy product development and
reformulation by manufacturers
1. The Standing Committee on Health, Healthy Weights for Healthy Kids, 2007; 2. IOM. Examination of Front-of-Pack Nutrition
Rating Systems and Symbols: Phase 1 Report, 2010; 3. Stocklet, L. Review of ‘front-of-pack’ nutrition schemes, 2007
Front-of-pack labelling as a
complementary public health strategy?
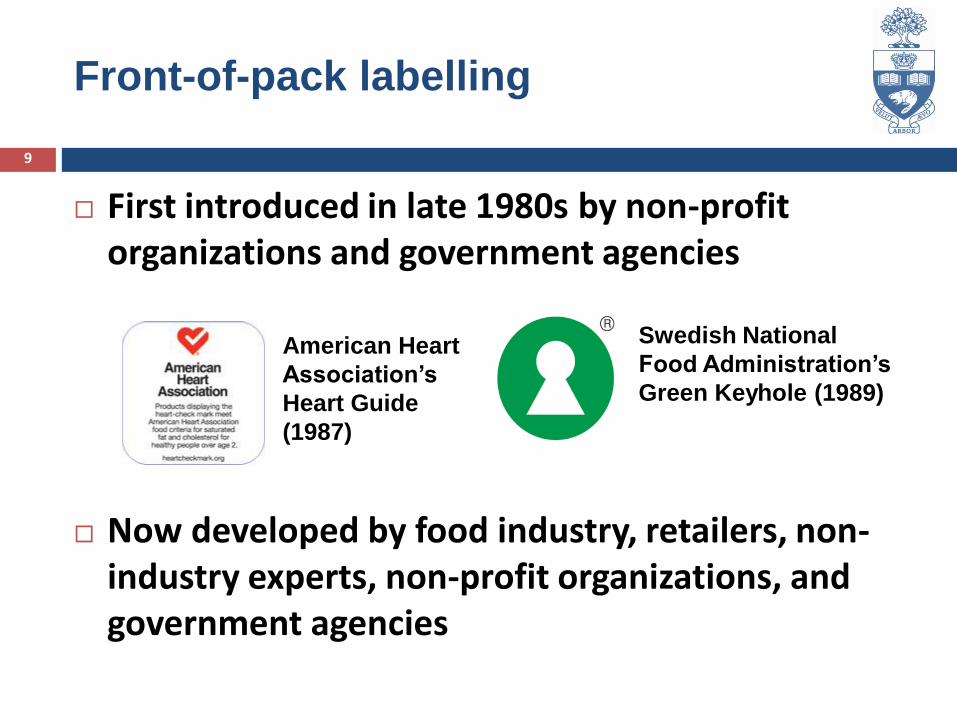
First introduced in late 1980s by non-profit organizations and government agencies
Now developed by food industry, retailers, non-industry experts, non-profit organizations, and government agencies
Front-of-pack labelling
9
American Heart
Association’s
Heart Guide
(1987)
Swedish National
Food Administration’s
Green Keyhole (1989)
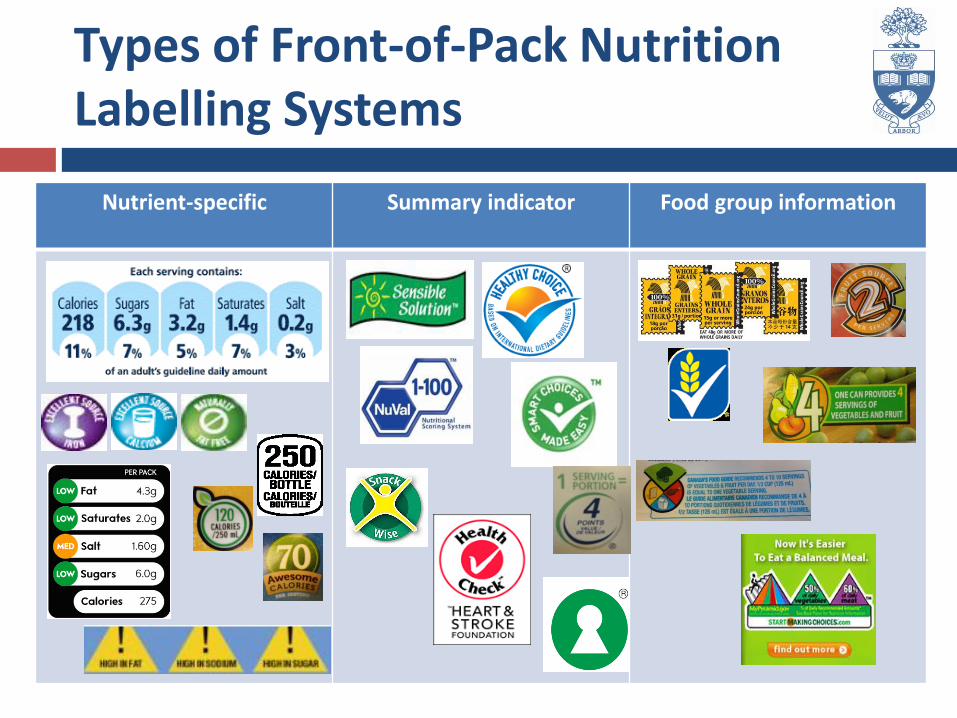
Types of Front-of-Pack Nutrition Labelling Systems
Nutrient-specific Summary indicator Food group information
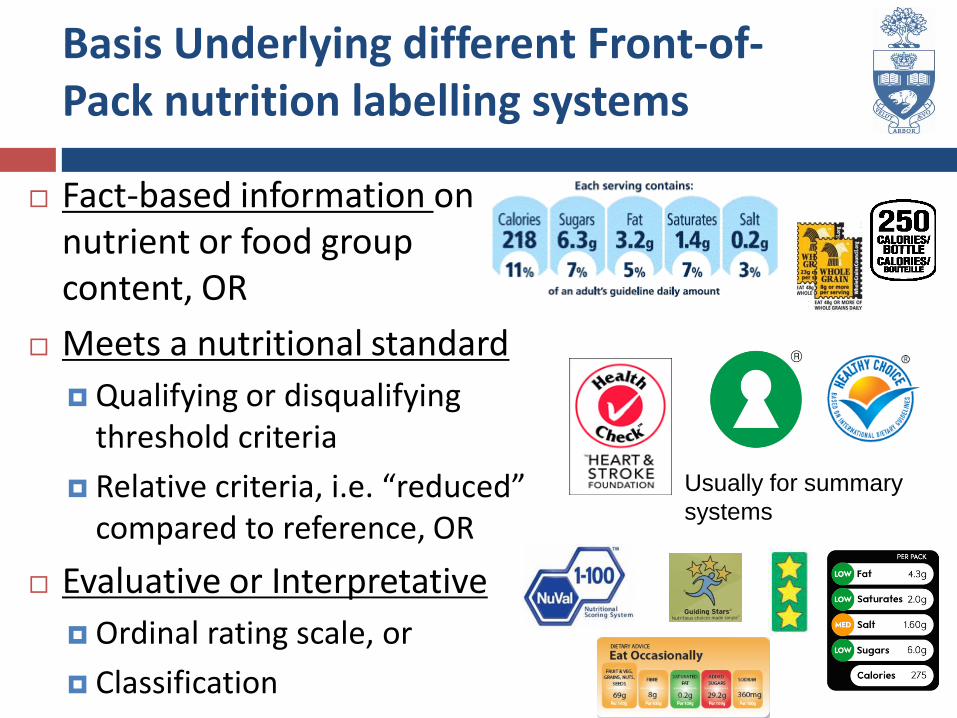
Basis Underlying different Front-of-Pack nutrition labelling systems
Fact-based information on nutrient or food group content, OR
Meets a nutritional standard
Qualifying or disqualifying threshold criteria
Relative criteria, i.e. “reduced” compared to reference, OR
Evaluative or Interpretative
Ordinal rating scale, or
Classification
Usually for summary
systems
Nutrient Profiling – system used to set nutritional standards
Classification based on nutritional composition 5,7,8
Considerations: Purpose and target audience,
Application of criteria (e.g. by category or across the board)
Which nutrients included (e.g. Nutrients to limit and/or Nutrients to encourage?)
Reference amount (per serving or per 100 g?)
Type of model (e.g. thresholds or algorithms)
The scientific basis for the criteria (e.g. nutrition recommendations, DRIs, “better than” etc)
5. IOM. Examination of Front-of-Pack Nutrition Rating Systems and Symbols: Phase 1 Report, 2010; 7. Lobstein & Davies.
Public Health Nutr, 2009, 12(3), 331-340; 8. Stockley. Review of ‘front-of’pack’ nutrition rating schemes, 2007.
FOPS in Canada
First introduced in 1999 with the HSFC Health Check Program
No specific regulations governing their use
Multiple symbols developed by manufacturers & non-profit group
Proprietary to the system/manufacturer
Unique and different criteria for each system
Different levels of nutrients or food components
Criticized by many health professionals as increasing consumer confusion
No plans to move to a single, standardized FOPS
Despite recommendation of IOM & House of Commons Standing Committee on Health
Food Label Information
Program (FLIP)
Cross-sectional analysis of pre-packaged food
labels in the Canadian marketplace
Food Label Information Program (FLIP)
Collected in 2010-2011
From top Canadian grocery retailers (by sales)
National and house brands
10,487 foods from 22 food categories
14
Schermel et al, APMN 2013
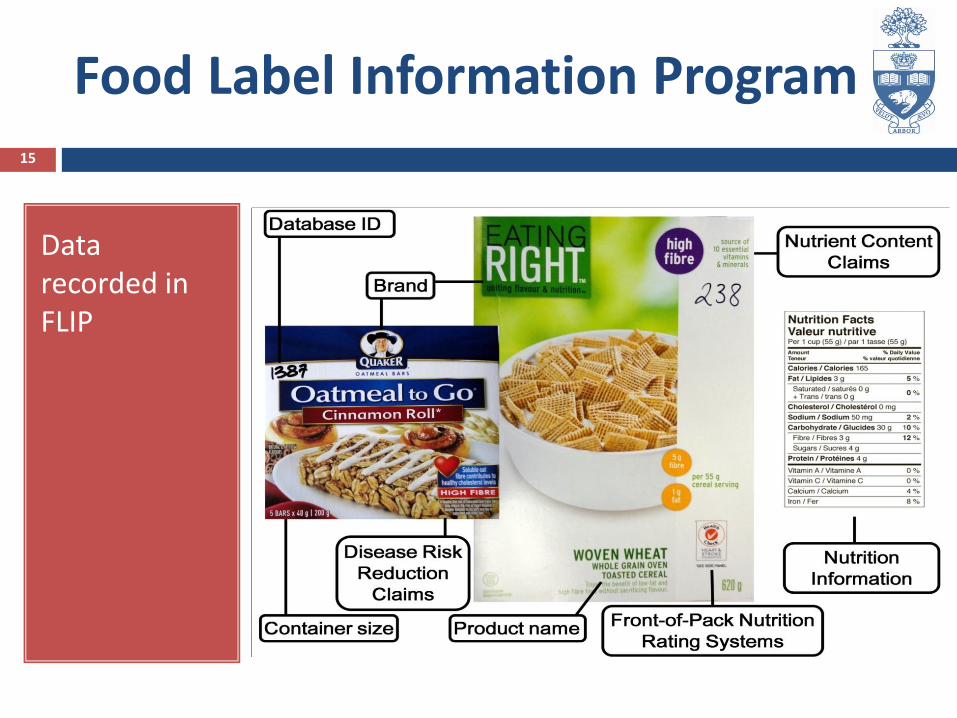
Food Label Information Program
15
Data recorded in FLIP
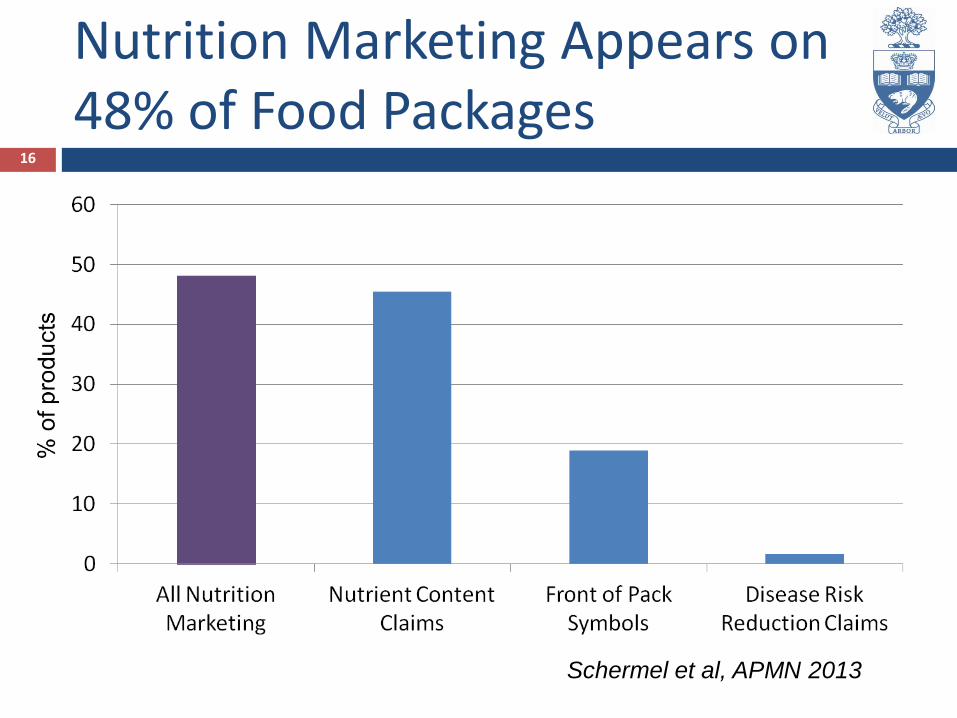
Nutrition Marketing Appears on 48% of Food Packages
16
Schermel et al, APMN 2013
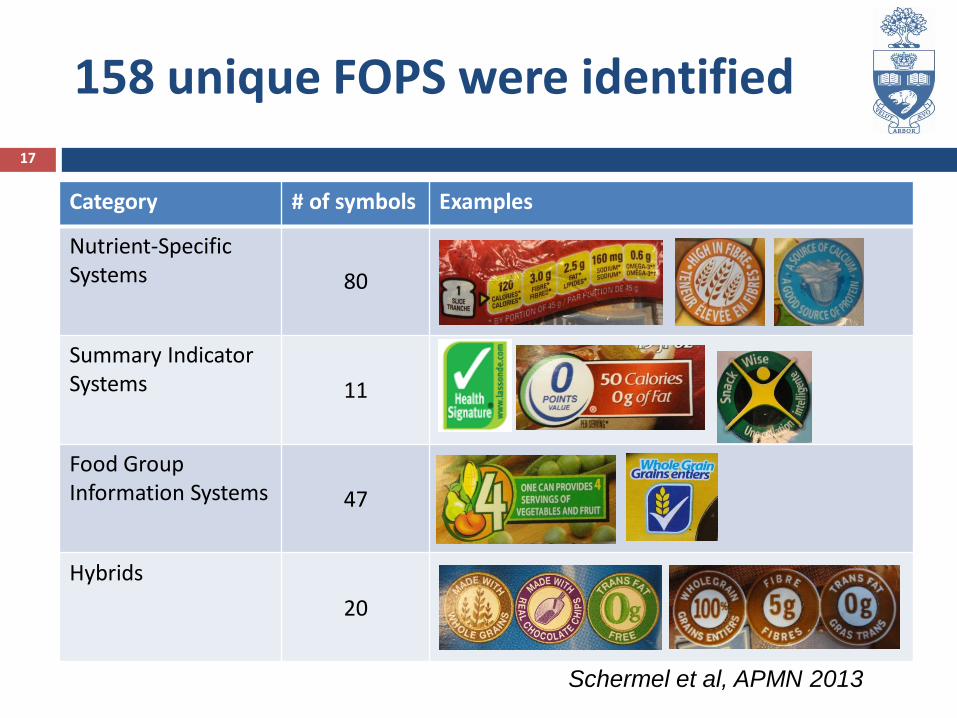
Category # of symbols Examples
Nutrient-Specific Systems 80
Summary Indicator Systems 11
Food Group Information Systems 47
Hybrids
20
158 unique FOPS were identified
17
Schermel et al, APMN 2013
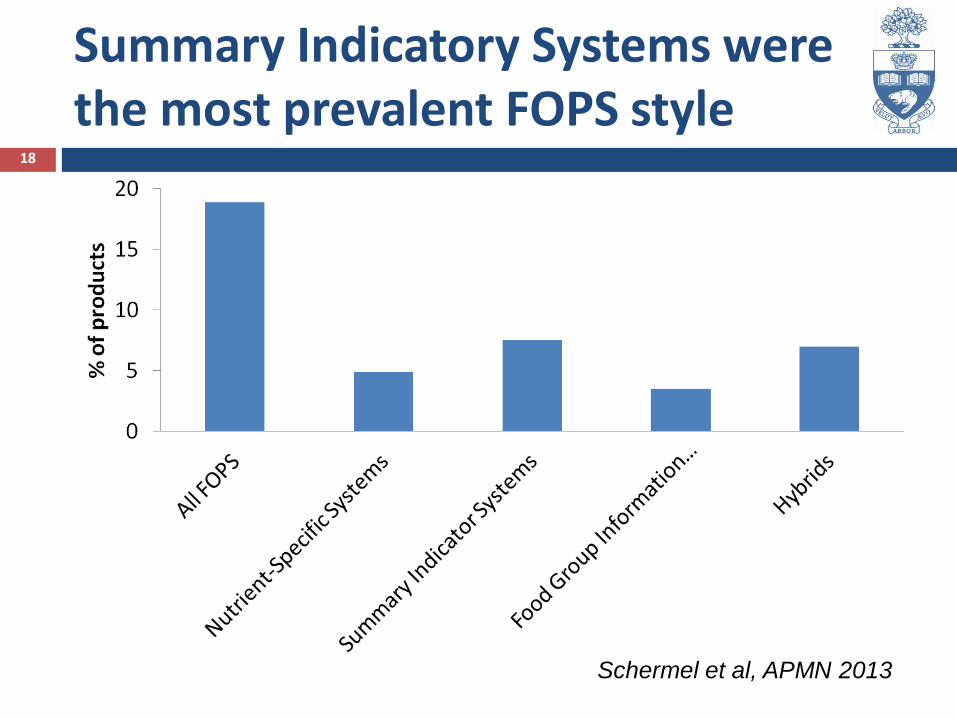
Summary Indicatory Systems were the most prevalent FOPS style
18
Schermel et al, APMN 2013
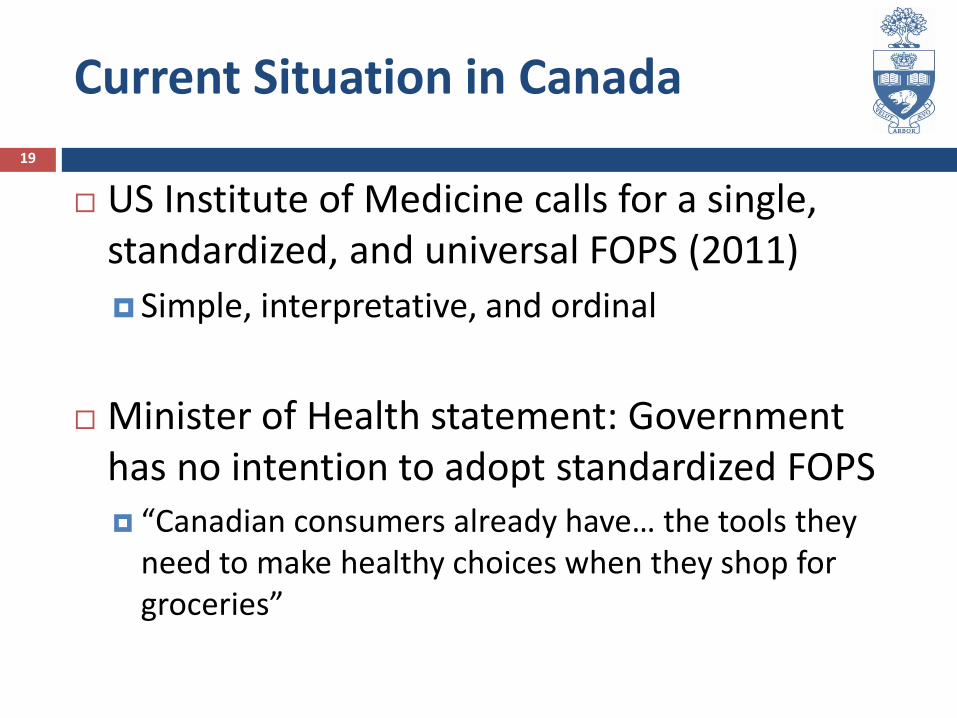
Current Situation in Canada
US Institute of Medicine calls for a single, standardized, and universal FOPS (2011)
Simple, interpretative, and ordinal
Minister of Health statement: Government has no intention to adopt standardized FOPS “Canadian consumers already have… the tools they
need to make healthy choices when they shop for groceries”
19
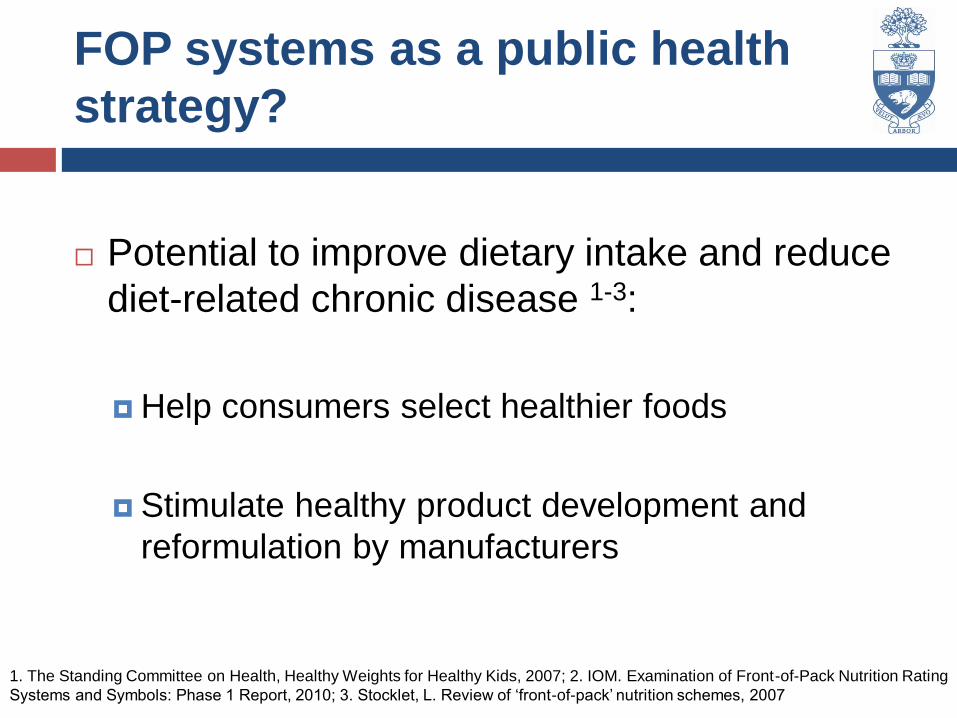
FOP systems as a public health
strategy?
Potential to improve dietary intake and reduce
diet-related chronic disease 1-3:
Help consumers select healthier foods
Stimulate healthy product development and
reformulation by manufacturers
1. The Standing Committee on Health, Healthy Weights for Healthy Kids, 2007; 2. IOM. Examination of Front-of-Pack Nutrition Rating
Systems and Symbols: Phase 1 Report, 2010; 3. Stocklet, L. Review of ‘front-of-pack’ nutrition schemes, 2007
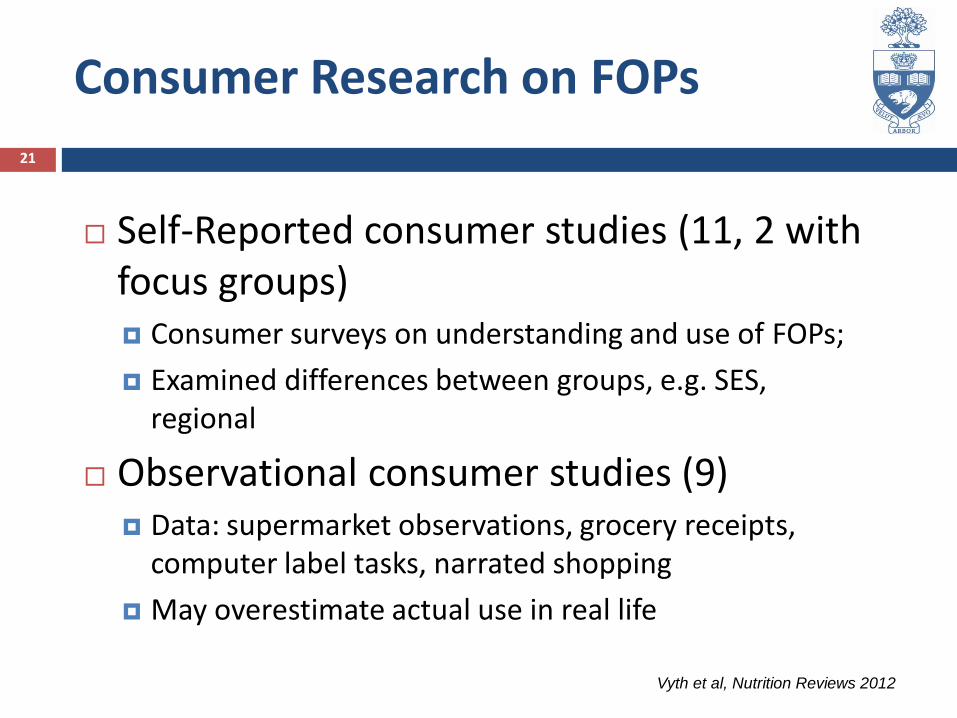
Self-Reported consumer studies (11, 2 with focus groups) Consumer surveys on understanding and use of FOPs;
Examined differences between groups, e.g. SES, regional
Observational consumer studies (9) Data: supermarket observations, grocery receipts,
computer label tasks, narrated shopping
May overestimate actual use in real life
Consumer Research on FOPs
21
Vyth et al, Nutrition Reviews 2012
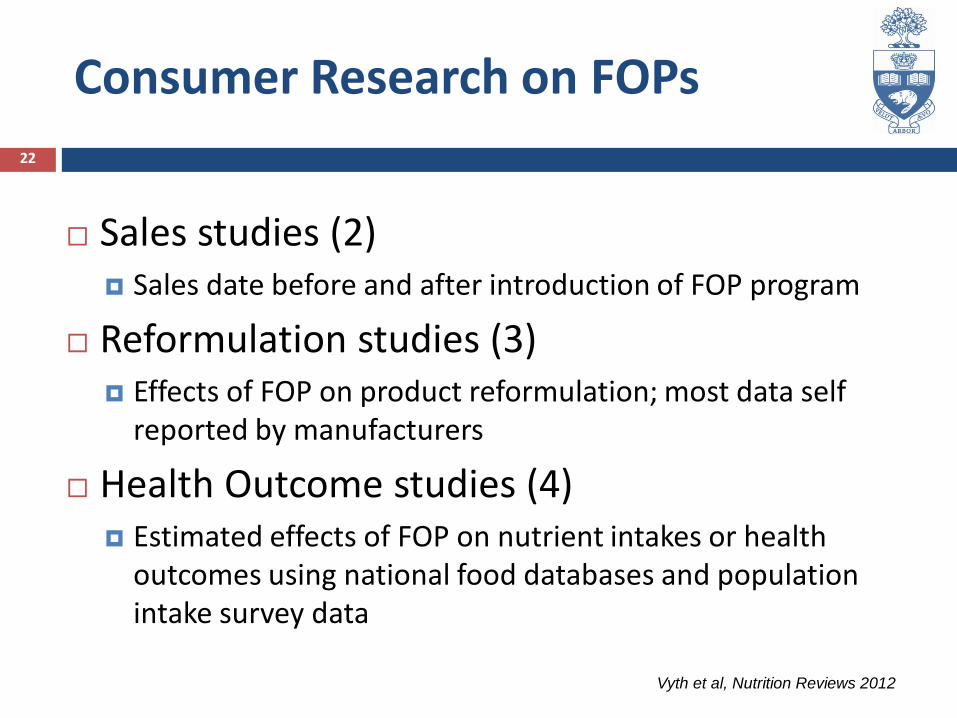
Sales studies (2) Sales date before and after introduction of FOP program
Reformulation studies (3) Effects of FOP on product reformulation; most data self
reported by manufacturers
Health Outcome studies (4) Estimated effects of FOP on nutrient intakes or health
outcomes using national food databases and population intake survey data
Consumer Research on FOPs
22
Vyth et al, Nutrition Reviews 2012
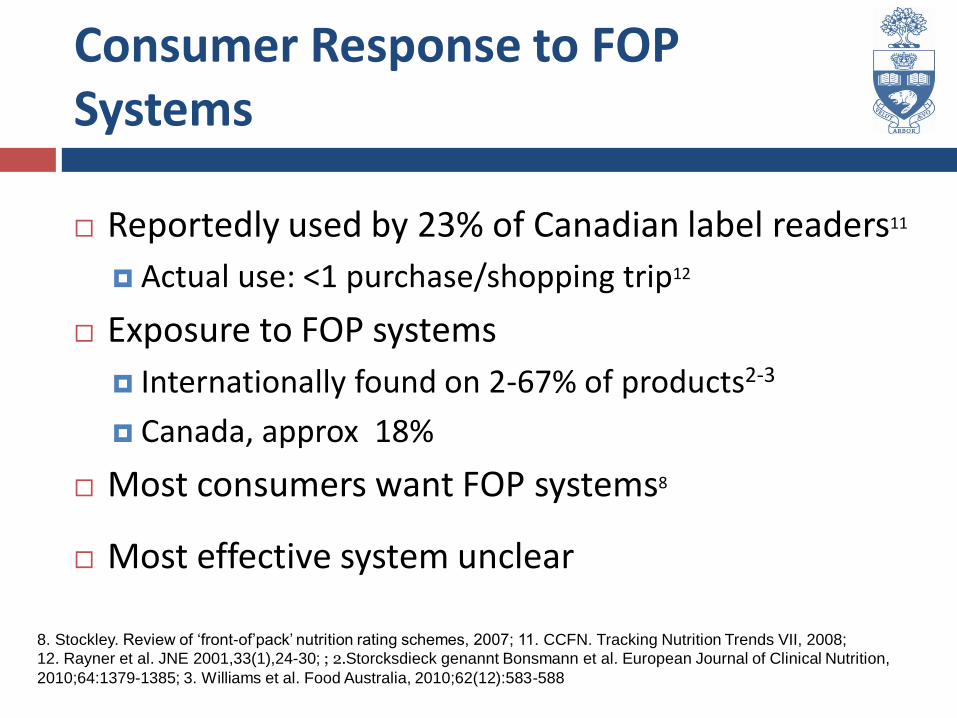
Consumer Response to FOP Systems
Reportedly used by 23% of Canadian label readers11
Actual use: <1 purchase/shopping trip12
Exposure to FOP systems
Internationally found on 2-67% of products2-3
Canada, approx 18%
Most consumers want FOP systems8
Most effective system unclear
8. Stockley. Review of ‘front-of’pack’ nutrition rating schemes, 2007; 11. CCFN. Tracking Nutrition Trends VII, 2008;
12. Rayner et al. JNE 2001,33(1),24-30; ; 2.Storcksdieck genannt Bonsmann et al. European Journal of Clinical Nutrition,
2010;64:1379-1385; 3. Williams et al. Food Australia, 2010;62(12):583-588
15
17
19
21
23
25
27
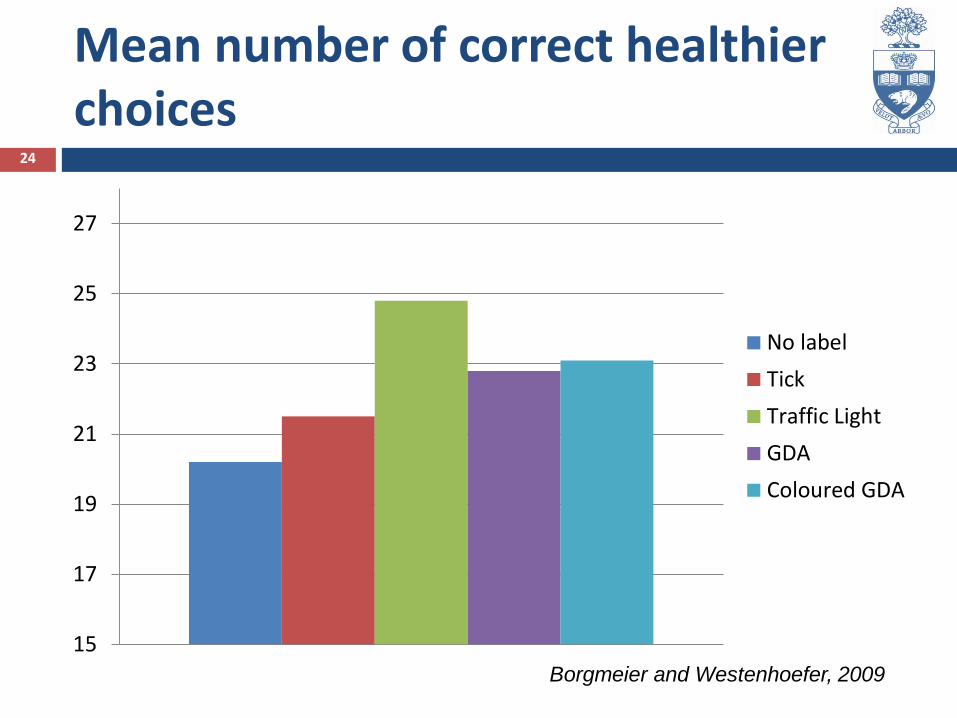
No label
Tick
Traffic Light
GDA
Coloured GDA
Mean number of correct healthier choices
24
Borgmeier and Westenhoefer, 2009
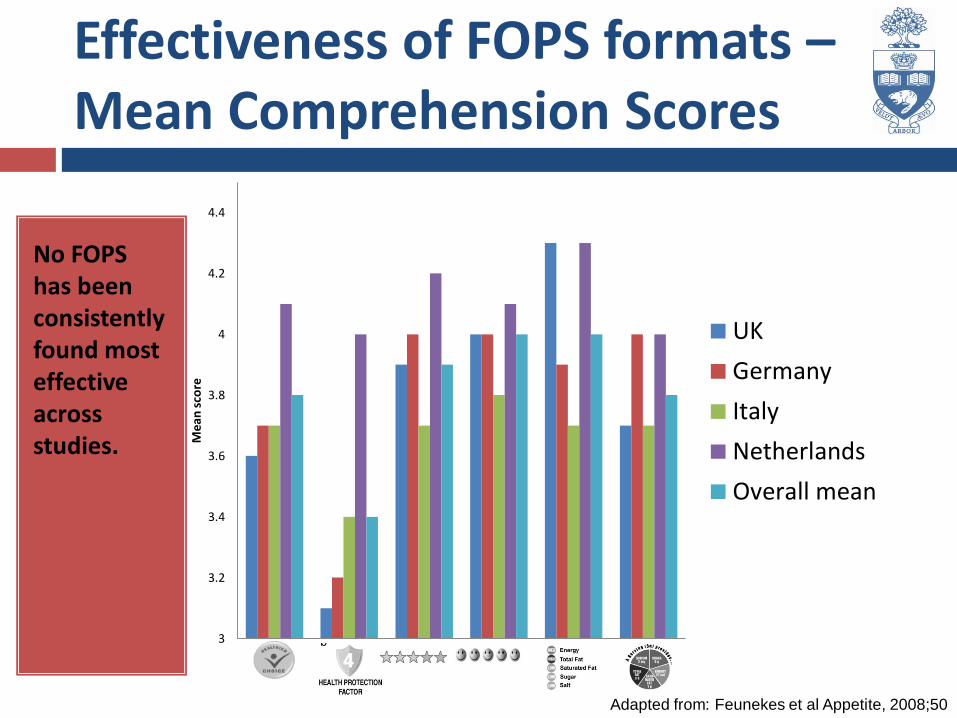
Effectiveness of FOPS formats – Mean Comprehension Scores
No FOPS has been consistently found most effective across studies.
3
3.2
3.4
3.6
3.8
4
4.2
4.4M
ean
sco
re
UK
Germany
Italy
Netherlands
Overall mean
Adapted from: Feunekes et al Appetite, 2008;50
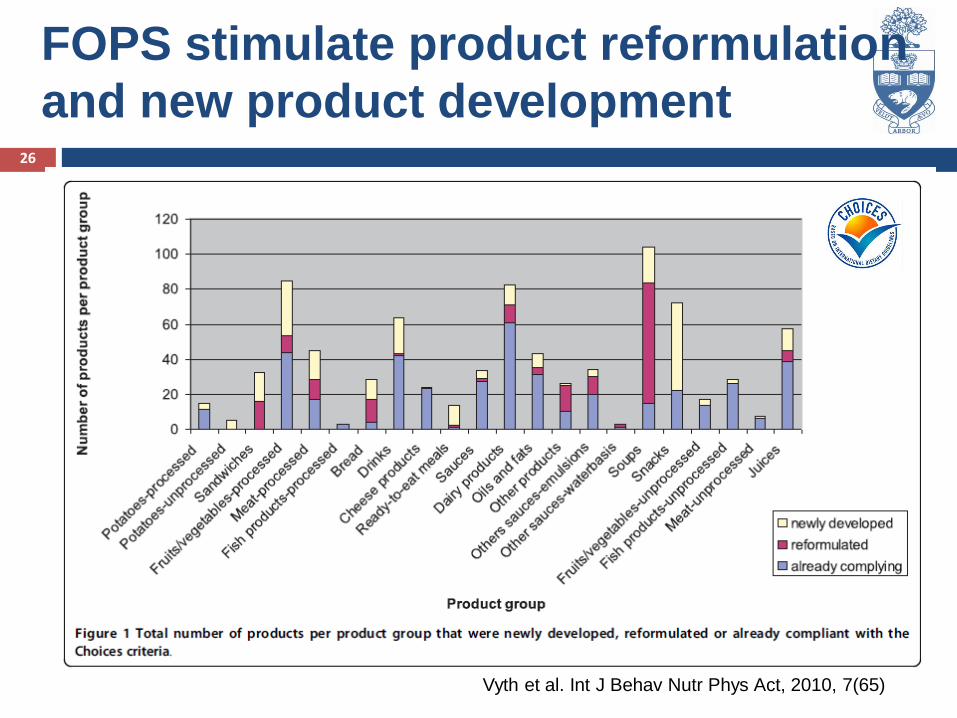
FOPS stimulate product reformulation
and new product development 26
Vyth et al. Int J Behav Nutr Phys Act, 2010, 7(65)
Stimulating healthy product development and reformulation
FOP can drive healthy product development and reformulation by participating manufacturers1-3
Healthfulness of products with FOP systems vs.
those without
Healthier in comprehensive systems4
Voluntary unregulated systems?
1. Young & Swinburn. Health Promotion International 2002;17(1):13-19; 2. Williams et al. Health Promotion International
2003;18(1):51-56; 3. Vyth et al. Int J Behav Nutr Phys Act 2010;7; 4. Sutherland et al. The American Journal of Clinical
Nutrition, 2010:91(4):1090S.

Thank You ! Mary R. L’Abbe, PhD
Department of Nutritional Sciences
Faculty of Medicine, University of Toronto
FitzGerald Building, 150 College Street
Toronto, ON, Canada M5S 3E2
Acknowledgements