Embed Size (px)
Citation preview
1. WHAT IS CPT?A CPT is carried out by pushing a calibrated conevertically into the ground and measuring the forcesapplied on its conical tip, the friction on the sides of thecone and, if using a piezocone, the penetration porewater pressure.
2. HISTORYProbing with a cone attached to rods for the evaluationof the stratum and strength of the ground has beenpractised since about 1917. In 1932 the CPT asrecognised today was developed in the Netherlandswith an outer casing through which an inner rod couldfreely move. At the base of the rod a 10 cm2 cone witha 60o apex angle was attached and the outer pipe andinner rod pushed down.
3. EVOLUTIONIn 1948 the basic mechanical cone was developed(Figure 1) and this cone is still in use today as the
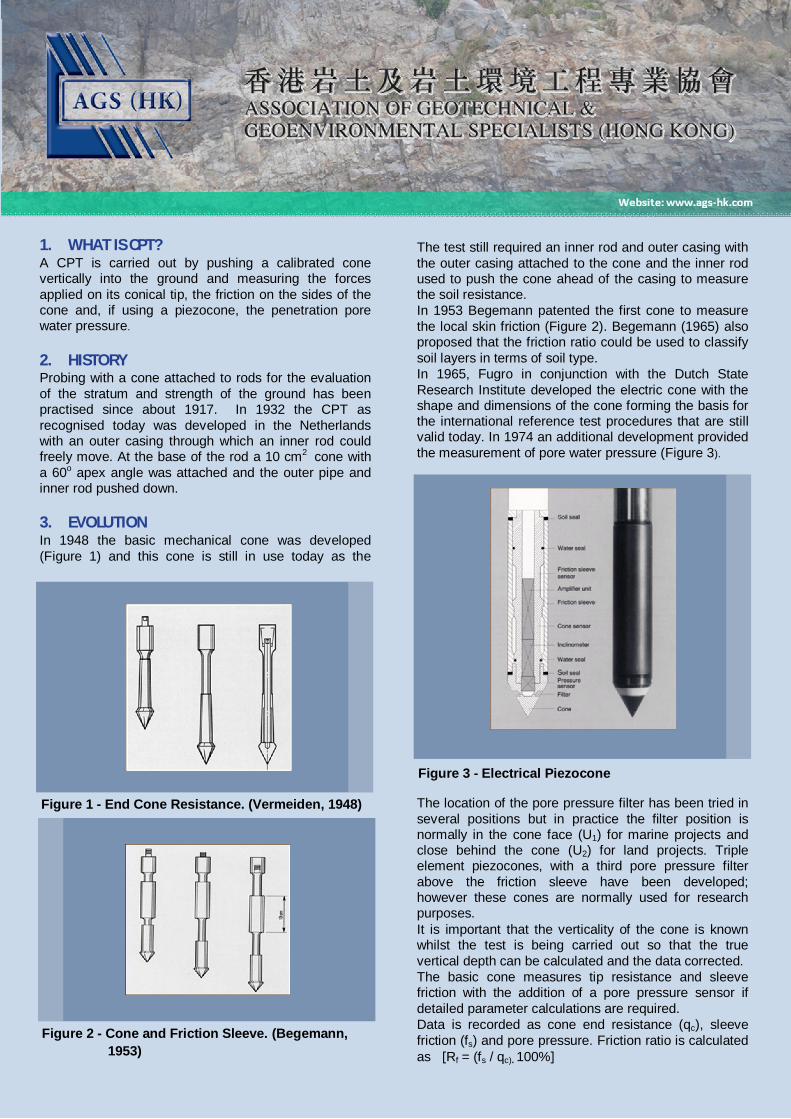
The test still required an inner rod and outer casing withthe outer casing attached to the cone and the inner rodused to push the cone ahead of the casing to measurethe soil resistance.In 1953 Begemann patented the first cone to measurethe local skin friction (Figure 2). Begemann (1965) alsoproposed that the friction ratio could be used to classifysoil layers in terms of soil type.In 1965, Fugro in conjunction with the Dutch StateResearch Institute developed the electric cone with theshape and dimensions of the cone forming the basis forthe international reference test procedures that are stillvalid today. In 1974 an additional development providedthe measurement of pore water pressure (Figure 3).
Figure 1 - End Cone Resistance. (Vermeiden, 1948)
Figure 2 - Cone and Friction Sleeve. (Begemann,1953)
Figure 3 - Electrical Piezocone
The location of the pore pressure filter has been tried inseveral positions but in practice the filter position isnormally in the cone face (U1) for marine projects andclose behind the cone (U2) for land projects. Tripleelement piezocones, with a third pore pressure filterabove the friction sleeve have been developed;however these cones are normally used for researchpurposes.It is important that the verticality of the cone is knownwhilst the test is being carried out so that the truevertical depth can be calculated and the data corrected.The basic cone measures tip resistance and sleevefriction with the addition of a pore pressure sensor ifdetailed parameter calculations are required.Data is recorded as cone end resistance (qc), sleevefriction (fs) and pore pressure. Friction ratio is calculatedas [Rf = (fs / qc). 100%]
Special ConesIn addition to the basic cone measurements manyadditional parameters are now routinely measured withspecialist cones, including:· Seismic Cone - Dynamic Properties by measurement
of P and S wave velocities to obtain low strain shearmodulus.
· Pressuremeter Cone – Stiffness measurement bymeasurement of probe expansion versus pressure toobtain shear strength and modulus.
· Electrical Conductivity - Electrical conductivity ofthe ground for pipeline corrosion assessment anddetection of saline ground water.
· Magnetometer Cone – Measurement in changes ofthe ground magnetic field for detection of UXO orbase of sheet pile walls.
· T Bar and Ball Cones – Mainly used offshore forprofiling strength of very soft clays and silts forpipeline design.
· Temperature Cone - Measurement of Insitu groundtemperature often used for measurement of landfilltemperatures.
· Thermal Conductivity Cone - Insitu measurement ofthe grounds temperature conductivity for design ofburied power cables.
· Vibration Cone – Measurement of vibration from pil-ing activities to monitor sensitive undergroundstructures.
· Natural Gamma Cone - Measurement of NaturalRadiation within the ground, especially useful fordetecting Chalk interface.
· Laser Induced Fluorescence Cone - Use of opticallaser light for screening of hydrocarbon derivedcontamination of soil and water.
· Membrane Interface Cone - Uses a range of sensorsto detect contamination by organic compounds withinthe ground.
· XRF Cone - Use of X – Ray fluorescence to detectmetal contaminates within the ground.
· HPT Cone - Hydraulic profiling tool for the continu-ous logging of relative hydraulic conductivity.
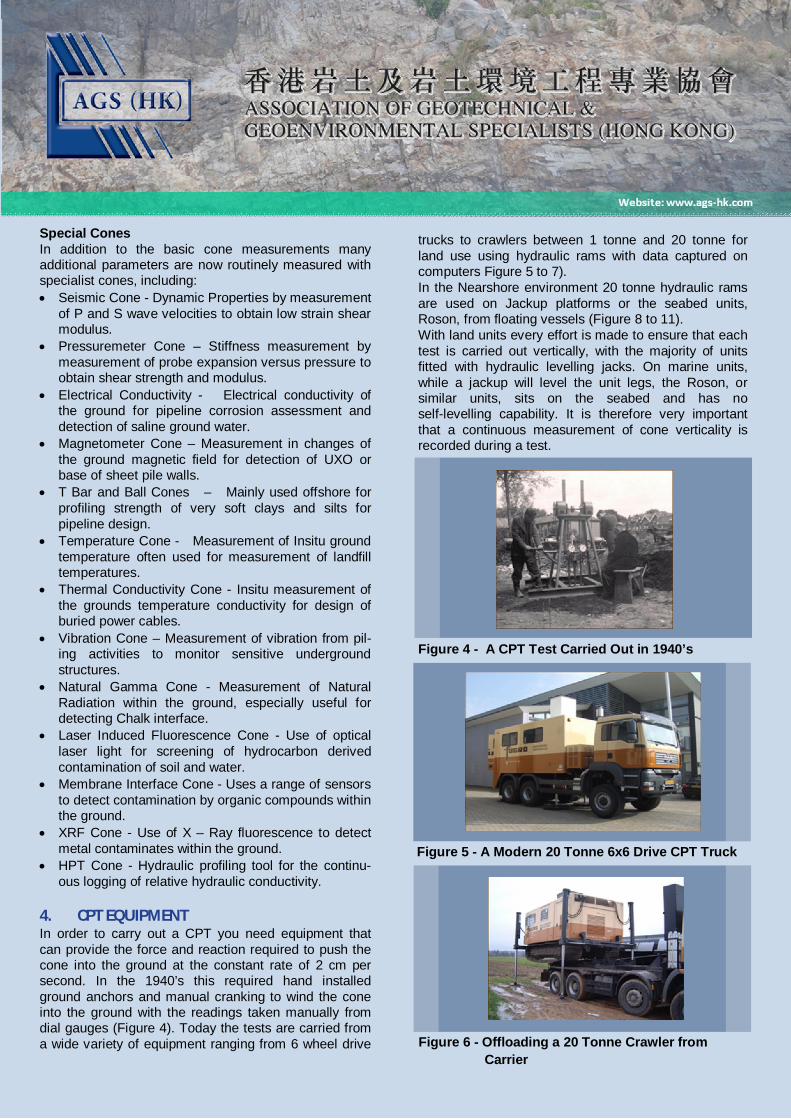
4. CPT EQUIPMENTIn order to carry out a CPT you need equipment thatcan provide the force and reaction required to push thecone into the ground at the constant rate of 2 cm persecond. In the 1940’s this required hand installedground anchors and manual cranking to wind the coneinto the ground with the readings taken manually fromdial gauges (Figure 4). Today the tests are carried froma wide variety of equipment ranging from 6 wheel drive
Figure 4 - A CPT Test Carried Out in 1940’s
Figure 5 - A Modern 20 Tonne 6x6 Drive CPT Truck
trucks to crawlers between 1 tonne and 20 tonne forland use using hydraulic rams with data captured oncomputers Figure 5 to 7).In the Nearshore environment 20 tonne hydraulic ramsare used on Jackup platforms or the seabed units,Roson, from floating vessels (Figure 8 to 11).With land units every effort is made to ensure that eachtest is carried out vertically, with the majority of unitsfitted with hydraulic levelling jacks. On marine units,while a jackup will level the unit legs, the Roson, orsimilar units, sits on the seabed and has noself-levelling capability. It is therefore very importantthat a continuous measurement of cone verticality isrecorded during a test.
Figure 6 - Offloading a 20 Tonne Crawler fromCarrier
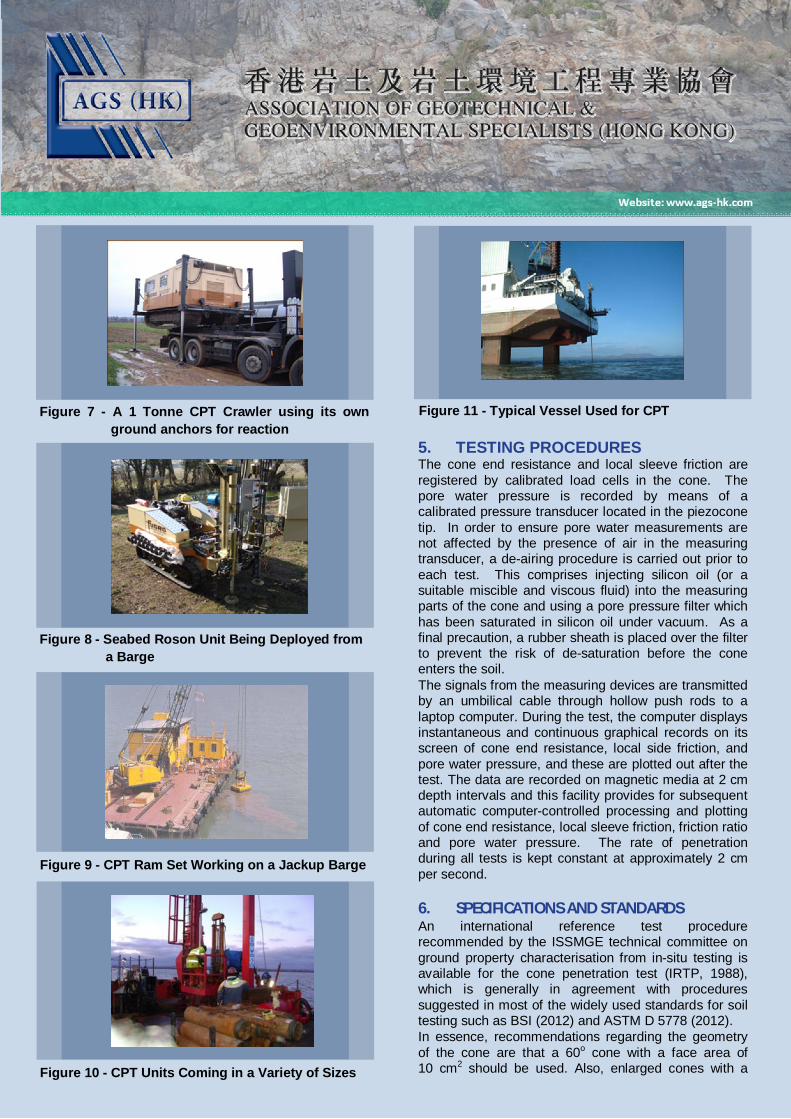
Figure 7 - A 1 Tonne CPT Crawler using its ownground anchors for reaction
Figure 8 - Seabed Roson Unit Being Deployed froma Barge
5. TESTING PROCEDURESThe cone end resistance and local sleeve friction areregistered by calibrated load cells in the cone. Thepore water pressure is recorded by means of acalibrated pressure transducer located in the piezoconetip. In order to ensure pore water measurements arenot affected by the presence of air in the measuringtransducer, a de-airing procedure is carried out prior toeach test. This comprises injecting silicon oil (or asuitable miscible and viscous fluid) into the measuringparts of the cone and using a pore pressure filter whichhas been saturated in silicon oil under vacuum. As afinal precaution, a rubber sheath is placed over the filterto prevent the risk of de-saturation before the coneenters the soil.The signals from the measuring devices are transmittedby an umbilical cable through hollow push rods to alaptop computer. During the test, the computer displaysinstantaneous and continuous graphical records on itsscreen of cone end resistance, local side friction, andpore water pressure, and these are plotted out after thetest. The data are recorded on magnetic media at 2 cmdepth intervals and this facility provides for subsequentautomatic computer-controlled processing and plottingof cone end resistance, local sleeve friction, friction ratioand pore water pressure. The rate of penetrationduring all tests is kept constant at approximately 2 cmper second.
6. SPECIFICATIONS AND STANDARDSAn international reference test procedurerecommended by the ISSMGE technical committee onground property characterisation from in-situ testing isavailable for the cone penetration test (IRTP, 1988),which is generally in agreement with proceduressuggested in most of the widely used standards for soiltesting such as BSI (2012) and ASTM D 5778 (2012).In essence, recommendations regarding the geometryof the cone are that a 60o cone with a face area of10 cm2 should be used. Also, enlarged cones with a
Figure 9 - CPT Ram Set Working on a Jackup Barge
Figure 10 - CPT Units Coming in a Variety of Sizes
Figure 11 - Typical Vessel Used for CPT
Additional interpretation using pore water pressure(pwp) readings from the piezocone (CPTu)
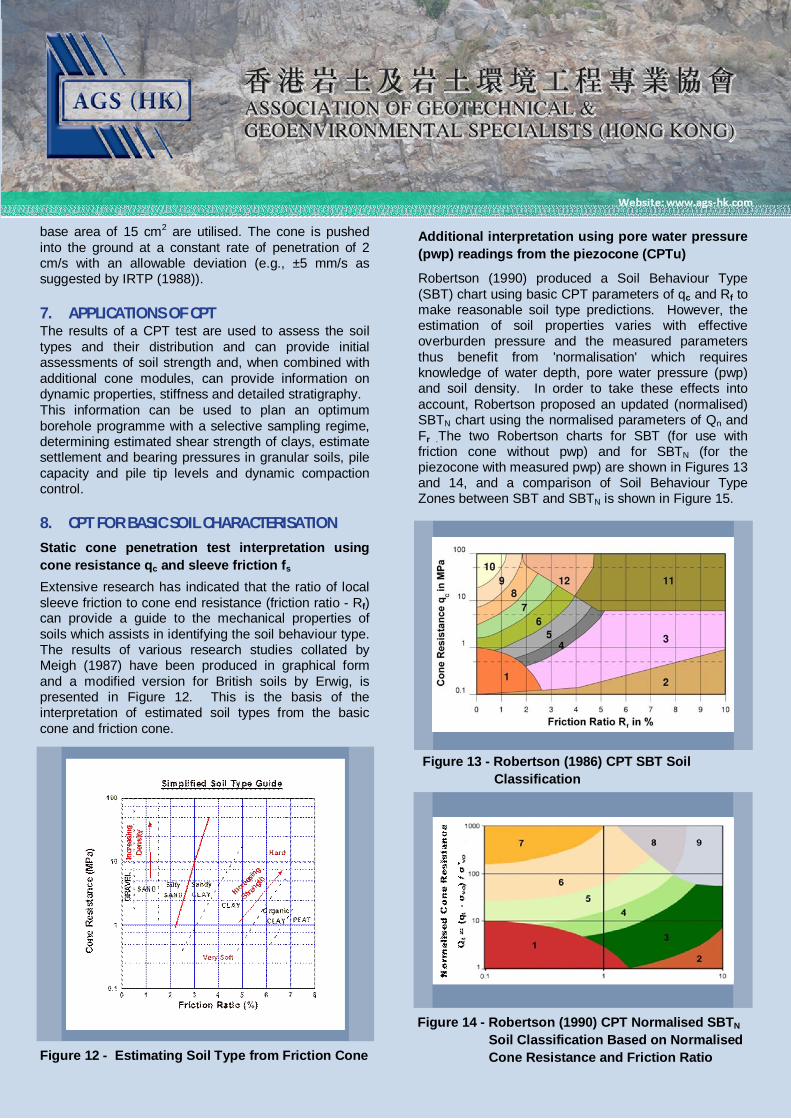
Robertson (1990) produced a Soil Behaviour Type(SBT) chart using basic CPT parameters of qc and Rf tomake reasonable soil type predictions. However, theestimation of soil properties varies with effectiveoverburden pressure and the measured parametersthus benefit from 'normalisation' which requiresknowledge of water depth, pore water pressure (pwp)and soil density. In order to take these effects intoaccount, Robertson proposed an updated (normalised)SBTN chart using the normalised parameters of Qn andFr .The two Robertson charts for SBT (for use withfriction cone without pwp) and for SBTN (for thepiezocone with measured pwp) are shown in Figures 13and 14, and a comparison of Soil Behaviour TypeZones between SBT and SBTN is shown in Figure 15.
Figure 12 - Estimating Soil Type from Friction Cone
Figure 13 - Robertson (1986) CPT SBT SoilClassification
base area of 15 cm2 are utilised. The cone is pushedinto the ground at a constant rate of penetration of 2cm/s with an allowable deviation (e.g., ±5 mm/s assuggested by IRTP (1988)).
7. APPLICATIONS OF CPTThe results of a CPT test are used to assess the soiltypes and their distribution and can provide initialassessments of soil strength and, when combined withadditional cone modules, can provide information ondynamic properties, stiffness and detailed stratigraphy.This information can be used to plan an optimumborehole programme with a selective sampling regime,determining estimated shear strength of clays, estimatesettlement and bearing pressures in granular soils, pilecapacity and pile tip levels and dynamic compactioncontrol.
8. CPT FOR BASIC SOIL CHARACTERISATIONStatic cone penetration test interpretation usingcone resistance qc and sleeve friction fs
Extensive research has indicated that the ratio of localsleeve friction to cone end resistance (friction ratio - Rf)can provide a guide to the mechanical properties ofsoils which assists in identifying the soil behaviour type.The results of various research studies collated byMeigh (1987) have been produced in graphical formand a modified version for British soils by Erwig, ispresented in Figure 12. This is the basis of theinterpretation of estimated soil types from the basiccone and friction cone.
Figure 14 - Robertson (1990) CPT Normalised SBTN
Soil Classification Based on NormalisedCone Resistance and Friction Ratio
9. CPT AS METHOD OF ACCEPTANCE TESTINGFOR RECLAMATION FILLThere are currently three popular deep compactiontechniques to densify granular soil, namely, dynamiccompaction, resonance compaction and vibroflotation(or vibrocompaction). Vibroflotation is the most widelyused deep compaction technique in Hong Kongattributed to fact that there have been severalsuccessful cases in recent years. Vibroflotation, asits name suggests, is a process to float the soils byvibration to enable them to become arranged in adenser state.Quality control for the deep compaction is usuallybased on results of continuous Piezocone tests andsurface settlement. CPTs overcome the fact that it isdifficult to obtain undisturbed samples of sand fortesting and it is also very difficult to measure in situdensity directly.
10. CORRELATION OF UNDRAINED SHEARSTRENGTH
Correlations of the undrained shear strength cu with thecone resistance qc have been made for many years.The undrained shear strength cu of a fine-grainedcohesive soil (clay) depends on a number of factorsrelated to material composition, anisotropy, strain ratesand directions and stress history amongst others.
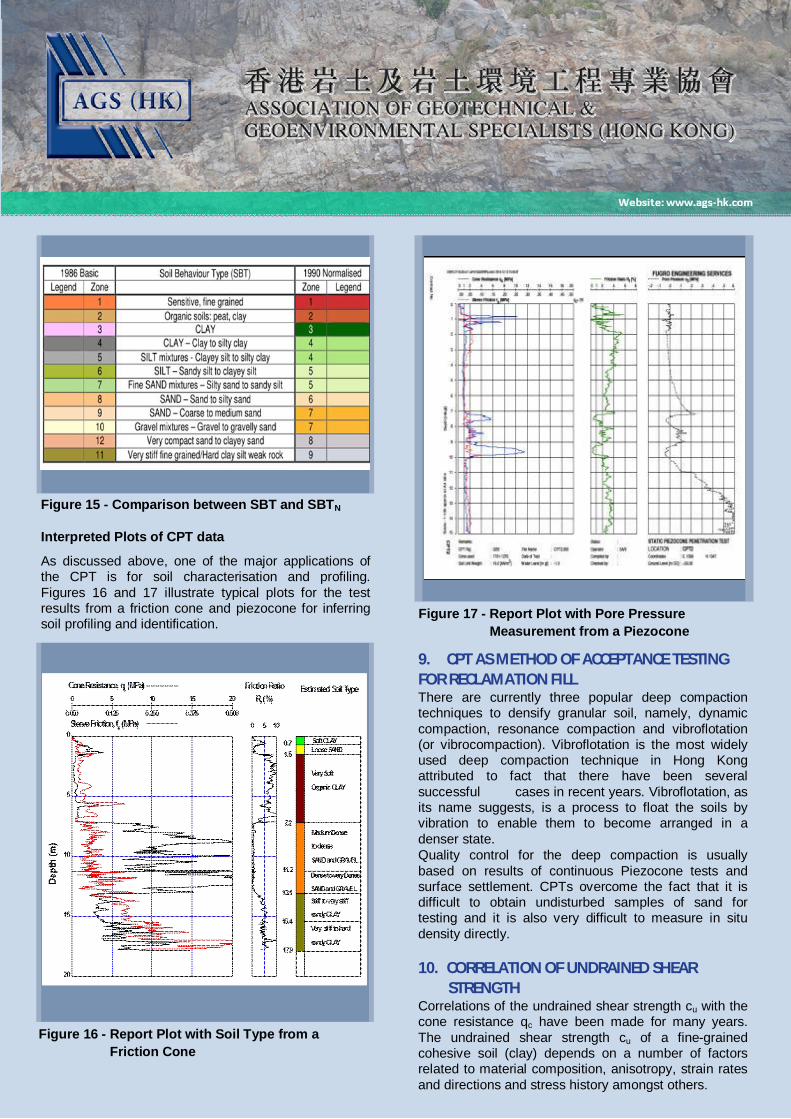
Figure 15 - Comparison between SBT and SBTN
Figure 17 - Report Plot with Pore PressureMeasurement from a Piezocone
Interpreted Plots of CPT data
As discussed above, one of the major applications ofthe CPT is for soil characterisation and profiling.Figures 16 and 17 illustrate typical plots for the testresults from a friction cone and piezocone for inferringsoil profiling and identification.
Figure 16 - Report Plot with Soil Type from aFriction Cone
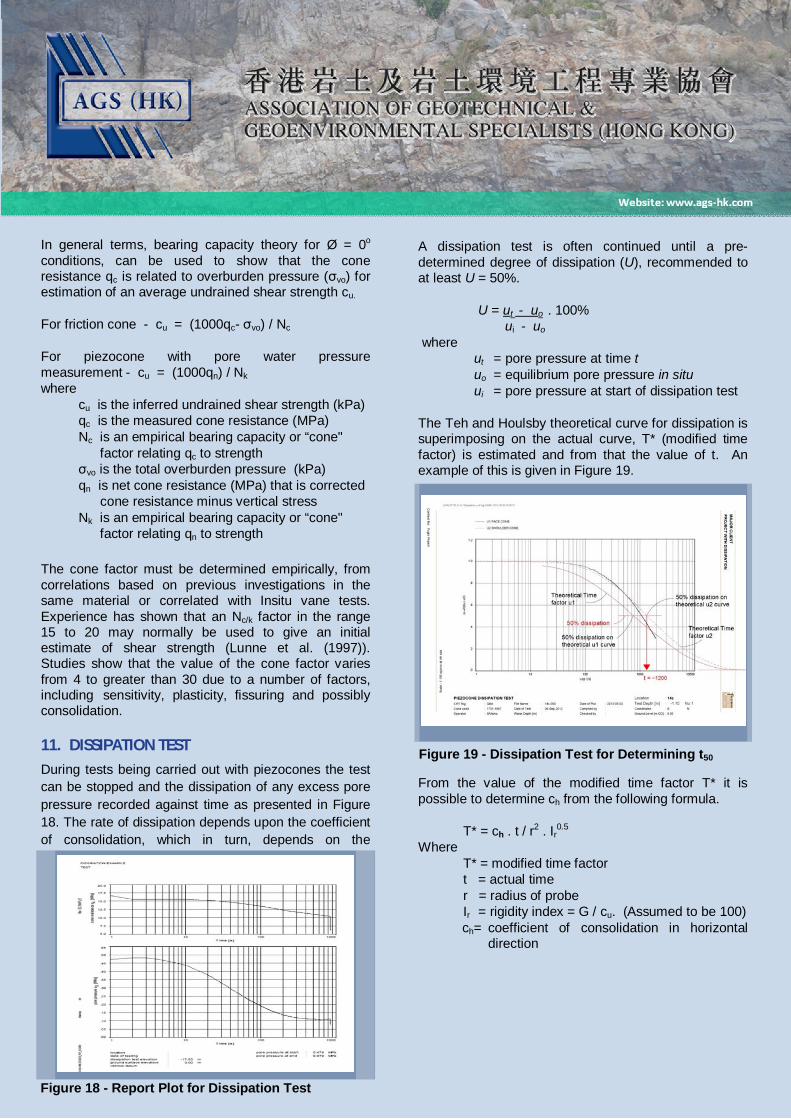
A dissipation test is often continued until a pre-determined degree of dissipation (U), recommended toat least U = 50%.
U = ut - uo . 100%ui - uo
whereut = pore pressure at time t
uo = equilibrium pore pressure in situ ui = pore pressure at start of dissipation test
The Teh and Houlsby theoretical curve for dissipation issuperimposing on the actual curve, T* (modified timefactor) is estimated and from that the value of t. Anexample of this is given in Figure 19.
In general terms, bearing capacity theory for Ø = 0o
conditions, can be used to show that the coneresistance qc is related to overburden pressure (σvo) forestimation of an average undrained shear strength cu.
For friction cone - cu = (1000qc- σvo) / Nc
For piezocone with pore water pressuremeasurement - cu = (1000qn) / Nkwhere
cu is the inferred undrained shear strength (kPa)qc is the measured cone resistance (MPa)Nc is an empirical bearing capacity or “cone"
factor relating qc to strengthσvo is the total overburden pressure (kPa)qn is net cone resistance (MPa) that is corrected
cone resistance minus vertical stressNk is an empirical bearing capacity or “cone"
factor relating qn to strength
The cone factor must be determined empirically, fromcorrelations based on previous investigations in thesame material or correlated with Insitu vane tests.Experience has shown that an Nc/k factor in the range15 to 20 may normally be used to give an initialestimate of shear strength (Lunne et al. (1997)).Studies show that the value of the cone factor variesfrom 4 to greater than 30 due to a number of factors,including sensitivity, plasticity, fissuring and possiblyconsolidation.
11. DISSIPATION TESTDuring tests being carried out with piezocones the testcan be stopped and the dissipation of any excess porepressure recorded against time as presented in Figure18. The rate of dissipation depends upon the coefficientof consolidation, which in turn, depends on the
Figure 18 - Report Plot for Dissipation Test
Figure 19 - Dissipation Test for Determining t50
From the value of the modified time factor T* it ispossible to determine ch from the following formula.
T* = ch . t / r2 . Ir0.5
WhereT* = modified time factor
t = actual timer = radius of probeIr = rigidity index = G / cu. (Assumed to be 100)ch= coefficient of consolidation in horizontal
direction
13. REFERENCESASTM D5778-12, (2012). Standard Test Method forPerforming Electronic Friction Cone and PiezoconePenetration Testing of Soils, ASTM International.
BSI, (2012). Geotechnical Investigation and Testing –Field Testing, Part 1: Electrical Cone and PiezoconePenetration Test (BS EN ISO 22476-1:2012), BritishStandards Institution, London, 46 pp.
IRTP, (1999). Technical Committee TC16, ISSMGE,“International Reference Test Procedure for ConePenetration Test (CPT) and the Cone Penetration Testwith Pore Pressure (CPTU)”, Proc., the XIIth ECSMGE,Amsterdam, Balkema, 2195-2222.
Lunne, T., Robertson, P.K., and Powell, J.J.M. (1997).Cone Penetration Testing in Geotechnical Practice.Blackie Academic/Routledge Publication, New York,312 pp.
Meigh. A. C. (1987). CIRIA Ground Engineering Report:In situ testing. Cone Penetration Testing, Methods andInterpretation.
Robertson, P. K., (1990). Soil Classification Using CPT:Canadian Geotechnical Journal. Vol.27, No. 1,pp151-158.
Robertson P. K and Cable (Robertson) K.L., (2012).Guide to cone Penetration Testing for GeotechnicalEngineering, Gregg Drilling and Testing Inc., 5Th
Edition.
ABBREVIATION AND SYMBOLS
Standard Cone Measurements and Factors
pwp Pore water pressure
qc Measured cone end resistance (MPa)
qt Total cone end resistance corrected for pwpeffect where qt = (1-α) . (U0 + β (U2-U0))
qn Net cone end resistance (MPa) where qn= qt-σvo
fs Sleeve friction
α Cone shaft face to face ratio
β value of excessive pwp cone ratio- 0.8 for theface (U1) and 1.0 on the shoulder (U2)
Rf Friction ratio of sleeve friction (fs) to measuredcone end resistance (qc)
SBT Soil Bar Type
Uo Theoretical hydrostatic pwp relative to groundlevel acting on cone.
U1 Measured pwp at cone face elevation
U2 Measured pwp at cone shoulder
Normalised Parameters for overburden Pressures
Fr Friction Ratio= fs / (qt- σvo)
SBTN Soil Bar Type
Pressures
σvo Total overburden pressure relative to ground(kPa)