Embed Size (px)
Citation preview

1
Weighted Partonomy-Taxonomy Trees with Local Similarity Measures for Semantic Buyer-Seller Matchmaking
By: Lu Yang
March 16, 2005

2
Outline
Motivation Similarity Measures Partonomy Similarity Algorithm
– Tree representation– Tree simplicity– Partonomy similarity
Experimental Results Node Label Similarity
– Inner-node similarity– Leaf-node similarity
Conclusion
3
Motivation
– Keywords/keyphrases– Trees
e-business, e-learning … Buyer-Seller matching Metadata for buyers and sellers
Tree similarity

4
Similarity measures
Similarity measures apply to many research areas
– CBR (Case Based Reasoning), information retrieval, pattern recognition, image analysis and processing, NLP (Natural Language Processing), bioinformatics, search engine, e-Commerce and so on
In e-Commerce– Product P satisfies demand D ?
Is it an “All or Nothing” question? Additional knowledge needed Bridge the gap between demand and product descriptions
Now, a “How similar?” question!

5
Numerical modeling of similarity– A similarity measure on a set M is a real function
sim: M2 [0,1] – Similarity measures have following properties
Reflexivity x M: sim(x,x) = 1
Symmetry iff x,yM: sim(x,y) = sim(y,x)
Similarity measures (Cont’d)

6
An opposite notion of similarity measures A distance measure on a set M is a real valued
function d: M2 IR+
Distance measures have following properties
– Reflexivity xM d(x,x) = 0
– Symmetry iff x, yM d(x,y) = d(y,x)
– Triangle Inequality
iff x, yM d(x,y) = 0 x = y
x, y, zM d(x,y) + d(y,z) d(x,z)
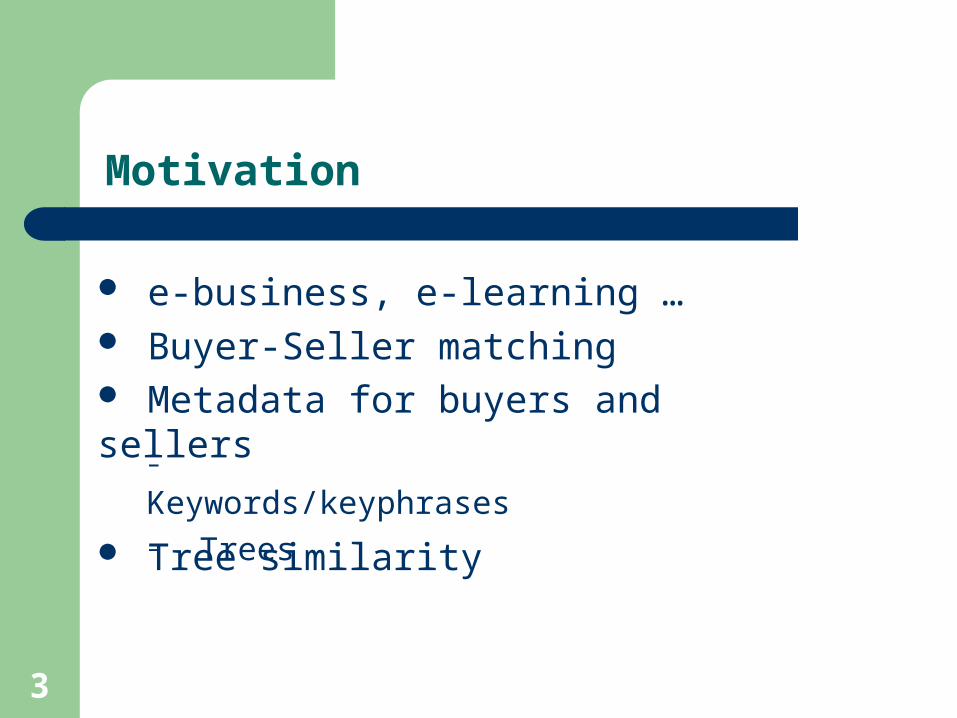
Similarity measures – distance measures
7
Transformation of similarity measures and distance measures– If a bijective, order inverting mapping f: [0,1] [0,1]
exists with
f(d(x,y)) = sim(x,y)
then sim and d are compatible
Similarity measures – distance measures

8
Global measures are defined on the whole object– reflect the task and have a pragmatic character
Local measures are defined on details (e.g. the domains of some attribute)– reflect technical and domain character– task independent
Similarity measures – global and local

9
Local to global– each object A is constructed from so-called
“components” Ai by some construction process
C(Ai |i n) = A
given two objects A and B, simi(Ai, Bi) denotes
the similarity of their ith components– amalgamation function f
sim(A, B) is the global similarity measure of A and B
sim(A, B) = f(simi(Ai , Bi) |i n )
Similarity measures – global and local

10
Tree representation
Characterises of our trees – Node-labled, arc-labled and arc-weighted– Arcs are labled in lexicographical order– Weights sum to 1
0.3
0.2
0.5Make
Model
Year
2002
Car
Ford Explorer

11
Tree representation – serialization of trees
– XML attributes for arc weights and subelements for
arc labels
– Weighted Object-Oriented RuleML
<Cterm>
<Ctor>Car</Ctor>
<slot weight="0.3"><Ind>Make</Ind><Ind>Ford</Ind></slot>
<slot weight="0.2"><Ind>Model</Ind><Ind>Explorer</Ind></slot>
<slot weight="0.5"><Ind>Year</Ind><Ind>2002</Ind></slot>
</Cterm>
Tree serialization in WOO RuleML

12
Tree representation – Relfun version of tree
cterm[ -opc[ctor[car]],
-r[n[make],w[0.3]][ind[ford]],
-r[n[model],w[0.2]][ind[explorer],
-r[n[year],w[0.5]][ind[2002]]
]
13
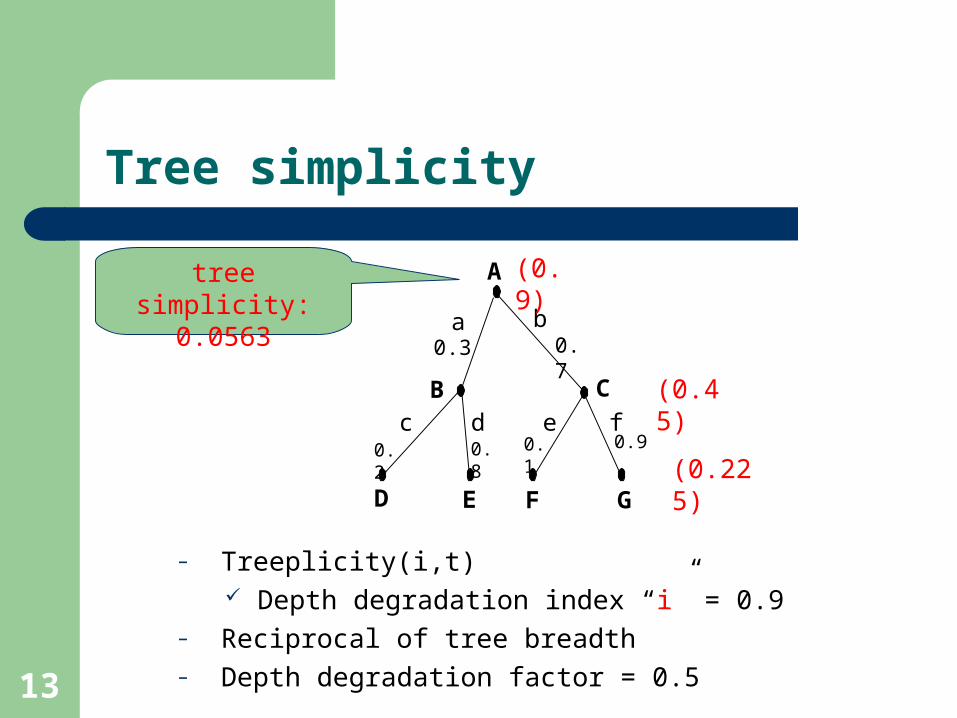
Tree simplicity
A
0.1
a
ed0.90.80.2
E
b0.70.3
B C
f
D
c
F G
– Treeplicity(i,t) Depth degradation index “i” = 0.9
– Reciprocal of tree breadth– Depth degradation factor = 0.5
(0.9)
(0.45)
(0.225)
tree simplicity: 0.0563
14
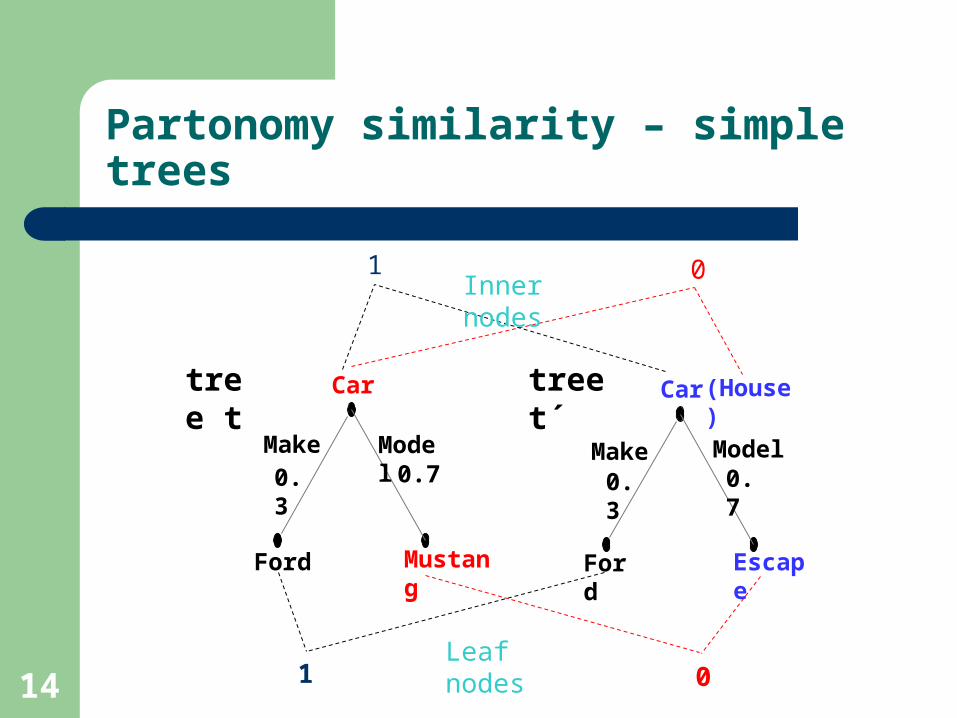
Partonomy similarity – simple trees
Escape
Car
Make Model
Ford
0.3 0.7
Mustang
Car
Make Model
Ford
0.3 0.7
tree t tree t´ (House)
01Inner nodes
01Leaf nodes

15
Partonomy similarity – complex trees
(si (wi + w'i)/2)
(A(si)(wi + w'i)/2)
A(si) ≥ si
lom
educational
0.5
general
format platform0.50.50.5
Introduction to Oracle
t t´
technical0.3334 0.33330.3333
edu-set gen-set tec-set
language
en
title
HTML WinXP
lom
0.1
general
format platform0.90.80.2
Basic Oracle
technical0.70.3
gen-set tec-setlanguage
en
title
* WinXP
* : Don’t Care

16
Partonomy similarity – main recursive functions
– Treesim(t,t'): Recursively compares any (unordered) pair of trees
Paremeters N and i
Three main recursive functions (Relfun)
– Treemap(l,l'): Recursively maps two lists, l and l', of labeled
and weighted arcs: descends into identical–labeled subtrees
– Treeplicity(i,t): Decreases the similarity with decreasing simplicity

17
Experimental results – simple trees
auto
0.5make
2002ford
year0.5
auto
0.5make
1998chrysler
year0.5
auto
0.0make
2002ford
year1.0
auto
1.0make
1998ford
year0.0
t1 t2
auto
0.0make
2002ford
year1.0
auto
1.0make
2002ford
year0.0
t3 t4
Experiments Tree Tree Results
1
2
0.1
0.55
1.0
t1 t2

18
Experimental results – simple trees (cont’d)
Experiments Tree Tree Results
3
0.1
make
auto
mustang
auto
0.45model
2000ford
year
t1 t2
1.0model 0.45
explorer
0.9
make
auto
mustang
auto
0.05model
2000ford
year
t3 t4
1.0model 0.05
explorer
0.2823
0.1203

19
Experimental results – identical tree structures
Experiments Tree Tree Results
4
0.2make
auto
0.3
1999ford
year
t2
model0.5
explorer
make
auto
1999ford
year
t4
model
explorer
0.33330.33330.3334
0.2
make
auto
0.3
2002ford
year
t1
model 0.5
explorer
make
2002ford
year
t3
model
explorer
0.33330.33330.3334
auto
0.55
0.7000

20
b2
Experimental results – complex trees
0.33340.333
3
b1
1.00.25 0.25 0.25
0.33340.3333
1.00.3333 0.333
3
0.3334
c2
0.3333
0.25 c3c1
c2
c
b3
A
B C D
b d
b1b4
c1 c3 d1
B1 B4 C1 C3 D1 B2 B3
c4
c
A
B C D
b d
d1
B1
C1 C4C3 D1
0.3334
0.3333
0.50.5
0.3333
0.3333
E F
t t´
0.8160 0.9316 0.8996 0.9230 0.9647 0.9793

21
b2
Experimental results – complex trees
0.33340.333
3
b1
1.00.25 0.25 0.25
0.33340.3333
1.00.3333 0.333
3
0.3334
c2
0.3333
0.25 c3c1
c2
c
b3
A
B C D
b d
b1b4
c1 c3 d1
B1 B4 C1 C3 D1 B2 B3
c4
c
A
B C D
b d
d1
B1
C1 C4C3 D1
0.3334
0.3333
0.50.5
0.3333
0.3333
E E F
t t´
0.8555 0.9626 0.9314 0.9499 0.9824 0.9902

22
b2
Experimental results – complex trees
0.33340.333
3
b1
1.00.25 0.25 0.25
0.33340.3333
1.00.3333 0.333
3
0.3334
c2
0.3333
0.25 c3c1
c2
c
b3
A
B C D
b d
b1b4
c1 c3 d1
B1 B4 C1 C3 D1 B2 B3
c4
c
A
B * D
b d
d1
B1
C1 C4C3 D1
0.3334
0.3333
0.50.5
0.3333
0.3333
E F
t t´
0.9134 0.9697 0.9530 0.9641 0.9844 0.9910

23
Node label similarity
For both inner nodes and leaf nodes– Exact string matching binary result 0.0 or 1.0– Permutation of strings
“Java Programming” vs “Programming in Java”
Number of identical words
Maximum length of the two strings
Example 1:
For two node labels “a b c” and “a b d e”, their similarity is:2
4= 0.5

24
Example 2:
Node labels “electric chair” and “committee chair”
Node label similarity (cont’d)
1
2= 0.5 meaningful?
• Semantic similarity

25
Node label similarity – inner nodes vs. leaf nodes
Inner nodes — class-oriented– Inner node labels can be classes– classes are located in a taxonomy tree– taxonomic class similarity measures
Leaf nodes — type-oriented– address, currency, date, price and so on– type similarity measures (local similarity measures)

26
Node label similarity
String Permutation (both inner
and leaf nodes)
Exact String Matching (both inner
and leaf nodes)
Non-Semantic Matching
Taxonomic Class Similarity
(inner
nodes)
Type Similarity (leaf nodes)
Semantic Matching

27
Inner node similarity – partonomy trees
Distributed Programming
Credit
“Introduction to Distributed Programming”
Textbook
TuitionDuration
$8002months3
0.20.1 0.3
0.4
t1 t2
Object-Oriented Programming
Credit
“Objected-Oriented Programming Essentials”
Textbook
TuitionDuration
$10003months3
0.10.5 0.2
0.2
partonomy trees

28
Inner node similarity – taxonomy tree
Programming Techniques
Applicative Programming
0.50.2General
Automatic Programming
Concurrent Programming
Sequential Programming
Object-Oriented Programming
Distributed Programming
Parallel Programming
0.7 0.40.5
0.3
0.3 0.9
• arc weights
• at the same level of a subtree do not need to add up to 1
• assigned by machine learning algorithms or human experts

29
Programming Techniques
Applicative Programming
0.50.2General
Automatic Programming
Concurrent Programming
Sequential Programming
Object-Oriented Programming
Distributed Programming
Parallel Programming
0.7 0.4 0.50.3
0.3 0.9
• red arrows stop at their nearest common ancestor
• the product of subsumption factors on the two paths (0.018)
Inner node similarity – taxonomic class similarity

30
Inner node similarity – separate to encoded taxonomy tree
Separate taxonomy tree– extra taxonomic class similarity measures
How to compute semantic similarity without – changing our partonomy similarity algorithm– losing taxonomic semantic similarity
Encode the (subsections) of taxonomy tree into partonomy trees
Disjoint subsections of taxonomy lead to zero semantic similarity
31
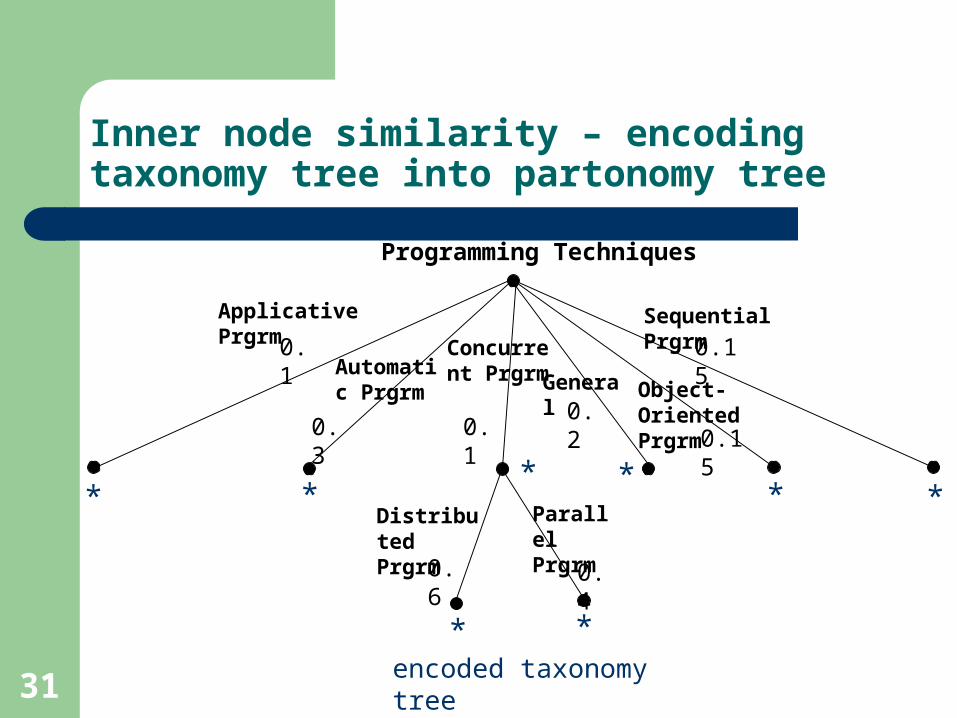
Inner node similarity – encoding taxonomy tree into partonomy tree
Programming Techniques
Applicative Prgrm
0.1
0.1
GeneralAutomatic Prgrm
Concurrent Prgrm
Sequential Prgrm
Object-Oriented Prgrm
Distributed Prgrm
Parallel Prgrm
0.3
0.15
0.40.6
0.20.15
* **
*
* * *
*encoded taxonomy tree

32
Credit TitleTuition
Duration
$8002months30.05 0.1 0.15
0.05
t1
Classification0.65
taxonomy
Object-Oriented Prgrm
$10003months3
0.2 0.05 0.050.05
t2
Classification0.65
taxonomy
Distributed Prgrm
course
Concurrent Prgrm
Parallel Prgrm
0.6 0.4
Object-Oriented Prgrm
0.7 0.3
0.8 0.2
course
1.0
Programming Techniques
1.0*
Distributed Prgrm
Credit TitleTuition
Duration
Programming Techniques
Sequential Prgrm
**
**
**
*Sequential Prgrm
Inner node similarity – encoding taxonomy tree into partonomy tree (cont’d)
encoded partonomy trees

33
Leaf node similarity (local similarity)
0.5
end_date
Nov 3, 2004
0.5
t1 t 2
start_date
May 3, 2004
Project
0.5
end_date
Feb 18, 2005
0.5
start_date
Jan 20, 2004
Project
Example: “date” type leaf nodes
DS(d1, d2) = {
0.0
otherwise
if | d1 – d2 | ≥ 365
1 –| d1 – d2 |
365
0.74

34
Implementation
Relfun version– exact string matching– don’t care
Java version– exact string matching– don’t care– string permutation– encoded taxonomy tree in partonomy tree (Teclantic)– “date” type similarity measure

35
Conclusion
Arc-labeled and arc-weighted trees Partonomy similarity algorithm
– Traverses trees top-down– Computes similarity bottom-up
Node label similarity– Exact string matching (both inner and leaf nodes)– String permutation (both inner and leaf nodes)– Taxonomic class similarity (only inner nodes)
Taxonomy tree Encoding taxonomy tree into partonomy tree
– Type similarity (only leaf nodes) “date” type similarity measures

36
Questions?