Embed Size (px)
Citation preview
1
WATER QUALITY ISSUES
IN INDIA
Dr. R.C. Trivedi
Central Pollution Control Board(Ministry of Environment & Forests)‘Parivesh Bhavan’, East Arjun Nagar
Delhi – 110 032
E-mail : [email protected] : http://www.cpcb.nic.in
2
Water is Precious and scarce Resource
• Only a small fraction (about 3%) is fresh water• India is wettest country in the world, but rainfall is
highly uneven with time and space (with extremely low in Rajasthan and high in North-East)
• On an avergae there are only 40 rainy days• Out of 4000 BCM rainfall received, about 600
BCM is put to use so far• Water resources are over-exploited resulting in
major WQ problems
3
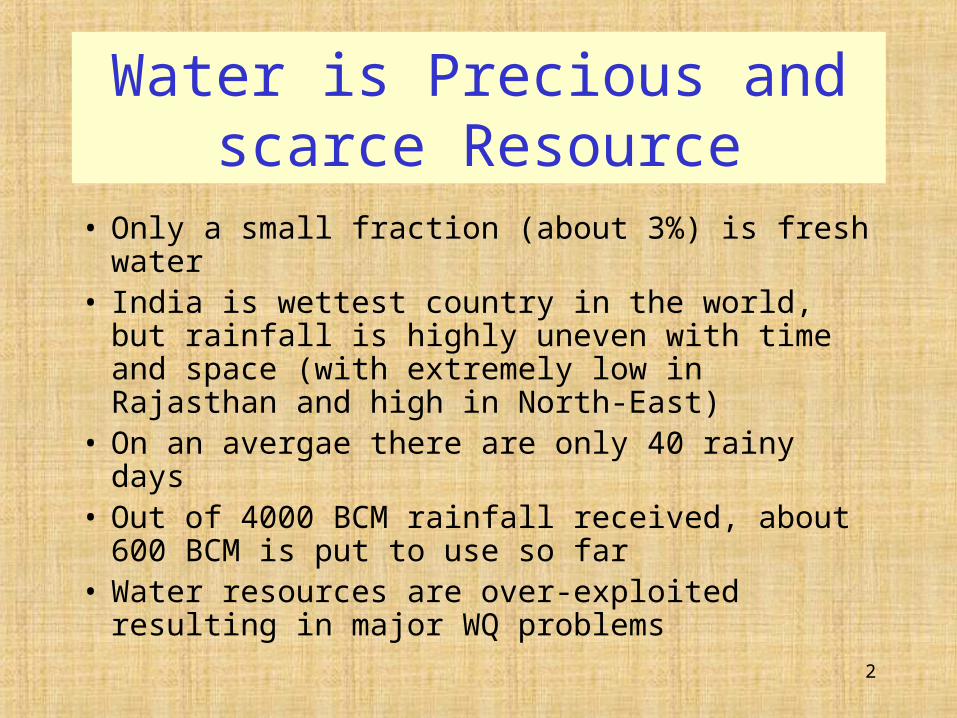
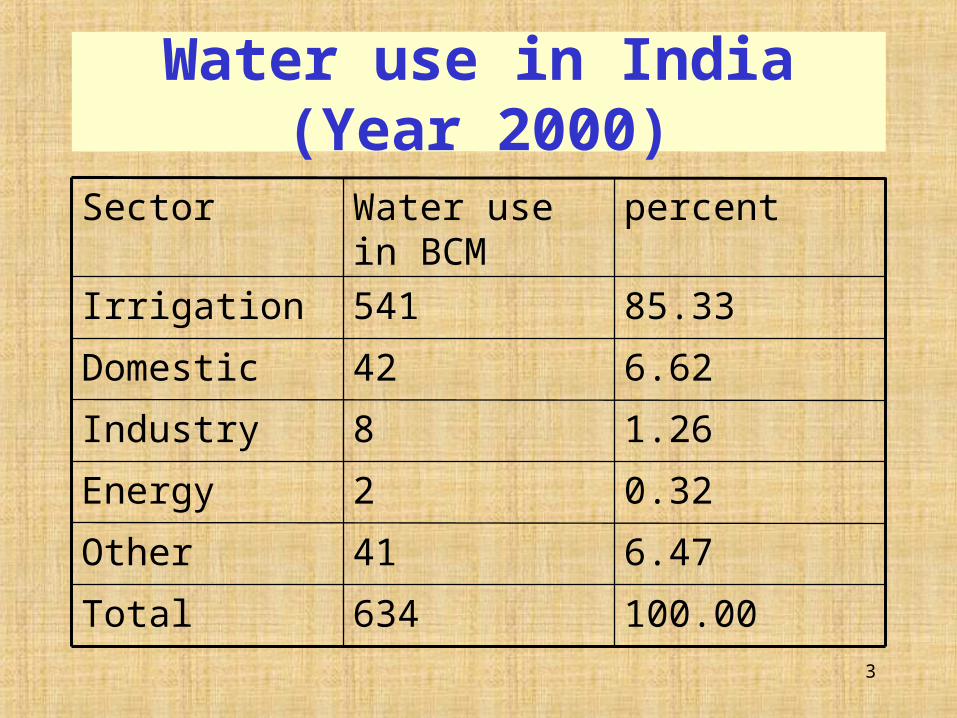
Water use in India (Year 2000)
100.00634Total
6.4741Other
0.322Energy
1.268Industry
6.6242Domestic
85.33541Irrigation
percentWater use in BCM
Sector
4
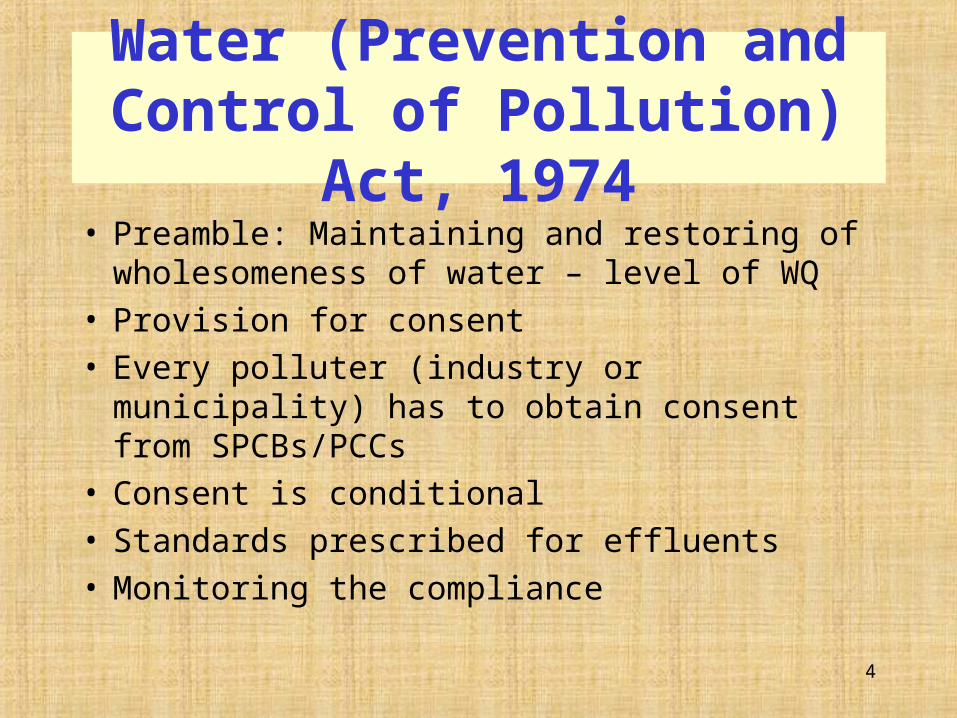
Water (Prevention and Control of Pollution) Act, 1974
• Preamble: Maintaining and restoring of wholesomeness of water – level of WQ
• Provision for consent• Every polluter (industry or municipality) has to
obtain consent from SPCBs/PCCs• Consent is conditional• Standards prescribed for effluents• Monitoring the compliance
5
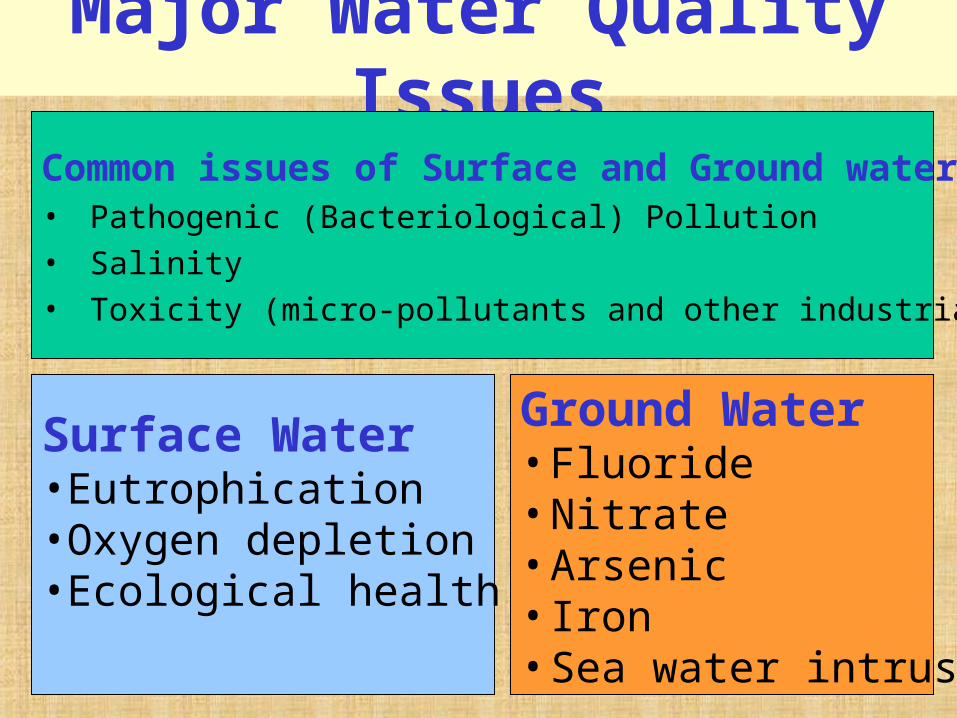
Major Water Quality Issues
Common issues of Surface and Ground water• Pathogenic (Bacteriological) Pollution• Salinity• Toxicity (micro-pollutants and other industrial pollutants)
Surface Water• Eutrophication• Oxygen depletion• Ecological health
Ground Water• Fluoride• Nitrate• Arsenic• Iron• Sea water intrusion
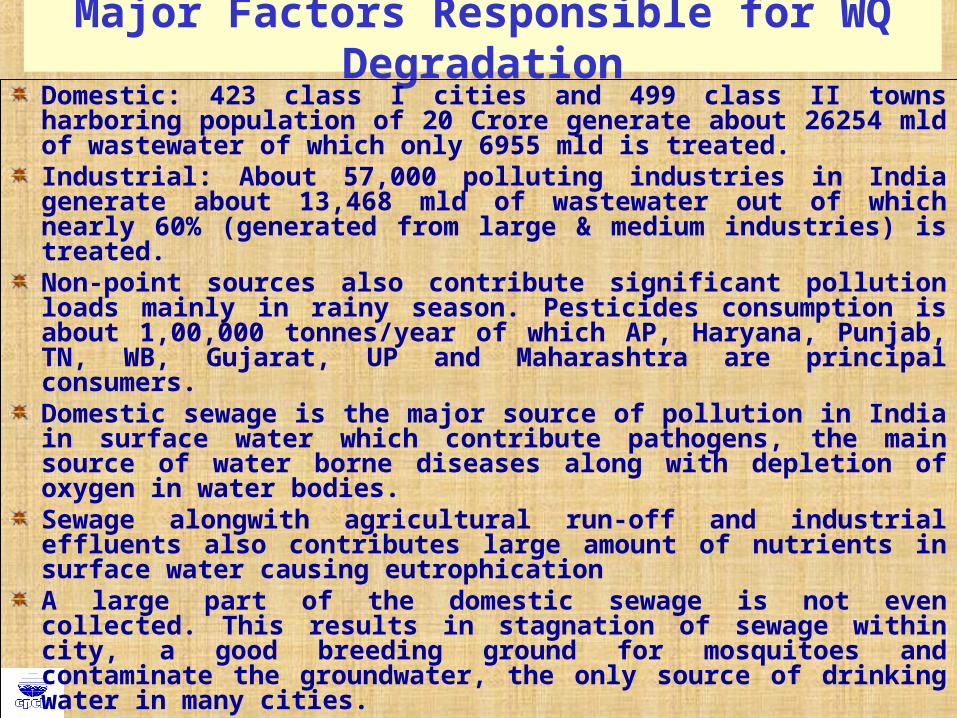
Major Factors Responsible for WQ DegradationDomestic: 423 class I cities and 499 class II towns harboring population of 20 Crore generate about 26254 mld of wastewater of which only 6955 mld is treated.Industrial: About 57,000 polluting industries in India generate about 13,468 mld of wastewater out of which nearly 60% (generated from large & medium industries) is treated. Non-point sources also contribute significant pollution loads mainly in rainy season. Pesticides consumption is about 1,00,000 tonnes/year of which AP, Haryana, Punjab, TN, WB, Gujarat, UP and Maharashtra are principal consumers.Domestic sewage is the major source of pollution in India in surface water which contribute pathogens, the main source of water borne diseases along with depletion of oxygen in water bodies.Sewage alongwith agricultural run-off and industrial effluents also contributes large amount of nutrients in surface water causing eutrophicationA large part of the domestic sewage is not even collected. This results in stagnation of sewage within city, a good breeding ground for mosquitoes and contaminate the groundwater, the only source of drinking water in many cities.
7
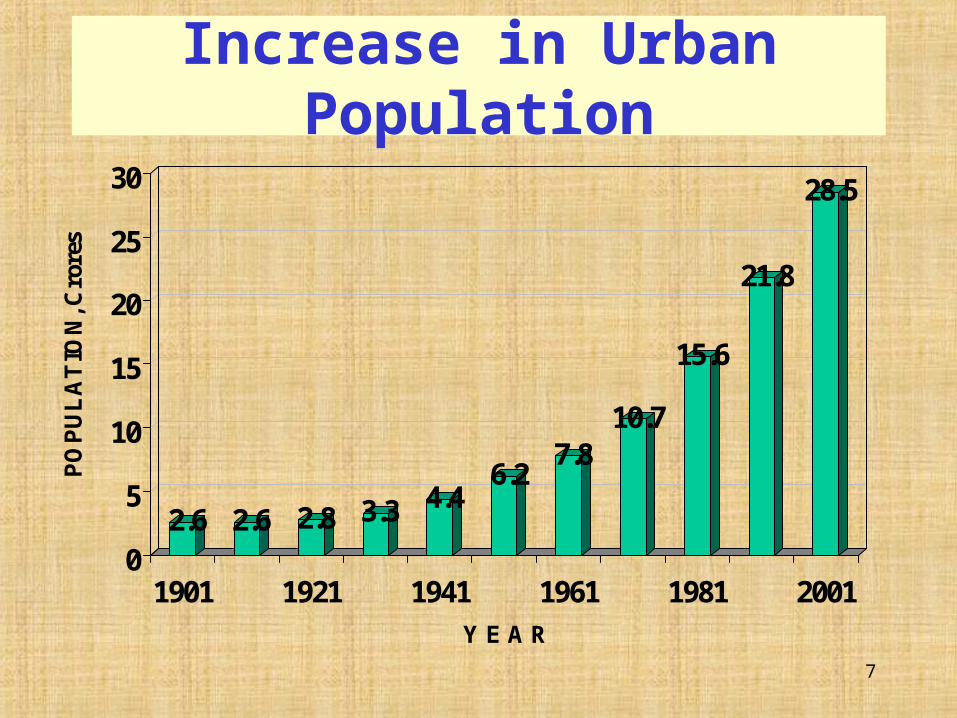
Increase in Urban Population
2.6 2.6 2.8 3.3 4.46.2
7.810.7
15.6
21.8
28.5
0
5
10
15
20
25
30
PO
PU
LA
TIO
N, C
rore
s
1901 1921 1941 1961 1981 2001
Y E A R
8
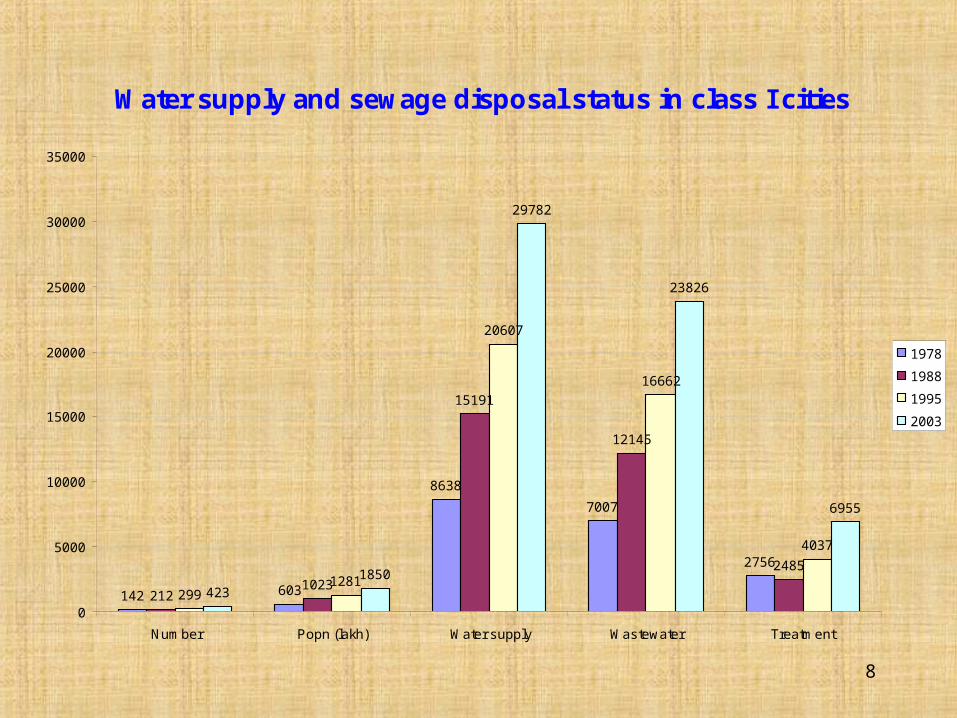
Water supply and sewage disposal status in class I cities
142 603
8638
7007
2756
2121023
15191
12145
2485
2991281
20607
16662
4037
4231850
29782
23826
6955
0
5000
10000
15000
20000
25000
30000
35000
Number Popn (lakh) Water supply Wastewater Treatment
1978
1988
1995
2003
9
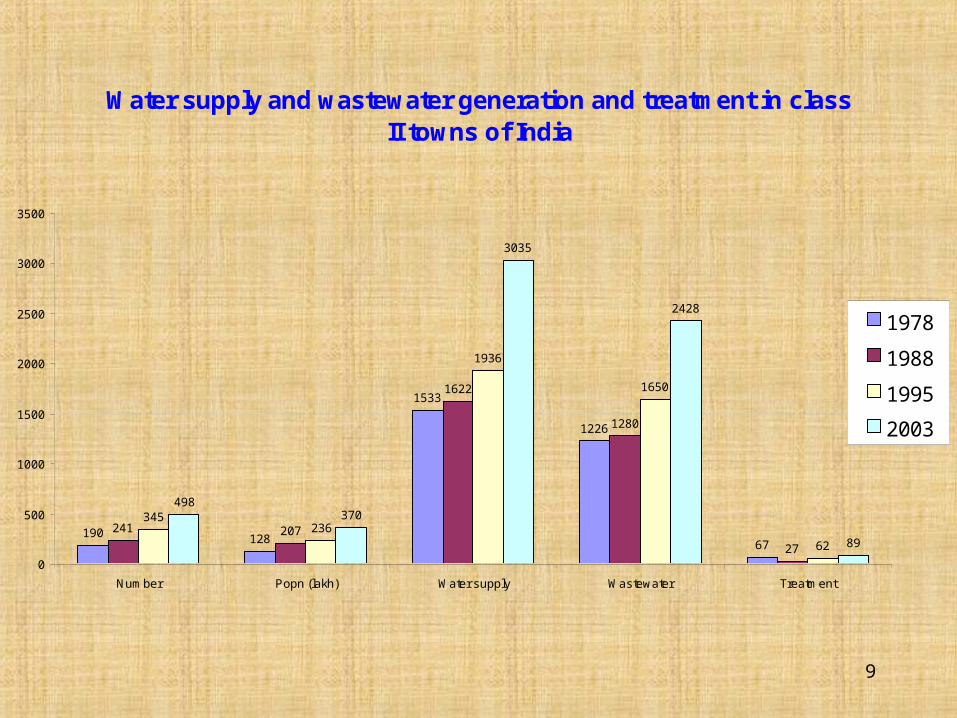
Water supply and wastewater generation and treatment in class II towns of India
190 128
1533
1226
67
241 207
1622
1280
27
345236
1936
1650
62
498370
3035
2428
89
0
500
1000
1500
2000
2500
3000
3500
Number Popn (lakh) Water supply Wastewater Treatment
1978
1988
1995
2003
10
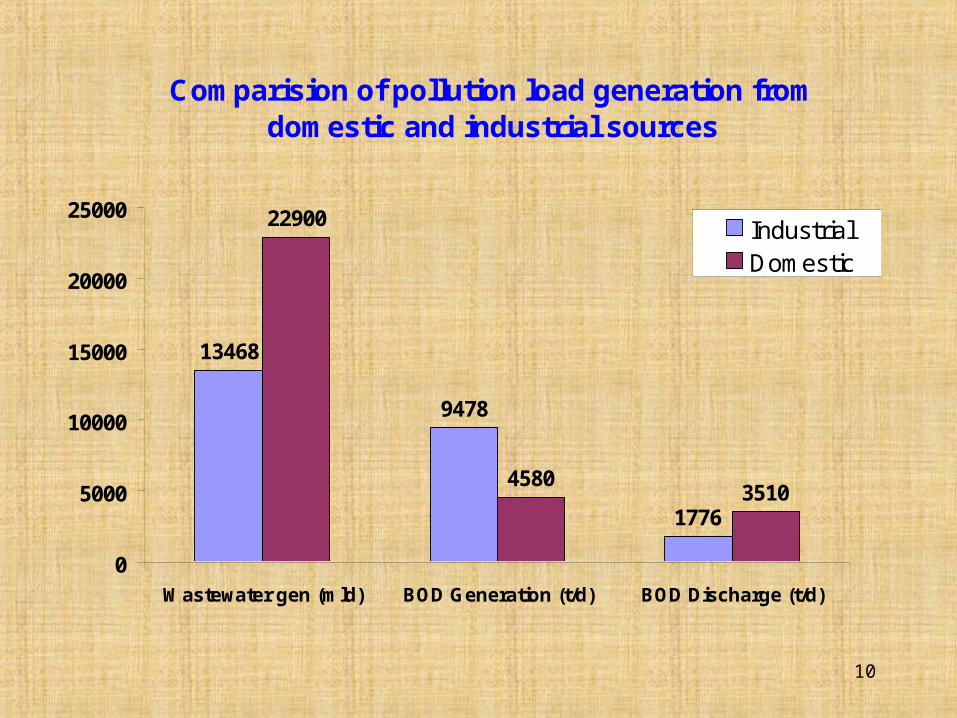
Comparision of pollution load generation from domestic and industrial sources
13468
9478
1776
22900
45803510
0
5000
10000
15000
20000
25000
Wastewater gen (mld) BOD Generation (t/d) BOD Discharge (t/d)
IndustrialDomestic
11
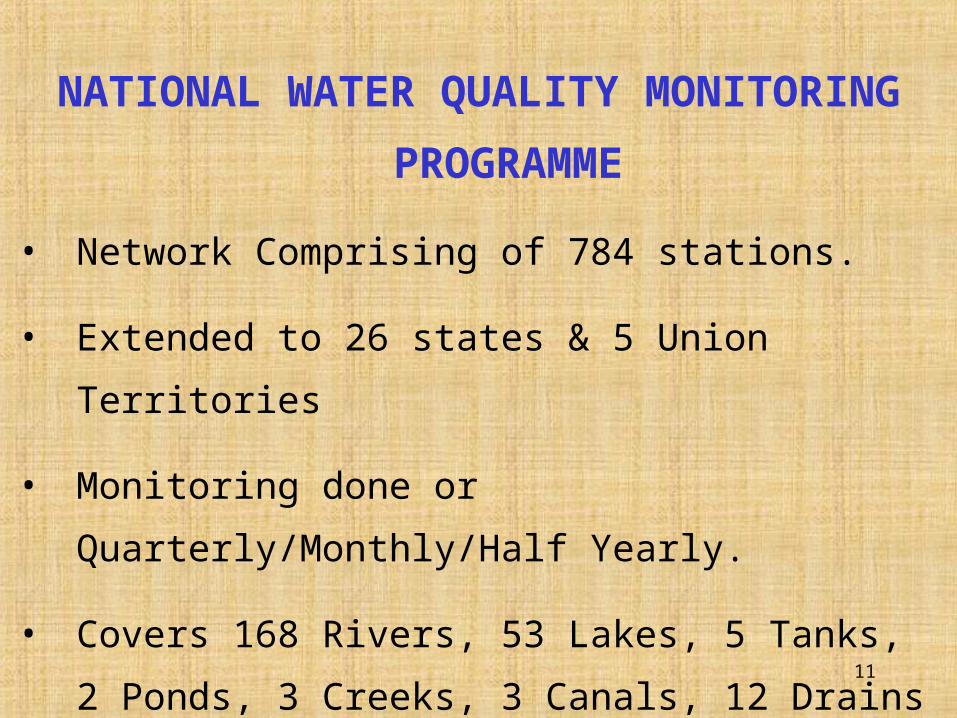
NATIONAL WATER QUALITY MONITORING
PROGRAMME
• Network Comprising of 784 stations.
• Extended to 26 states & 5 Union Territories
• Monitoring done or Quarterly/Monthly/Half Yearly.
• Covers 168 Rivers, 53 Lakes, 5 Tanks, 2 Ponds, 3
Creeks, 3 Canals, 12 Drains and 181 wells.
12
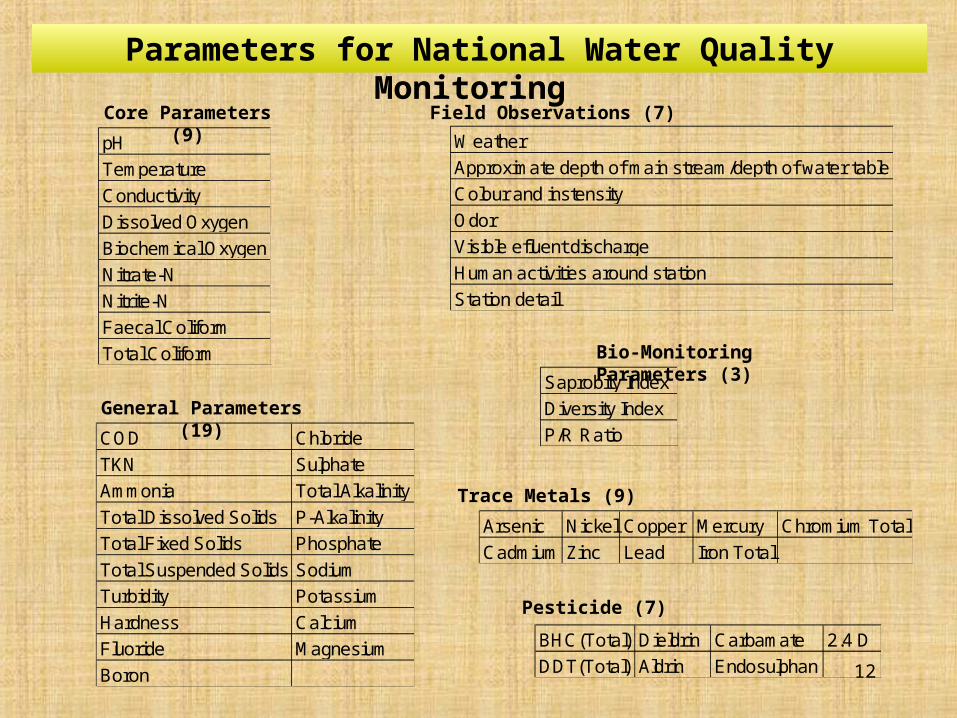
pH
Temperature
Conductivity
Dissolved Oxygen
Biochemical Oxygen DemandNitrate-N
Nitrite-N
Faecal Coliform
Total Coliform
COD Chloride
TKN Sulphate
Ammonia Total Alkalinity
Total Dissolved Solids P-Alkalinity
Total Fixed Solids Phosphate
Total Suspended Solids Sodium
Turbidity Potassium
Hardness Calcium
Fluoride Magnesium
Boron
Weather
Approximate depth of main stream/depth of water table
Colour and instensity
Odor
Visible efluent discharge
Human activities around station
Station detail
Saprobity Index
Diversity Index
P/R Ratio
Arsenic Nickel Copper Mercury Chromium Total
Cadmium Zinc Lead Iron Total
BHC(Total) Dieldrin Carbamate 2.4 D
DDT(Total) Aldrin Endosulphan
Parameters for National Water Quality Monitoring
Core Parameters (9)
General Parameters (19)
Field Observations (7)
Bio-Monitoring Parameters (3)
Trace Metals (9)
Pesticide (7)
13
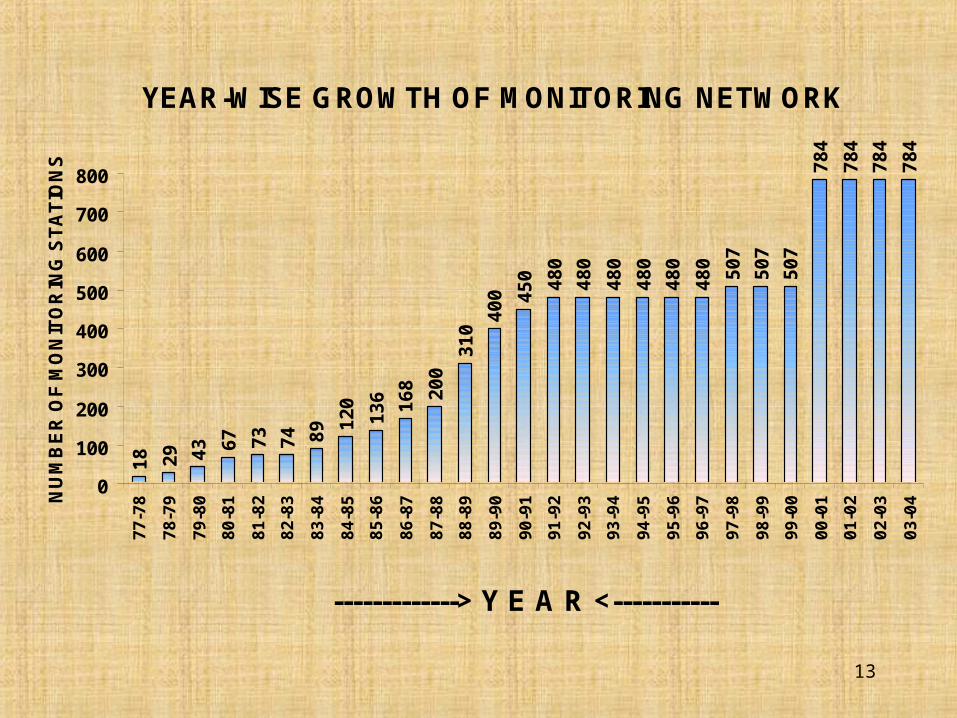
YEAR-WISE GROWTH OF MONITORING NETWORK1
8 29 43 67 73
74 89 1
20
13
6 16
8 20
0
31
0
40
0 45
0 48
0
48
0
48
0
48
0
48
0
48
0
50
7
50
7
50
7
78
4
78
4
78
4
78
4
0
100
200
300
400
500
600
700
800
77
-78
78
-79
79
-80
80
-81
81
-82
82
-83
83
-84
84
-85
85
-86
86
-87
87
-88
88
-89
89
-90
90
-91
91
-92
92
-93
93
-94
94
-95
95
-96
96
-97
97
-98
98
-99
99
-00
00
-01
01
-02
02
-03
03
-04
-------------> Y E A R <-----------
NU
MB
ER
OF
MO
NIT
OR
ING
ST
AT
ION
S
14
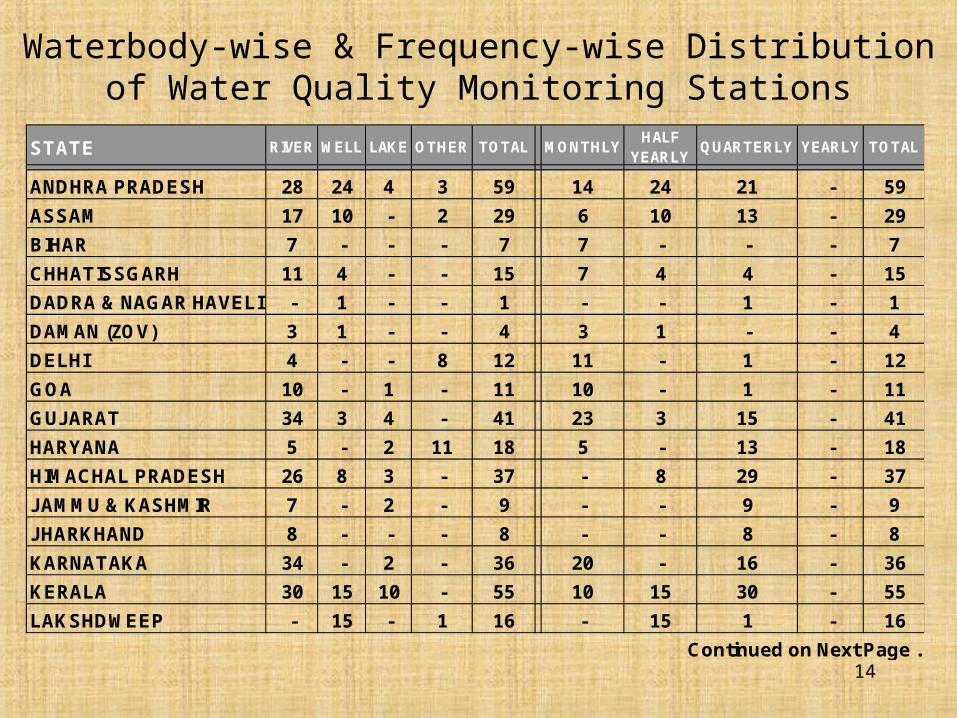
Waterbody-wise & Frequency-wise Distribution of Water Quality Monitoring Stations
STATE RIVER WELL LAKE OTHER TOTAL MONTHLYHALF
YEARLYQUARTERLY YEARLY TOTAL
ANDHRA PRADESH 28 24 4 3 59 14 24 21 - 59
ASSAM 17 10 - 2 29 6 10 13 - 29
BIHAR 7 - - - 7 7 - - - 7
CHHATISSGARH 11 4 - - 15 7 4 4 - 15
DADRA & NAGAR HAVELI - 1 - - 1 - - 1 - 1
DAMAN (ZOV) 3 1 - - 4 3 1 - - 4
DELHI 4 - - 8 12 11 - 1 - 12
GOA 10 - 1 - 11 10 - 1 - 11
GUJARAT 34 3 4 - 41 23 3 15 - 41
HARYANA 5 - 2 11 18 5 - 13 - 18
HIMACHAL PRADESH 26 8 3 - 37 - 8 29 - 37
JAMMU & KASHMIR 7 - 2 - 9 - - 9 - 9
JHARKHAND 8 - - - 8 - - 8 - 8
KARNATAKA 34 - 2 - 36 20 - 16 - 36
KERALA 30 15 10 - 55 10 15 30 - 55
LAKSHDWEEP - 15 - 1 16 - 15 1 - 16
Continued on Next Page ..
15
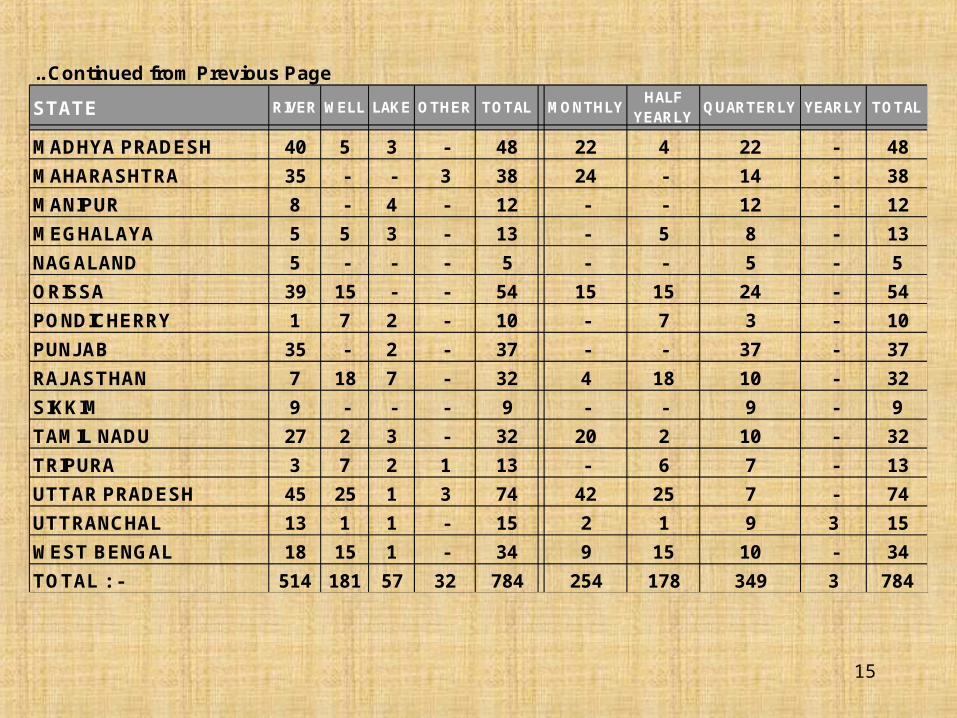
.. Continued from Previous Page
STATE RIVER WELL LAKE OTHER TOTAL MONTHLYHALF
YEARLYQUARTERLY YEARLY TOTAL
MADHYA PRADESH 40 5 3 - 48 22 4 22 - 48
MAHARASHTRA 35 - - 3 38 24 - 14 - 38
MANIPUR 8 - 4 - 12 - - 12 - 12
MEGHALAYA 5 5 3 - 13 - 5 8 - 13
NAGALAND 5 - - - 5 - - 5 - 5
ORISSA 39 15 - - 54 15 15 24 - 54
PONDICHERRY 1 7 2 - 10 - 7 3 - 10
PUNJAB 35 - 2 - 37 - - 37 - 37
RAJASTHAN 7 18 7 - 32 4 18 10 - 32
SIKKIM 9 - - - 9 - - 9 - 9
TAMIL NADU 27 2 3 - 32 20 2 10 - 32
TRIPURA 3 7 2 1 13 - 6 7 - 13
UTTAR PRADESH 45 25 1 3 74 42 25 7 - 74
UTTRANCHAL 13 1 1 - 15 2 1 9 3 15
WEST BENGAL 18 15 1 - 34 9 15 10 - 34
TOTAL : - 514 181 57 32 784 254 178 349 3 784
16
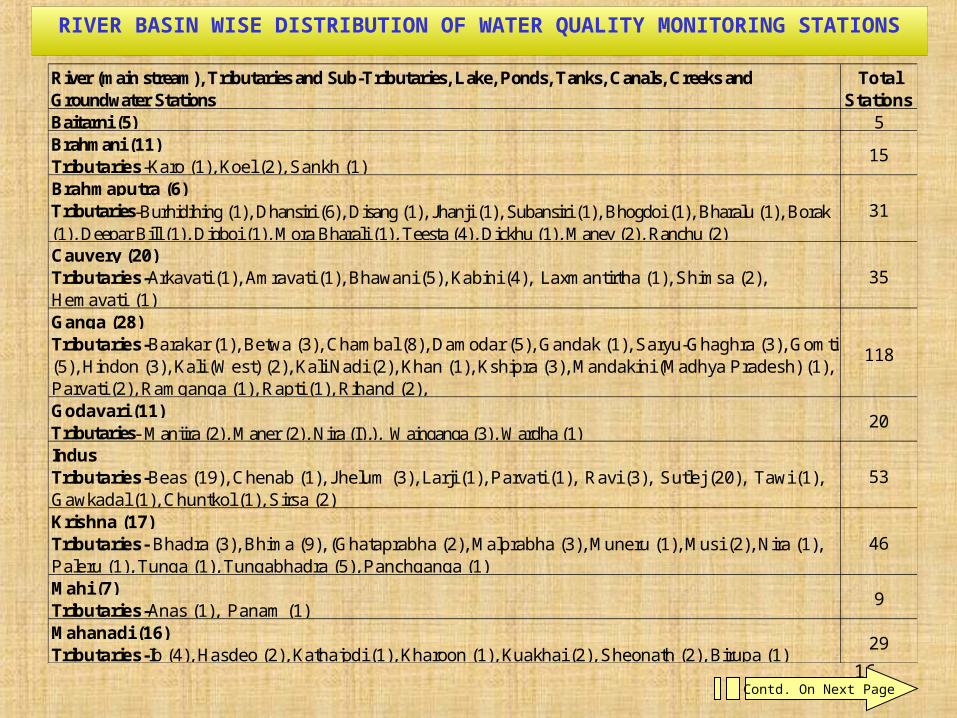
River (main stream), Tributaries and Sub-Tributaries, Lake, Ponds, Tanks, Canals, Creeks and Groundwater Stations
Total Stations
Baitarni (5) 5Brahmani (11)Tributaries-Karo (1), Koel (2), Sankh (1) Brahmaputra (6)Tributaries-Burhidihing (1), Dhansiri (6), Disang (1), Jhanji (1), Subansiri (1), Bhogdoi (1), Bharalu (1), Borak (1), Deepar Bill (1), Digboi (1), Mora Bharali (1), Teesta (4), Dickhu (1), Maney (2), Ranchu (2)Cauvery (20)Tributaries-Arkavati (1), Amravati (1), Bhawani (5), Kabini (4), Laxmantirtha (1), Shimsa (2), Hemavati (1)Ganga (28)Tributaries-Barakar (1), Betwa (3), Chambal (8), Damodar (5), Gandak (1), Saryu-Ghaghra (3), Gomti (5), Hindon (3), Kali (West) (2), Kali Nadi (2), Khan (1), Kshipra (3), Mandakini (Madhya Pradesh) (1), Parvati (2), Ramganga (1), Rapti (1), Rihand (2), Godavari (11)Tributaries- Manjira (2), Maner (2), Nira (I),), Wainganga (3), Wardha (1) IndusTributaries-Beas (19), Chenab (1), Jhelum (3), Larji (1), Parvati (1), Ravi (3), Sutlej (20), Tawi (1), Gawkadal (1), Chuntkol (1), Sirsa (2) Krishna (17)Tributaries- Bhadra (3), Bhima (9), (Ghataprabha (2), Malprabha (3), Muneru (1), Musi (2), Nira (1), Paleru (1), Tunga (1), Tungabhadra (5), Panchganga (1)Mahi (7) Tributaries-Anas (1), Panam (1) Mahanadi (16)Tributaries-Ib (4), Hasdeo (2), Kathajodi (1), Kharoon (1), Kuakhai (2), Sheonath (2), Birupa (1)
29
20
53
46
9
15
31
35
118
RIVER BASIN WISE DISTRIBUTION OF WATER QUALITY MONITORING STATIONS
Contd. On Next Page
17
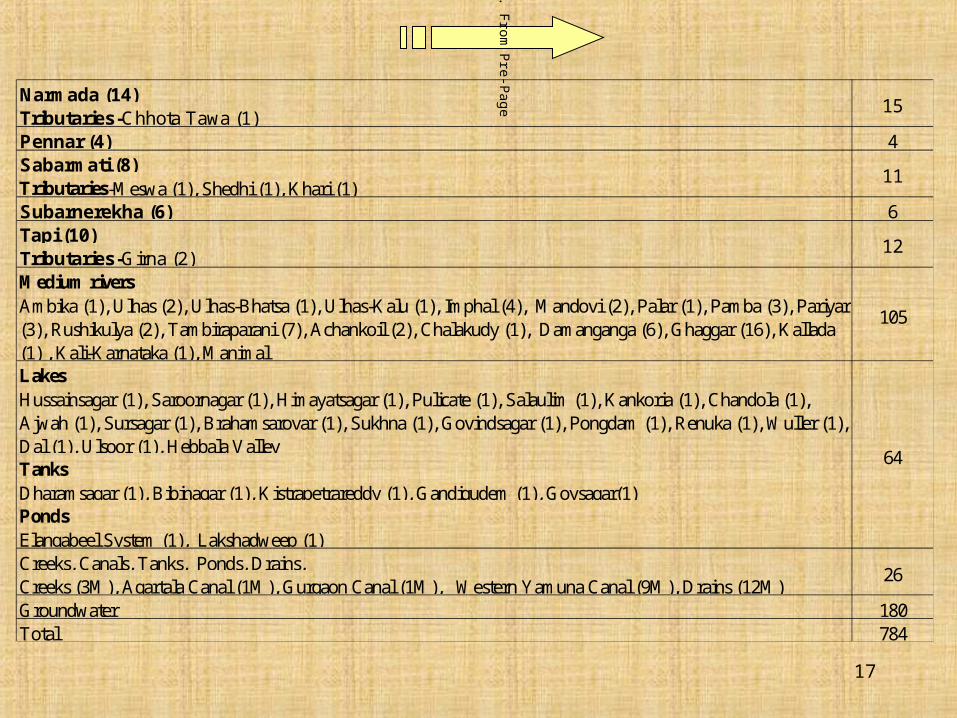
Narmada (14) Tributaries-Chhota Tawa (1)Pennar (4) 4Sabarmati (8)Tributaries-Meswa (1), Shedhi (1), Khari (1)Subarnerekha (6) 6Tapi (10)Tributaries-Girna (2)Medium riversAmbika (1), Ulhas (2), Ulhas-Bhatsa (1), Ulhas-Kalu (1), Imphal (4), Mandovi (2), Palar (1), Pamba (3), Pariyar (3), Rushikulya (2), Tambiraparani (7), Achankoil (2), Chalakudy (1), Damanganga (6), Ghaggar (16), Kallada (1) , Kali-Karnataka (1), ManimalLakes Hussainsagar (1), Saroornagar (1), Himayatsagar (1), Pulicate (1), Salaulim (1), Kankoria (1), Chandola (1), Ajwah (1), Sursagar (1), Brahamsarovar (1), Sukhna (1), Govindsagar (1), Pongdam (1), Renuka (1), Wuller (1), Dal (1), Ulsoor (1), Hebbala Valley Tanks Dharamsagar (1), Bibinagar (1), Kistrapetrareddy (1), Gandigudem (1), Goysagar(1)PondsElangabeel System (1), Lakshadweep (1)Creeks, Canals, Tanks, Ponds, Drains, Creeks (3M), Agartala Canal (1M), Gurgaon Canal (1M), Western Yamuna Canal (9M), Drains (12M)Groundwater 180Total 784
105
64
26
15
11
12
Contd. From
Pre-Page
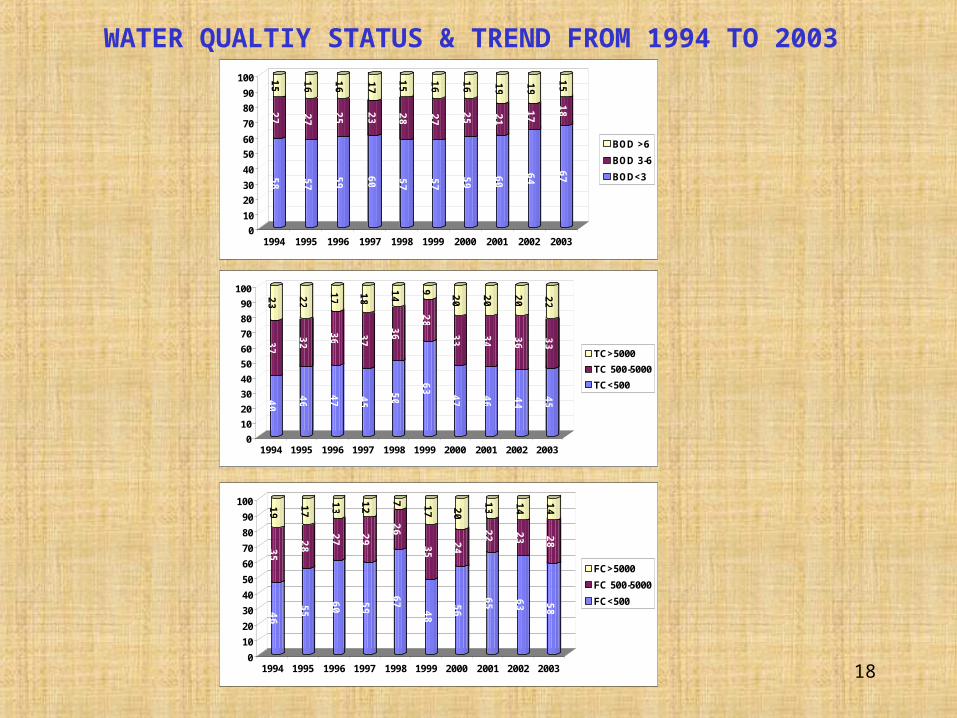
1858
2715
5727
16
5925
16
6023
17
5728
15
5727
16
5925
16
6021
19
6417
19
6718
15
0
10
20
30
40
50
60
70
80
90
100
1994 1995 1996 1997 1998 1999 2000 2001 2002 2003
BOD >6
BOD 3-6
BOD<3
4037
23
4632
22
4736
17
4537
18
5036
14
6328
9
4733
20
4634
20
4436
20
4533
22
0
10
20
30
40
50
60
70
80
90
100
1994 1995 1996 1997 1998 1999 2000 2001 2002 2003
TC>5000
TC 500-5000
TC<500
4635
19
5528
17
6027
13
5929
12
6726
7
4835
17
5624
20
6522
13
6323
14
5828
14
0
10
20
30
40
50
60
70
80
90
100
1994 1995 1996 1997 1998 1999 2000 2001 2002 2003
FC>5000
FC 500-5000
FC<500
WATER QUALTIY STATUS & TREND FROM 1994 TO 2003
19
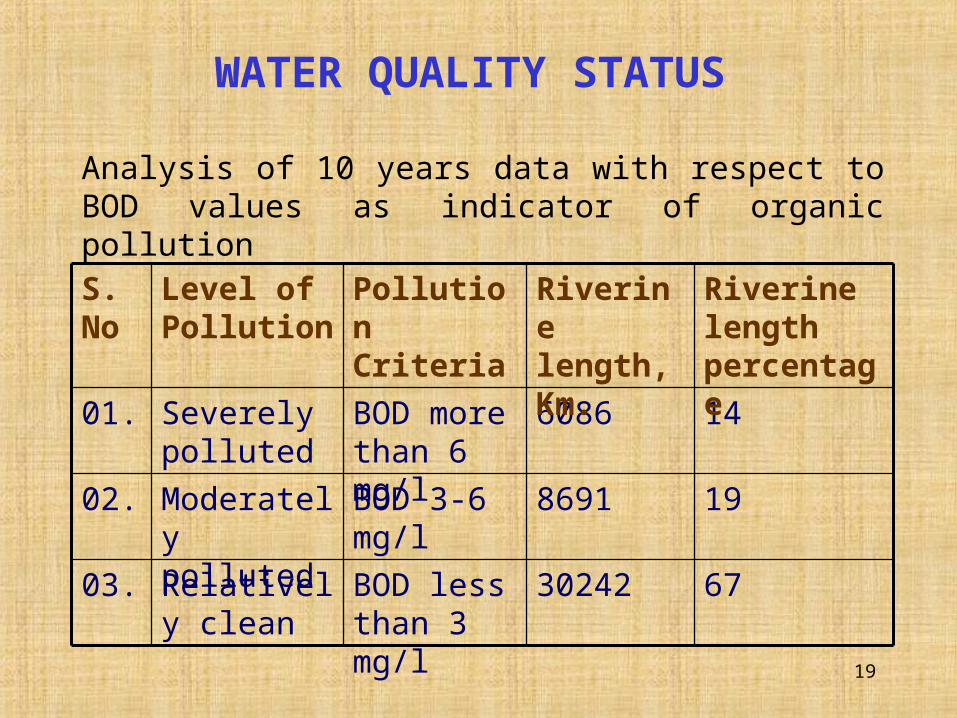
6730242BOD less than 3 mg/l
Relatively clean
03.
198691BOD 3-6 mg/l
Moderately polluted
02.
146086BOD more than 6 mg/l
Severely polluted
01.
Riverine length percentage
Riverine length, Km.
Pollution Criteria
Level of Pollution
S.No
WATER QUALITY STATUS
Analysis of 10 years data with respect to BOD values as indicator of organic pollution
20
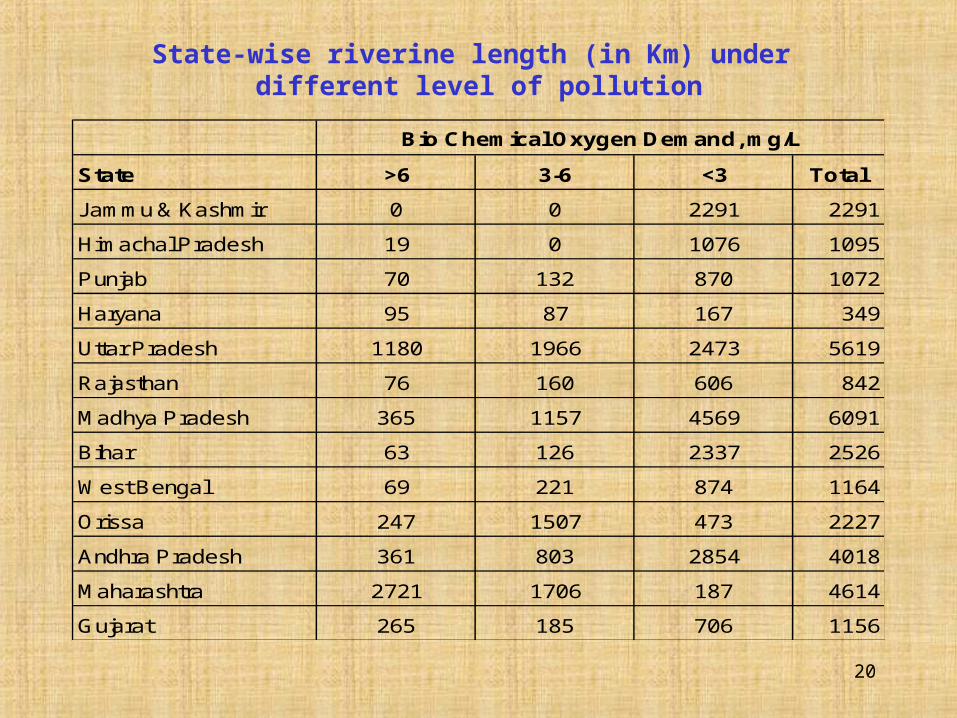
State >6 3-6 <3 Total
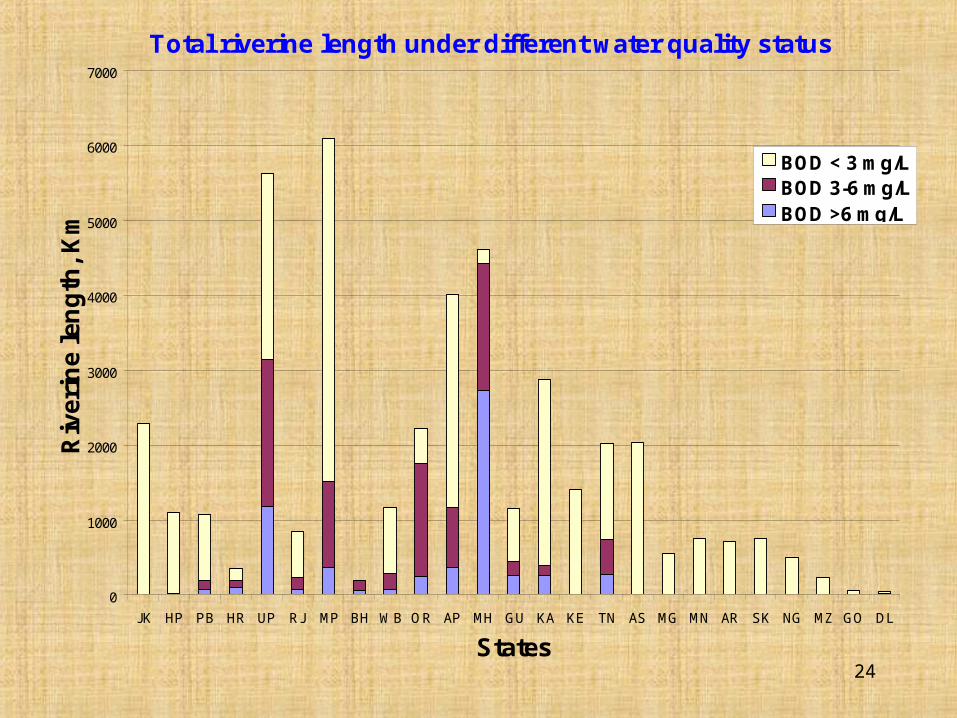
Jammu & Kashmir 0 0 2291 2291
Himachal Pradesh 19 0 1076 1095
Punjab 70 132 870 1072
Haryana 95 87 167 349
Uttar Pradesh 1180 1966 2473 5619
Rajasthan 76 160 606 842
Madhya Pradesh 365 1157 4569 6091
Bihar 63 126 2337 2526
West Bengal 69 221 874 1164
Orissa 247 1507 473 2227
Andhra Pradesh 361 803 2854 4018
Maharashtra 2721 1706 187 4614
Gujarat 265 185 706 1156
Bio Chemical Oxygen Demand, mg/L
State-wise riverine length (in Km) under different level of pollution
21
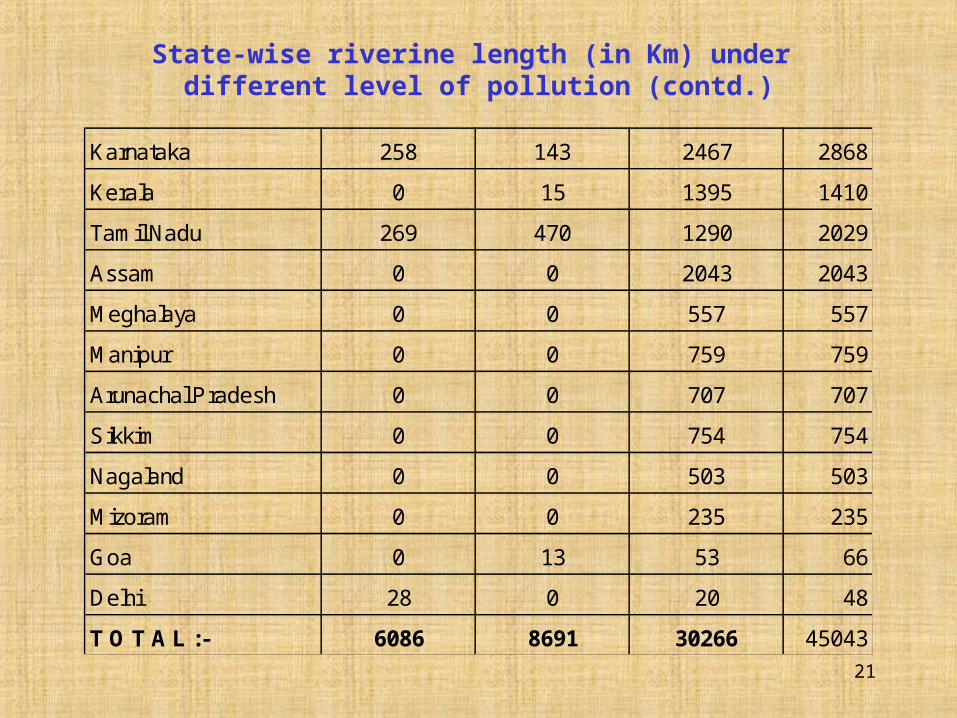
Karnataka 258 143 2467 2868
Kerala 0 15 1395 1410
Tamil Nadu 269 470 1290 2029
Assam 0 0 2043 2043
Meghalaya 0 0 557 557
Manipur 0 0 759 759
Arunachal Pradesh 0 0 707 707
Sikkim 0 0 754 754
Nagaland 0 0 503 503
Mizoram 0 0 235 235
Goa 0 13 53 66
Delhi 28 0 20 48
T O T A L :- 6086 8691 30266 45043
State-wise riverine length (in Km) under different level of pollution (contd.)
22
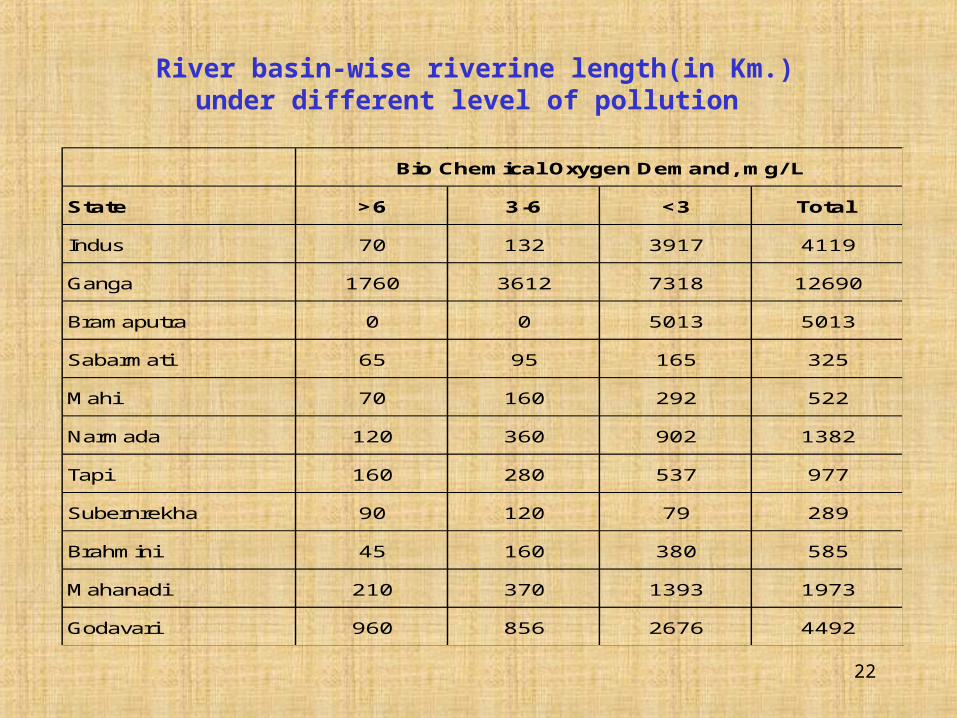
State >6 3-6 <3 Total
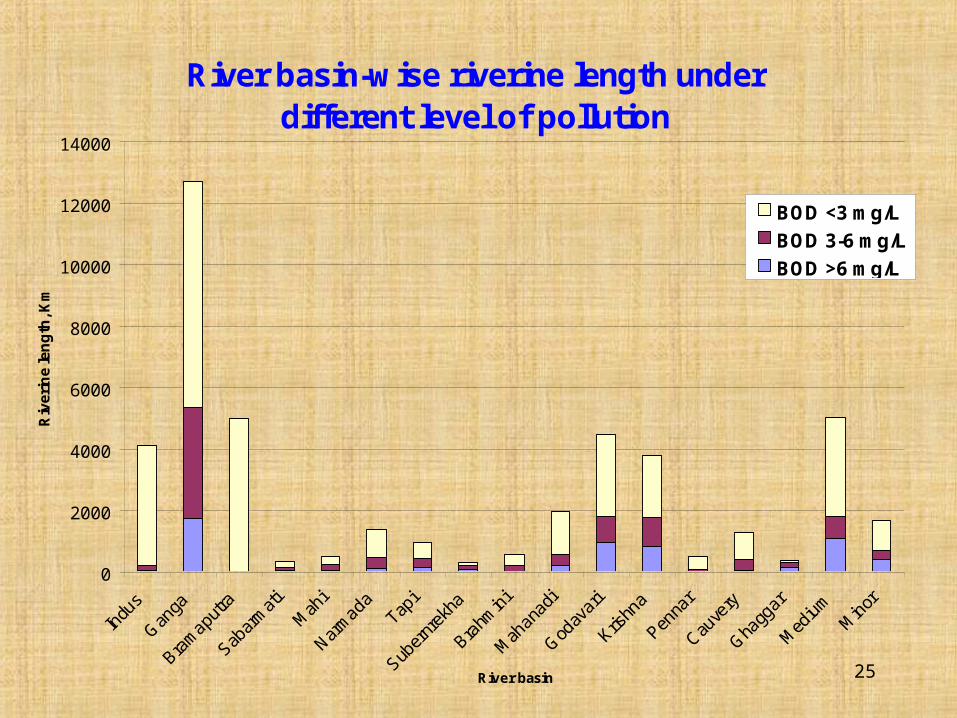
Indus 70 132 3917 4119
Ganga 1760 3612 7318 12690
Bramaputra 0 0 5013 5013
Sabarmati 65 95 165 325
Mahi 70 160 292 522
Narmada 120 360 902 1382
Tapi 160 280 537 977
Subernrekha 90 120 79 289
Brahmini 45 160 380 585
Mahanadi 210 370 1393 1973
Godavari 960 856 2676 4492
Bio Chemical Oxygen Demand, mg/L
River basin-wise riverine length(in Km.)under different level of pollution
23
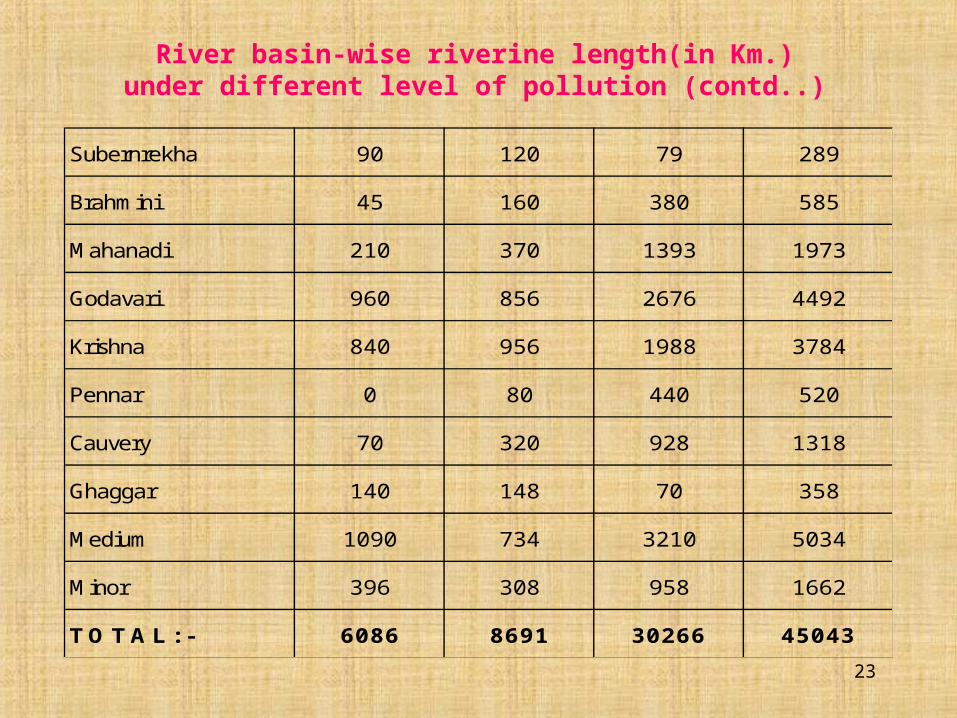
Subernrekha 90 120 79 289
Brahmini 45 160 380 585
Mahanadi 210 370 1393 1973
Godavari 960 856 2676 4492
Krishna 840 956 1988 3784
Pennar 0 80 440 520
Cauvery 70 320 928 1318
Ghaggar 140 148 70 358
Medium 1090 734 3210 5034
Minor 396 308 958 1662
T O T A L : - 6086 8691 30266 45043
River basin-wise riverine length(in Km.)under different level of pollution (contd..)
24
Total riverine length under different water quality status
0
1000
2000
3000
4000
5000
6000
7000
JK HP PB HR UP RJ MP BH WB OR AP MH GU KA KE TN AS MG MN AR SK NG MZ GO DL
States
Riv
erin
e le
ng
th,
Km
BOD < 3 mg/LBOD 3-6 mg/LBOD >6 mg/L
25
River basin-wise riverine length under different level of pollution
0
2000
4000
6000
8000
10000
12000
14000
Indu
s
Gan
ga
Bramap
utra
Sabar
mati
Mah
i
Narm
ada
Tapi
Suber
nrek
ha
Brahm
ini
Mah
anad
i
God
avar
i
Krishn
a
Penna
r
Cauve
ry
Gha
ggar
Med
ium
Mino
r
River basin
Riv
eri
ne
len
gth
, Km
BOD <3 mg/L
BOD 3-6 mg/L
BOD >6 mg/L
26
Identification of Polluted Water Bodies
• CPCB identified 10 polluted stretches for prioritising pollution control efforts in 1988-89.
• The Number of Stretches increased to 37 during 1992-93.
• The list is now revised to include 86 stretches.
• The concerned State Pollution Control Boards were asked to take adequate measures to restore the desired level.
27
RIVER ACTION PLAN
• CPCB identified polluted water bodies, which leads to formulation of action plan for restoration of the water body.
• Based on CPCB’s Recommendations, Ganga Action Plan was launched in 1986 to restore the WQ of the Ganga by interception, diversion and treatment of wastewater from 27 cities/towns located along the river.
• Based on the experience gained during implementation of the Ganga Action Plan, Govt of India extends river cleaning programme to other rivers and lakes.
28
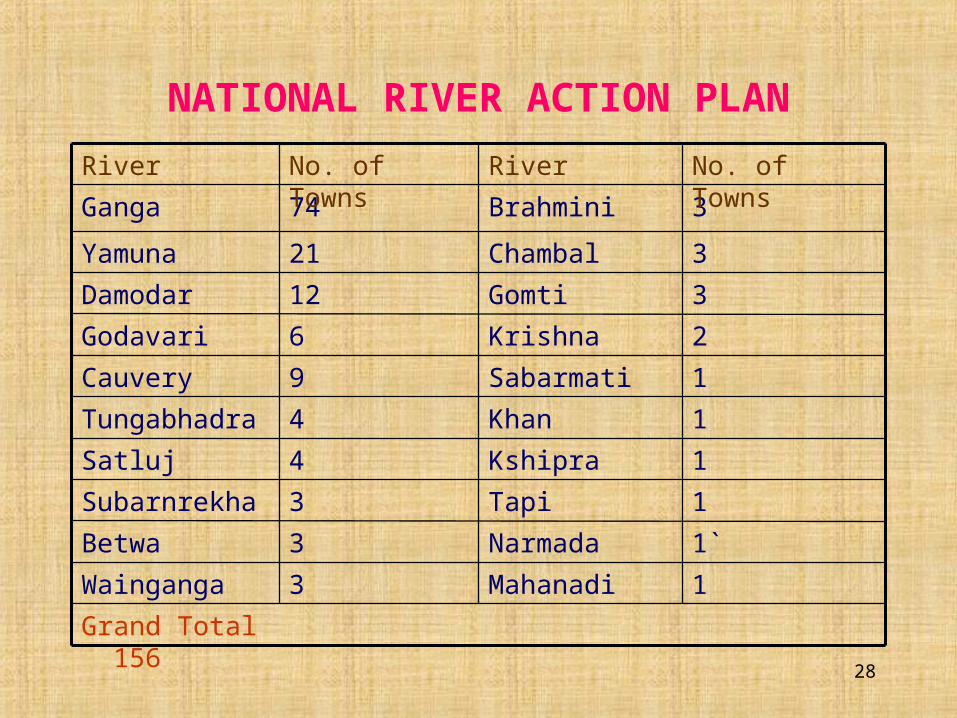
NATIONAL RIVER ACTION PLAN
Grand Total 156
1Mahanadi3Wainganga
1`Narmada3Betwa
1Tapi3Subarnrekha
1Kshipra4Satluj
1Khan4Tungabhadra
1Sabarmati9Cauvery
2Krishna6Godavari
3Gomti12Damodar
3Chambal21Yamuna
3Brahmini74Ganga
No. of TownsRiverNo. of TownsRiver
29
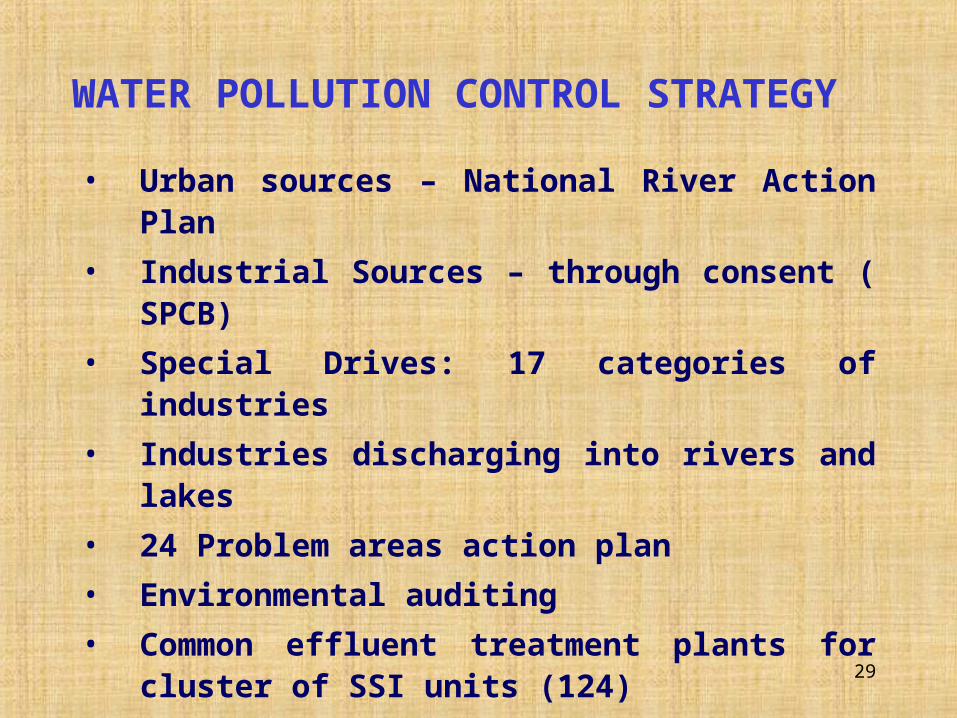
WATER POLLUTION CONTROL STRATEGY
• Urban sources – National River Action Plan
• Industrial Sources – through consent ( SPCB)
• Special Drives: 17 categories of industries
• Industries discharging into rivers and lakes
• 24 Problem areas action plan
• Environmental auditing
• Common effluent treatment plants for cluster of SSI units (124)
• Promotion of low-waste and no-waste technology
30
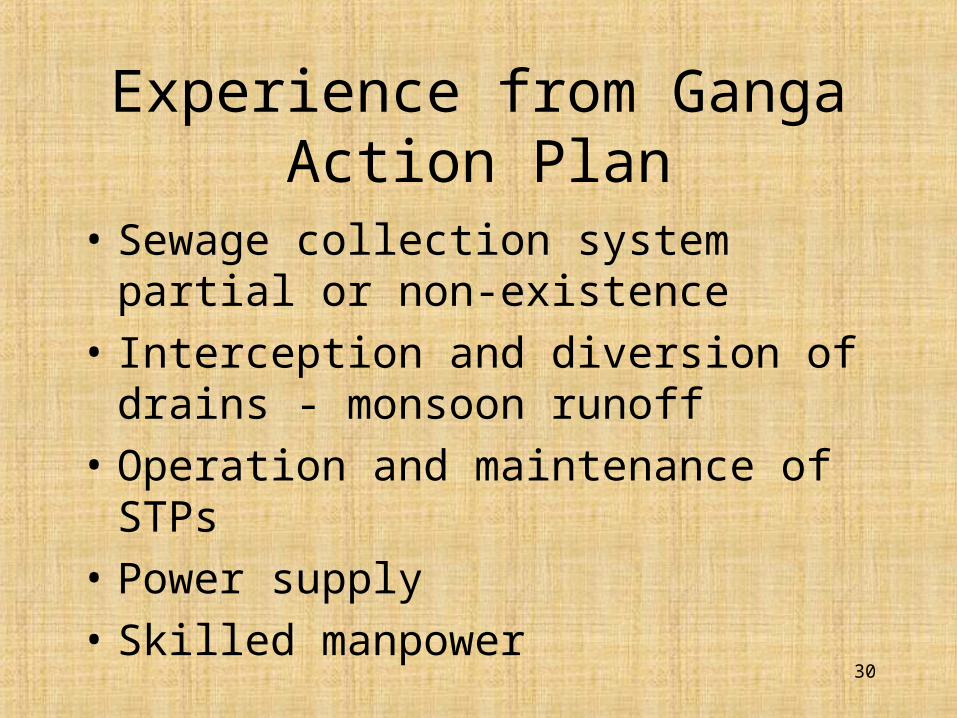
Experience from Ganga Action Plan
• Sewage collection system partial or non-existence
• Interception and diversion of drains - monsoon runoff
• Operation and maintenance of STPs
• Power supply
• Skilled manpower
31
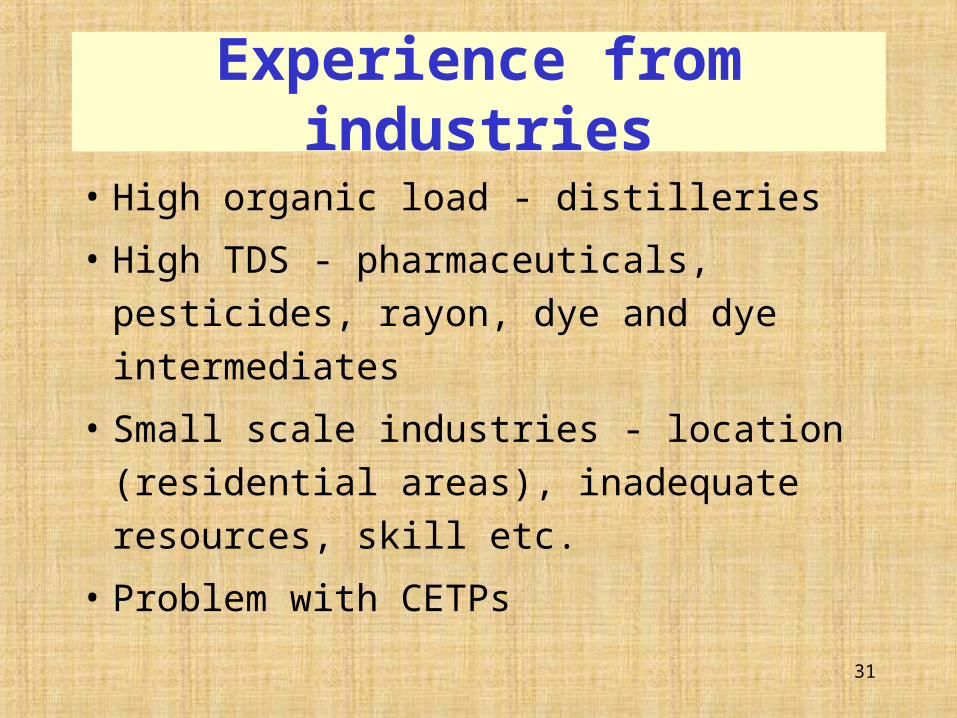
Experience from industries
• High organic load - distilleries
• High TDS - pharmaceuticals, pesticides,
rayon, dye and dye intermediates
• Small scale industries - location (residential
areas), inadequate resources, skill etc.
• Problem with CETPs
32
ASSESSMENT OF GROUND WATER QUALITY IN METRO
CITIES
• The groundwater is the main source of drinking in our country.
• The groundwater quality is being degraded gradually in large urban centers/critically polluted areas.
• Although Ministry of Water Resources is monitoring groundwater quality all over the country. The monitoring does not include main water quality issues ( heavy metals, pesticides, coliform, BOD, COD etc.
• Thus, it is important to monitor the groundwater quality in the country.
• In the current financial year CPCB included in its monitoring network a large number of groundwater stations (200 stations).
• Apart from this CPCB is taking help of some research institutes to study the groundwater quality.
33
CONCLUSION
• In order to meet water quality criteria in rivers, dilution water is required besides stringent pollution control.
• Interlinking of rivers is one of the solution to meet water quality criteria in rivers as more dilution of water would be available in rivers.

34