Embed Size (px)
Citation preview
Sources: Hotspot, CME Group, EBS/ICAP, Reuters/FXall, FastMatch; Effective June 2016, EBS/ICAP volumes include Spot, Outrights, and Forwards, impacting market share and historical performance comparisons.
Hotspot, July 2016
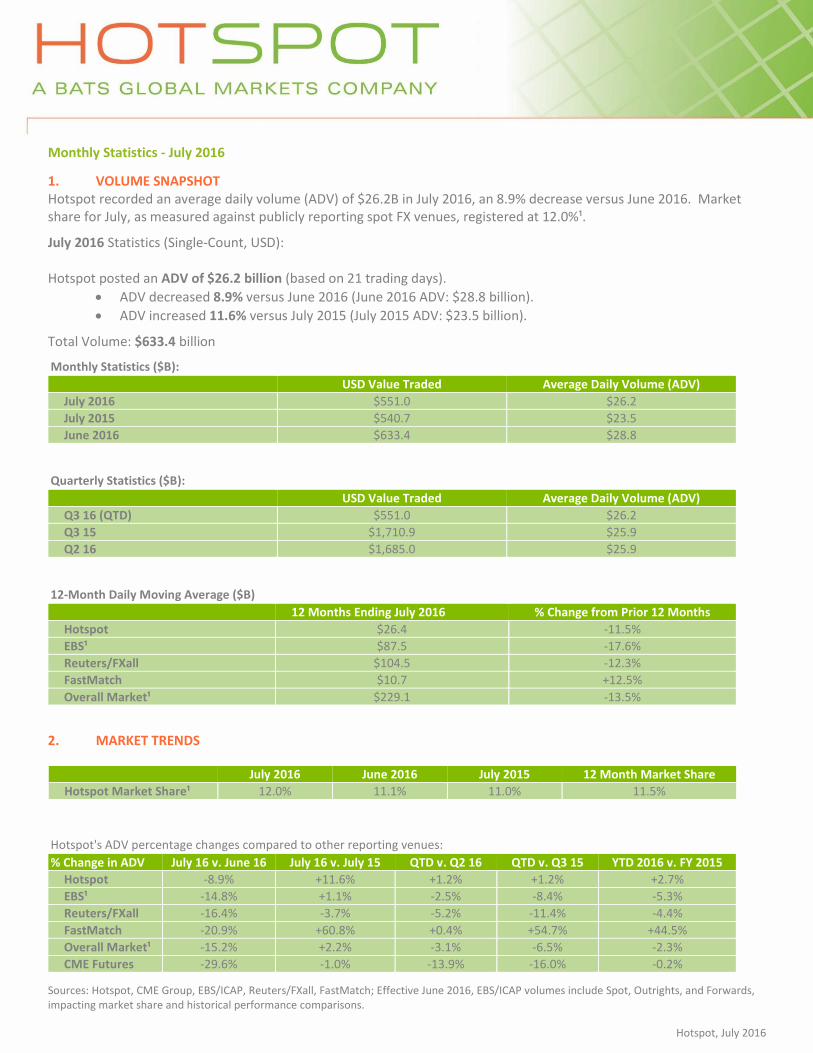
Monthly Statistics - July 2016
1. VOLUME SNAPSHOT Hotspot recorded an average daily volume (ADV) of $26.2B in July 2016, an 8.9% decrease versus June 2016. Market share for July, as measured against publicly reporting spot FX venues, registered at 12.0%¹.
July 2016 Statistics (Single-Count, USD): Hotspot posted an ADV of $26.2 billion (based on 21 trading days).
ADV decreased 8.9% versus June 2016 (June 2016 ADV: $28.8 billion).
ADV increased 11.6% versus July 2015 (July 2015 ADV: $23.5 billion).
Total Volume: $633.4 billion
Monthly Statistics ($B):
USD Value Traded Average Daily Volume (ADV)
July 2016 $551.0 $26.2
July 2015 $540.7 $23.5
June 2016 $633.4 $28.8
Quarterly Statistics ($B):
USD Value Traded Average Daily Volume (ADV)
Q3 16 (QTD) $551.0 $26.2
Q3 15 $1,710.9 $25.9
Q2 16 $1,685.0 $25.9
12-Month Daily Moving Average ($B) (($Billions):
12 Months Ending July 2016 % Change from Prior 12 Months
Hotspot $26.4 -11.5%
EBS¹ $87.5 -17.6%
Reuters/FXall $104.5 -12.3%
FastMatch $10.7 +12.5%
Overall Market¹ $229.1 -13.5%
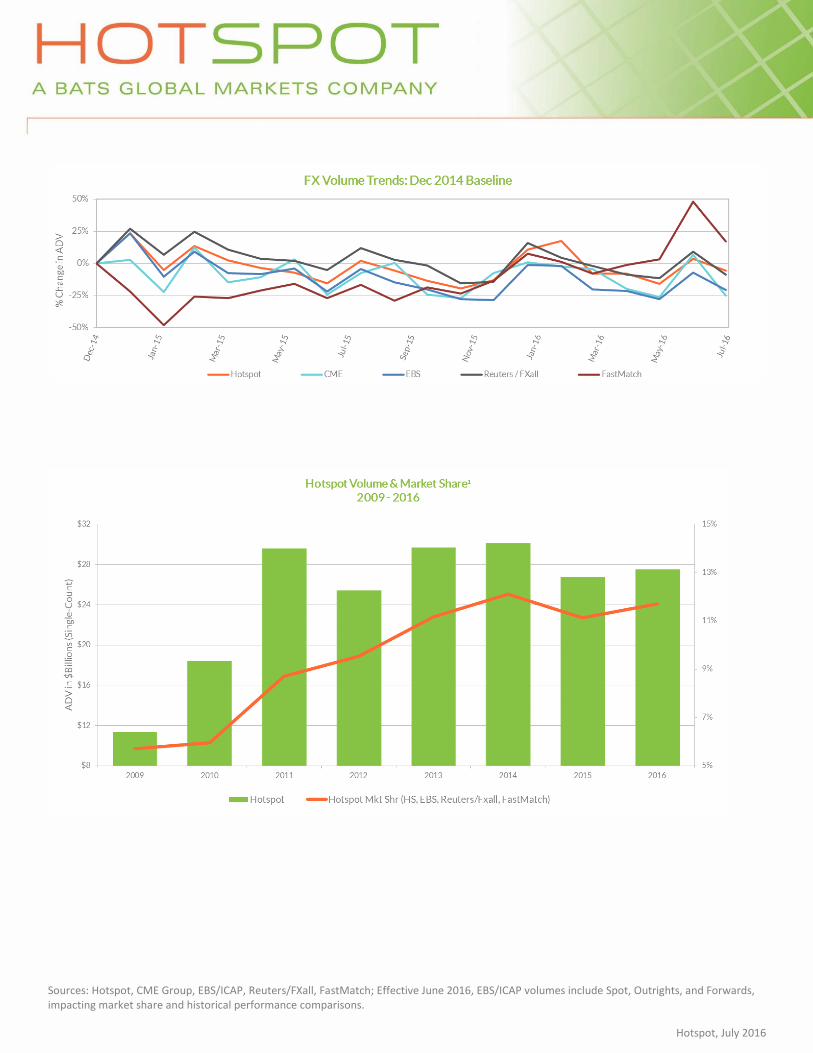
2. MARKET TRENDS
July 2016 June 2016 July 2015 12 Month Market Share
Hotspot Market Share¹ 12.0% 11.1% 11.0% 11.5%
Hotspot's ADV percentage changes compared to other reporting venues:
% Change in ADV July 16 v. June 16 July 16 v. July 15 QTD v. Q2 16 QTD v. Q3 15 YTD 2016 v. FY 2015
Hotspot -8.9% +11.6% +1.2% +1.2% +2.7%
EBS¹ -14.8% +1.1% -2.5% -8.4% -5.3%
Reuters/FXall -16.4% -3.7% -5.2% -11.4% -4.4%
FastMatch -20.9% +60.8% +0.4% +54.7% +44.5%
Overall Market¹ -15.2% +2.2% -3.1% -6.5% -2.3%
CME Futures -29.6% -1.0% -13.9% -16.0% -0.2%
Sources: Hotspot, CME Group, EBS/ICAP, Reuters/FXall, FastMatch; Effective June 2016, EBS/ICAP volumes include Spot, Outrights, and Forwards, impacting market share and historical performance comparisons.
Hotspot, July 2016
Sources: Hotspot, CME Group, EBS/ICAP, Reuters/FXall, FastMatch; Effective June 2016, EBS/ICAP volumes include Spot, Outrights, and Forwards, impacting market share and historical performance comparisons.
Hotspot, July 2016
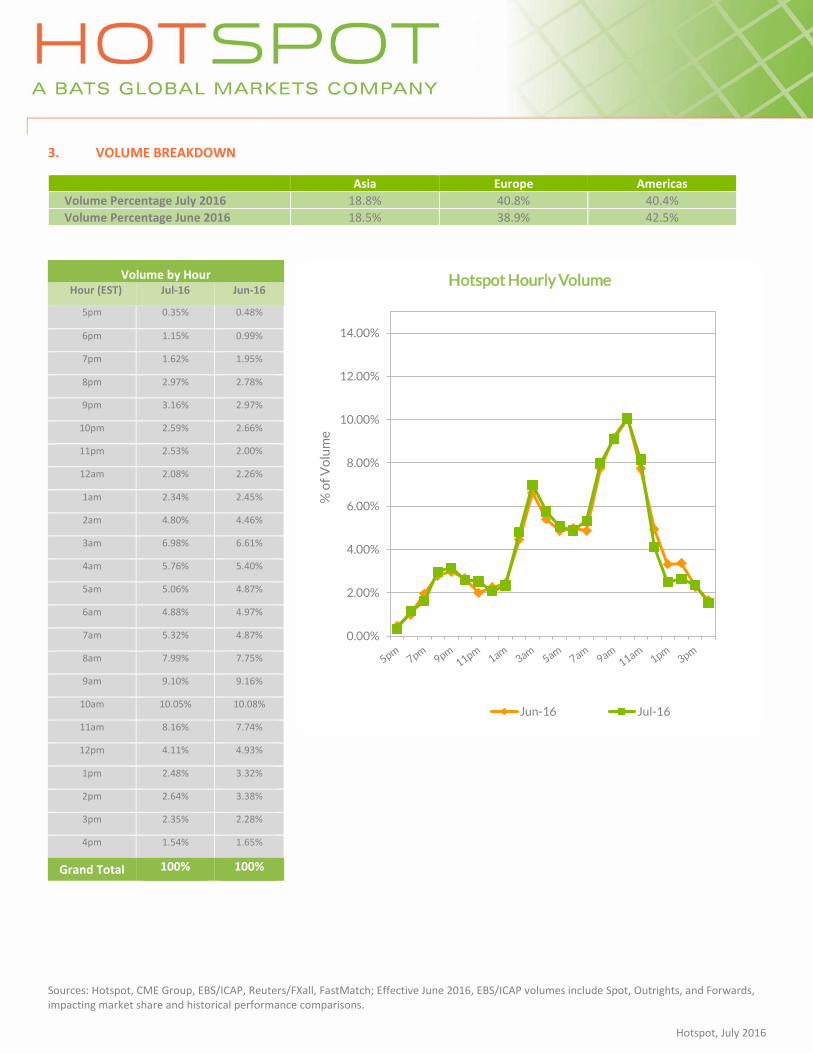
3. VOLUME BREAKDOWN
Asia Europe Americas
Volume Percentage July 2016 18.8% 40.8% 40.4%
Volume Percentage June 2016 18.5% 38.9% 42.5%
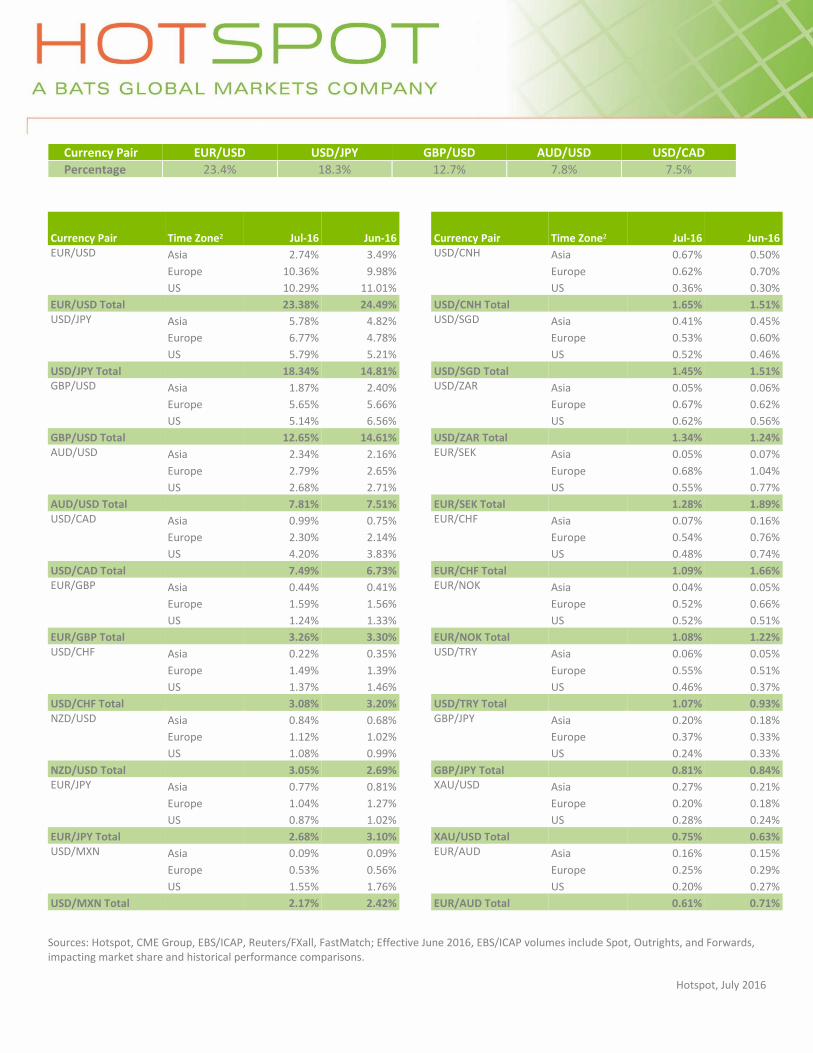
The Top Five currency pairs by volume percentage were:
0.00%
2.00%
4.00%
6.00%
8.00%
10.00%
12.00%
14.00%%
of
Vo
lum
e
Hotspot Hourly Volume
Jun-16 Jul-16
Volume by Hour Hour (EST) Jul-16 Jun-16
5pm 0.35% 0.48%
6pm 1.15% 0.99%
7pm 1.62% 1.95%
8pm 2.97% 2.78%
9pm 3.16% 2.97%
10pm 2.59% 2.66%
11pm 2.53% 2.00%
12am 2.08% 2.26%
1am 2.34% 2.45%
2am 4.80% 4.46%
3am 6.98% 6.61%
4am 5.76% 5.40%
5am 5.06% 4.87%
6am 4.88% 4.97%
7am 5.32% 4.87%
8am 7.99% 7.75%
9am 9.10% 9.16%
10am 10.05% 10.08%
11am 8.16% 7.74%
12pm 4.11% 4.93%
1pm 2.48% 3.32%
2pm 2.64% 3.38%
3pm 2.35% 2.28%
4pm 1.54% 1.65%
Grand Total 100% 100%
Sources: Hotspot, CME Group, EBS/ICAP, Reuters/FXall, FastMatch; Effective June 2016, EBS/ICAP volumes include Spot, Outrights, and Forwards, impacting market share and historical performance comparisons.
Hotspot, July 2016
Currency Pair EUR/USD USD/JPY GBP/USD AUD/USD USD/CAD
Percentage 23.4% 18.3% 12.7% 7.8% 7.5%
Currency Pair Time Zone² Jul-16 Jun-16 Currency Pair Time Zone² Jul-16 Jun-16 EUR/USD Asia 2.74% 3.49% USD/CNH Asia 0.67% 0.50% Europe 10.36% 9.98% Europe 0.62% 0.70% US 10.29% 11.01% US 0.36% 0.30%
EUR/USD Total 23.38% 24.49% USD/CNH Total 1.65% 1.51% USD/JPY Asia 5.78% 4.82% USD/SGD Asia 0.41% 0.45% Europe 6.77% 4.78% Europe 0.53% 0.60% US 5.79% 5.21% US 0.52% 0.46%
USD/JPY Total 18.34% 14.81% USD/SGD Total 1.45% 1.51% GBP/USD Asia 1.87% 2.40% USD/ZAR Asia 0.05% 0.06% Europe 5.65% 5.66% Europe 0.67% 0.62% US 5.14% 6.56% US 0.62% 0.56%
GBP/USD Total 12.65% 14.61% USD/ZAR Total 1.34% 1.24% AUD/USD Asia 2.34% 2.16% EUR/SEK Asia 0.05% 0.07% Europe 2.79% 2.65% Europe 0.68% 1.04% US 2.68% 2.71% US 0.55% 0.77%
AUD/USD Total 7.81% 7.51% EUR/SEK Total 1.28% 1.89% USD/CAD Asia 0.99% 0.75% EUR/CHF Asia 0.07% 0.16% Europe 2.30% 2.14% Europe 0.54% 0.76% US 4.20% 3.83% US 0.48% 0.74%
USD/CAD Total 7.49% 6.73% EUR/CHF Total 1.09% 1.66% EUR/GBP Asia 0.44% 0.41% EUR/NOK Asia 0.04% 0.05% Europe 1.59% 1.56% Europe 0.52% 0.66% US 1.24% 1.33% US 0.52% 0.51%
EUR/GBP Total 3.26% 3.30% EUR/NOK Total 1.08% 1.22% USD/CHF Asia 0.22% 0.35% USD/TRY Asia 0.06% 0.05% Europe 1.49% 1.39% Europe 0.55% 0.51% US 1.37% 1.46% US 0.46% 0.37%
USD/CHF Total 3.08% 3.20% USD/TRY Total 1.07% 0.93% NZD/USD Asia 0.84% 0.68% GBP/JPY Asia 0.20% 0.18% Europe 1.12% 1.02% Europe 0.37% 0.33% US 1.08% 0.99% US 0.24% 0.33%
NZD/USD Total 3.05% 2.69% GBP/JPY Total 0.81% 0.84% EUR/JPY Asia 0.77% 0.81% XAU/USD Asia 0.27% 0.21% Europe 1.04% 1.27% Europe 0.20% 0.18% US 0.87% 1.02% US 0.28% 0.24%
EUR/JPY Total 2.68% 3.10% XAU/USD Total 0.75% 0.63% USD/MXN Asia 0.09% 0.09% EUR/AUD Asia 0.16% 0.15% Europe 0.53% 0.56% Europe 0.25% 0.29% US 1.55% 1.76% US 0.20% 0.27%
USD/MXN Total 2.17% 2.42% EUR/AUD Total 0.61% 0.71%
Sources: Hotspot, CME Group, EBS/ICAP, Reuters/FXall, FastMatch; Effective June 2016, EBS/ICAP volumes include Spot, Outrights, and Forwards, impacting market share and historical performance comparisons.
Hotspot, July 2016
Notes:
Hotspot daily, monthly, and quarterly volumes are posted on: http://hotspotfx.com/products/hotspot_volumes.jsp. Hotspot volumes represent the
notional value in U.S. dollars of all trades executed on the platform, counting one side of the transaction.
All comparative volume data has been normalized to account for different counting methodologies. Average Daily Volume (ADV) reported by each
platform July not be based on the same number of trading days for a given month due to observed national or bank holidays unique to a given
platform. Hotspot counts each day that the platform is open as a valid trading day.
¹Market Share represents Hotspot volume divided by the total volume of publicly reporting spot FX venues (Hotspot, EBS/ICAP, Reuters/FXall, and
FastMatch). Effective June 2016, EBS/ICAP volumes include Spot, Outrights, and Forwards, impacting market share and historical performance
comparisons.
² EST: Asia: 5pm-2am, Europe: 2am-9am, US: 9am-5pm