Embed Size (px)
Citation preview
1 VITAL STATISTICS REPORT 2015
1234343434232234374 59121342342322847497587112191 Private Bag 0024, Gaborone.
Tel: 3671300 Fax: 3952201 E-mail: [email protected] Website: http://www.statsbots.org.bw
VITAL STATISTICS2015
2 VITAL STATISTICS REPORT 2015
VITAL STATISTICS REPORT 2015
Published by
Statistics BotswanaPrivate bag 0024, Gaborone
Website: www.statsbots.org.bwE-mail: [email protected]
Contact: Crime, Civil and Vital Statistics UnitTel: (267) 3718148Fax: (267) 3952201
(267)3935628
August 2017COPYRIGHT RESERVED
Extracts may be published if sourceIs duly acknowledged
3 VITAL STATISTICS REPORT 2015
3 VITAL STATISTICS REPORT 2015
PrefaceThis is the fifth issue of the Vital Statistics Report produced by the Crime and Vital Statistics unit of Statistics Botswana. The report is intended to provide a quick reference to some basic population indicators as well as the performance of Civil Registration and Vital Statistics (CRVS) in the country.
The report is organized in three parts, i) Births, ii) Marriages and iii) Deaths. Events analysed in the report include all occurrences within the borders of the country irrespective of citi enship. The tables and figures in this publication are based on information collected from registrations of births, deaths, and marriages, as registered by the Department of Civil and National Registration (CNR) in 2015.
The publication is a result of a collaborative effort between Statistics Botswana and the Department of Civil and National Registration of the Ministry of Nationality, Immigration and Gender Affairs. The collaboration has resulted in continual improvement in the quality of vital event data and the quality of this report.
A.N MajelantleStatistician GeneralAugust 2017
A.N MajelantleStatistician General
4 VITAL STATISTICS REPORT 2015
Table of ContentsList of Tables......................................................................................................................................................... 4INTRODUCTION.................................................................................................................................................... 5
1.3 Source.............................................................................................................................................. 6 1.4 Coverage........................................................................................................................................ 6 2.0 Births................................................................................................................................................. 7 Summary Table..................................................................................................................................... 7 2.1. Birth Registration............................................................................................................................ 7 2.2 Trends In Births Registration........................................................................................................... 8 2.3 Recorded Live Births....................................................................................................................... 8 2.4 Sex Of The Child.............................................................................................................................. 9 2.5 Registered Live Births By Place Of Occurrence And Place Of Residence................................ 9 2.6 Age Of Mother................................................................................................................................. 11 2.7 Month Of Occurrence And Registration....................................................................................... 12 2.8 Place Of Birth................................................................................................................................... 12 2.9 Marital Status Of The Mother.......................................................................................................... 133.0 Marriages....................................................................................................................................................... 14
3.1 Trends In Marriages (2005-2015).................................................................................................... 14 3.2 District Of Registration..................................................................................................................... 15 3.3 Month Of Registration..................................................................................................................... 15 3.4 Type Of Marriage............................................................................................................................ 16 3.5 Age At The Time Of Marriage......................................................................................................... 16 3.6 Registered Marriages And Occupation........................................................................................ 18 3.7 Previous Marital Status.................................................................................................................... 19 3.8 First Marriages And Re-Marriages................................................................................................. 19 3.9 Crude Marriage Rate...................................................................................................................... 204.0 DEATHS............................................................................................................................................................ 21
4.1 Death Registration........................................................................................................................... 21 4.2 Timely And Late Deaths Registration............................................................................................. 22 4.2 Registered Deaths By Age And Sex.............................................................................................. 22 4.3 Registered Deaths By Sex Of The Deceased................................................................................ 24 4.5 Centre Of Registration ....................................................................................................... ... 25 4.7 Place Of Death Occurrence, Marital Status And Educational Level.......................................... 25
5 VITAL STATISTICS REPORT 2015
Table B1: Live births by district of birth and place of usual residence of mother- 2015 ……......................27Table B2: Live births by place of usual residence and age of the mother-2015………………....................28 Table B3: Live births by district of birth and Sex of the child-2015…………………………………...................29 Table B4: Live births by Place of Birth and District of Birth-2015……………………….…………......................30Table B5: Live births by Centre of Registration and Time of Birth-2015……………………………..................31 Table B6: Live births by month of birth and Sex-2015………….……………………………………....................32Table B7 : Live births by mother’s age group and marital status-2015……………………………...................33 Table B8 : Live births by District of Residence and age group of Mother-2015……………….................... 34Table M1: A summary of marriages-2006-2015……………………………………………………….....................35Table M2: Age in combination at marriage time-2015……………………………………………......................36Table M3: Age at marriage by previous marital status and sex-2015……………………………....................36Table M4: Male age by District of Residence at the time of marriage-2015……………………...................37 Table M5: Female age by District of Residence at the time of marriage-2015………………….................. 38 Table M6: Previous marital status of person marrying-2005-2015………………………………........................39Table D1: Deaths by occurrence district of usual residence and sex……………………………....................40Table D2: Registered deaths by district of occurrence, time of registration and sex of deceaed-2015……………………………………………………………………….................................41Table D3 Registered deaths by time of registration and registration centers -2015…................................42Table D4: Registered deaths by time of registration, age and sex of deceased-2015…........................... 43 Table D5: Registered Deaths by district of death occurrence and district of usual living –2015................44Table D6 Registered deaths by district of usual living and time of registration-2015….............................. 45 Table D7 Age Specific Death Rates - 2015 ……………………………………………………................. 46 Table D8 Deaths registration by month of occurrence, time of registration and sex-2015……………… 47 Table D9: Registered deaths by time of registration, place of death, marital status and level of education of deceased – 2015…………………………………………….......................48
List of Tables
6 VITAL STATISTICS REPORT 2015
INTRODUCTION
The main sources of vital statistics are the civil registration system, population and housing census, and household sample surveys. The Department of Civil and National Registration is mandated with registration of all vital events in the country and is thus the custodian of the civil registration system. One of the main advantages of vital statistics generated from an effective civil registration system is that its intended coverage is of all such events and hence would not be affected by sampling errors that estimates from surveys are subjected to. The Botswana civil registration system has been assessed to be one of the best in Africa as testified by it having been given the Champion for the development of Civil Registration Award on the African Continent on the 27th November 2015 by the 11th Africa Symposia for Statistical Development (ASSD) at Libreville Gabon. By its nature the civil registration system makes it possible to generate the reliable statistics at sub-national level which is often a challenge when survey data is used.
There is usually an interval between the occurrence and registration of an event and as a result, some events occurring in one year are not registered until the following year or later. This can be caused by either a delay by the parent(s) or next of kin in submitting a completed form to the registry, or a delay by the registry in processing the event. Events which occur in November and December are also likely to be registered in the following year. A cut off point has been decided to the effect that events that occurred in a given year and registered in the subsequent year within the given grace period (30 days and 60 days for deaths and births respectively) be included in the tabulation.
Birth, Death and Marriage registration data is used for statistical purposes in that it is the source of national fertility and mortality and nuptial indicators. Indicators such as crude birth rate, total fertility rate, mean age at birth, nuptial births, marriage rate, mean age at marriage and infant mortality, under five mortality and Crude death rates are produced.
1.3 Source Administrative data on births, deaths and marriages is obtained from the Department of Civil and National Registration (DCNR) of the Ministry of Nationality, Immigration and Gender Affairs (MNIGA). The data for births and deaths is obtained electronically from the DCNR while marriage data is extracted manually from the marriage certificates filed with the Department. The data is then processed by the Crime, Civil and Vital Statistics Unit of Statistics Botswana for the production of vital statistics report.
1.4 CoverageBirths and deaths analysed in this report are vital events that occurred and were registered in 2015, occurred in 2015 and registered in the subsequent year, within the given grace period, and those that occurred in the earlier years but registered in 2015. It includes births, deaths and marriages occurring to citizens and non-citizens within the borders of the country. It also includes both institutional and non-institutional births and deaths. On the other hand, marriages analysed in this report are those solemnized in Botswana for each calendar year by either the District Commissioner or church minister appointed by the Minister of Nationality, Immigration and Gender Affairs as marriage officer.
7 VITAL STATISTICS REPORT 2015
2011 2012 2013 2014 2015
Live Births Male number 19,748 20,738 22,732 21,142 23,413
Female number 19,620 20,118 22062 20,599 23,352
Total (registered) number 39,368 40,856 44,794 41,741 46,765
Total Population (projections) Number 2,024,904 2,068,529 2,110,050 2,149,255 2,185,903
Births (projected)1 Number 58,004* 55,859* 53,495* 50,924* 48,159
CBR (using registered births) Rate 19.4 19.7 21.2 19.4 21.4
CBR (using projected births) Rate 28.6 27 25.4 23.7 22
Sex ratio ratio 100.7 103.1 103.3 102.6 100.3
Nuptial births Percent 23.2 23 22.5 23.6 21.8
Ex-nuptial births Percent 76.8 77 77.5 76.4 78.2
Mean age of mother at birth years 27.3 27.3 27.3 27.6 28.32
Birth registration Percent 67.9 73.1 83.7 82 97.1
Health facility deliveries Percent 99.3 99.7 99.2 99.5 99.5
NB: The figures in the table above refer to registered births that occurred in the given year.1 low variant scenario projections 2011-2026 were used for years 2012 -2015Ex-nuptial birth includes births to never married, widows and the divorced.*Births readjusted according to the population projections 2011-2026
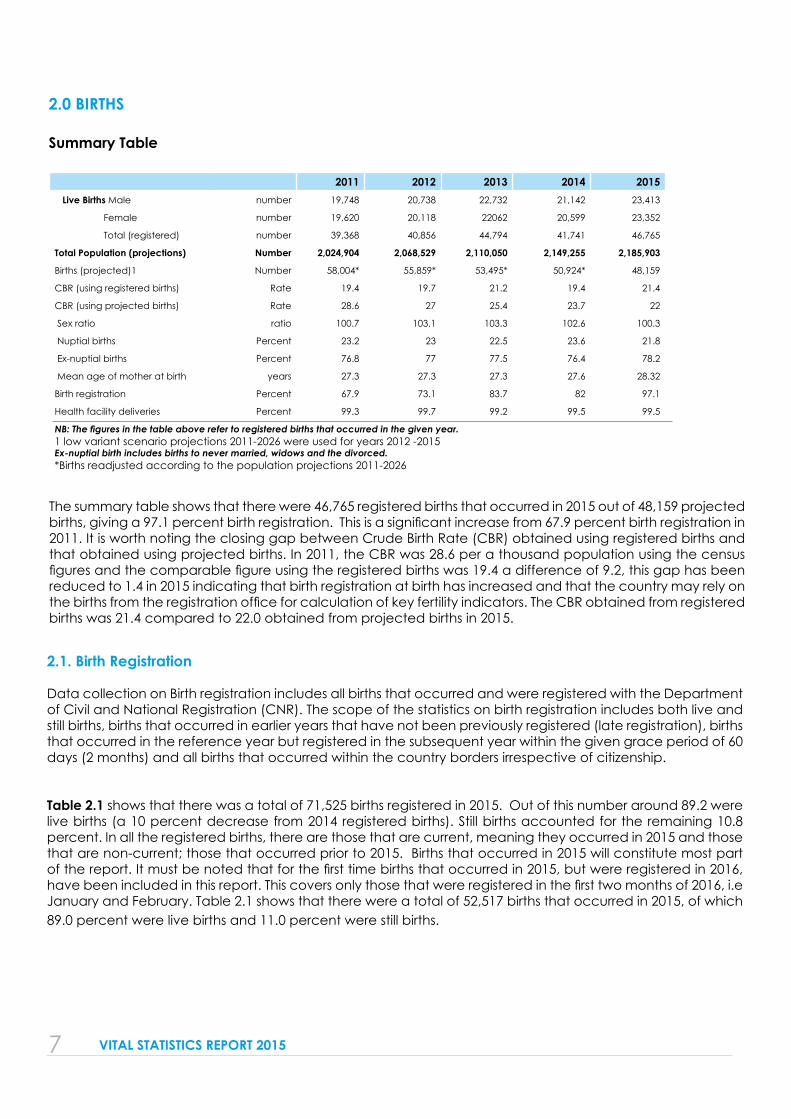
2.0 BIRTHS Summary Table
The summary table shows that there were 46,765 registered births that occurred in 2015 out of 48,159 projected births, giving a 97.1 percent birth registration. This is a significant increase from 67.9 percent birth registration in 2011. It is worth noting the closing gap between Crude Birth Rate (CBR) obtained using registered births and that obtained using projected births. In 2011, the CBR was 28.6 per a thousand population using the census figures and the comparable figure using the registered births was 19.4 a difference of 9.2, this gap has been reduced to 1.4 in 2015 indicating that birth registration at birth has increased and that the country may rely on the births from the registration office for calculation of key fertility indicators. The CBR obtained from registered births was 21.4 compared to 22.0 obtained from projected births in 2015.
2.1. Birth Registration
Data collection on Birth registration includes all births that occurred and were registered with the Department of Civil and National Registration (CNR). The scope of the statistics on birth registration includes both live and still births, births that occurred in earlier years that have not been previously registered (late registration), births that occurred in the reference year but registered in the subsequent year within the given grace period of 60 days (2 months) and all births that occurred within the country borders irrespective of citizenship.
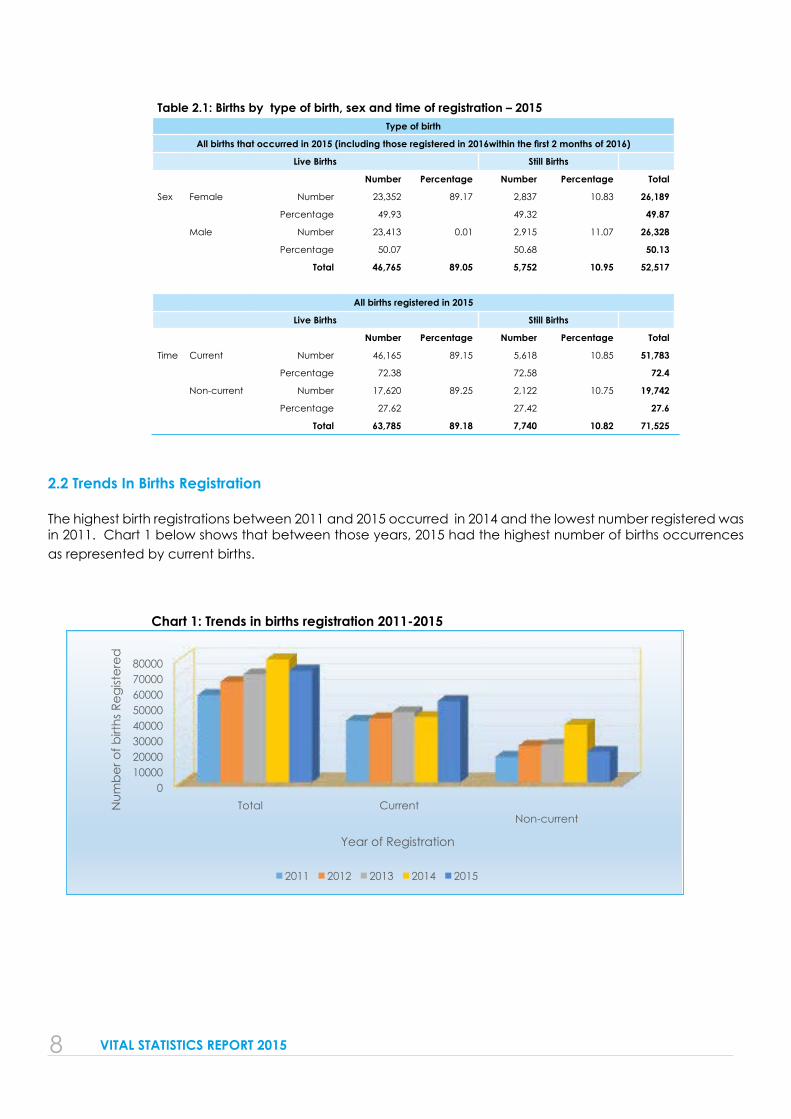
Table 2.1 shows that there was a total of 71,525 births registered in 2015. Out of this number around 89.2 were live births (a 10 percent decrease from 2014 registered births). Still births accounted for the remaining 10.8 percent. In all the registered births, there are those that are current, meaning they occurred in 2015 and those that are non-current; those that occurred prior to 2015. Births that occurred in 2015 will constitute most part of the report. It must be noted that for the first time births that occurred in 2015, but were registered in 2016, have been included in this report. This covers only those that were registered in the first two months of 2016, i.e January and February. Table 2.1 shows that there were a total of 52,517 births that occurred in 2015, of which 89.0 percent were live births and 11.0 percent were still births.
8 VITAL STATISTICS REPORT 2015
Table 2.1: Births by type of birth, sex and time of registration – 2015 Type of birth
All births that occurred in 2015 (including those registered in 2016within the first 2 months of 2016)
Live Births Still Births
Number Percentage Number Percentage Total
Sex Female Number 23,352 89.17 2,837 10.83 26,189
Percentage 49.93 49.32 49.87
Male Number 23,413 0.01 2,915 11.07 26,328
Percentage 50.07 50.68 50.13
Total 46,765 89.05 5,752 10.95 52,517
All births registered in 2015
Live Births Still Births
Number Percentage Number Percentage Total
Time Current Number 46,165 89.15 5,618 10.85 51,783
Percentage 72.38 72.58 72.4
Non-current Number 17,620 89.25 2,122 10.75 19,742
Percentage 27.62 27.42 27.6
Total 63,785 89.18 7,740 10.82 71,525
2.2 Trends In Births Registration
The highest birth registrations between 2011 and 2015 occurred in 2014 and the lowest number registered was in 2011. Chart 1 below shows that between those years, 2015 had the highest number of births occurrences as represented by current births.
Chart 1: Trends in births registration 2011-2015
0 10000 20000 30000 40000 50000 60000 70000 80000
Total Current Non-current
Num
ber o
f birt
hs R
egist
ered
Year of Registration
2011 2012 2013 2014 2015
9 VITAL STATISTICS REPORT 2015
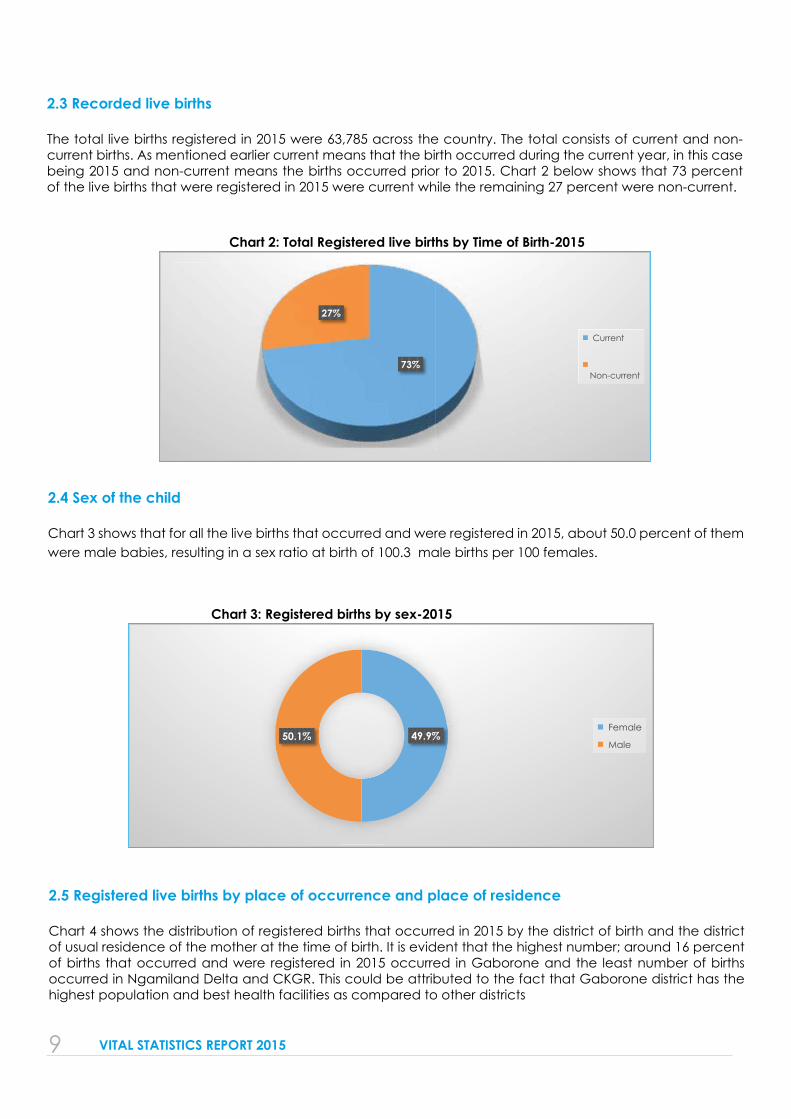
2.3 Recorded live births
The total live births registered in 2015 were 63,785 across the country. The total consists of current and non-current births. As mentioned earlier current means that the birth occurred during the current year, in this case being 2015 and non-current means the births occurred prior to 2015. Chart 2 below shows that 73 percent of the live births that were registered in 2015 were current while the remaining 27 percent were non-current.
Chart 2: Total Registered live births by Time of Birth-2015
2.4 Sex of the child
Chart 3 shows that for all the live births that occurred and were registered in 2015, about 50.0 percent of them were male babies, resulting in a sex ratio at birth of 100.3 male births per 100 females.
Chart 3: Registered births by sex-2015
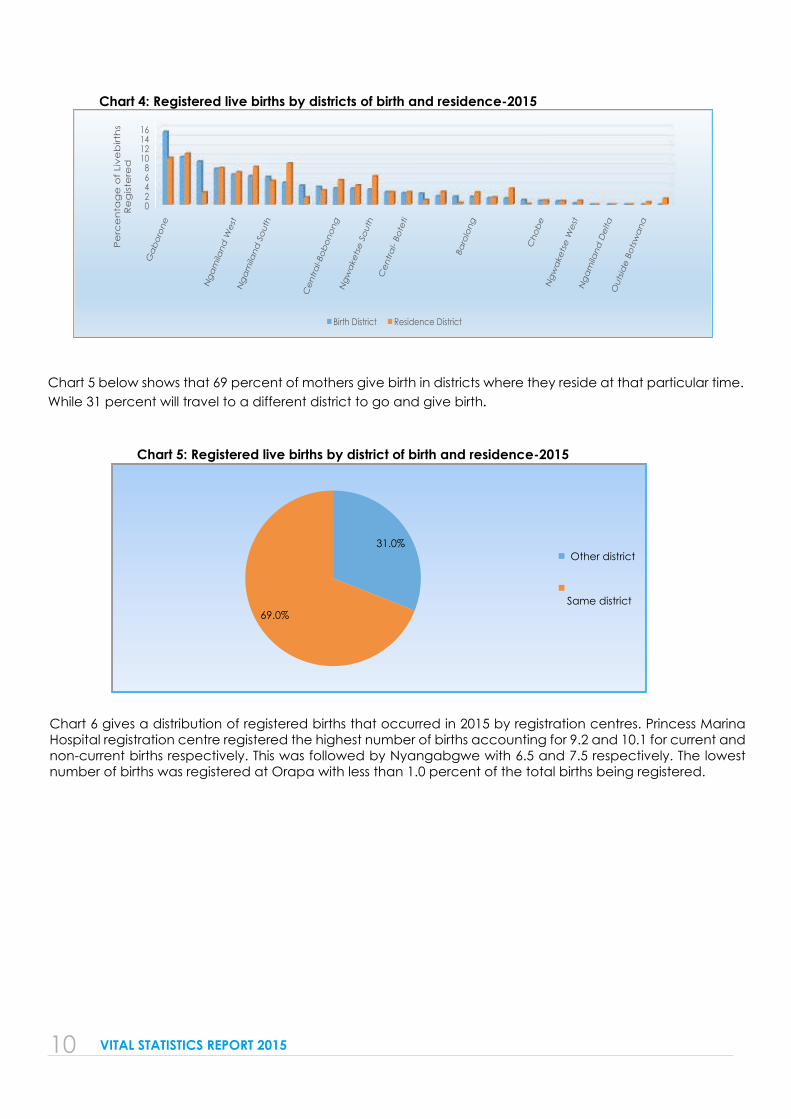
2.5 Registered live births by place of occurrence and place of residence
Chart 4 shows the distribution of registered births that occurred in 2015 by the district of birth and the district of usual residence of the mother at the time of birth. It is evident that the highest number; around 16 percent of births that occurred and were registered in 2015 occurred in Gaborone and the least number of births occurred in Ngamiland Delta and CKGR. This could be attributed to the fact that Gaborone district has the highest population and best health facilities as compared to other districts
73%
27%
Current
Non-current
49.9% 50.1% Female
Male
10 VITAL STATISTICS REPORT 2015
Chart 4: Registered live births by districts of birth and residence-2015
Chart 5 below shows that 69 percent of mothers give birth in districts where they reside at that particular time. While 31 percent will travel to a different district to go and give birth.
Chart 5: Registered live births by district of birth and residence-2015
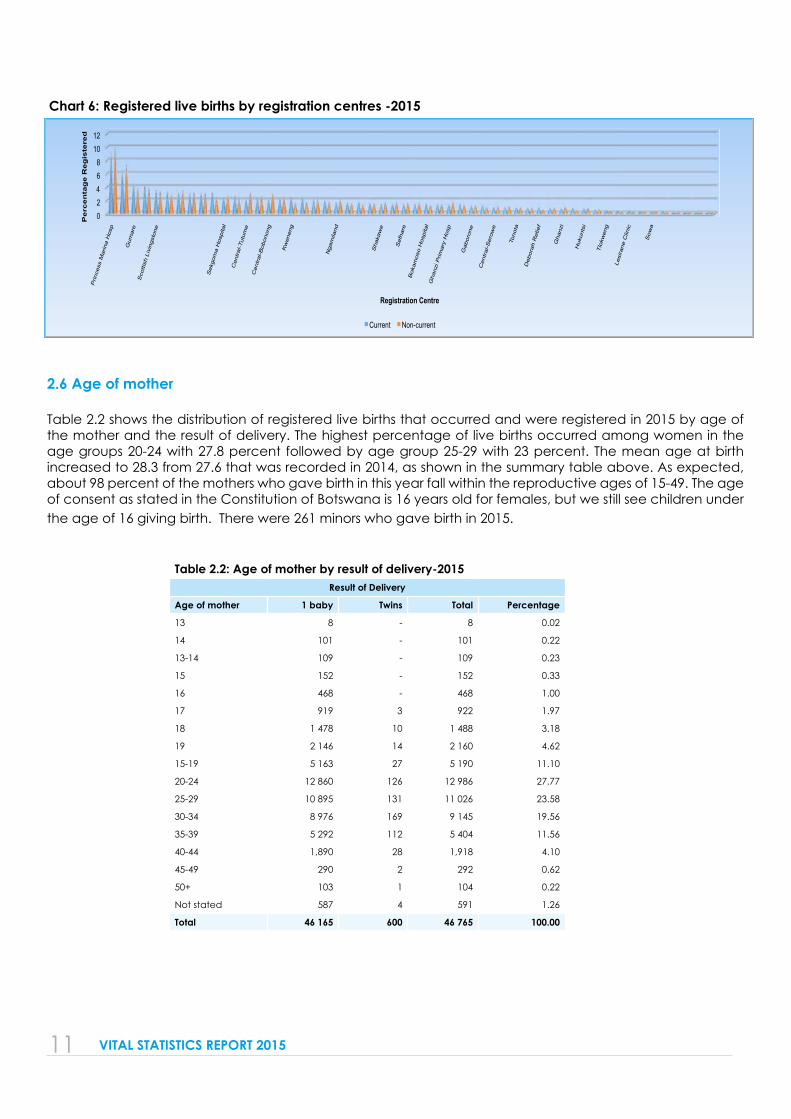
Chart 6 gives a distribution of registered births that occurred in 2015 by registration centres. Princess Marina Hospital registration centre registered the highest number of births accounting for 9.2 and 10.1 for current and non-current births respectively. This was followed by Nyangabgwe with 6.5 and 7.5 respectively. The lowest number of births was registered at Orapa with less than 1.0 percent of the total births being registered.
0 2 4 6 8
10 12 14 16
Ga
bor
one
Fra
ncist
own
Ng
am
iland
Wes
t N
ga
mila
nd S
outh
Selib
e-Ph
ikw
e C
entra
l-Bob
onon
g
Ng
wa
kets
e So
uth
Cen
tral-
Bote
ti Kw
enen
g W
est
Baro
long
Nor
th E
ast
Cho
be
Ng
wa
kets
e W
est
Ng
am
iland
Del
ta
Out
side
Bots
wa
na
Pe
rce
nta
ge
of
Live
birt
hs
Re
gis
tere
d
Birth District Residence District
31.0%
69.0%
Other district
Same district
11 VITAL STATISTICS REPORT 2015
Chart 6: Registered live births by registration centres -2015
2.6 Age of mother
Table 2.2 shows the distribution of registered live births that occurred and were registered in 2015 by age of the mother and the result of delivery. The highest percentage of live births occurred among women in the age groups 20-24 with 27.8 percent followed by age group 25-29 with 23 percent. The mean age at birth increased to 28.3 from 27.6 that was recorded in 2014, as shown in the summary table above. As expected, about 98 percent of the mothers who gave birth in this year fall within the reproductive ages of 15-49. The age of consent as stated in the Constitution of Botswana is 16 years old for females, but we still see children under the age of 16 giving birth. There were 261 minors who gave birth in 2015.
Table 2.2: Age of mother by result of delivery-2015Result of Delivery
Age of mother 1 baby Twins Total Percentage
13 8 - 8 0.02
14 101 - 101 0.22
13-14 109 - 109 0.23
15 152 - 152 0.33
16 468 - 468 1.00
17 919 3 922 1.97
18 1 478 10 1 488 3.18
19 2 146 14 2 160 4.62
15-19 5 163 27 5 190 11.10
20-24 12 860 126 12 986 27.77
25-29 10 895 131 11 026 23.58
30-34 8 976 169 9 145 19.56
35-39 5 292 112 5 404 11.56
40-44 1,890 28 1,918 4.10
45-49 290 2 292 0.62
50+ 103 1 104 0.22
Not stated 587 4 591 1.26
Total 46 165 600 46 765 100.00
0 2 4 6 8
10 12
Prin
cess
Mar
ina
Hos
p
Gum
are
Sco
ttish
Liv
ings
tone
Sel
ebi-P
hikw
e
Bro
adhu
rst
Sek
gom
a H
ospi
tal
Cen
tral
-Tut
ume
Cen
tral
-Bob
onon
g
Kw
enen
g
Fra
ncis
tow
n
Nga
mila
nd
Letlh
aken
g
Sha
kaw
e
Sef
hare
B
okam
oso
Hos
pita
l G
hanz
i Prim
ary
Hos
p
Gab
oron
e C
entr
al-S
erow
e
Ton
ota
Deb
orah
Ret
ief
Gha
nzi
Huk
unts
i
Tlo
kwen
g L
esira
ne C
linic
Sow
a
Hea
dqua
rter
s
Mog
odits
hane
Pe
rce
nta
ge
Re
gis
tere
d
Registration Centre
Current Non-current
12 VITAL STATISTICS REPORT 2015
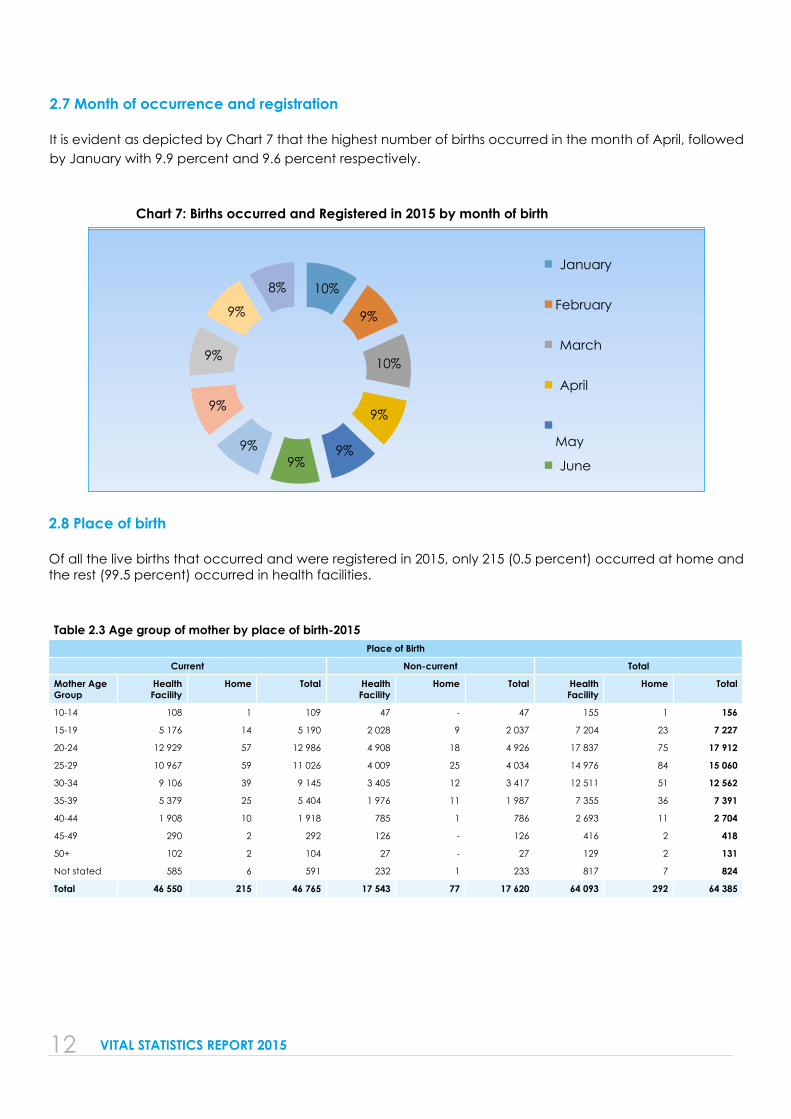
2.7 Month of occurrence and registration
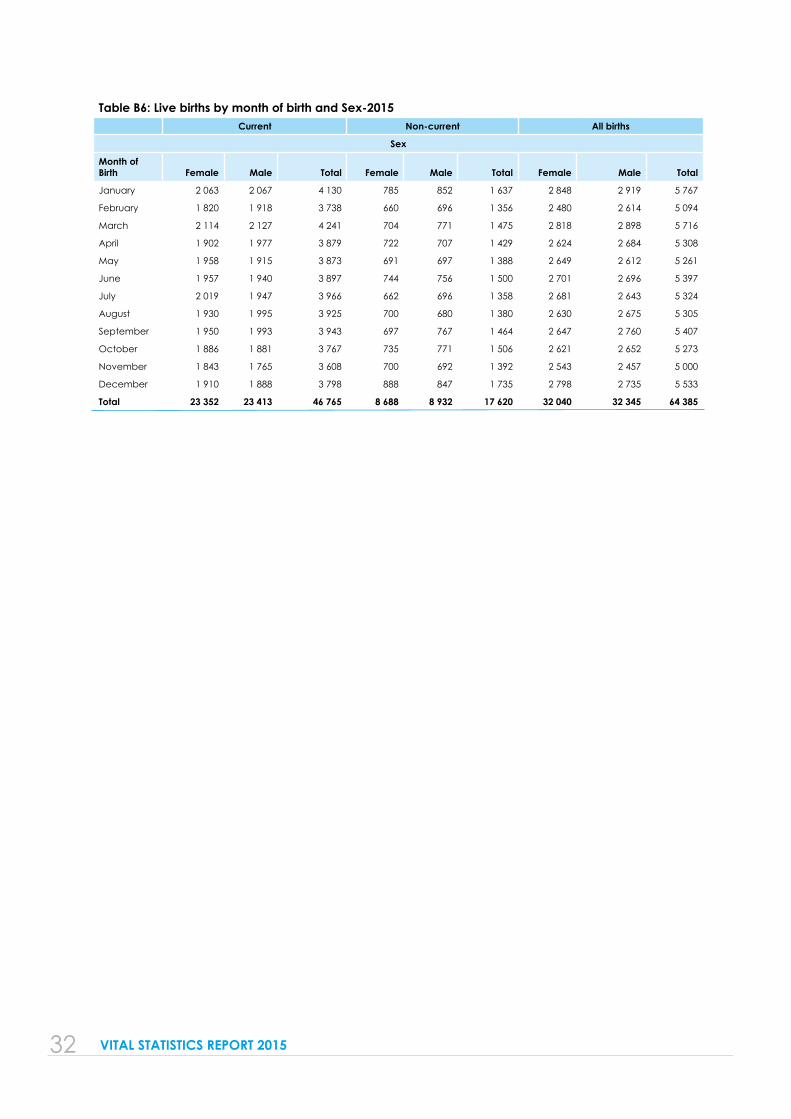
It is evident as depicted by Chart 7 that the highest number of births occurred in the month of April, followed by January with 9.9 percent and 9.6 percent respectively.
Chart 7: Births occurred and Registered in 2015 by month of birth
2.8 Place of birth
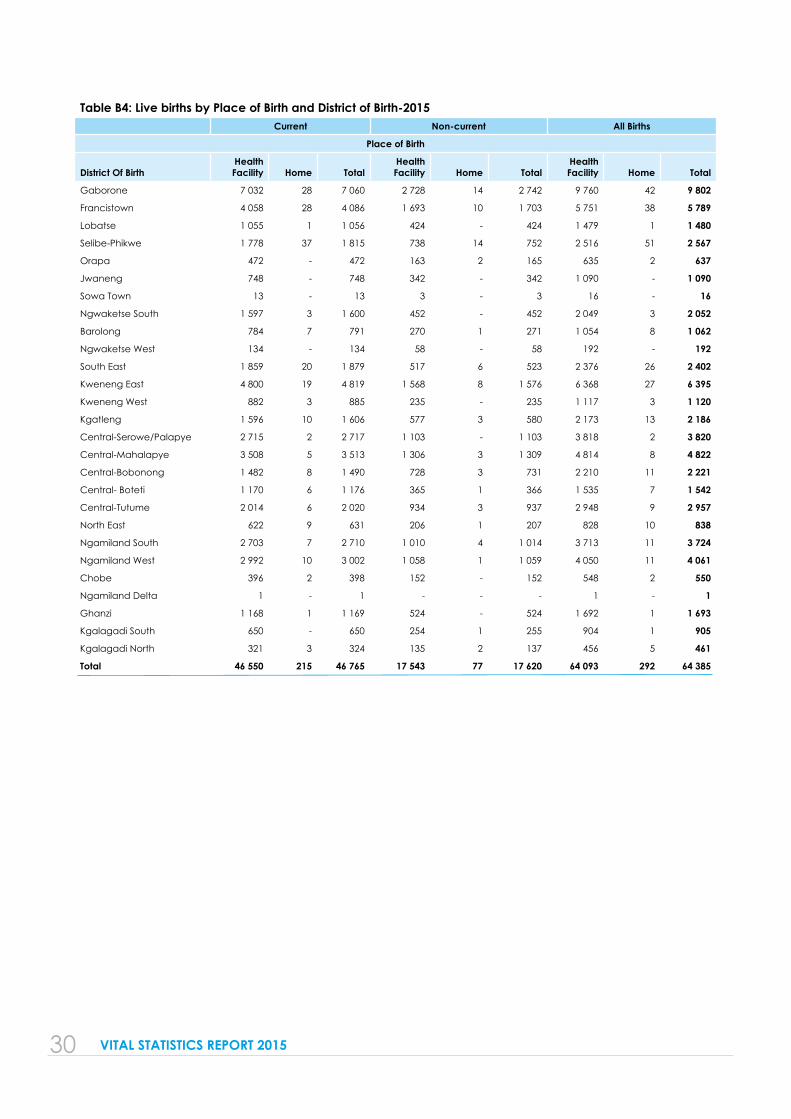
Of all the live births that occurred and were registered in 2015, only 215 (0.5 percent) occurred at home and the rest (99.5 percent) occurred in health facilities.
Table 2.3 Age group of mother by place of birth-2015Place of Birth
Current Non-current Total
Mother Age Group
Health Facility
Home Total Health Facility
Home Total Health Facility
Home Total
10-14 108 1 109 47 - 47 155 1 156
15-19 5 176 14 5 190 2 028 9 2 037 7 204 23 7 227
20-24 12 929 57 12 986 4 908 18 4 926 17 837 75 17 912
25-29 10 967 59 11 026 4 009 25 4 034 14 976 84 15 060
30-34 9 106 39 9 145 3 405 12 3 417 12 511 51 12 562
35-39 5 379 25 5 404 1 976 11 1 987 7 355 36 7 391
40-44 1 908 10 1 918 785 1 786 2 693 11 2 704
45-49 290 2 292 126 - 126 416 2 418
50+ 102 2 104 27 - 27 129 2 131
Not stated 585 6 591 232 1 233 817 7 824
Total 46 550 215 46 765 17 543 77 17 620 64 093 292 64 385
10%
9%
10%
9%
9% 9%
9%
9%
9%
9%
8%
January
February
March
April
May
June
13 VITAL STATISTICS REPORT 2015
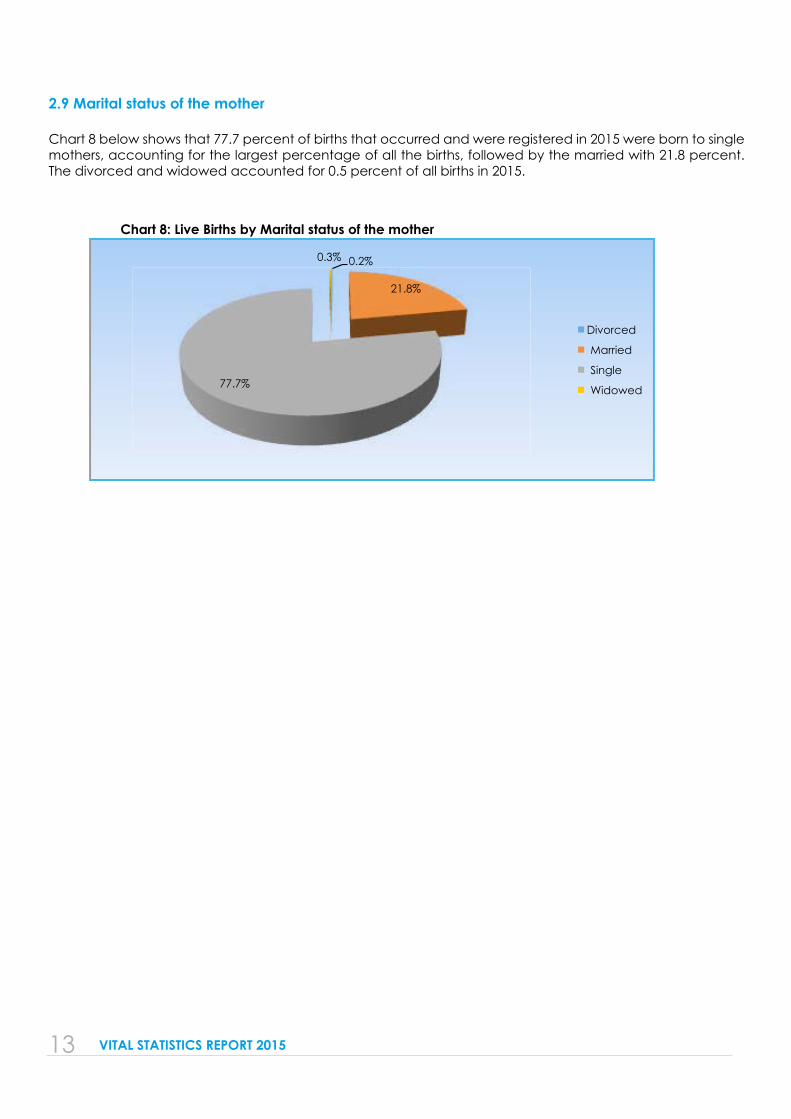
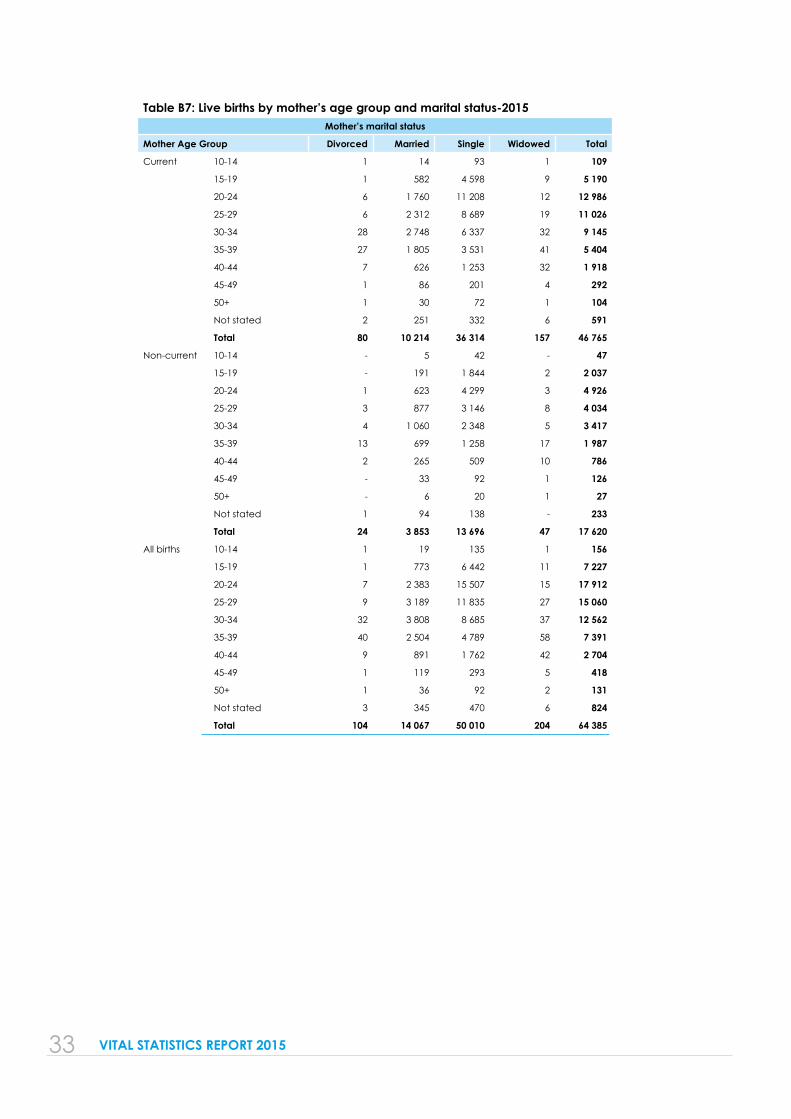
2.9 Marital status of the mother
Chart 8 below shows that 77.7 percent of births that occurred and were registered in 2015 were born to single mothers, accounting for the largest percentage of all the births, followed by the married with 21.8 percent. The divorced and widowed accounted for 0.5 percent of all births in 2015.
Chart 8: Live Births by Marital status of the mother
0.2%
21.8%
77.7%
0.3%
Divorced
Married
Single
Widowed
14 VITAL STATISTICS REPORT 2015
3.0 MARRIAGES
Marriage is an event which is regulated by statute and about which information is collected for legal and statistical purposes. The Department of Civil and National Registration (CNR) is responsible for data collection through the registration service of vital events. It must be noted that this publication covers only marriages that have been registered with the CNR, customary and cultural marriages have not been included.
This section includes time series table of marriages that occurred from 2005 to 2015. It also includes tables on age at marriage, previous marital status, profession of both the groom and bride and the district of marriage.
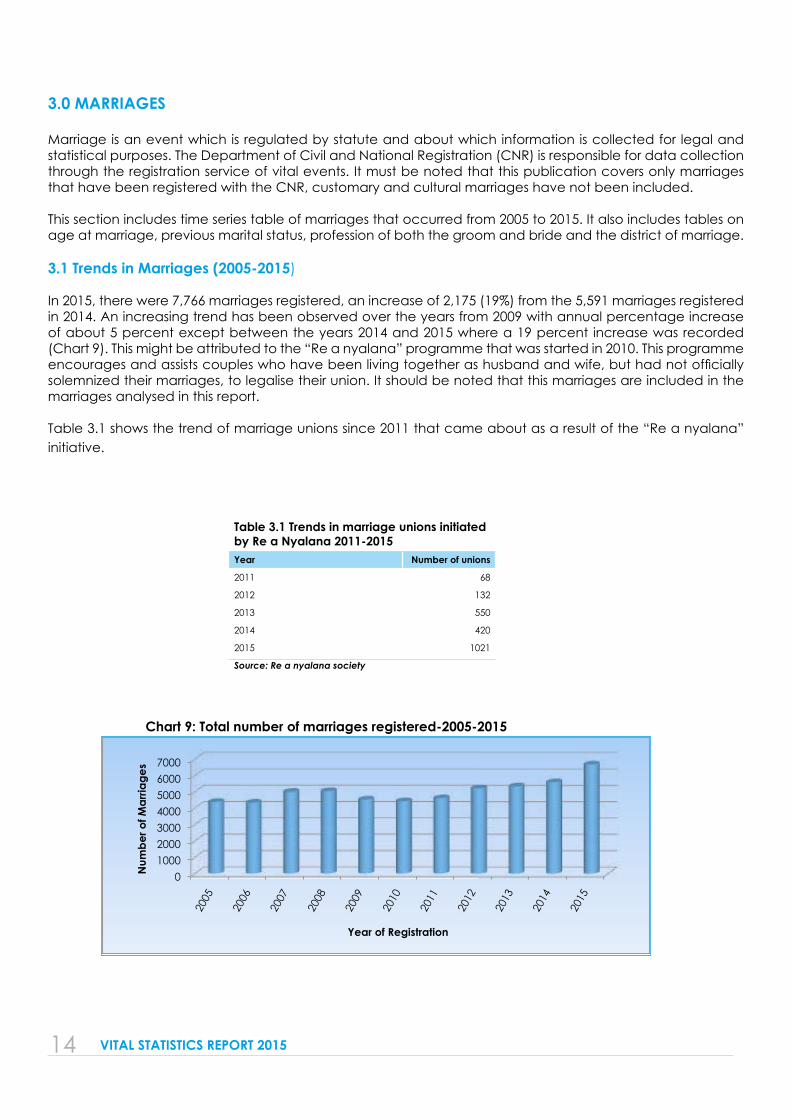
3.1 Trends in Marriages (2005-2015)
In 2015, there were 7,766 marriages registered, an increase of 2,175 (19%) from the 5,591 marriages registered in 2014. An increasing trend has been observed over the years from 2009 with annual percentage increase of about 5 percent except between the years 2014 and 2015 where a 19 percent increase was recorded (Chart 9). This might be attributed to the “Re a nyalana” programme that was started in 2010. This programme encourages and assists couples who have been living together as husband and wife, but had not officially solemnized their marriages, to legalise their union. It should be noted that this marriages are included in the marriages analysed in this report.
Table 3.1 shows the trend of marriage unions since 2011 that came about as a result of the “Re a nyalana” initiative.
Table 3.1 Trends in marriage unions initiated by Re a Nyalana 2011-2015Year Number of unions
2011 68
2012 132
2013 550
2014 420
2015 1021
Source: Re a nyalana society
Chart 9: Total number of marriages registered-2005-2015
0 1000 2000 3000 4000 5000 6000 7000
200
5
200
6
200
7
200
8
200
9
201
0
201
1
201
2
201
3
201
4
201
5
Num
ber o
f Mar
riage
s
Year of Registration
15 VITAL STATISTICS REPORT 2015
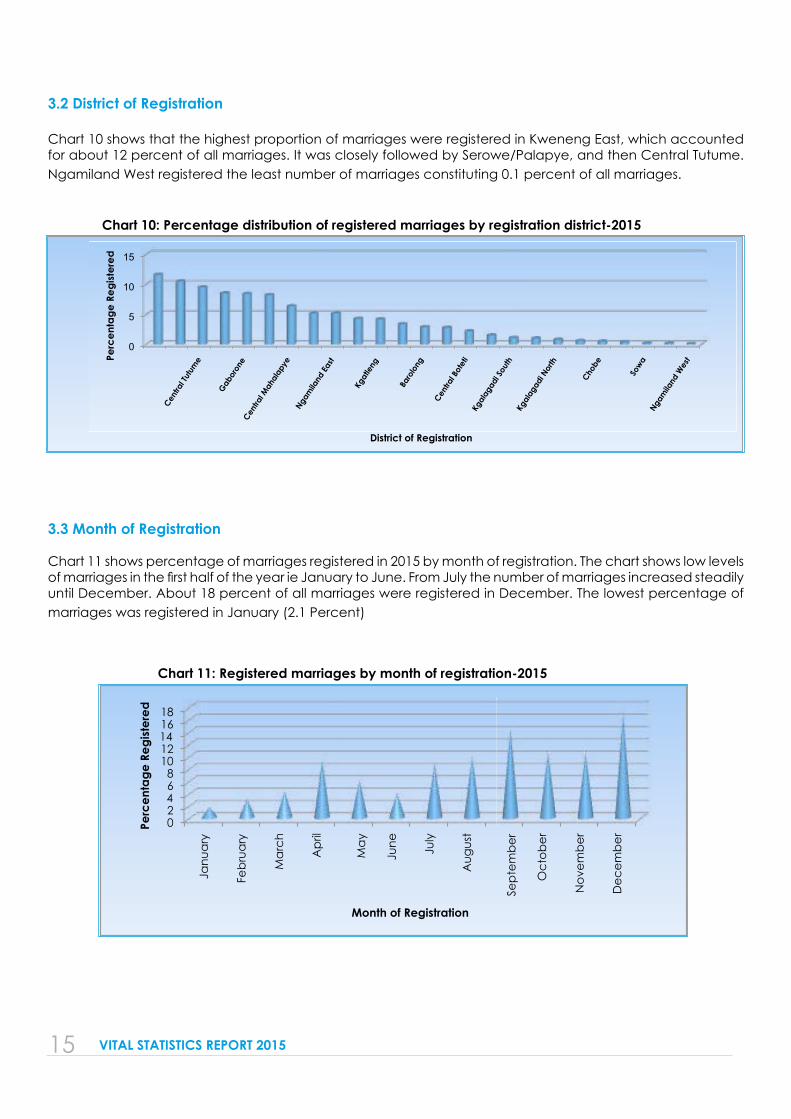
3.2 District of Registration
Chart 10 shows that the highest proportion of marriages were registered in Kweneng East, which accounted for about 12 percent of all marriages. It was closely followed by Serowe/Palapye, and then Central Tutume. Ngamiland West registered the least number of marriages constituting 0.1 percent of all marriages.
Chart 10: Percentage distribution of registered marriages by registration district-2015
3.3 Month of Registration
Chart 11 shows percentage of marriages registered in 2015 by month of registration. The chart shows low levels of marriages in the first half of the year ie January to June. From July the number of marriages increased steadily until December. About 18 percent of all marriages were registered in December. The lowest percentage of marriages was registered in January (2.1 Percent)
Chart 11: Registered marriages by month of registration-2015
0
5
10
15
Kwen
eng
East
Cen
tral T
utum
e
Gabor
one
Cen
tral M
ahal
apye
N
gam
iland
East
Kgat
leng
Baro
long
C
entra
l Bot
eti
Kga
laga
di So
uth
Kga
laga
di N
orth
Cho
be
Sowa
Nga
mila
nd W
est Pe
rcen
tage
Reg
ister
ed
District of Registration
0 2 4 6 8
10 12 14 16 18
Jan
uary
Febr
uary
Mar
ch
Apr
il
May
Jun
e
Jul
y
Aug
ust
Sept
embe
r
Oct
ober
Nov
embe
r
Dec
embe
r Perc
enta
ge R
egist
ered
Month of Registration
16 VITAL STATISTICS REPORT 2015
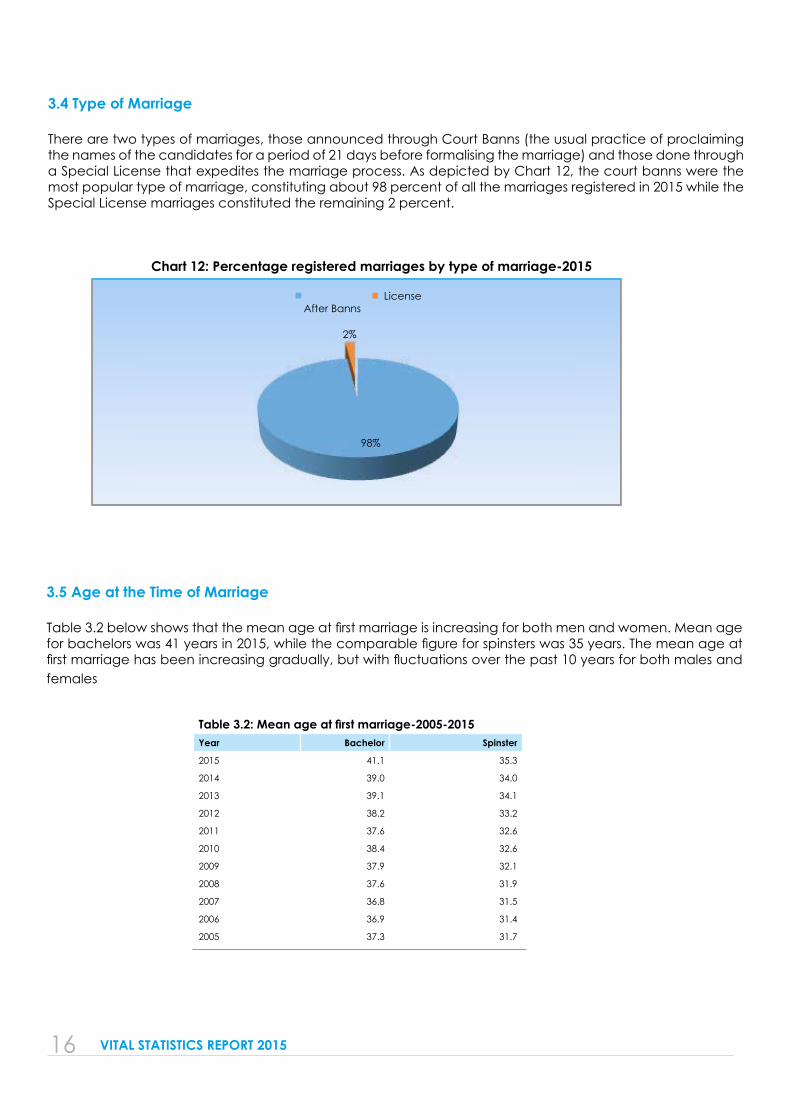
3.4 Type of Marriage
There are two types of marriages, those announced through Court Banns (the usual practice of proclaiming the names of the candidates for a period of 21 days before formalising the marriage) and those done through a Special License that expedites the marriage process. As depicted by Chart 12, the court banns were the most popular type of marriage, constituting about 98 percent of all the marriages registered in 2015 while the Special License marriages constituted the remaining 2 percent.
3.5 Age at the Time of Marriage
Table 3.2 below shows that the mean age at first marriage is increasing for both men and women. Mean age for bachelors was 41 years in 2015, while the comparable figure for spinsters was 35 years. The mean age at first marriage has been increasing gradually, but with fluctuations over the past 10 years for both males and females
Chart 12: Percentage registered marriages by type of marriage-2015
Table 3.2: Mean age at first marriage-2005-2015Year Bachelor Spinster
2015 41.1 35.3
2014 39.0 34.0
2013 39.1 34.1
2012 38.2 33.2
2011 37.6 32.6
2010 38.4 32.6
2009 37.9 32.1
2008 37.6 31.9
2007 36.8 31.5
2006 36.9 31.4
2005 37.3 31.7
98%
2%
After Banns License
17 VITAL STATISTICS REPORT 2015
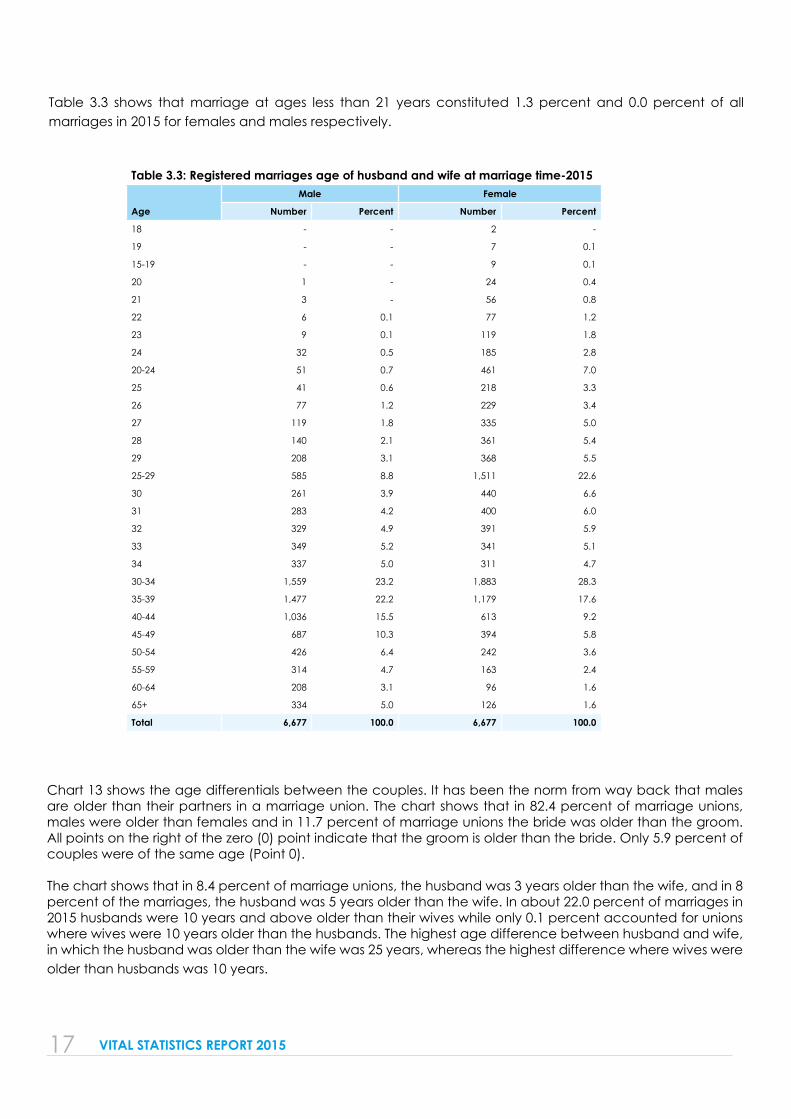
Table 3.3 shows that marriage at ages less than 21 years constituted 1.3 percent and 0.0 percent of all marriages in 2015 for females and males respectively.
Table 3.3: Registered marriages age of husband and wife at marriage time-2015
Age
Male Female
Number Percent Number Percent
18 - - 2 -
19 - - 7 0.1
15-19 - - 9 0.1
20 1 - 24 0.4
21 3 - 56 0.8
22 6 0.1 77 1.2
23 9 0.1 119 1.8
24 32 0.5 185 2.8
20-24 51 0.7 461 7.0
25 41 0.6 218 3.3
26 77 1.2 229 3.4
27 119 1.8 335 5.0
28 140 2.1 361 5.4
29 208 3.1 368 5.5
25-29 585 8.8 1,511 22.6
30 261 3.9 440 6.6
31 283 4.2 400 6.0
32 329 4.9 391 5.9
33 349 5.2 341 5.1
34 337 5.0 311 4.7
30-34 1,559 23.2 1,883 28.3
35-39 1,477 22.2 1,179 17.6
40-44 1,036 15.5 613 9.2
45-49 687 10.3 394 5.8
50-54 426 6.4 242 3.6
55-59 314 4.7 163 2.4
60-64 208 3.1 96 1.6
65+ 334 5.0 126 1.6
Total 6,677 100.0 6,677 100.0
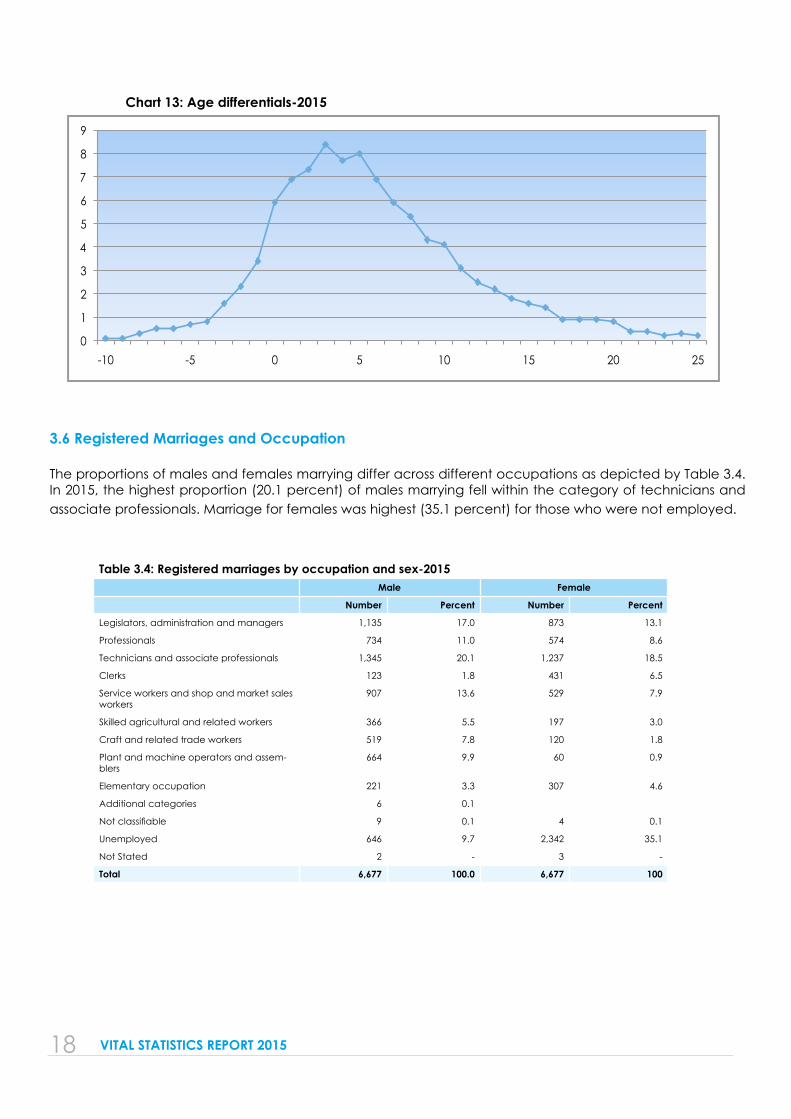
Chart 13 shows the age differentials between the couples. It has been the norm from way back that males are older than their partners in a marriage union. The chart shows that in 82.4 percent of marriage unions, males were older than females and in 11.7 percent of marriage unions the bride was older than the groom. All points on the right of the zero (0) point indicate that the groom is older than the bride. Only 5.9 percent of couples were of the same age (Point 0).
The chart shows that in 8.4 percent of marriage unions, the husband was 3 years older than the wife, and in 8 percent of the marriages, the husband was 5 years older than the wife. In about 22.0 percent of marriages in 2015 husbands were 10 years and above older than their wives while only 0.1 percent accounted for unions where wives were 10 years older than the husbands. The highest age difference between husband and wife, in which the husband was older than the wife was 25 years, whereas the highest difference where wives were older than husbands was 10 years.
18 VITAL STATISTICS REPORT 2015
Chart 13: Age differentials-2015
3.6 Registered Marriages and Occupation
The proportions of males and females marrying differ across different occupations as depicted by Table 3.4. In 2015, the highest proportion (20.1 percent) of males marrying fell within the category of technicians and associate professionals. Marriage for females was highest (35.1 percent) for those who were not employed.
Table 3.4: Registered marriages by occupation and sex-2015Male Female
Number Percent Number Percent
Legislators, administration and managers 1,135 17.0 873 13.1
Professionals 734 11.0 574 8.6
Technicians and associate professionals 1,345 20.1 1,237 18.5
Clerks 123 1.8 431 6.5
Service workers and shop and market sales workers
907 13.6 529 7.9
Skilled agricultural and related workers 366 5.5 197 3.0
Craft and related trade workers 519 7.8 120 1.8
Plant and machine operators and assem-blers
664 9.9 60 0.9
Elementary occupation 221 3.3 307 4.6
Additional categories 6 0.1
Not classifiable 9 0.1 4 0.1
Unemployed 646 9.7 2,342 35.1
Not Stated 2 - 3 -
Total 6,677 100.0 6,677 100
0
1
2
3
4
5
6
7
8
9
-10 -5 0 5 10 15 20 25
19 VITAL STATISTICS REPORT 2015
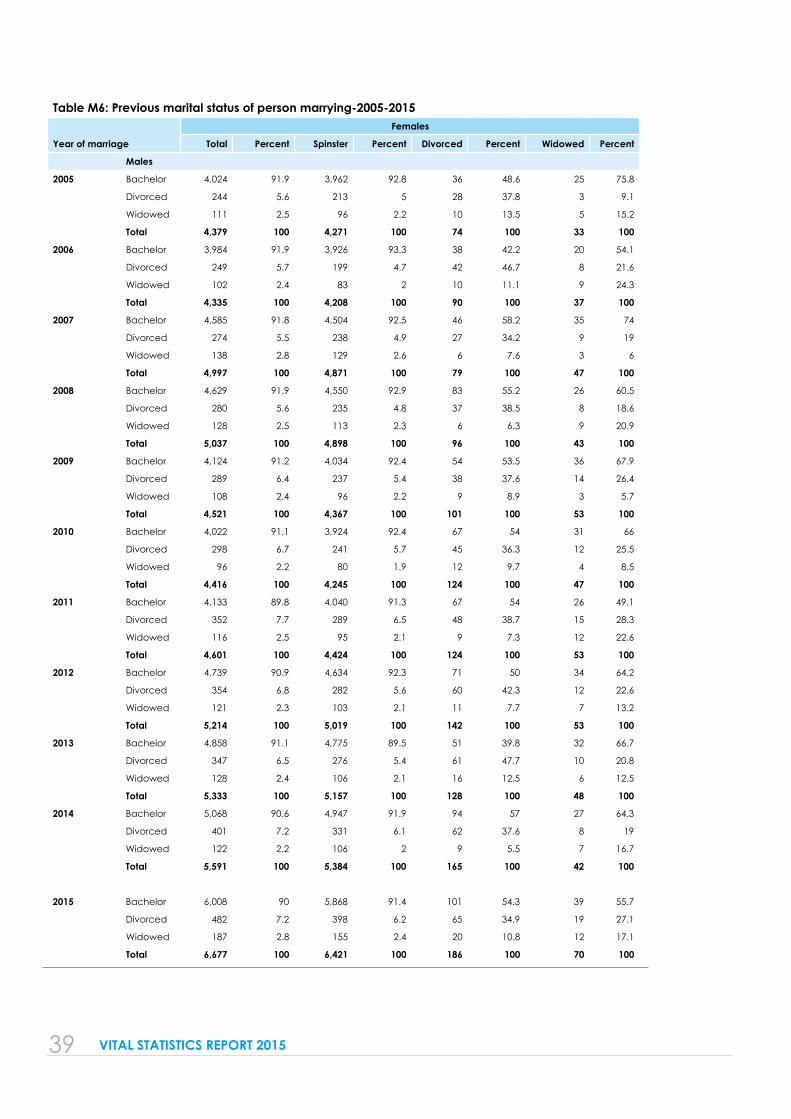
3.7 Previous Marital Status
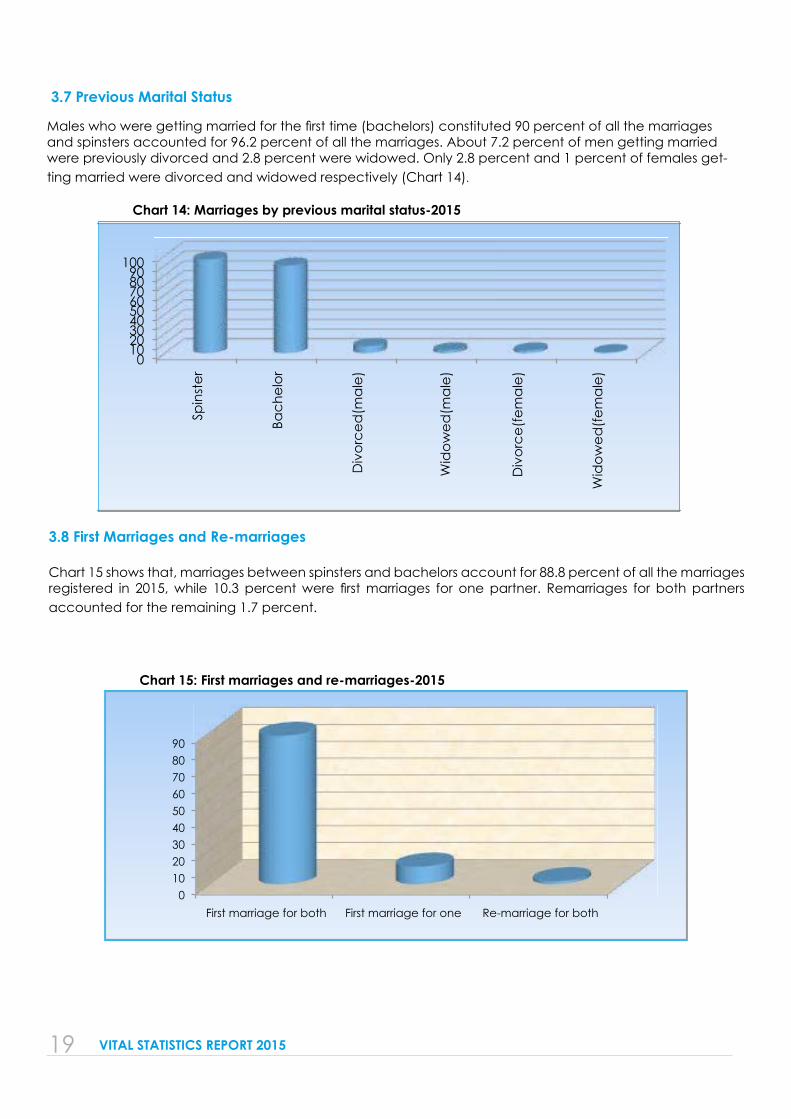
Males who were getting married for the first time (bachelors) constituted 90 percent of all the marriages and spinsters accounted for 96.2 percent of all the marriages. About 7.2 percent of men getting married were previously divorced and 2.8 percent were widowed. Only 2.8 percent and 1 percent of females get-ting married were divorced and widowed respectively (Chart 14).
Chart 14: Marriages by previous marital status-2015
3.8 First Marriages and Re-marriages
Chart 15 shows that, marriages between spinsters and bachelors account for 88.8 percent of all the marriages registered in 2015, while 10.3 percent were first marriages for one partner. Remarriages for both partners accounted for the remaining 1.7 percent.
Chart 15: First marriages and re-marriages-2015
0 10 20 30 40 50 60 70 80 90
100
Spin
ster
Bach
elor
Div
orce
d(m
ale)
Wid
owed
(mal
e)
Div
orce
(fem
ale)
Wid
owed
(fem
ale)
0 10 20 30 40 50 60 70 80 90
First marriage for both First marriage for one Re-marriage for both
20 VITAL STATISTICS REPORT 2015
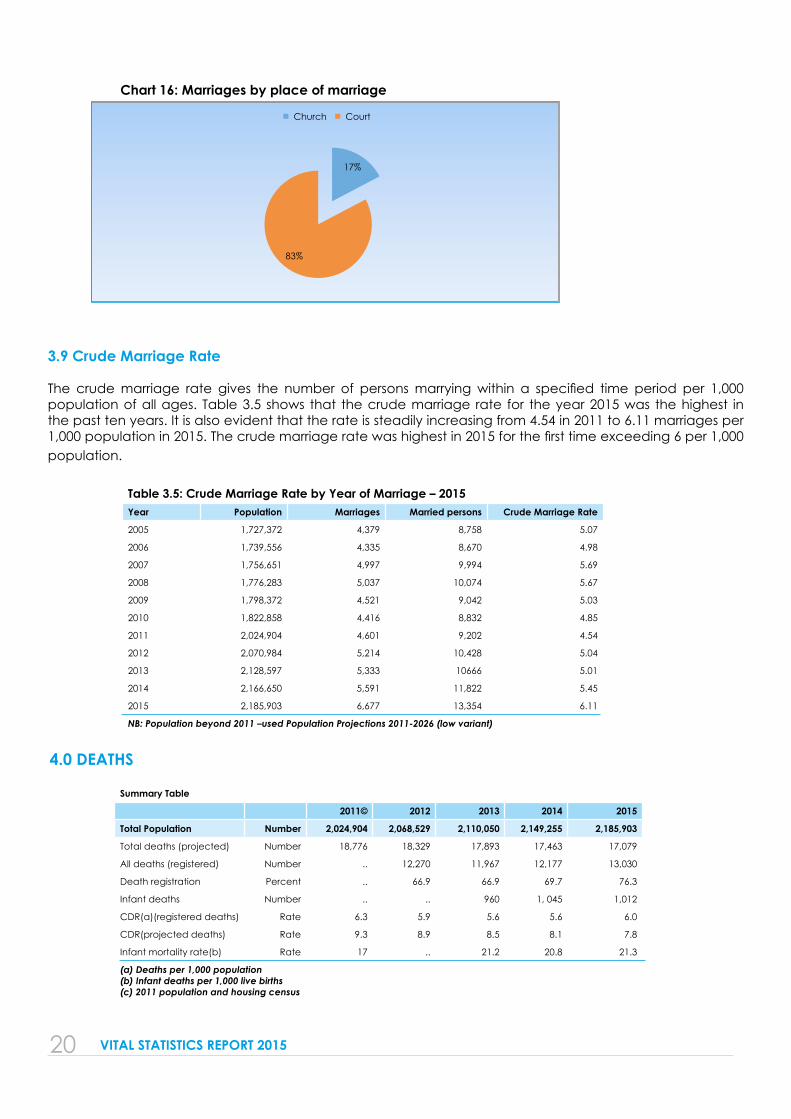
Chart 16: Marriages by place of marriage
3.9 Crude Marriage Rate
The crude marriage rate gives the number of persons marrying within a specified time period per 1,000 population of all ages. Table 3.5 shows that the crude marriage rate for the year 2015 was the highest in the past ten years. It is also evident that the rate is steadily increasing from 4.54 in 2011 to 6.11 marriages per 1,000 population in 2015. The crude marriage rate was highest in 2015 for the first time exceeding 6 per 1,000 population.
Table 3.5: Crude Marriage Rate by Year of Marriage – 2015Year Population Marriages Married persons Crude Marriage Rate
2005 1,727,372 4,379 8,758 5.07
2006 1,739,556 4,335 8,670 4.98
2007 1,756,651 4,997 9,994 5.69
2008 1,776,283 5,037 10,074 5.67
2009 1,798,372 4,521 9,042 5.03
2010 1,822,858 4,416 8,832 4.85
2011 2,024,904 4,601 9,202 4.54
2012 2,070,984 5,214 10,428 5.04
2013 2,128,597 5,333 10666 5.01
2014 2,166,650 5,591 11,822 5.45
2015 2,185,903 6,677 13,354 6.11
NB: Population beyond 2011 –used Population Projections 2011-2026 (low variant)
4.0 DEATHS
Summary Table
2011© 2012 2013 2014 2015
Total Population Number 2,024,904 2,068,529 2,110,050 2,149,255 2,185,903
Total deaths (projected) Number 18,776 18,329 17,893 17,463 17,079
All deaths (registered) Number .. 12,270 11,967 12,177 13,030
Death registration Percent .. 66.9 66.9 69.7 76.3
Infant deaths Number .. .. 960 1, 045 1,012
CDR(a)(registered deaths) Rate 6.3 5.9 5.6 5.6 6.0
CDR(projected deaths) Rate 9.3 8.9 8.5 8.1 7.8
Infant mortality rate(b) Rate 17 .. 21.2 20.8 21.3
(a) Deaths per 1,000 population(b) Infant deaths per 1,000 live births(c) 2011 population and housing census
17%
83%
Church Court
21 VITAL STATISTICS REPORT 2015
4.1 Death Registration
The Death Registrations collection includes all deaths that occurred and were registered in the country during the reference year and deaths that occurred in earlier years that have not previously been registered. Unlike in the previous years, deaths that occurred in the reference year but were registered in the subsequent year were included provided the registration was done within the specified period (within 1 month of occurrence). These are mostly deaths that occurred towards the end of the reference year. Included also are persons whose place of usual residence was outside the country provided the death occurred within borders.
There has been an increase in death registration from 66.9 percent in 2012 to 76.3 percent in 2015. This shows that the population is responding positively to the births and deaths registration campaigns. This section provides the distribution of all deaths that were registered in 2015 by age, sex, marital status, educational level, place or institution of death occurrence, district of usual residence of the deceased and center of registration.
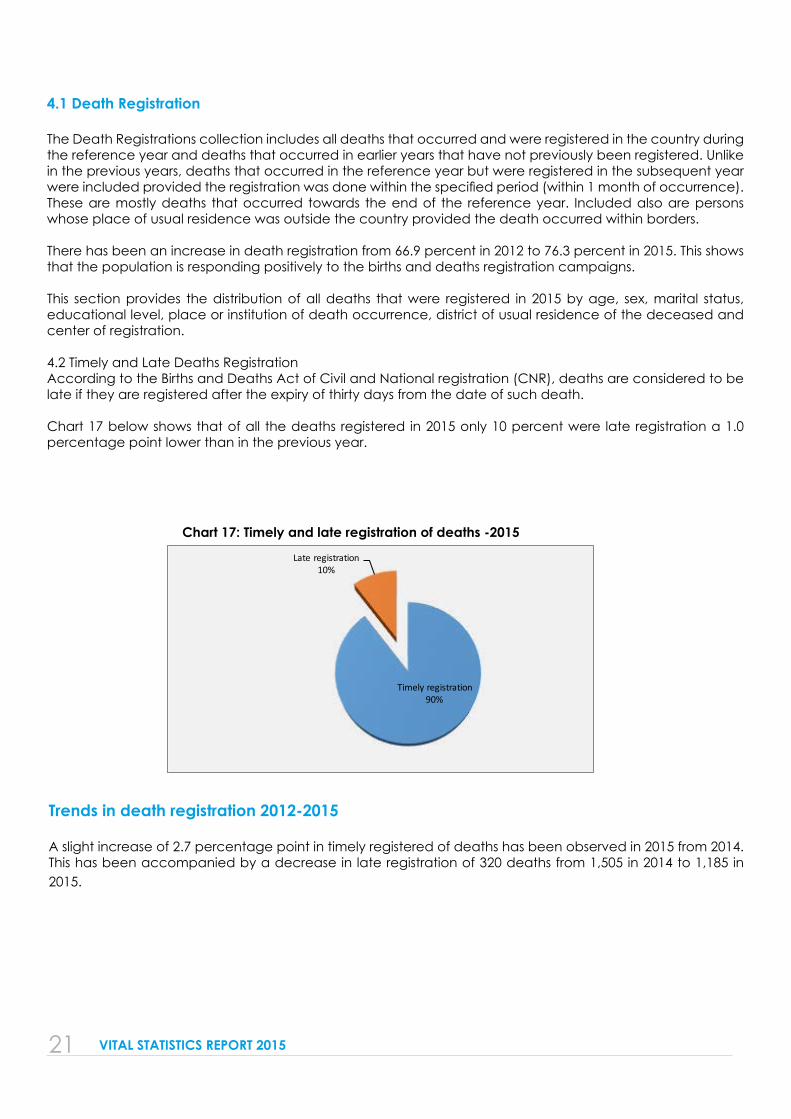
4.2 Timely and Late Deaths RegistrationAccording to the Births and Deaths Act of Civil and National registration (CNR), deaths are considered to be late if they are registered after the expiry of thirty days from the date of such death.
Chart 17 below shows that of all the deaths registered in 2015 only 10 percent were late registration a 1.0 percentage point lower than in the previous year.
Chart 17: Timely and late registration of deaths -2015
Trends in death registration 2012-2015
A slight increase of 2.7 percentage point in timely registered of deaths has been observed in 2015 from 2014. This has been accompanied by a decrease in late registration of 320 deaths from 1,505 in 2014 to 1,185 in 2015.
Timelyregistration90%
Lateregistration10%
22 VITAL STATISTICS REPORT 2015
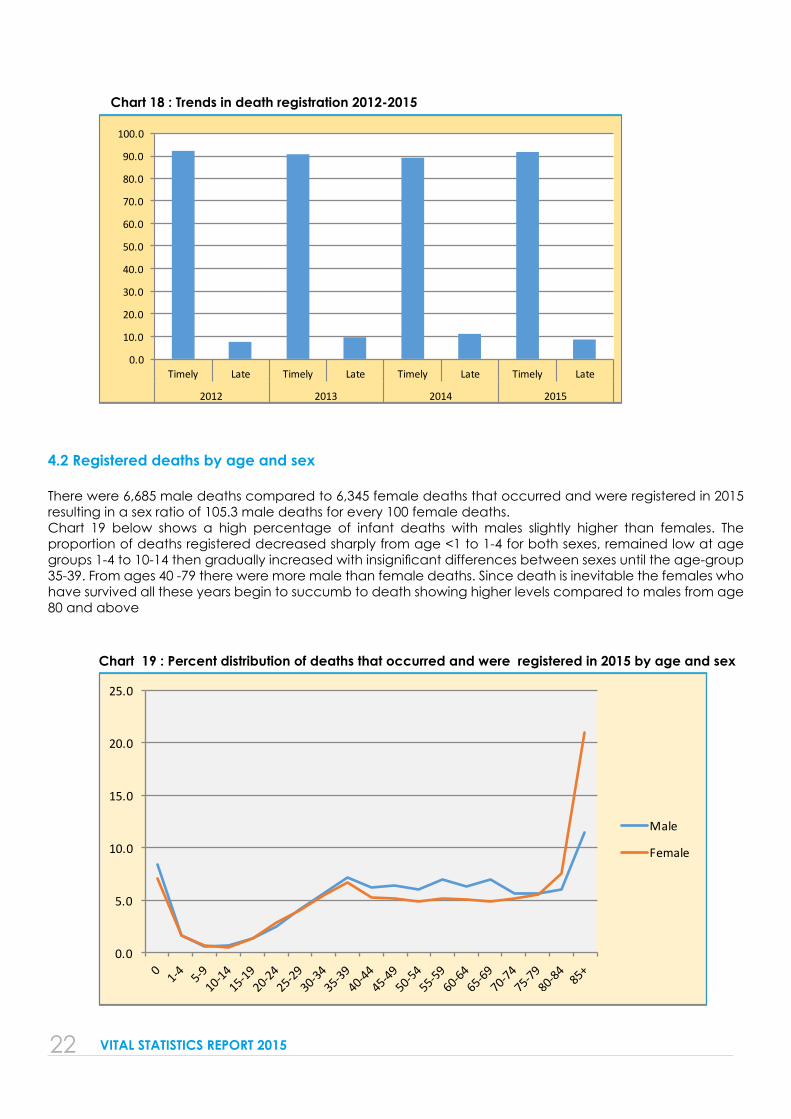
Chart 18 : Trends in death registration 2012-2015
4.2 Registered deaths by age and sex
There were 6,685 male deaths compared to 6,345 female deaths that occurred and were registered in 2015 resulting in a sex ratio of 105.3 male deaths for every 100 female deaths.Chart 19 below shows a high percentage of infant deaths with males slightly higher than females. The proportion of deaths registered decreased sharply from age <1 to 1-4 for both sexes, remained low at age groups 1-4 to 10-14 then gradually increased with insignificant differences between sexes until the age-group 35-39. From ages 40 -79 there were more male than female deaths. Since death is inevitable the females who have survived all these years begin to succumb to death showing higher levels compared to males from age 80 and above
Chart 19 : Percent distribution of deaths that occurred and were registered in 2015 by age and sex
0.0
10.0
20.0
30.0
40.0
50.0
60.0
70.0
80.0
90.0
100.0
Timely Late Timely Late Timely Late Timely Late
2012 2013 2014 2015
0.0
5.0
10.0
15.0
20.0
25.0
Male
Female

23 VITAL STATISTICS REPORT 2015
Chart 20 shows the distribution of deaths by age group and sex. This is to establish the proportion of male and female deaths within age groups. From infancy (01) to 1-4 there were more male than female deaths. The proportion of female deaths is higher for females than males in the age groups 5-9, 20-24 and 80+.
Chart 20: Percent distribution of deaths within age groups that occurred and were registered in 2015 by sex – 2015
Age Specific Death Rates 2015
The chart below shows an Infant Mortality Rate of 21.3 deaths per a thousand live births and the death rate falls to 1.02 at age group 1-4 and remains at low levels till age group 20-24 when it starts to increase steadily to older ages.
0.0
10.0
20.0
30.0
40.0
50.0
60.0
70.0
01-4
5-9
10-14
15-19
20-24
25-29
30-34
35-39
40-44
45-49
50-54
55-59
60-64
65-69
70-74
75-79
80-84
85+
Percent
Male
Female
0.00
20.00
40.00
60.00
80.00
100.00
120.00
140.00
<1 1-4
5-9
10-14
15-19
20-24
25-29
30-34
35-39
40-44
45-49
50-54
55-59
60-64
65-69
70-74
75-79
80+
Per1
000population
Age-Group
ASDR
Chart 21 : Age Specific Death Rates 2015
24 VITAL STATISTICS REPORT 2015
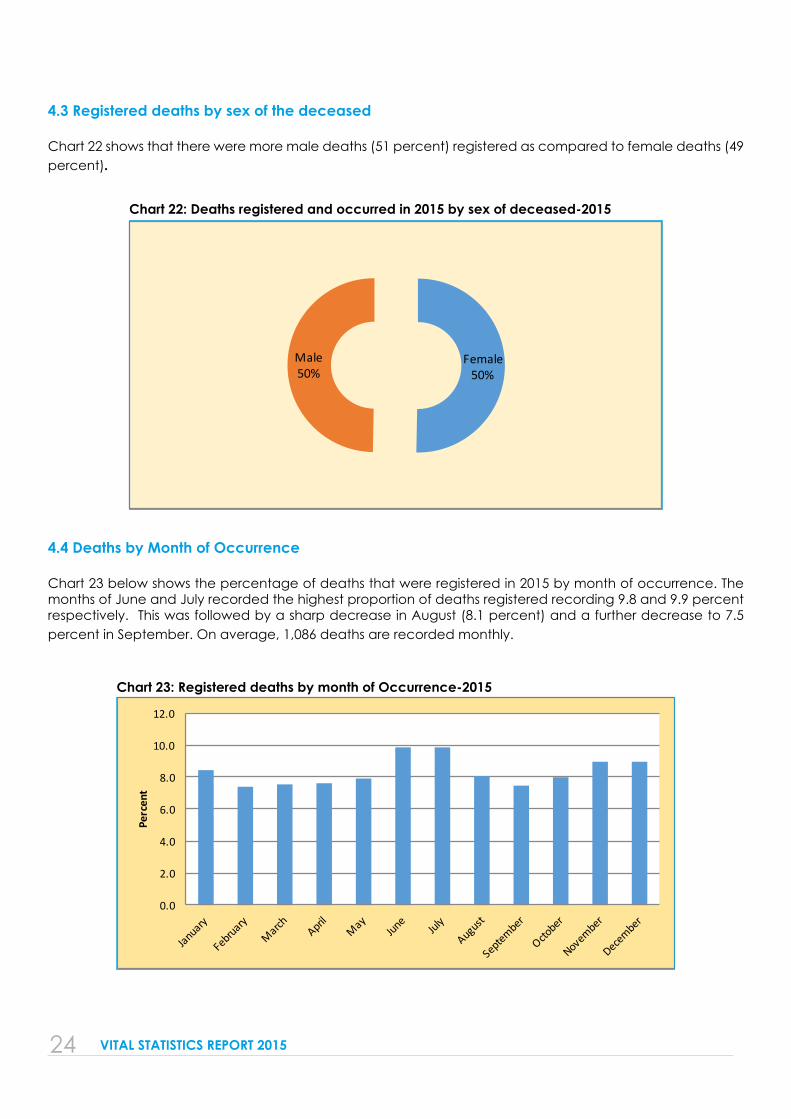
4.3 Registered deaths by sex of the deceased
Chart 22 shows that there were more male deaths (51 percent) registered as compared to female deaths (49 percent).
Female50%
Male50%
Chart 22: Deaths registered and occurred in 2015 by sex of deceased-2015
4.4 Deaths by Month of Occurrence
Chart 23 below shows the percentage of deaths that were registered in 2015 by month of occurrence. The months of June and July recorded the highest proportion of deaths registered recording 9.8 and 9.9 percent respectively. This was followed by a sharp decrease in August (8.1 percent) and a further decrease to 7.5 percent in September. On average, 1,086 deaths are recorded monthly.
0.0
2.0
4.0
6.0
8.0
10.0
12.0
Percent
Chart 23: Registered deaths by month of Occurrence-2015
25 VITAL STATISTICS REPORT 2015
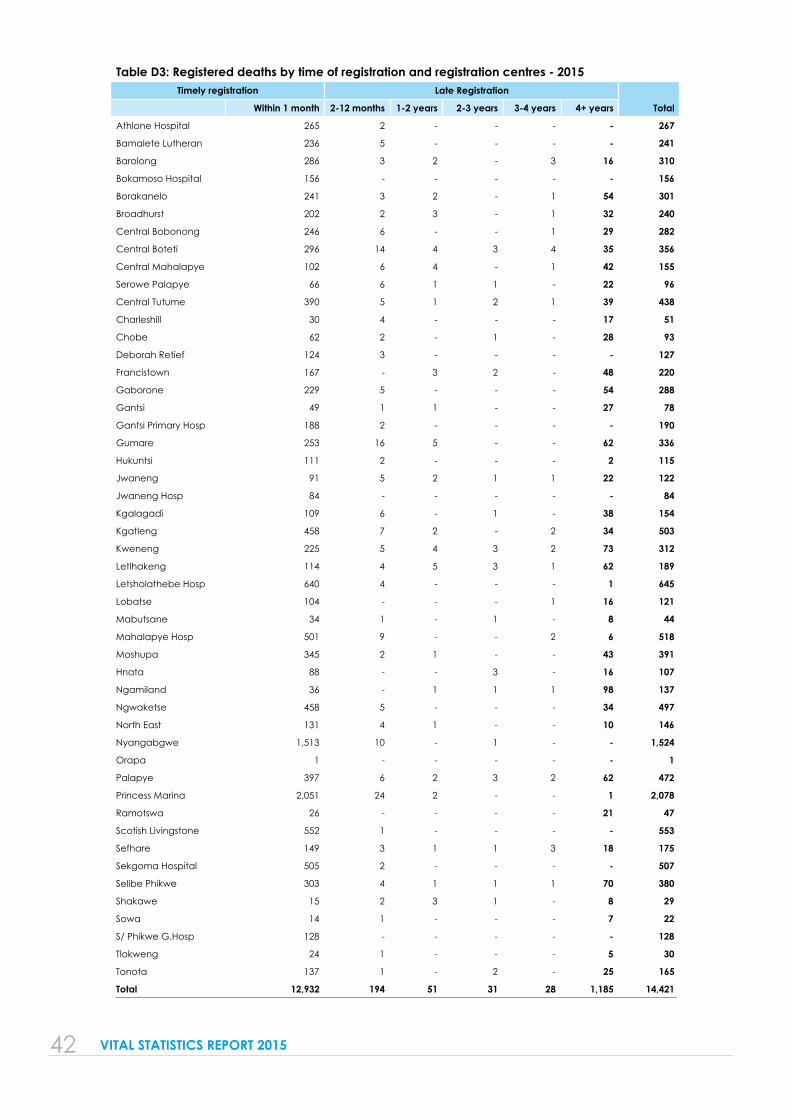
4.5 Centre of Registration
Table D3 shows that the highest number of deaths was registered at the country’s two (2) referral hospitals. Princess Marina Hospital registered 2,051 deaths translating to 15.7 percent of the deaths, while Nyangabgwe registered 11.6 percent. This may be attributed to the fact that difficult cases which are likely to result in death are referred to these two hospitals from across the country.
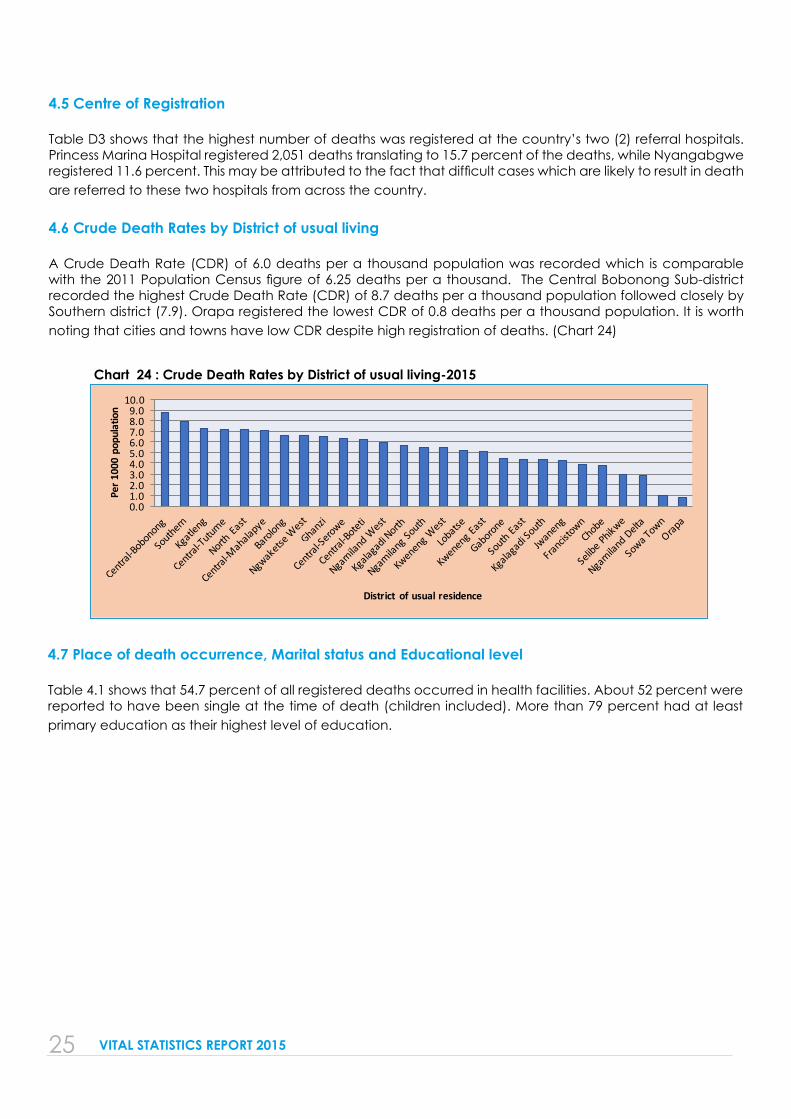
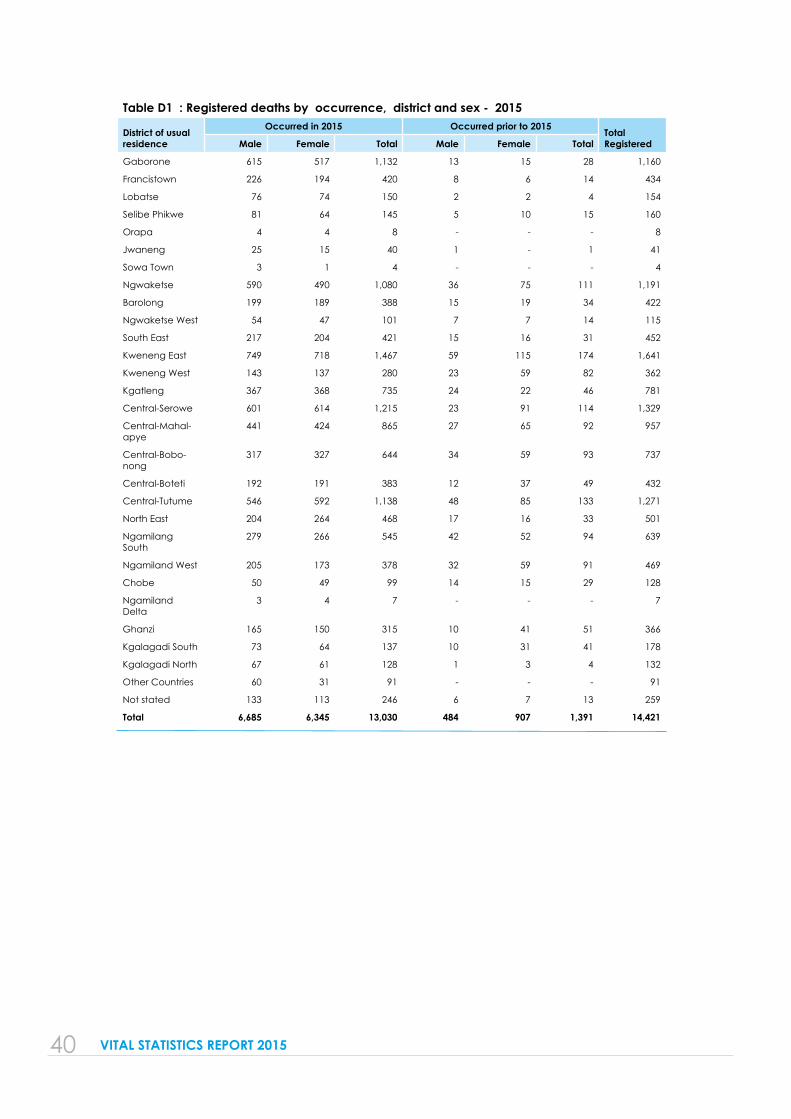
4.6 Crude Death Rates by District of usual living
A Crude Death Rate (CDR) of 6.0 deaths per a thousand population was recorded which is comparable with the 2011 Population Census figure of 6.25 deaths per a thousand. The Central Bobonong Sub-district recorded the highest Crude Death Rate (CDR) of 8.7 deaths per a thousand population followed closely by Southern district (7.9). Orapa registered the lowest CDR of 0.8 deaths per a thousand population. It is worth noting that cities and towns have low CDR despite high registration of deaths. (Chart 24)
0.01.02.03.04.05.06.07.08.09.010.0
Per1
000population
District ofusualresidence
Chart 24 : Crude Death Rates by District of usual living-2015
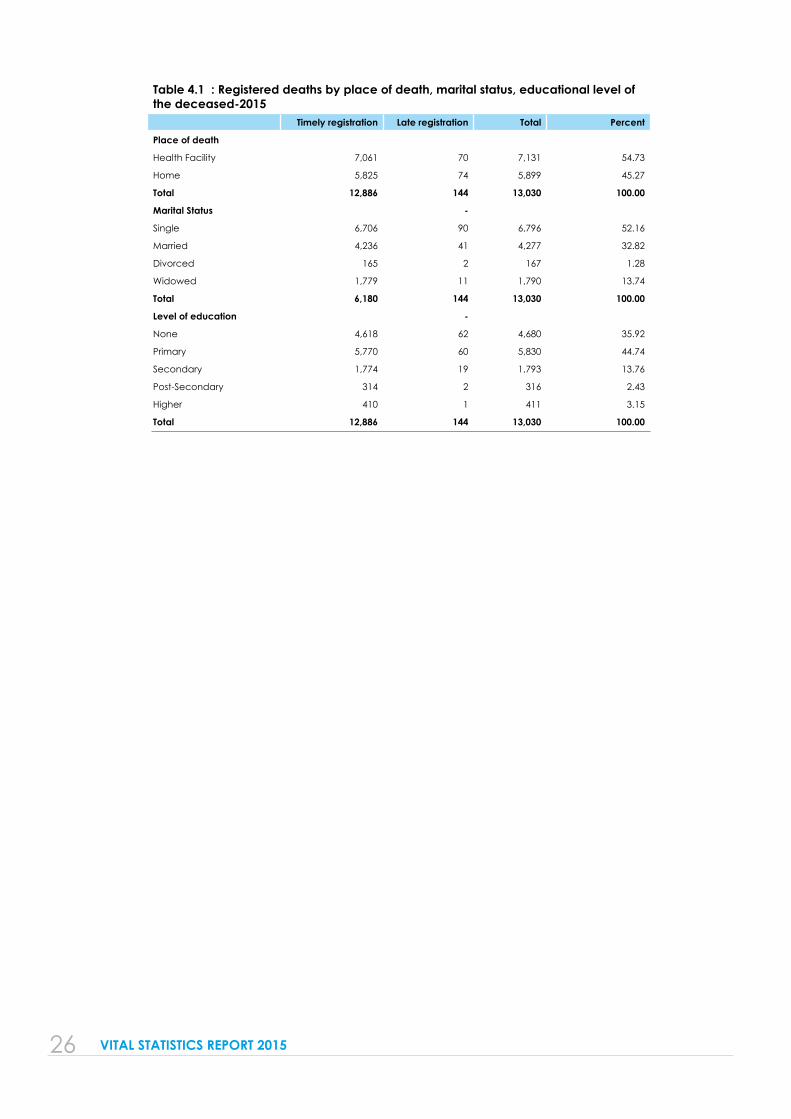
4.7 Place of death occurrence, Marital status and Educational level
Table 4.1 shows that 54.7 percent of all registered deaths occurred in health facilities. About 52 percent were reported to have been single at the time of death (children included). More than 79 percent had at least primary education as their highest level of education.
26 VITAL STATISTICS REPORT 2015
Table 4.1 : Registered deaths by place of death, marital status, educational level of the deceased-2015
Timely registration Late registration Total Percent
Place of death
Health Facility 7,061 70 7,131 54.73
Home 5,825 74 5,899 45.27
Total 12,886 144 13,030 100.00
Marital Status -
Single 6,706 90 6,796 52.16
Married 4,236 41 4,277 32.82
Divorced 165 2 167 1.28
Widowed 1,779 11 1,790 13.74
Total 6,180 144 13,030 100.00
Level of education -
None 4,618 62 4,680 35.92
Primary 5,770 60 5,830 44.74
Secondary 1,774 19 1,793 13.76
Post-Secondary 314 2 316 2.43
Higher 410 1 411 3.15
Total 12,886 144 13,030 100.00
27 VITAL STATISTICS REPORT 2015
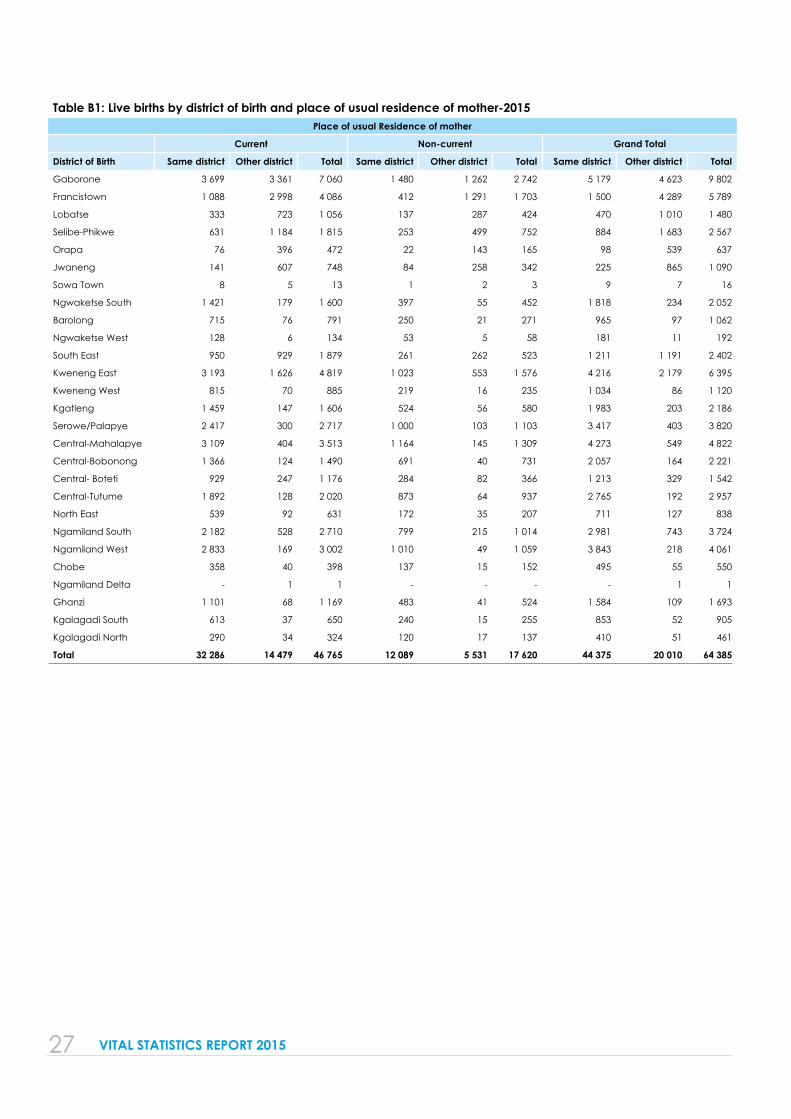
Table B1: Live births by district of birth and place of usual residence of mother-2015Place of usual Residence of mother
Current Non-current Grand Total
District of Birth Same district Other district Total Same district Other district Total Same district Other district Total
Gaborone 3 699 3 361 7 060 1 480 1 262 2 742 5 179 4 623 9 802
Francistown 1 088 2 998 4 086 412 1 291 1 703 1 500 4 289 5 789
Lobatse 333 723 1 056 137 287 424 470 1 010 1 480
Selibe-Phikwe 631 1 184 1 815 253 499 752 884 1 683 2 567
Orapa 76 396 472 22 143 165 98 539 637
Jwaneng 141 607 748 84 258 342 225 865 1 090
Sowa Town 8 5 13 1 2 3 9 7 16
Ngwaketse South 1 421 179 1 600 397 55 452 1 818 234 2 052
Barolong 715 76 791 250 21 271 965 97 1 062
Ngwaketse West 128 6 134 53 5 58 181 11 192
South East 950 929 1 879 261 262 523 1 211 1 191 2 402
Kweneng East 3 193 1 626 4 819 1 023 553 1 576 4 216 2 179 6 395
Kweneng West 815 70 885 219 16 235 1 034 86 1 120
Kgatleng 1 459 147 1 606 524 56 580 1 983 203 2 186
Serowe/Palapye 2 417 300 2 717 1 000 103 1 103 3 417 403 3 820
Central-Mahalapye 3 109 404 3 513 1 164 145 1 309 4 273 549 4 822
Central-Bobonong 1 366 124 1 490 691 40 731 2 057 164 2 221
Central- Boteti 929 247 1 176 284 82 366 1 213 329 1 542
Central-Tutume 1 892 128 2 020 873 64 937 2 765 192 2 957
North East 539 92 631 172 35 207 711 127 838
Ngamiland South 2 182 528 2 710 799 215 1 014 2 981 743 3 724
Ngamiland West 2 833 169 3 002 1 010 49 1 059 3 843 218 4 061
Chobe 358 40 398 137 15 152 495 55 550
Ngamiland Delta - 1 1 - - - - 1 1
Ghanzi 1 101 68 1 169 483 41 524 1 584 109 1 693
Kgalagadi South 613 37 650 240 15 255 853 52 905
Kgalagadi North 290 34 324 120 17 137 410 51 461
Total 32 286 14 479 46 765 12 089 5 531 17 620 44 375 20 010 64 385
28 VITAL STATISTICS REPORT 2015
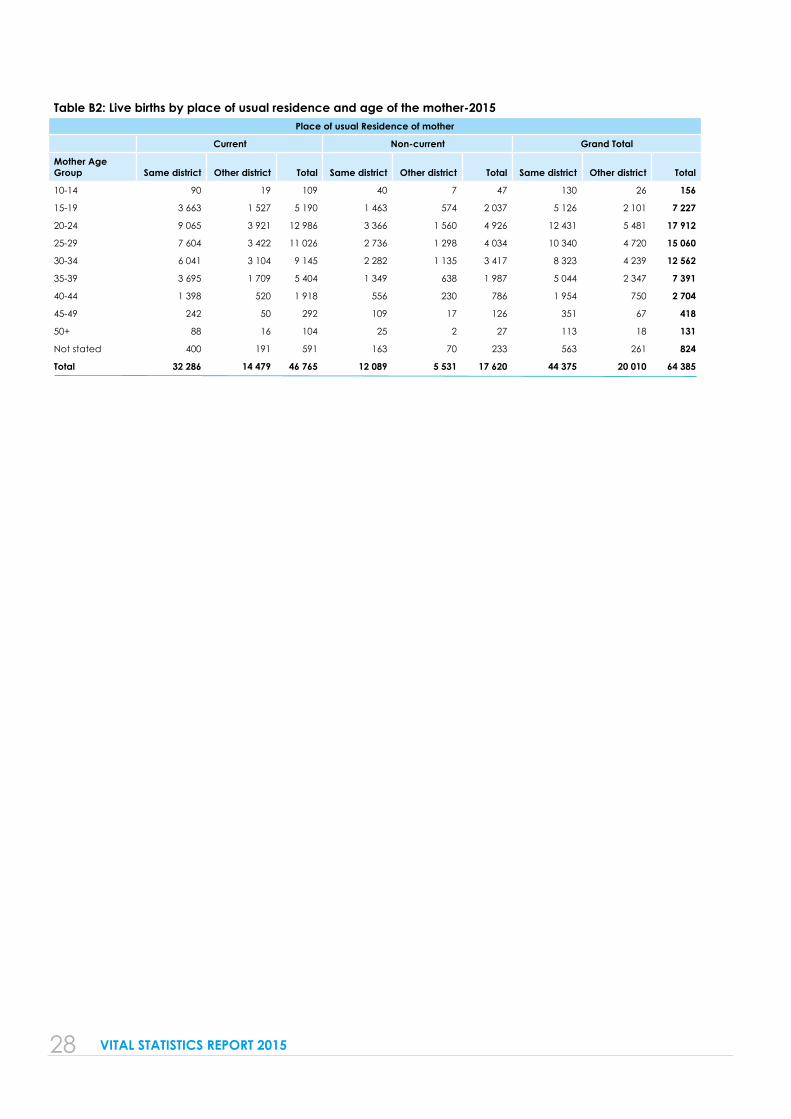
Table B2: Live births by place of usual residence and age of the mother-2015Place of usual Residence of mother
Current Non-current Grand Total
Mother Age Group Same district Other district Total Same district Other district Total Same district Other district Total
10-14 90 19 109 40 7 47 130 26 156
15-19 3 663 1 527 5 190 1 463 574 2 037 5 126 2 101 7 227
20-24 9 065 3 921 12 986 3 366 1 560 4 926 12 431 5 481 17 912
25-29 7 604 3 422 11 026 2 736 1 298 4 034 10 340 4 720 15 060
30-34 6 041 3 104 9 145 2 282 1 135 3 417 8 323 4 239 12 562
35-39 3 695 1 709 5 404 1 349 638 1 987 5 044 2 347 7 391
40-44 1 398 520 1 918 556 230 786 1 954 750 2 704
45-49 242 50 292 109 17 126 351 67 418
50+ 88 16 104 25 2 27 113 18 131
Not stated 400 191 591 163 70 233 563 261 824
Total 32 286 14 479 46 765 12 089 5 531 17 620 44 375 20 010 64 385
29 VITAL STATISTICS REPORT 2015
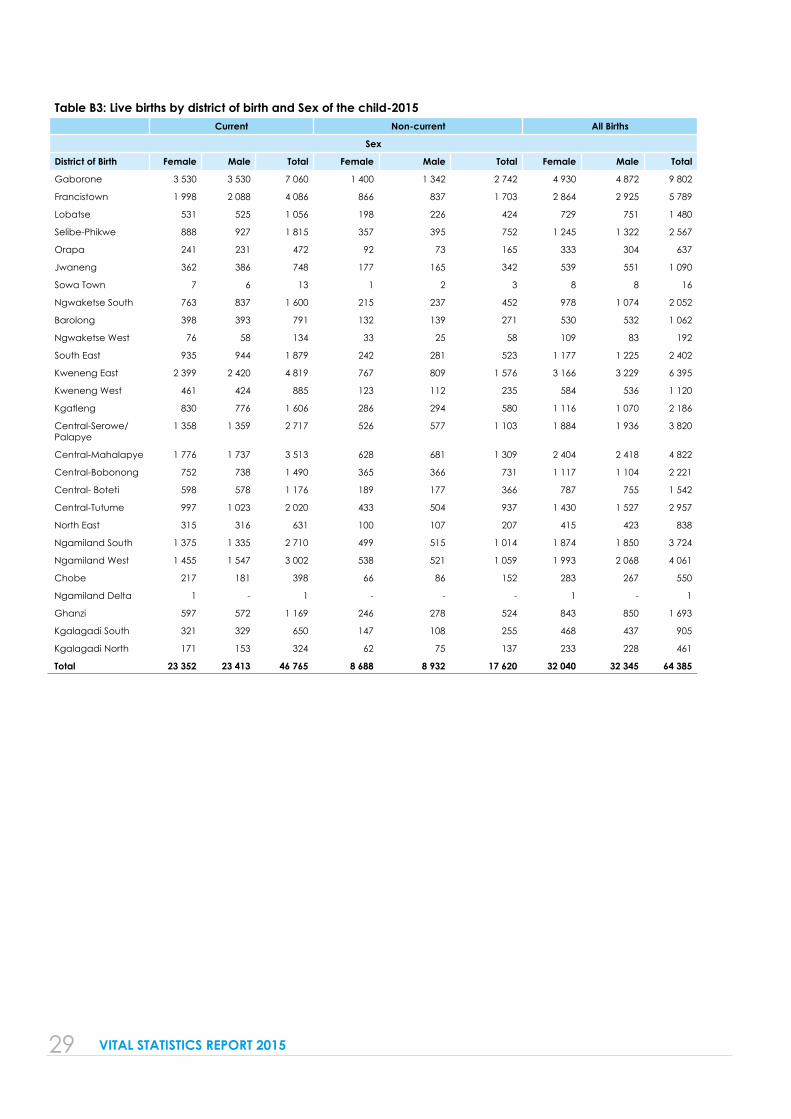
Table B3: Live births by district of birth and Sex of the child-2015Current Non-current All Births
Sex
District of Birth Female Male Total Female Male Total Female Male Total
Gaborone 3 530 3 530 7 060 1 400 1 342 2 742 4 930 4 872 9 802
Francistown 1 998 2 088 4 086 866 837 1 703 2 864 2 925 5 789
Lobatse 531 525 1 056 198 226 424 729 751 1 480
Selibe-Phikwe 888 927 1 815 357 395 752 1 245 1 322 2 567
Orapa 241 231 472 92 73 165 333 304 637
Jwaneng 362 386 748 177 165 342 539 551 1 090
Sowa Town 7 6 13 1 2 3 8 8 16
Ngwaketse South 763 837 1 600 215 237 452 978 1 074 2 052
Barolong 398 393 791 132 139 271 530 532 1 062
Ngwaketse West 76 58 134 33 25 58 109 83 192
South East 935 944 1 879 242 281 523 1 177 1 225 2 402
Kweneng East 2 399 2 420 4 819 767 809 1 576 3 166 3 229 6 395
Kweneng West 461 424 885 123 112 235 584 536 1 120
Kgatleng 830 776 1 606 286 294 580 1 116 1 070 2 186
Central-Serowe/Palapye
1 358 1 359 2 717 526 577 1 103 1 884 1 936 3 820
Central-Mahalapye 1 776 1 737 3 513 628 681 1 309 2 404 2 418 4 822
Central-Bobonong 752 738 1 490 365 366 731 1 117 1 104 2 221
Central- Boteti 598 578 1 176 189 177 366 787 755 1 542
Central-Tutume 997 1 023 2 020 433 504 937 1 430 1 527 2 957
North East 315 316 631 100 107 207 415 423 838
Ngamiland South 1 375 1 335 2 710 499 515 1 014 1 874 1 850 3 724
Ngamiland West 1 455 1 547 3 002 538 521 1 059 1 993 2 068 4 061
Chobe 217 181 398 66 86 152 283 267 550
Ngamiland Delta 1 - 1 - - - 1 - 1
Ghanzi 597 572 1 169 246 278 524 843 850 1 693
Kgalagadi South 321 329 650 147 108 255 468 437 905
Kgalagadi North 171 153 324 62 75 137 233 228 461
Total 23 352 23 413 46 765 8 688 8 932 17 620 32 040 32 345 64 385
30 VITAL STATISTICS REPORT 2015
Table B4: Live births by Place of Birth and District of Birth-2015Current Non-current All Births
Place of Birth
District Of BirthHealth Facility Home Total
Health Facility Home Total
Health Facility Home Total
Gaborone 7 032 28 7 060 2 728 14 2 742 9 760 42 9 802
Francistown 4 058 28 4 086 1 693 10 1 703 5 751 38 5 789
Lobatse 1 055 1 1 056 424 - 424 1 479 1 1 480
Selibe-Phikwe 1 778 37 1 815 738 14 752 2 516 51 2 567
Orapa 472 - 472 163 2 165 635 2 637
Jwaneng 748 - 748 342 - 342 1 090 - 1 090
Sowa Town 13 - 13 3 - 3 16 - 16
Ngwaketse South 1 597 3 1 600 452 - 452 2 049 3 2 052
Barolong 784 7 791 270 1 271 1 054 8 1 062
Ngwaketse West 134 - 134 58 - 58 192 - 192
South East 1 859 20 1 879 517 6 523 2 376 26 2 402
Kweneng East 4 800 19 4 819 1 568 8 1 576 6 368 27 6 395
Kweneng West 882 3 885 235 - 235 1 117 3 1 120
Kgatleng 1 596 10 1 606 577 3 580 2 173 13 2 186
Central-Serowe/Palapye 2 715 2 2 717 1 103 - 1 103 3 818 2 3 820
Central-Mahalapye 3 508 5 3 513 1 306 3 1 309 4 814 8 4 822
Central-Bobonong 1 482 8 1 490 728 3 731 2 210 11 2 221
Central- Boteti 1 170 6 1 176 365 1 366 1 535 7 1 542
Central-Tutume 2 014 6 2 020 934 3 937 2 948 9 2 957
North East 622 9 631 206 1 207 828 10 838
Ngamiland South 2 703 7 2 710 1 010 4 1 014 3 713 11 3 724
Ngamiland West 2 992 10 3 002 1 058 1 1 059 4 050 11 4 061
Chobe 396 2 398 152 - 152 548 2 550
Ngamiland Delta 1 - 1 - - - 1 - 1
Ghanzi 1 168 1 1 169 524 - 524 1 692 1 1 693
Kgalagadi South 650 - 650 254 1 255 904 1 905
Kgalagadi North 321 3 324 135 2 137 456 5 461
Total 46 550 215 46 765 17 543 77 17 620 64 093 292 64 385
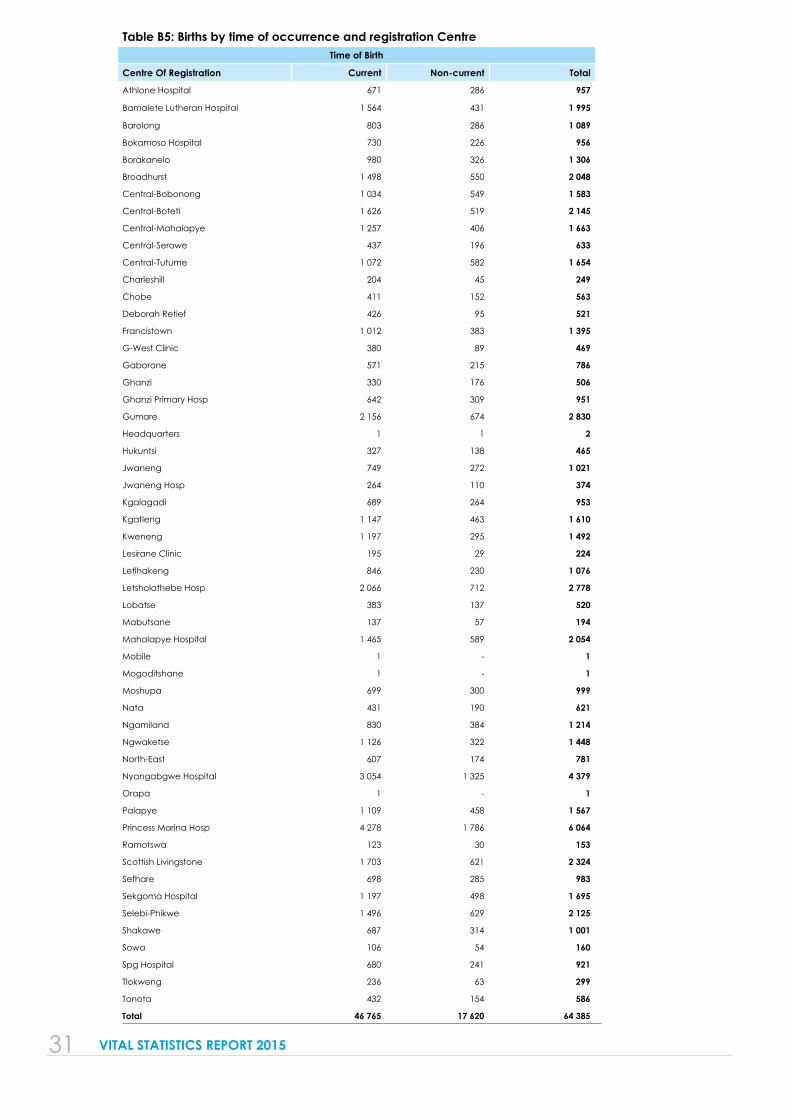
31 VITAL STATISTICS REPORT 2015
Table B5: Births by time of occurrence and registration CentreTime of Birth
Centre Of Registration Current Non-current Total
Athlone Hospital 671 286 957
Bamalete Lutheran Hospital 1 564 431 1 995
Barolong 803 286 1 089
Bokamoso Hospital 730 226 956
Borakanelo 980 326 1 306
Broadhurst 1 498 550 2 048
Central-Bobonong 1 034 549 1 583
Central-Boteti 1 626 519 2 145
Central-Mahalapye 1 257 406 1 663
Central-Serowe 437 196 633
Central-Tutume 1 072 582 1 654
Charleshill 204 45 249
Chobe 411 152 563
Deborah Retief 426 95 521
Francistown 1 012 383 1 395
G-West Clinic 380 89 469
Gaborone 571 215 786
Ghanzi 330 176 506
Ghanzi Primary Hosp 642 309 951
Gumare 2 156 674 2 830
Headquarters 1 1 2
Hukuntsi 327 138 465
Jwaneng 749 272 1 021
Jwaneng Hosp 264 110 374
Kgalagadi 689 264 953
Kgatleng 1 147 463 1 610
Kweneng 1 197 295 1 492
Lesirane Clinic 195 29 224
Letlhakeng 846 230 1 076
Letsholathebe Hosp 2 066 712 2 778
Lobatse 383 137 520
Mabutsane 137 57 194
Mahalapye Hospital 1 465 589 2 054
Mobile 1 - 1
Mogoditshane 1 - 1
Moshupa 699 300 999
Nata 431 190 621
Ngamiland 830 384 1 214
Ngwaketse 1 126 322 1 448
North-East 607 174 781
Nyangabgwe Hospital 3 054 1 325 4 379
Orapa 1 - 1
Palapye 1 109 458 1 567
Princess Marina Hosp 4 278 1 786 6 064
Ramotswa 123 30 153
Scottish Livingstone 1 703 621 2 324
Sefhare 698 285 983
Sekgoma Hospital 1 197 498 1 695
Selebi-Phikwe 1 496 629 2 125
Shakawe 687 314 1 001
Sowa 106 54 160
Spg Hospital 680 241 921
Tlokweng 236 63 299
Tonota 432 154 586
Total 46 765 17 620 64 385
32 VITAL STATISTICS REPORT 2015
Table B6: Live births by month of birth and Sex-2015Current Non-current All births
Sex
Month of Birth Female Male Total Female Male Total Female Male Total
January 2 063 2 067 4 130 785 852 1 637 2 848 2 919 5 767
February 1 820 1 918 3 738 660 696 1 356 2 480 2 614 5 094
March 2 114 2 127 4 241 704 771 1 475 2 818 2 898 5 716
April 1 902 1 977 3 879 722 707 1 429 2 624 2 684 5 308
May 1 958 1 915 3 873 691 697 1 388 2 649 2 612 5 261
June 1 957 1 940 3 897 744 756 1 500 2 701 2 696 5 397
July 2 019 1 947 3 966 662 696 1 358 2 681 2 643 5 324
August 1 930 1 995 3 925 700 680 1 380 2 630 2 675 5 305
September 1 950 1 993 3 943 697 767 1 464 2 647 2 760 5 407
October 1 886 1 881 3 767 735 771 1 506 2 621 2 652 5 273
November 1 843 1 765 3 608 700 692 1 392 2 543 2 457 5 000
December 1 910 1 888 3 798 888 847 1 735 2 798 2 735 5 533
Total 23 352 23 413 46 765 8 688 8 932 17 620 32 040 32 345 64 385
33 VITAL STATISTICS REPORT 2015
Table B7: Live births by mother’s age group and marital status-2015Mother’s marital status
Mother Age Group Divorced Married Single Widowed Total
Current 10-14 1 14 93 1 109
15-19 1 582 4 598 9 5 190
20-24 6 1 760 11 208 12 12 986
25-29 6 2 312 8 689 19 11 026
30-34 28 2 748 6 337 32 9 145
35-39 27 1 805 3 531 41 5 404
40-44 7 626 1 253 32 1 918
45-49 1 86 201 4 292
50+ 1 30 72 1 104
Not stated 2 251 332 6 591
Total 80 10 214 36 314 157 46 765
Non-current 10-14 - 5 42 - 47
15-19 - 191 1 844 2 2 037
20-24 1 623 4 299 3 4 926
25-29 3 877 3 146 8 4 034
30-34 4 1 060 2 348 5 3 417
35-39 13 699 1 258 17 1 987
40-44 2 265 509 10 786
45-49 - 33 92 1 126
50+ - 6 20 1 27
Not stated 1 94 138 - 233
Total 24 3 853 13 696 47 17 620
All births 10-14 1 19 135 1 156
15-19 1 773 6 442 11 7 227
20-24 7 2 383 15 507 15 17 912
25-29 9 3 189 11 835 27 15 060
30-34 32 3 808 8 685 37 12 562
35-39 40 2 504 4 789 58 7 391
40-44 9 891 1 762 42 2 704
45-49 1 119 293 5 418
50+ 1 36 92 2 131
Not stated 3 345 470 6 824
Total 104 14 067 50 010 204 64 385
34 VITAL STATISTICS REPORT 2015
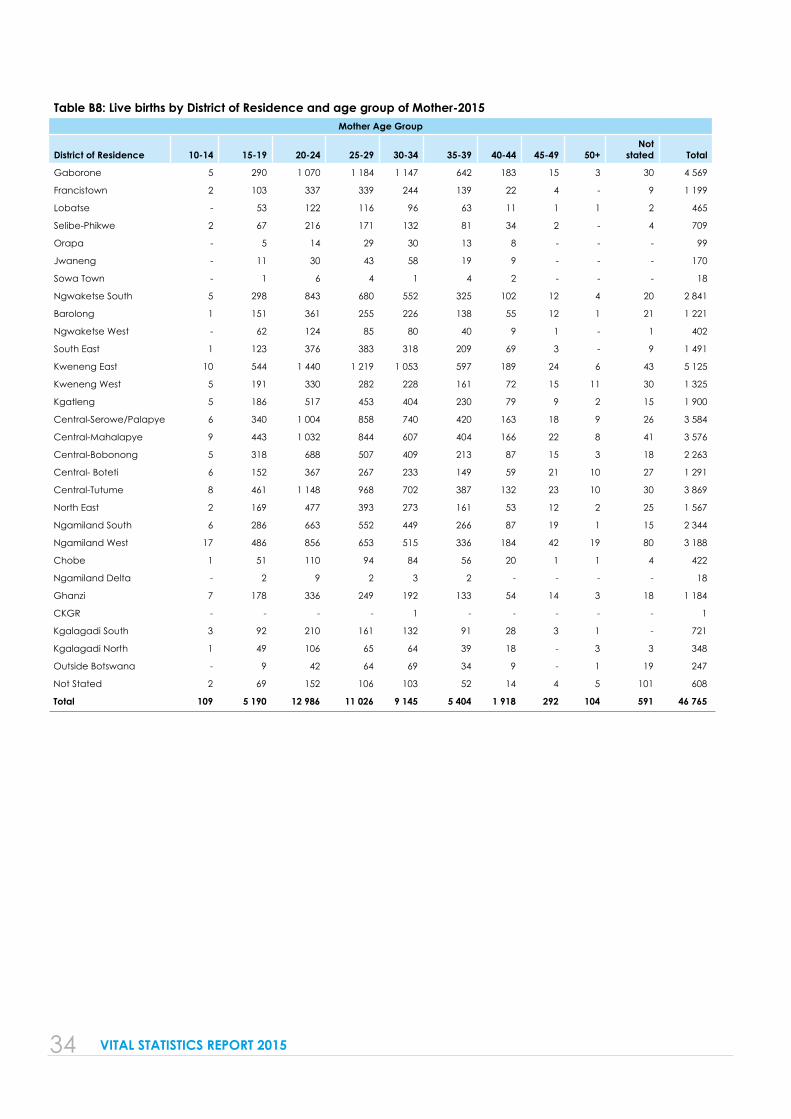
Table B8: Live births by District of Residence and age group of Mother-2015Mother Age Group
District of Residence 10-14 15-19 20-24 25-29 30-34 35-39 40-44 45-49 50+Not
stated Total
Gaborone 5 290 1 070 1 184 1 147 642 183 15 3 30 4 569
Francistown 2 103 337 339 244 139 22 4 - 9 1 199
Lobatse - 53 122 116 96 63 11 1 1 2 465
Selibe-Phikwe 2 67 216 171 132 81 34 2 - 4 709
Orapa - 5 14 29 30 13 8 - - - 99
Jwaneng - 11 30 43 58 19 9 - - - 170
Sowa Town - 1 6 4 1 4 2 - - - 18
Ngwaketse South 5 298 843 680 552 325 102 12 4 20 2 841
Barolong 1 151 361 255 226 138 55 12 1 21 1 221
Ngwaketse West - 62 124 85 80 40 9 1 - 1 402
South East 1 123 376 383 318 209 69 3 - 9 1 491
Kweneng East 10 544 1 440 1 219 1 053 597 189 24 6 43 5 125
Kweneng West 5 191 330 282 228 161 72 15 11 30 1 325
Kgatleng 5 186 517 453 404 230 79 9 2 15 1 900
Central-Serowe/Palapye 6 340 1 004 858 740 420 163 18 9 26 3 584
Central-Mahalapye 9 443 1 032 844 607 404 166 22 8 41 3 576
Central-Bobonong 5 318 688 507 409 213 87 15 3 18 2 263
Central- Boteti 6 152 367 267 233 149 59 21 10 27 1 291
Central-Tutume 8 461 1 148 968 702 387 132 23 10 30 3 869
North East 2 169 477 393 273 161 53 12 2 25 1 567
Ngamiland South 6 286 663 552 449 266 87 19 1 15 2 344
Ngamiland West 17 486 856 653 515 336 184 42 19 80 3 188
Chobe 1 51 110 94 84 56 20 1 1 4 422
Ngamiland Delta - 2 9 2 3 2 - - - - 18
Ghanzi 7 178 336 249 192 133 54 14 3 18 1 184
CKGR - - - - 1 - - - - - 1
Kgalagadi South 3 92 210 161 132 91 28 3 1 - 721
Kgalagadi North 1 49 106 65 64 39 18 - 3 3 348
Outside Botswana - 9 42 64 69 34 9 - 1 19 247
Not Stated 2 69 152 106 103 52 14 4 5 101 608
Total 109 5 190 12 986 11 026 9 145 5 404 1 918 292 104 591 46 765
35 VITAL STATISTICS REPORT 2015
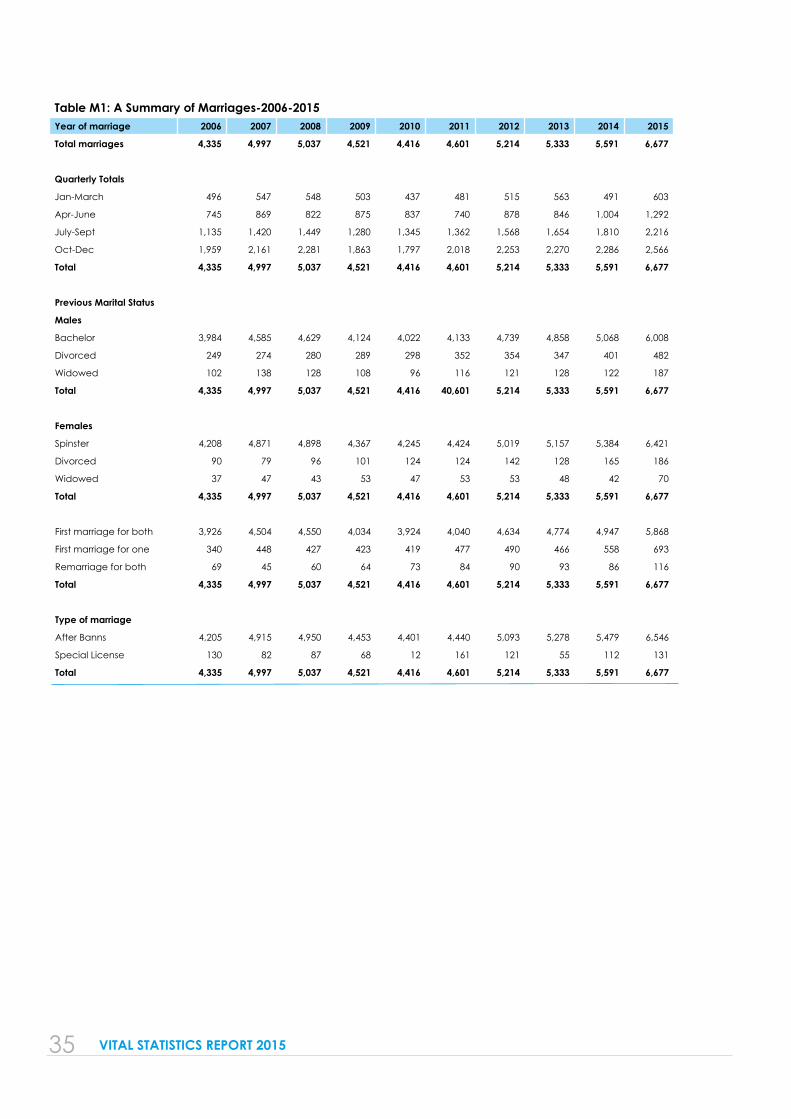
Table M1: A Summary of Marriages-2006-2015Year of marriage 2006 2007 2008 2009 2010 2011 2012 2013 2014 2015
Total marriages 4,335 4,997 5,037 4,521 4,416 4,601 5,214 5,333 5,591 6,677
Quarterly Totals
Jan-March 496 547 548 503 437 481 515 563 491 603
Apr-June 745 869 822 875 837 740 878 846 1,004 1,292
July-Sept 1,135 1,420 1,449 1,280 1,345 1,362 1,568 1,654 1,810 2,216
Oct-Dec 1,959 2,161 2,281 1,863 1,797 2,018 2,253 2,270 2,286 2,566
Total 4,335 4,997 5,037 4,521 4,416 4,601 5,214 5,333 5,591 6,677
Previous Marital Status
Males
Bachelor 3,984 4,585 4,629 4,124 4,022 4,133 4,739 4,858 5,068 6,008
Divorced 249 274 280 289 298 352 354 347 401 482
Widowed 102 138 128 108 96 116 121 128 122 187
Total 4,335 4,997 5,037 4,521 4,416 40,601 5,214 5,333 5,591 6,677
Females
Spinster 4,208 4,871 4,898 4,367 4,245 4,424 5,019 5,157 5,384 6,421
Divorced 90 79 96 101 124 124 142 128 165 186
Widowed 37 47 43 53 47 53 53 48 42 70
Total 4,335 4,997 5,037 4,521 4,416 4,601 5,214 5,333 5,591 6,677
First marriage for both 3,926 4,504 4,550 4,034 3,924 4,040 4,634 4,774 4,947 5,868
First marriage for one 340 448 427 423 419 477 490 466 558 693
Remarriage for both 69 45 60 64 73 84 90 93 86 116
Total 4,335 4,997 5,037 4,521 4,416 4,601 5,214 5,333 5,591 6,677
Type of marriage
After Banns 4,205 4,915 4,950 4,453 4,401 4,440 5,093 5,278 5,479 6,546
Special License 130 82 87 68 12 161 121 55 112 131
Total 4,335 4,997 5,037 4,521 4,416 4,601 5,214 5,333 5,591 6,677
36 VITAL STATISTICS REPORT 2015
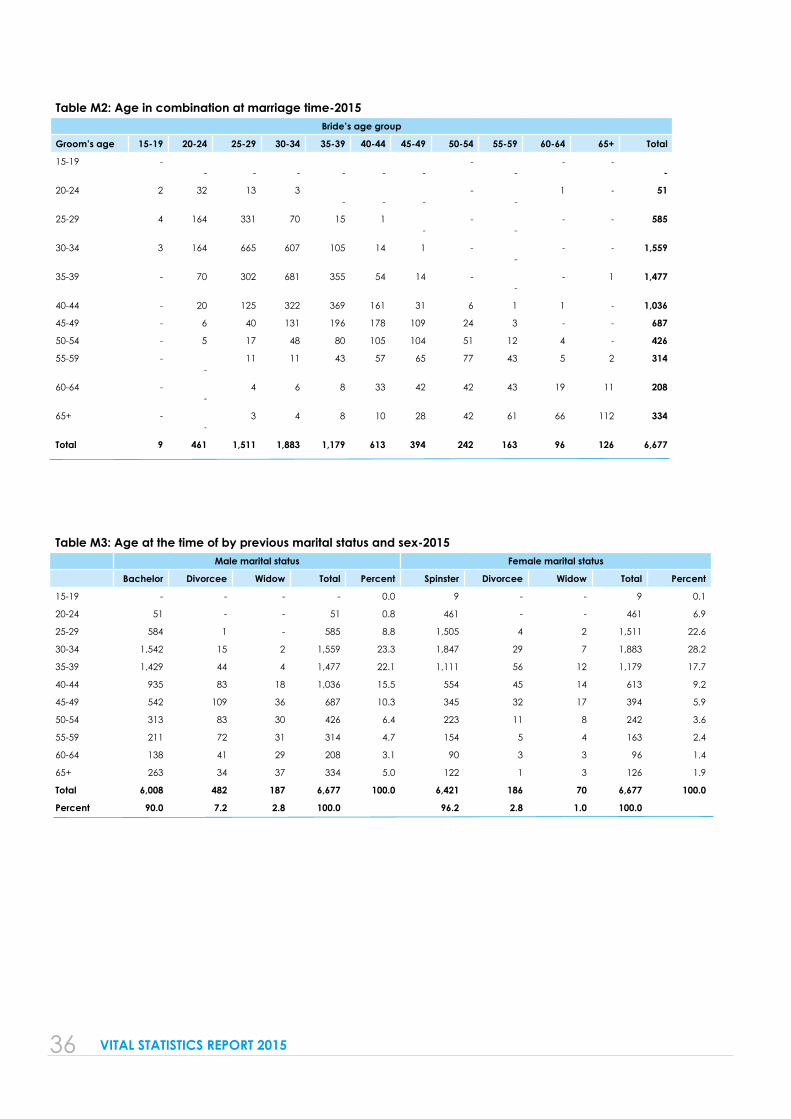
Table M2: Age in combination at marriage time-2015Bride’s age group
Groom’s age 15-19 20-24 25-29 30-34 35-39 40-44 45-49 50-54 55-59 60-64 65+ Total
15-19 - -
-
-
-
-
-
- -
- - -
20-24 2 32 13 3 -
-
-
- -
1 - 51
25-29 4 164 331 70 15 1 -
- -
- - 585
30-34 3 164 665 607 105 14 1 - -
- - 1,559
35-39 - 70 302 681 355 54 14 - -
- 1 1,477
40-44 - 20 125 322 369 161 31 6 1 1 - 1,036
45-49 - 6 40 131 196 178 109 24 3 - - 687
50-54 - 5 17 48 80 105 104 51 12 4 - 426
55-59 - -
11 11 43 57 65 77 43 5 2 314
60-64 - -
4 6 8 33 42 42 43 19 11 208
65+ - -
3 4 8 10 28 42 61 66 112 334
Total 9 461 1,511 1,883 1,179 613 394 242 163 96 126 6,677
Table M3: Age at the time of by previous marital status and sex-2015Male marital status Female marital status
Bachelor Divorcee Widow Total Percent Spinster Divorcee Widow Total Percent
15-19 - - - - 0.0 9 - - 9 0.1
20-24 51 - - 51 0.8 461 - - 461 6.9
25-29 584 1 - 585 8.8 1,505 4 2 1,511 22.6
30-34 1,542 15 2 1,559 23.3 1,847 29 7 1,883 28.2
35-39 1,429 44 4 1,477 22.1 1,111 56 12 1,179 17.7
40-44 935 83 18 1,036 15.5 554 45 14 613 9.2
45-49 542 109 36 687 10.3 345 32 17 394 5.9
50-54 313 83 30 426 6.4 223 11 8 242 3.6
55-59 211 72 31 314 4.7 154 5 4 163 2.4
60-64 138 41 29 208 3.1 90 3 3 96 1.4
65+ 263 34 37 334 5.0 122 1 3 126 1.9
Total 6,008 482 187 6,677 100.0 6,421 186 70 6,677 100.0
Percent 90.0 7.2 2.8 100.0 96.2 2.8 1.0 100.0
37 VITAL STATISTICS REPORT 2015
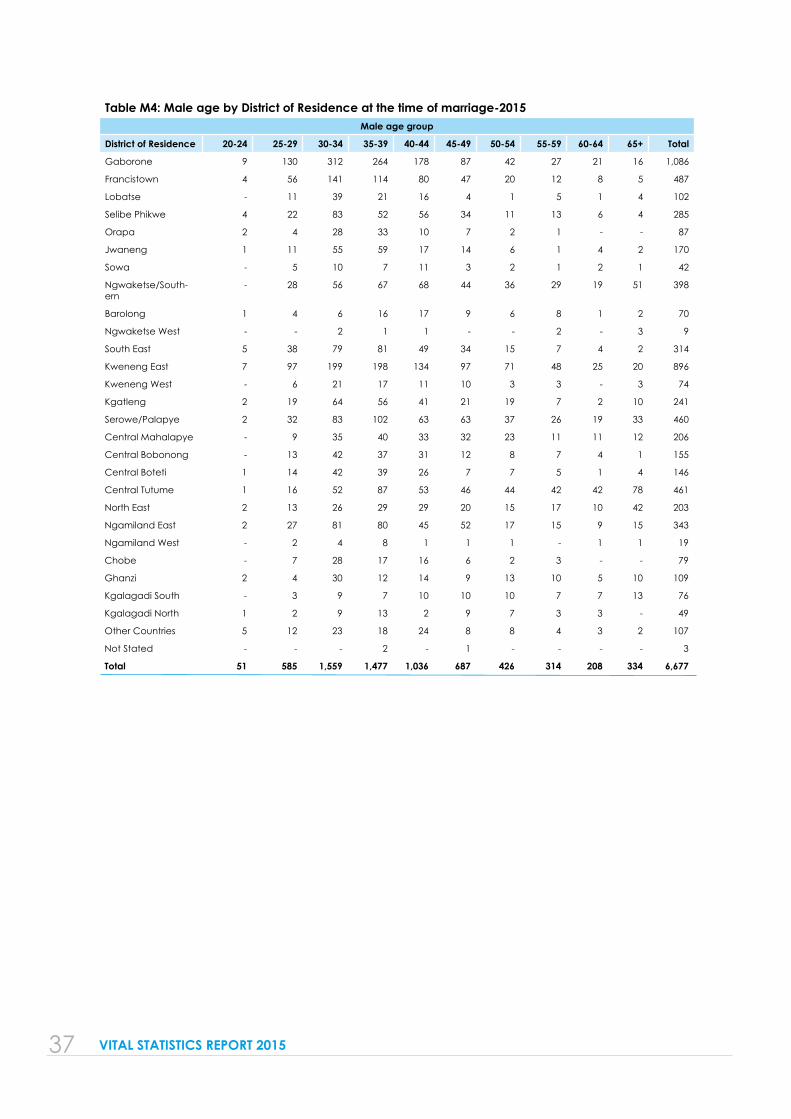
Table M4: Male age by District of Residence at the time of marriage-2015Male age group
District of Residence 20-24 25-29 30-34 35-39 40-44 45-49 50-54 55-59 60-64 65+ Total
Gaborone 9 130 312 264 178 87 42 27 21 16 1,086
Francistown 4 56 141 114 80 47 20 12 8 5 487
Lobatse - 11 39 21 16 4 1 5 1 4 102
Selibe Phikwe 4 22 83 52 56 34 11 13 6 4 285
Orapa 2 4 28 33 10 7 2 1 - - 87
Jwaneng 1 11 55 59 17 14 6 1 4 2 170
Sowa - 5 10 7 11 3 2 1 2 1 42
Ngwaketse/South-ern
- 28 56 67 68 44 36 29 19 51 398
Barolong 1 4 6 16 17 9 6 8 1 2 70
Ngwaketse West - - 2 1 1 - - 2 - 3 9
South East 5 38 79 81 49 34 15 7 4 2 314
Kweneng East 7 97 199 198 134 97 71 48 25 20 896
Kweneng West - 6 21 17 11 10 3 3 - 3 74
Kgatleng 2 19 64 56 41 21 19 7 2 10 241
Serowe/Palapye 2 32 83 102 63 63 37 26 19 33 460
Central Mahalapye - 9 35 40 33 32 23 11 11 12 206
Central Bobonong - 13 42 37 31 12 8 7 4 1 155
Central Boteti 1 14 42 39 26 7 7 5 1 4 146
Central Tutume 1 16 52 87 53 46 44 42 42 78 461
North East 2 13 26 29 29 20 15 17 10 42 203
Ngamiland East 2 27 81 80 45 52 17 15 9 15 343
Ngamiland West - 2 4 8 1 1 1 - 1 1 19
Chobe - 7 28 17 16 6 2 3 - - 79
Ghanzi 2 4 30 12 14 9 13 10 5 10 109
Kgalagadi South - 3 9 7 10 10 10 7 7 13 76
Kgalagadi North 1 2 9 13 2 9 7 3 3 - 49
Other Countries 5 12 23 18 24 8 8 4 3 2 107
Not Stated - - - 2 - 1 - - - - 3
Total 51 585 1,559 1,477 1,036 687 426 314 208 334 6,677
38 VITAL STATISTICS REPORT 2015
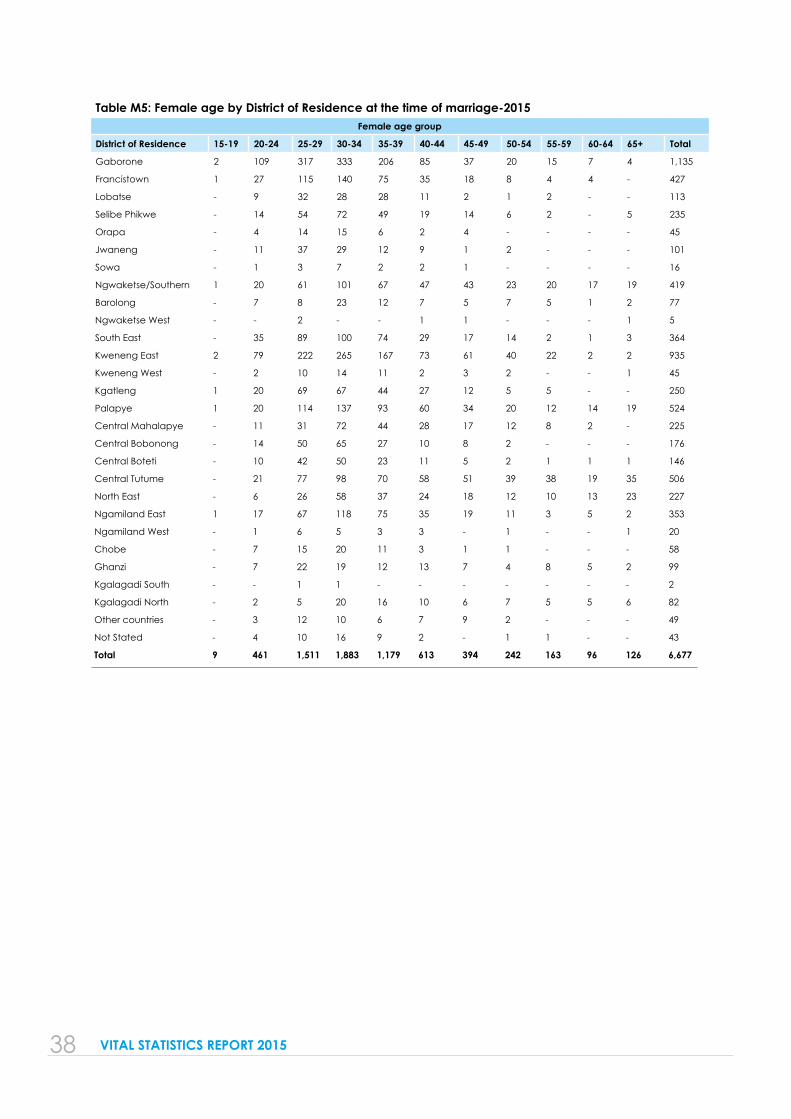
Table M5: Female age by District of Residence at the time of marriage-2015Female age group
District of Residence 15-19 20-24 25-29 30-34 35-39 40-44 45-49 50-54 55-59 60-64 65+ Total
Gaborone 2 109 317 333 206 85 37 20 15 7 4 1,135
Francistown 1 27 115 140 75 35 18 8 4 4 - 427
Lobatse - 9 32 28 28 11 2 1 2 - - 113
Selibe Phikwe - 14 54 72 49 19 14 6 2 - 5 235
Orapa - 4 14 15 6 2 4 - - - - 45
Jwaneng - 11 37 29 12 9 1 2 - - - 101
Sowa - 1 3 7 2 2 1 - - - - 16
Ngwaketse/Southern 1 20 61 101 67 47 43 23 20 17 19 419
Barolong - 7 8 23 12 7 5 7 5 1 2 77
Ngwaketse West - - 2 - - 1 1 - - - 1 5
South East - 35 89 100 74 29 17 14 2 1 3 364
Kweneng East 2 79 222 265 167 73 61 40 22 2 2 935
Kweneng West - 2 10 14 11 2 3 2 - - 1 45
Kgatleng 1 20 69 67 44 27 12 5 5 - - 250
Palapye 1 20 114 137 93 60 34 20 12 14 19 524
Central Mahalapye - 11 31 72 44 28 17 12 8 2 - 225
Central Bobonong - 14 50 65 27 10 8 2 - - - 176
Central Boteti - 10 42 50 23 11 5 2 1 1 1 146
Central Tutume - 21 77 98 70 58 51 39 38 19 35 506
North East - 6 26 58 37 24 18 12 10 13 23 227
Ngamiland East 1 17 67 118 75 35 19 11 3 5 2 353
Ngamiland West - 1 6 5 3 3 - 1 - - 1 20
Chobe - 7 15 20 11 3 1 1 - - - 58
Ghanzi - 7 22 19 12 13 7 4 8 5 2 99
Kgalagadi South - - 1 1 - - - - - - - 2
Kgalagadi North - 2 5 20 16 10 6 7 5 5 6 82
Other countries - 3 12 10 6 7 9 2 - - - 49
Not Stated - 4 10 16 9 2 - 1 1 - - 43
Total 9 461 1,511 1,883 1,179 613 394 242 163 96 126 6,677
39 VITAL STATISTICS REPORT 2015
Table M6: Previous marital status of person marrying-2005-2015
Year of marriage
Females
Total Percent Spinster Percent Divorced Percent Widowed Percent
Males
2005 Bachelor 4,024 91.9 3,962 92.8 36 48.6 25 75.8
Divorced 244 5.6 213 5 28 37.8 3 9.1
Widowed 111 2.5 96 2.2 10 13.5 5 15.2
Total 4,379 100 4,271 100 74 100 33 100
2006 Bachelor 3,984 91.9 3,926 93.3 38 42.2 20 54.1
Divorced 249 5.7 199 4.7 42 46.7 8 21.6
Widowed 102 2.4 83 2 10 11.1 9 24.3
Total 4,335 100 4,208 100 90 100 37 100
2007 Bachelor 4,585 91.8 4,504 92.5 46 58.2 35 74
Divorced 274 5.5 238 4.9 27 34.2 9 19
Widowed 138 2.8 129 2.6 6 7.6 3 6
Total 4,997 100 4,871 100 79 100 47 100
2008 Bachelor 4,629 91.9 4,550 92.9 83 55.2 26 60.5
Divorced 280 5.6 235 4.8 37 38.5 8 18.6
Widowed 128 2.5 113 2.3 6 6.3 9 20.9
Total 5,037 100 4,898 100 96 100 43 100
2009 Bachelor 4,124 91.2 4,034 92.4 54 53.5 36 67.9
Divorced 289 6.4 237 5.4 38 37.6 14 26.4
Widowed 108 2.4 96 2.2 9 8.9 3 5.7
Total 4,521 100 4,367 100 101 100 53 100
2010 Bachelor 4,022 91.1 3,924 92.4 67 54 31 66
Divorced 298 6.7 241 5.7 45 36.3 12 25.5
Widowed 96 2.2 80 1.9 12 9.7 4 8.5
Total 4,416 100 4,245 100 124 100 47 100
2011 Bachelor 4,133 89.8 4,040 91.3 67 54 26 49.1
Divorced 352 7.7 289 6.5 48 38.7 15 28.3
Widowed 116 2.5 95 2.1 9 7.3 12 22.6
Total 4,601 100 4,424 100 124 100 53 100
2012 Bachelor 4,739 90.9 4,634 92.3 71 50 34 64.2
Divorced 354 6.8 282 5.6 60 42.3 12 22.6
Widowed 121 2.3 103 2.1 11 7.7 7 13.2
Total 5,214 100 5,019 100 142 100 53 100
2013 Bachelor 4,858 91.1 4,775 89.5 51 39.8 32 66.7
Divorced 347 6.5 276 5.4 61 47.7 10 20.8
Widowed 128 2.4 106 2.1 16 12.5 6 12.5
Total 5,333 100 5,157 100 128 100 48 100
2014 Bachelor 5,068 90.6 4,947 91.9 94 57 27 64.3
Divorced 401 7.2 331 6.1 62 37.6 8 19
Widowed 122 2.2 106 2 9 5.5 7 16.7
Total 5,591 100 5,384 100 165 100 42 100
2015 Bachelor 6,008 90 5,868 91.4 101 54.3 39 55.7
Divorced 482 7.2 398 6.2 65 34.9 19 27.1
Widowed 187 2.8 155 2.4 20 10.8 12 17.1
Total 6,677 100 6,421 100 186 100 70 100
40 VITAL STATISTICS REPORT 2015
Table D1 : Registered deaths by occurrence, district and sex - 2015
District of usual residence
Occurred in 2015 Occurred prior to 2015 TotalRegisteredMale Female Total Male Female Total
Gaborone 615 517 1,132 13 15 28 1,160
Francistown 226 194 420 8 6 14 434
Lobatse 76 74 150 2 2 4 154
Selibe Phikwe 81 64 145 5 10 15 160
Orapa 4 4 8 - - - 8
Jwaneng 25 15 40 1 - 1 41
Sowa Town 3 1 4 - - - 4
Ngwaketse 590 490 1,080 36 75 111 1,191
Barolong 199 189 388 15 19 34 422
Ngwaketse West 54 47 101 7 7 14 115
South East 217 204 421 15 16 31 452
Kweneng East 749 718 1,467 59 115 174 1,641
Kweneng West 143 137 280 23 59 82 362
Kgatleng 367 368 735 24 22 46 781
Central-Serowe 601 614 1,215 23 91 114 1,329
Central-Mahal-apye
441 424 865 27 65 92 957
Central-Bobo-nong
317 327 644 34 59 93 737
Central-Boteti 192 191 383 12 37 49 432
Central-Tutume 546 592 1,138 48 85 133 1,271
North East 204 264 468 17 16 33 501
Ngamilang South
279 266 545 42 52 94 639
Ngamiland West 205 173 378 32 59 91 469
Chobe 50 49 99 14 15 29 128
Ngamiland Delta
3 4 7 - - - 7
Ghanzi 165 150 315 10 41 51 366
Kgalagadi South 73 64 137 10 31 41 178
Kgalagadi North 67 61 128 1 3 4 132
Other Countries 60 31 91 - - - 91
Not stated 133 113 246 6 7 13 259
Total 6,685 6,345 13,030 484 907 1,391 14,421
41 VITAL STATISTICS REPORT 2015
Table D1 : Registered deaths by occurrence, district and sex - 2015
District of usual residence
Occurred in 2015 Occurred prior to 2015 TotalRegisteredMale Female Total Male Female Total
Gaborone 615 517 1,132 13 15 28 1,160
Francistown 226 194 420 8 6 14 434
Lobatse 76 74 150 2 2 4 154
Selibe Phikwe 81 64 145 5 10 15 160
Orapa 4 4 8 - - - 8
Jwaneng 25 15 40 1 - 1 41
Sowa Town 3 1 4 - - - 4
Ngwaketse 590 490 1,080 36 75 111 1,191
Barolong 199 189 388 15 19 34 422
Ngwaketse West 54 47 101 7 7 14 115
South East 217 204 421 15 16 31 452
Kweneng East 749 718 1,467 59 115 174 1,641
Kweneng West 143 137 280 23 59 82 362
Kgatleng 367 368 735 24 22 46 781
Central-Serowe 601 614 1,215 23 91 114 1,329
Central-Mahal-apye
441 424 865 27 65 92 957
Central-Bobo-nong
317 327 644 34 59 93 737
Central-Boteti 192 191 383 12 37 49 432
Central-Tutume 546 592 1,138 48 85 133 1,271
North East 204 264 468 17 16 33 501
Ngamilang South
279 266 545 42 52 94 639
Ngamiland West 205 173 378 32 59 91 469
Chobe 50 49 99 14 15 29 128
Ngamiland Delta
3 4 7 - - - 7
Ghanzi 165 150 315 10 41 51 366
Kgalagadi South 73 64 137 10 31 41 178
Kgalagadi North 67 61 128 1 3 4 132
Other Countries 60 31 91 - - - 91
Not stated 133 113 246 6 7 13 259
Total 6,685 6,345 13,030 484 907 1,391 14,421
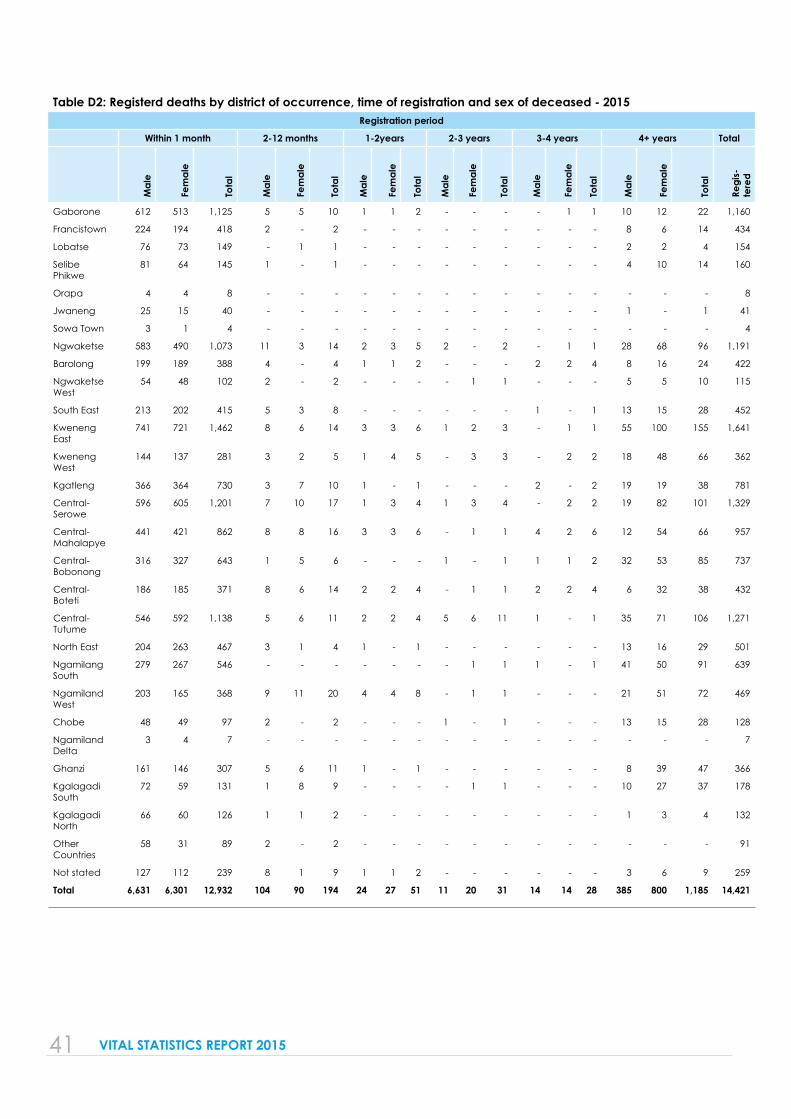
Table D2: Registerd deaths by district of occurrence, time of registration and sex of deceased - 2015Registration period
Within 1 month 2-12 months 1-2years 2-3 years 3-4 years 4+ years TotalM
ale
Fem
ale
Tota
l
Mal
e
Fem
ale
Tota
l
Mal
e
Fem
ale
Tota
l
Mal
e
Fem
ale
Tota
l
Mal
e
Fem
ale
Tota
l
Mal
e
Fem
ale
Tota
l
Regi
s-te
red
Gaborone 612 513 1,125 5 5 10 1 1 2 - - - - 1 1 10 12 22 1,160
Francistown 224 194 418 2 - 2 - - - - - - - - - 8 6 14 434
Lobatse 76 73 149 - 1 1 - - - - - - - - - 2 2 4 154
Selibe Phikwe
81 64 145 1 - 1 - - - - - - - - - 4 10 14 160
Orapa 4 4 8 - - - - - - - - - - - - - - - 8
Jwaneng 25 15 40 - - - - - - - - - - - - 1 - 1 41
Sowa Town 3 1 4 - - - - - - - - - - - - - - - 4
Ngwaketse 583 490 1,073 11 3 14 2 3 5 2 - 2 - 1 1 28 68 96 1,191
Barolong 199 189 388 4 - 4 1 1 2 - - - 2 2 4 8 16 24 422
Ngwaketse West
54 48 102 2 - 2 - - - - 1 1 - - - 5 5 10 115
South East 213 202 415 5 3 8 - - - - - - 1 - 1 13 15 28 452
Kweneng East
741 721 1,462 8 6 14 3 3 6 1 2 3 - 1 1 55 100 155 1,641
Kweneng West
144 137 281 3 2 5 1 4 5 - 3 3 - 2 2 18 48 66 362
Kgatleng 366 364 730 3 7 10 1 - 1 - - - 2 - 2 19 19 38 781
Central-Serowe
596 605 1,201 7 10 17 1 3 4 1 3 4 - 2 2 19 82 101 1,329
Central-Mahalapye
441 421 862 8 8 16 3 3 6 - 1 1 4 2 6 12 54 66 957
Central-Bobonong
316 327 643 1 5 6 - - - 1 - 1 1 1 2 32 53 85 737
Central-Boteti
186 185 371 8 6 14 2 2 4 - 1 1 2 2 4 6 32 38 432
Central-Tutume
546 592 1,138 5 6 11 2 2 4 5 6 11 1 - 1 35 71 106 1,271
North East 204 263 467 3 1 4 1 - 1 - - - - - - 13 16 29 501
Ngamilang South
279 267 546 - - - - - - - 1 1 1 - 1 41 50 91 639
Ngamiland West
203 165 368 9 11 20 4 4 8 - 1 1 - - - 21 51 72 469
Chobe 48 49 97 2 - 2 - - - 1 - 1 - - - 13 15 28 128
Ngamiland Delta
3 4 7 - - - - - - - - - - - - - - - 7
Ghanzi 161 146 307 5 6 11 1 - 1 - - - - - - 8 39 47 366
Kgalagadi South
72 59 131 1 8 9 - - - - 1 1 - - - 10 27 37 178
Kgalagadi North
66 60 126 1 1 2 - - - - - - - - - 1 3 4 132
Other Countries
58 31 89 2 - 2 - - - - - - - - - - - - 91
Not stated 127 112 239 8 1 9 1 1 2 - - - - - - 3 6 9 259
Total 6,631 6,301 12,932 104 90 194 24 27 51 11 20 31 14 14 28 385 800 1,185 14,421
42 VITAL STATISTICS REPORT 2015
Table D3: Registered deaths by time of registration and registration centres - 2015Timely registration Late Registration
TotalWithin 1 month 2-12 months 1-2 years 2-3 years 3-4 years 4+ years
Athlone Hospital 265 2 - - - - 267
Bamalete Lutheran 236 5 - - - - 241
Barolong 286 3 2 - 3 16 310
Bokamoso Hospital 156 - - - - - 156
Borakanelo 241 3 2 - 1 54 301
Broadhurst 202 2 3 - 1 32 240
Central Bobonong 246 6 - - 1 29 282
Central Boteti 296 14 4 3 4 35 356
Central Mahalapye 102 6 4 - 1 42 155
Serowe Palapye 66 6 1 1 - 22 96
Central Tutume 390 5 1 2 1 39 438
Charleshill 30 4 - - - 17 51
Chobe 62 2 - 1 - 28 93
Deborah Retief 124 3 - - - - 127
Francistown 167 - 3 2 - 48 220
Gaborone 229 5 - - - 54 288
Gantsi 49 1 1 - - 27 78
Gantsi Primary Hosp 188 2 - - - - 190
Gumare 253 16 5 - - 62 336
Hukuntsi 111 2 - - - 2 115
Jwaneng 91 5 2 1 1 22 122
Jwaneng Hosp 84 - - - - - 84
Kgalagadi 109 6 - 1 - 38 154
Kgatleng 458 7 2 - 2 34 503
Kweneng 225 5 4 3 2 73 312
Letlhakeng 114 4 5 3 1 62 189
Letsholathebe Hosp 640 4 - - - 1 645
Lobatse 104 - - - 1 16 121
Mabutsane 34 1 - 1 - 8 44
Mahalapye Hosp 501 9 - - 2 6 518
Moshupa 345 2 1 - - 43 391
Hnata 88 - - 3 - 16 107
Ngamiland 36 - 1 1 1 98 137
Ngwaketse 458 5 - - - 34 497
North East 131 4 1 - - 10 146
Nyangabgwe 1,513 10 - 1 - - 1,524
Orapa 1 - - - - - 1
Palapye 397 6 2 3 2 62 472
Princess Marina 2,051 24 2 - - 1 2,078
Ramotswa 26 - - - - 21 47
Scotish Livingstone 552 1 - - - - 553
Sefhare 149 3 1 1 3 18 175
Sekgoma Hospital 505 2 - - - - 507
Selibe Phikwe 303 4 1 1 1 70 380
Shakawe 15 2 3 1 - 8 29
Sowa 14 1 - - - 7 22
S/ Phikwe G.Hosp 128 - - - - - 128
Tlokweng 24 1 - - - 5 30
Tonota 137 1 - 2 - 25 165
Total 12,932 194 51 31 28 1,185 14,421
43 VITAL STATISTICS REPORT 2015
Table D3: Registered deaths by time of registration and registration centres - 2015Timely registration Late Registration
TotalWithin 1 month 2-12 months 1-2 years 2-3 years 3-4 years 4+ years
Athlone Hospital 265 2 - - - - 267
Bamalete Lutheran 236 5 - - - - 241
Barolong 286 3 2 - 3 16 310
Bokamoso Hospital 156 - - - - - 156
Borakanelo 241 3 2 - 1 54 301
Broadhurst 202 2 3 - 1 32 240
Central Bobonong 246 6 - - 1 29 282
Central Boteti 296 14 4 3 4 35 356
Central Mahalapye 102 6 4 - 1 42 155
Serowe Palapye 66 6 1 1 - 22 96
Central Tutume 390 5 1 2 1 39 438
Charleshill 30 4 - - - 17 51
Chobe 62 2 - 1 - 28 93
Deborah Retief 124 3 - - - - 127
Francistown 167 - 3 2 - 48 220
Gaborone 229 5 - - - 54 288
Gantsi 49 1 1 - - 27 78
Gantsi Primary Hosp 188 2 - - - - 190
Gumare 253 16 5 - - 62 336
Hukuntsi 111 2 - - - 2 115
Jwaneng 91 5 2 1 1 22 122
Jwaneng Hosp 84 - - - - - 84
Kgalagadi 109 6 - 1 - 38 154
Kgatleng 458 7 2 - 2 34 503
Kweneng 225 5 4 3 2 73 312
Letlhakeng 114 4 5 3 1 62 189
Letsholathebe Hosp 640 4 - - - 1 645
Lobatse 104 - - - 1 16 121
Mabutsane 34 1 - 1 - 8 44
Mahalapye Hosp 501 9 - - 2 6 518
Moshupa 345 2 1 - - 43 391
Hnata 88 - - 3 - 16 107
Ngamiland 36 - 1 1 1 98 137
Ngwaketse 458 5 - - - 34 497
North East 131 4 1 - - 10 146
Nyangabgwe 1,513 10 - 1 - - 1,524
Orapa 1 - - - - - 1
Palapye 397 6 2 3 2 62 472
Princess Marina 2,051 24 2 - - 1 2,078
Ramotswa 26 - - - - 21 47
Scotish Livingstone 552 1 - - - - 553
Sefhare 149 3 1 1 3 18 175
Sekgoma Hospital 505 2 - - - - 507
Selibe Phikwe 303 4 1 1 1 70 380
Shakawe 15 2 3 1 - 8 29
Sowa 14 1 - - - 7 22
S/ Phikwe G.Hosp 128 - - - - - 128
Tlokweng 24 1 - - - 5 30
Tonota 137 1 - 2 - 25 165
Total 12,932 194 51 31 28 1,185 14,421
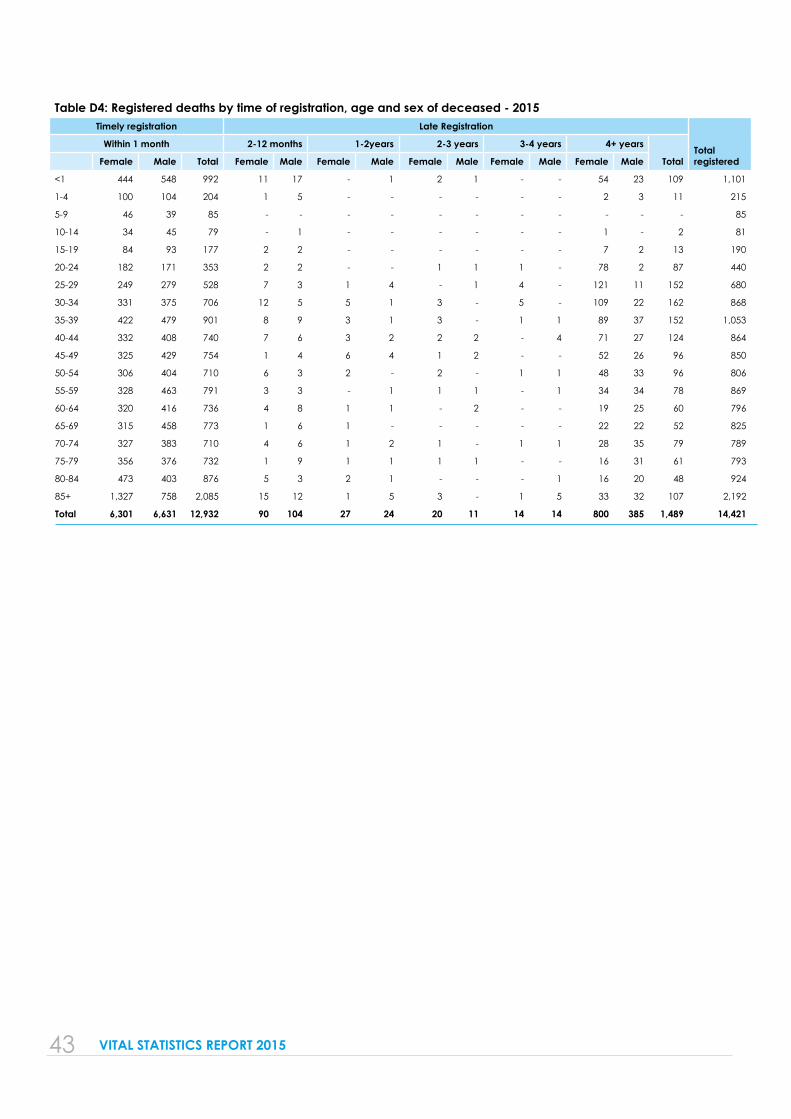
Table D4: Registered deaths by time of registration, age and sex of deceased - 2015Timely registration Late Registration
Totalregistered
Within 1 month 2-12 months 1-2years 2-3 years 3-4 years 4+ years
TotalFemale Male Total Female Male Female Male Female Male Female Male Female Male
<1 444 548 992 11 17 - 1 2 1 - - 54 23 109 1,101
1-4 100 104 204 1 5 - - - - - - 2 3 11 215
5-9 46 39 85 - - - - - - - - - - - 85
10-14 34 45 79 - 1 - - - - - - 1 - 2 81
15-19 84 93 177 2 2 - - - - - - 7 2 13 190
20-24 182 171 353 2 2 - - 1 1 1 - 78 2 87 440
25-29 249 279 528 7 3 1 4 - 1 4 - 121 11 152 680
30-34 331 375 706 12 5 5 1 3 - 5 - 109 22 162 868
35-39 422 479 901 8 9 3 1 3 - 1 1 89 37 152 1,053
40-44 332 408 740 7 6 3 2 2 2 - 4 71 27 124 864
45-49 325 429 754 1 4 6 4 1 2 - - 52 26 96 850
50-54 306 404 710 6 3 2 - 2 - 1 1 48 33 96 806
55-59 328 463 791 3 3 - 1 1 1 - 1 34 34 78 869
60-64 320 416 736 4 8 1 1 - 2 - - 19 25 60 796
65-69 315 458 773 1 6 1 - - - - - 22 22 52 825
70-74 327 383 710 4 6 1 2 1 - 1 1 28 35 79 789
75-79 356 376 732 1 9 1 1 1 1 - - 16 31 61 793
80-84 473 403 876 5 3 2 1 - - - 1 16 20 48 924
85+ 1,327 758 2,085 15 12 1 5 3 - 1 5 33 32 107 2,192
Total 6,301 6,631 12,932 90 104 27 24 20 11 14 14 800 385 1,489 14,421
44 VITAL STATISTICS REPORT 2015
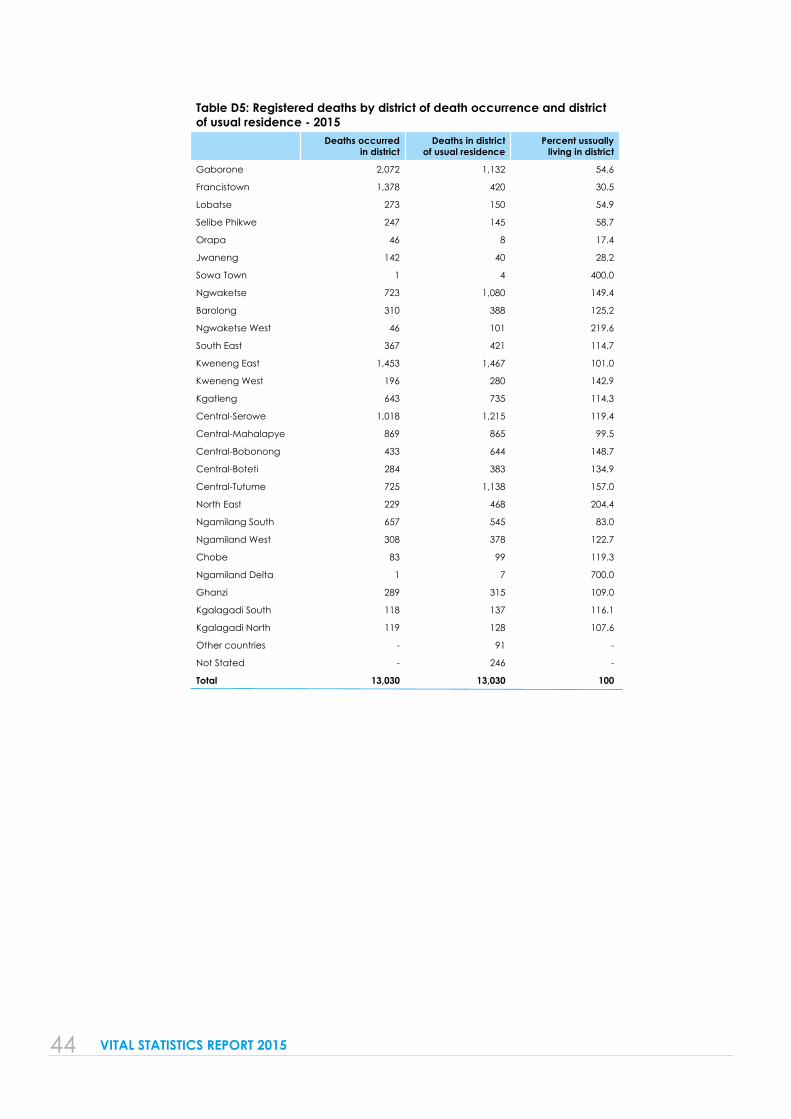
Table D5: Registered deaths by district of death occurrence and district of usual residence - 2015
Deaths occurred in district
Deaths in district of usual residence
Percent ussually living in district
Gaborone 2,072 1,132 54.6
Francistown 1,378 420 30.5
Lobatse 273 150 54.9
Selibe Phikwe 247 145 58.7
Orapa 46 8 17.4
Jwaneng 142 40 28.2
Sowa Town 1 4 400.0
Ngwaketse 723 1,080 149.4
Barolong 310 388 125.2
Ngwaketse West 46 101 219.6
South East 367 421 114.7
Kweneng East 1,453 1,467 101.0
Kweneng West 196 280 142.9
Kgatleng 643 735 114.3
Central-Serowe 1,018 1,215 119.4
Central-Mahalapye 869 865 99.5
Central-Bobonong 433 644 148.7
Central-Boteti 284 383 134.9
Central-Tutume 725 1,138 157.0
North East 229 468 204.4
Ngamilang South 657 545 83.0
Ngamiland West 308 378 122.7
Chobe 83 99 119.3
Ngamiland Delta 1 7 700.0
Ghanzi 289 315 109.0
Kgalagadi South 118 137 116.1
Kgalagadi North 119 128 107.6
Other countries - 91 -
Not Stated - 246 -
Total 13,030 13,030 100
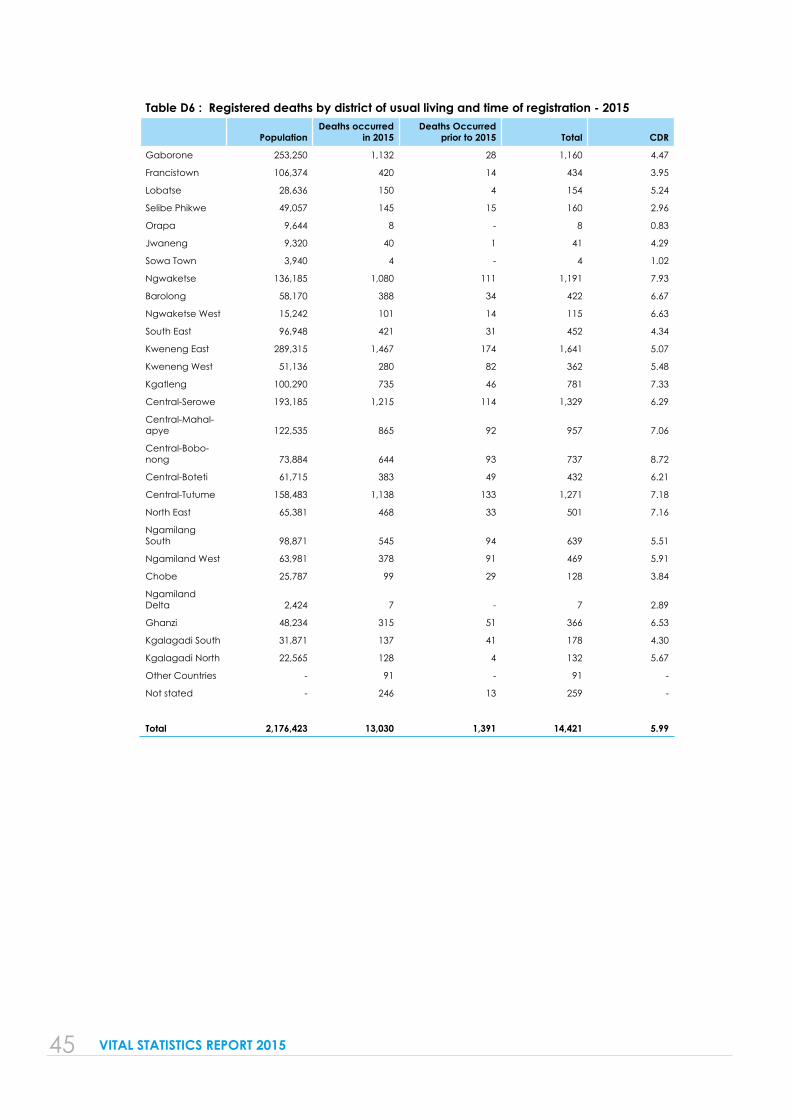
45 VITAL STATISTICS REPORT 2015
Table D6 : Registered deaths by district of usual living and time of registration - 2015
PopulationDeaths occurred
in 2015Deaths Occurred
prior to 2015 Total CDR
Gaborone 253,250 1,132 28 1,160 4.47
Francistown 106,374 420 14 434 3.95
Lobatse 28,636 150 4 154 5.24
Selibe Phikwe 49,057 145 15 160 2.96
Orapa 9,644 8 - 8 0.83
Jwaneng 9,320 40 1 41 4.29
Sowa Town 3,940 4 - 4 1.02
Ngwaketse 136,185 1,080 111 1,191 7.93
Barolong 58,170 388 34 422 6.67
Ngwaketse West 15,242 101 14 115 6.63
South East 96,948 421 31 452 4.34
Kweneng East 289,315 1,467 174 1,641 5.07
Kweneng West 51,136 280 82 362 5.48
Kgatleng 100,290 735 46 781 7.33
Central-Serowe 193,185 1,215 114 1,329 6.29
Central-Mahal-apye 122,535 865 92 957 7.06
Central-Bobo-nong 73,884 644 93 737 8.72
Central-Boteti 61,715 383 49 432 6.21
Central-Tutume 158,483 1,138 133 1,271 7.18
North East 65,381 468 33 501 7.16
Ngamilang South 98,871 545 94 639 5.51
Ngamiland West 63,981 378 91 469 5.91
Chobe 25,787 99 29 128 3.84
Ngamiland Delta 2,424 7 - 7 2.89
Ghanzi 48,234 315 51 366 6.53
Kgalagadi South 31,871 137 41 178 4.30
Kgalagadi North 22,565 128 4 132 5.67
Other Countries - 91 - 91 -
Not stated - 246 13 259 -
Total 2,176,423 13,030 1,391 14,421 5.99
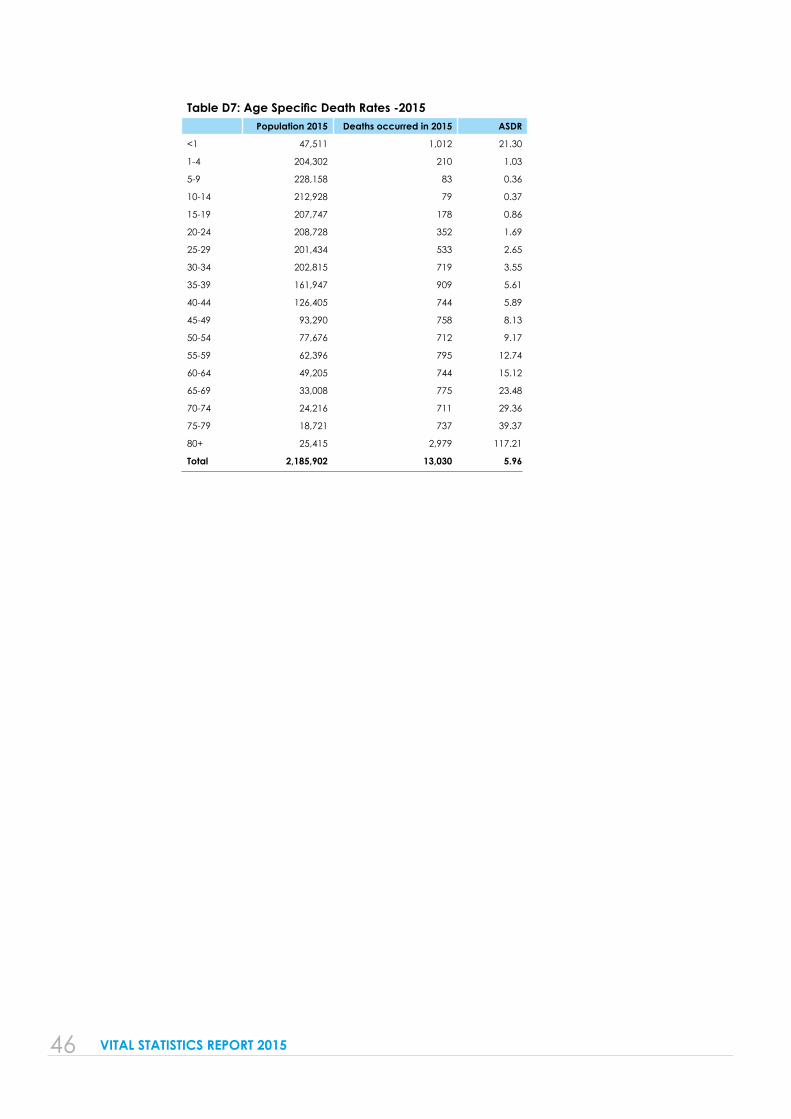
46 VITAL STATISTICS REPORT 2015
Table D7: Age Specific Death Rates -2015Population 2015 Deaths occurred in 2015 ASDR
<1 47,511 1,012 21.30
1-4 204,302 210 1.03
5-9 228,158 83 0.36
10-14 212,928 79 0.37
15-19 207,747 178 0.86
20-24 208,728 352 1.69
25-29 201,434 533 2.65
30-34 202,815 719 3.55
35-39 161,947 909 5.61
40-44 126,405 744 5.89
45-49 93,290 758 8.13
50-54 77,676 712 9.17
55-59 62,396 795 12.74
60-64 49,205 744 15.12
65-69 33,008 775 23.48
70-74 24,216 711 29.36
75-79 18,721 737 39.37
80+ 25,415 2,979 117.21
Total 2,185,902 13,030 5.96
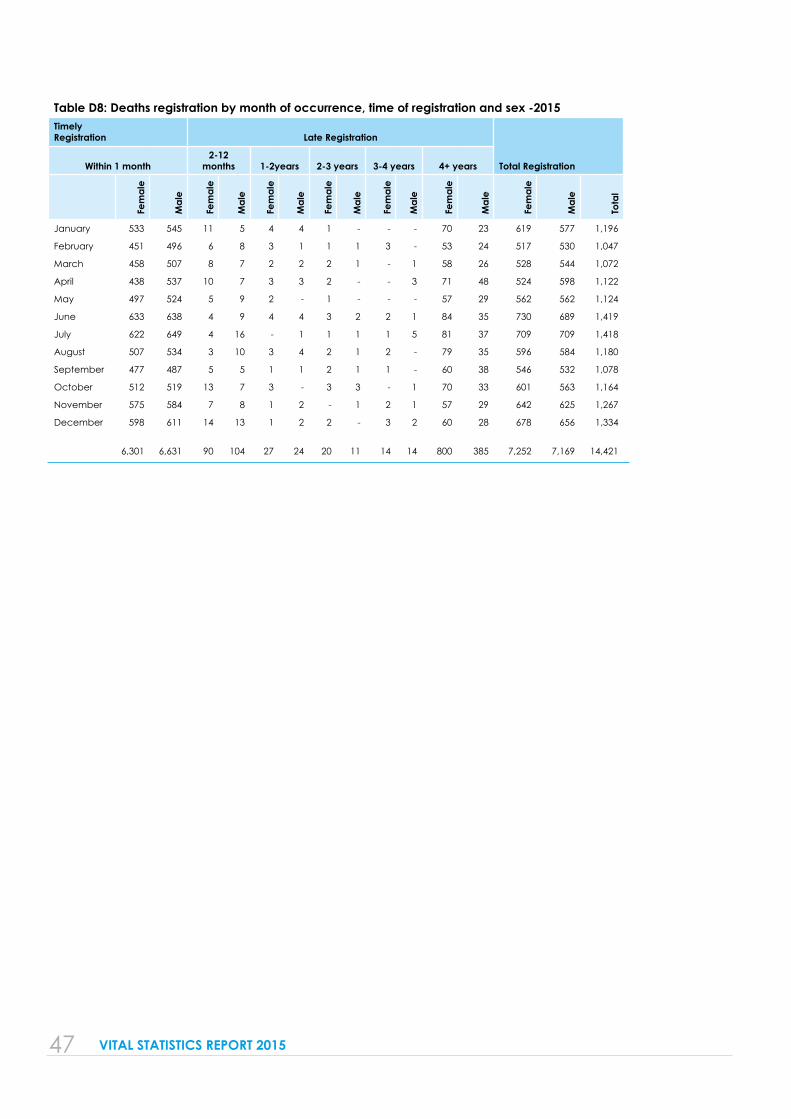
47 VITAL STATISTICS REPORT 2015
Table D8: Deaths registration by month of occurrence, time of registration and sex -2015Timely Registration Late Registration
Total RegistrationWithin 1 month2-12
months 1-2years 2-3 years 3-4 years 4+ years
Fem
ale
Mal
e
Fem
ale
Mal
e
Fem
ale
Mal
e
Fem
ale
Mal
e
Fem
ale
Mal
e
Fem
ale
Mal
e
Fem
ale
Mal
e
Tota
l
January 533 545 11 5 4 4 1 - - - 70 23 619 577 1,196
February 451 496 6 8 3 1 1 1 3 - 53 24 517 530 1,047
March 458 507 8 7 2 2 2 1 - 1 58 26 528 544 1,072
April 438 537 10 7 3 3 2 - - 3 71 48 524 598 1,122
May 497 524 5 9 2 - 1 - - - 57 29 562 562 1,124
June 633 638 4 9 4 4 3 2 2 1 84 35 730 689 1,419
July 622 649 4 16 - 1 1 1 1 5 81 37 709 709 1,418
August 507 534 3 10 3 4 2 1 2 - 79 35 596 584 1,180
September 477 487 5 5 1 1 2 1 1 - 60 38 546 532 1,078
October 512 519 13 7 3 - 3 3 - 1 70 33 601 563 1,164
November 575 584 7 8 1 2 - 1 2 1 57 29 642 625 1,267
December 598 611 14 13 1 2 2 - 3 2 60 28 678 656 1,334
6,301 6,631 90 104 27 24 20 11 14 14 800 385 7,252 7,169 14,421
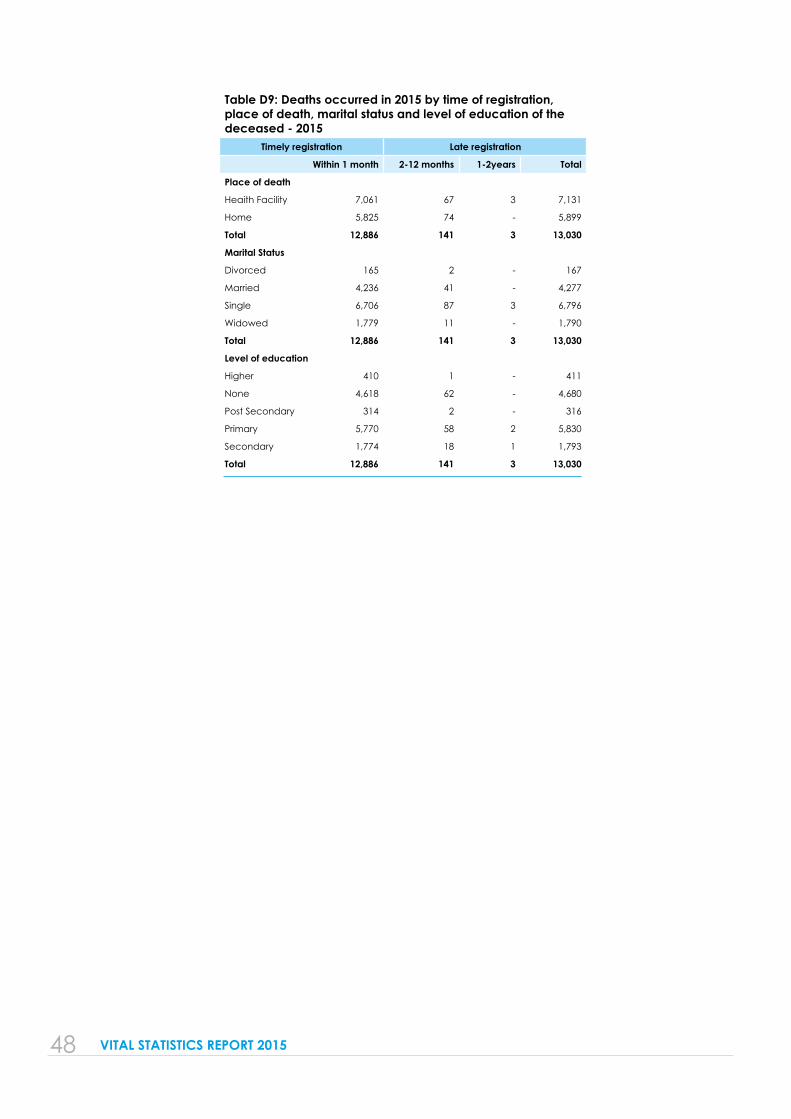
48 VITAL STATISTICS REPORT 2015
Table D9: Deaths occurred in 2015 by time of registration, place of death, marital status and level of education of the deceased - 2015
Timely registration Late registration
Within 1 month 2-12 months 1-2years Total
Place of death
Heaith Facility 7,061 67 3 7,131
Home 5,825 74 - 5,899
Total 12,886 141 3 13,030
Marital Status
Divorced 165 2 - 167
Married 4,236 41 - 4,277
Single 6,706 87 3 6,796
Widowed 1,779 11 - 1,790
Total 12,886 141 3 13,030
Level of education
Higher 410 1 - 411
None 4,618 62 - 4,680
Post Secondary 314 2 - 316
Primary 5,770 58 2 5,830
Secondary 1,774 18 1 1,793
Total 12,886 141 3 13,030

49 VITAL STATISTICS REPORT 2015

![Saving Lives at Birth: The Impact of Home Births on … · giving birth in a hospital leads to substantial reductions in newborn ... notes that “[a] ... The Impact of Home Births](https://img.pdfslide.us/doc/110x75/5b80907e7f8b9a2a088d7241/saving-lives-at-birth-the-impact-of-home-births-on-giving-birth-in-a-hospital.jpg)