Embed Size (px)
Citation preview


1 VIOHALCO 2 Steel 3 Steel Pipe 4 Aluminium 5 Copper 6 Cables 7 Real Estate 8 Financial Appendix
Corporate Presentation
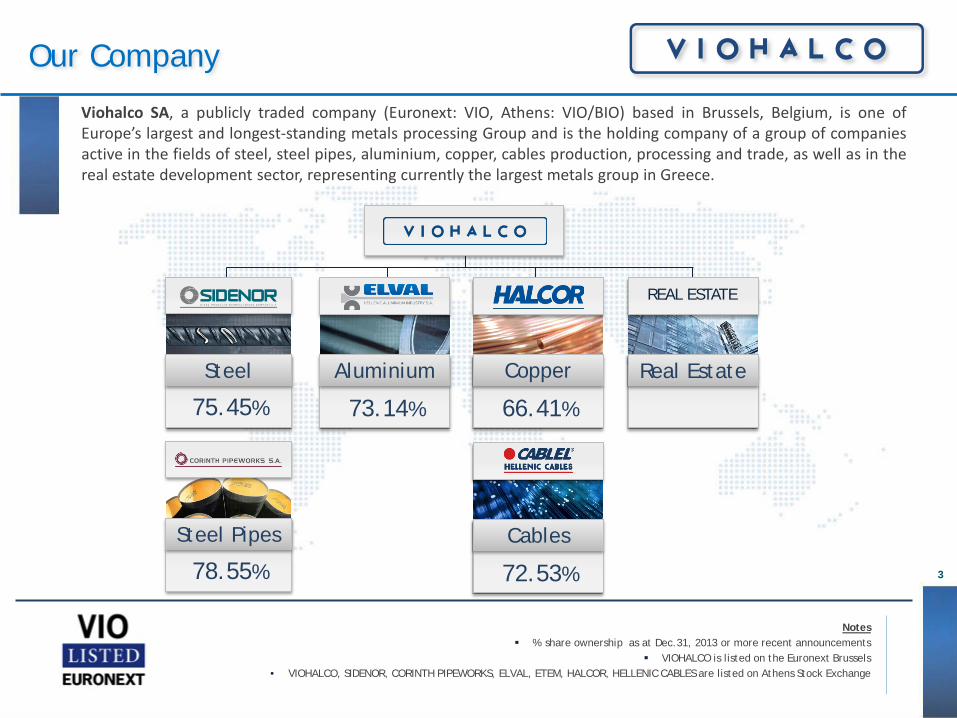
Viohalco SA, a publicly traded company (Euronext: VIO, Athens: VIO/BIO) based in Brussels, Belgium, is one of Europe’s largest and longest-standing metals processing Group and is the holding company of a group of companies active in the fields of steel, steel pipes, aluminium, copper, cables production, processing and trade, as well as in the real estate development sector, representing currently the largest metals group in Greece.
Our Company
Aluminium
73.14%
Copper
66.41%
Real Estate
REAL ESTATE
75.45%
Steel
78.55%
Steel Pipes Cables
72.53%
Notes % share ownership as at Dec.31, 2013 or more recent announcements
VIOHALCO is listed on the Euronext Brussels • VIOHALCO, SIDENOR, CORINTH PIPEWORKS, ELVAL, ETEM, HALCOR, HELLENIC CABLES are listed on Athens Stock Exchange
3
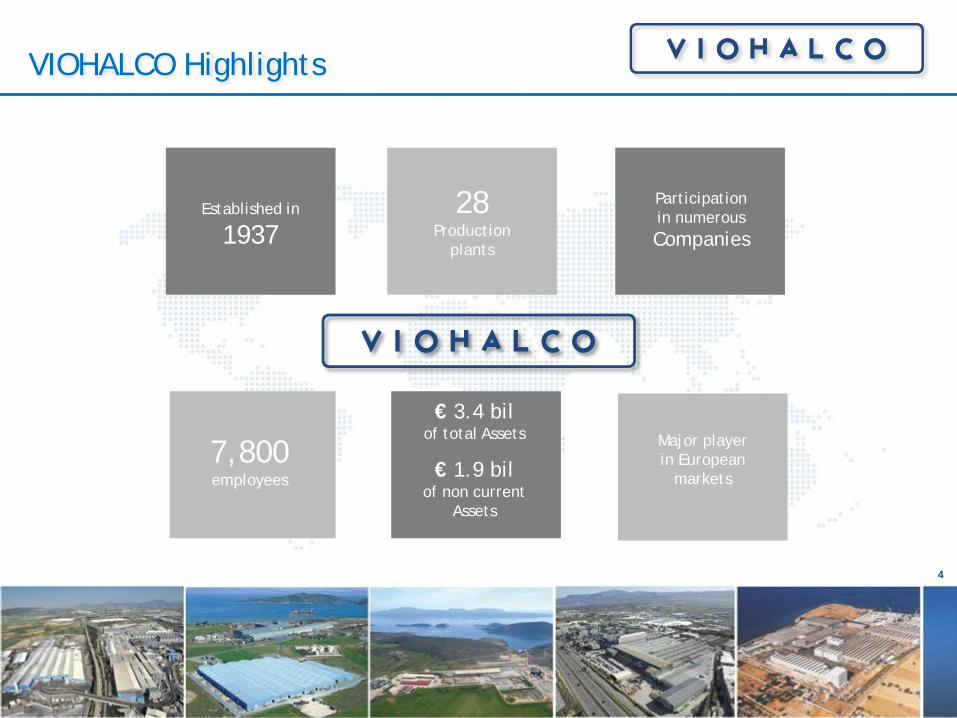
Established in
1937
7,800 employees
Major player in European
markets
28 Production
plants
Participation in numerous Companies
€ 1.9 bil of non current
Assets
€ 3.4 bil of total Assets
4
VIOHALCO Highlights
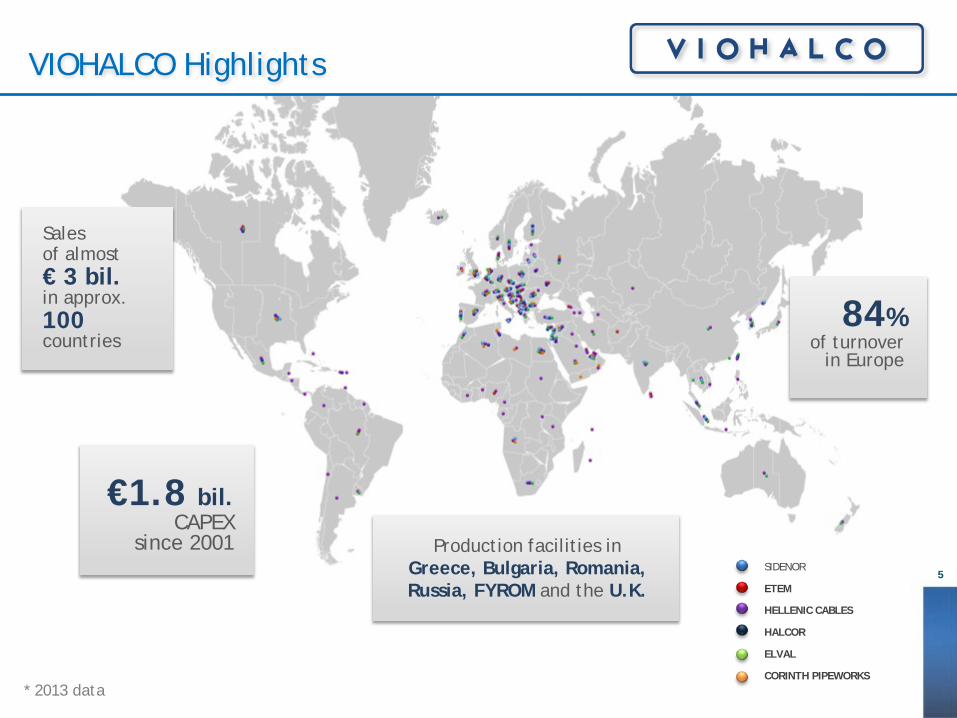
€1.8 bil. CAPEX
since 2001
* 2013 data
Sales of almost € 3 bil. in approx. 100 countries
Production facilities in Greece, Bulgaria, Romania, Russia, FYROM and the U.K.
84% of turnover
in Europe
SIDENOR
ETEM
HELLENIC CABLES
HALCOR
ELVAL
CORINTH PIPEWORKS
5
VIOHALCO Highlights
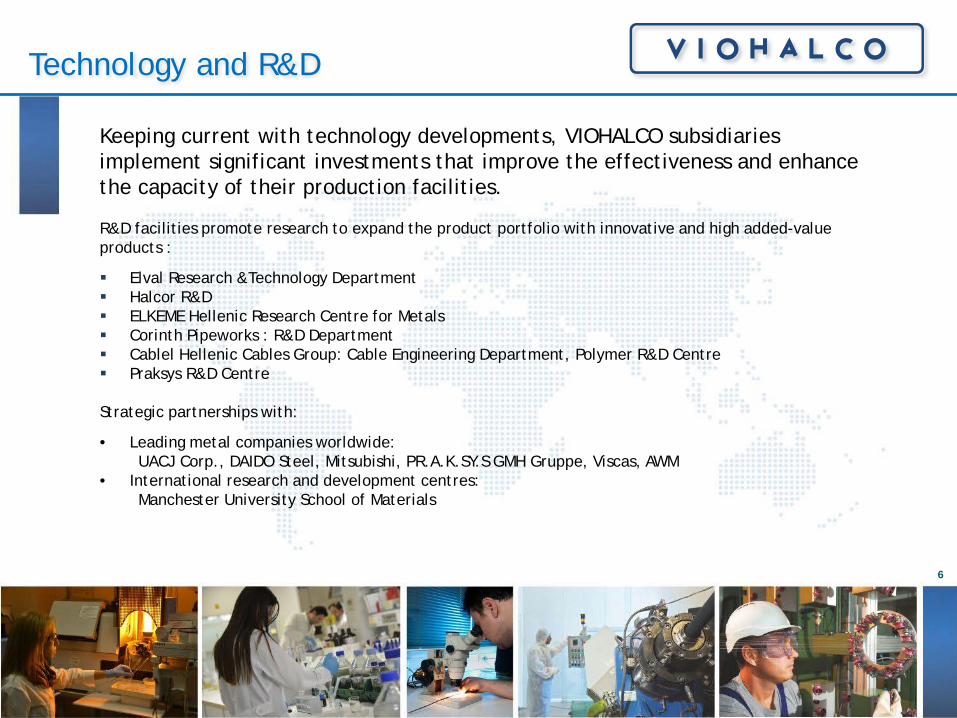
Keeping current with technology developments, VIOHALCO subsidiaries implement significant investments that improve the effectiveness and enhance the capacity of their production facilities. R&D facilities promote research to expand the product portfolio with innovative and high added-value products :
Elval Research &Technology Department Halcor R&D ELKEME Hellenic Research Centre for Metals Corinth Pipeworks : R&D Department Cablel Hellenic Cables Group: Cable Engineering Department, Polymer R&D Centre Praksys R&D Centre Strategic partnerships with:
• Leading metal companies worldwide: UACJ Corp., DAIDO Steel, Mitsubishi, PR.A.K.SY.S GMH Gruppe, Viscas, AWM • International research and development centres: Manchester University School of Materials
Technology and R&D
6
7
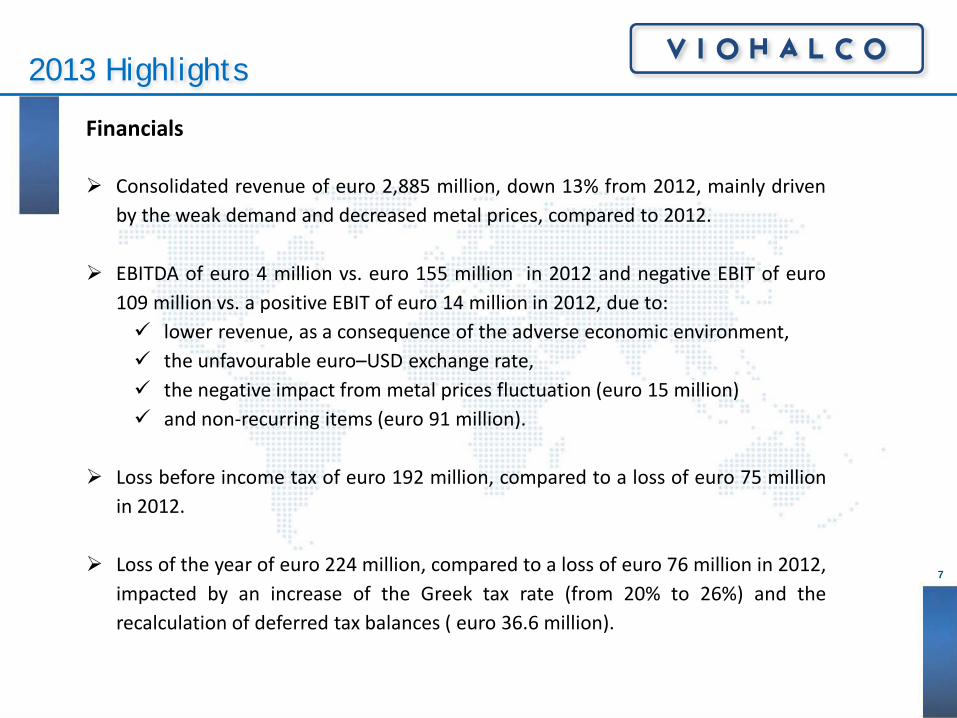
2013 Highlights
Financials Consolidated revenue of euro 2,885 million, down 13% from 2012, mainly driven
by the weak demand and decreased metal prices, compared to 2012. EBITDA of euro 4 million vs. euro 155 million in 2012 and negative EBIT of euro
109 million vs. a positive EBIT of euro 14 million in 2012, due to: lower revenue, as a consequence of the adverse economic environment, the unfavourable euro–USD exchange rate, the negative impact from metal prices fluctuation (euro 15 million) and non-recurring items (euro 91 million).
Loss before income tax of euro 192 million, compared to a loss of euro 75 million
in 2012.
Loss of the year of euro 224 million, compared to a loss of euro 76 million in 2012, impacted by an increase of the Greek tax rate (from 20% to 26%) and the recalculation of deferred tax balances ( euro 36.6 million).
8
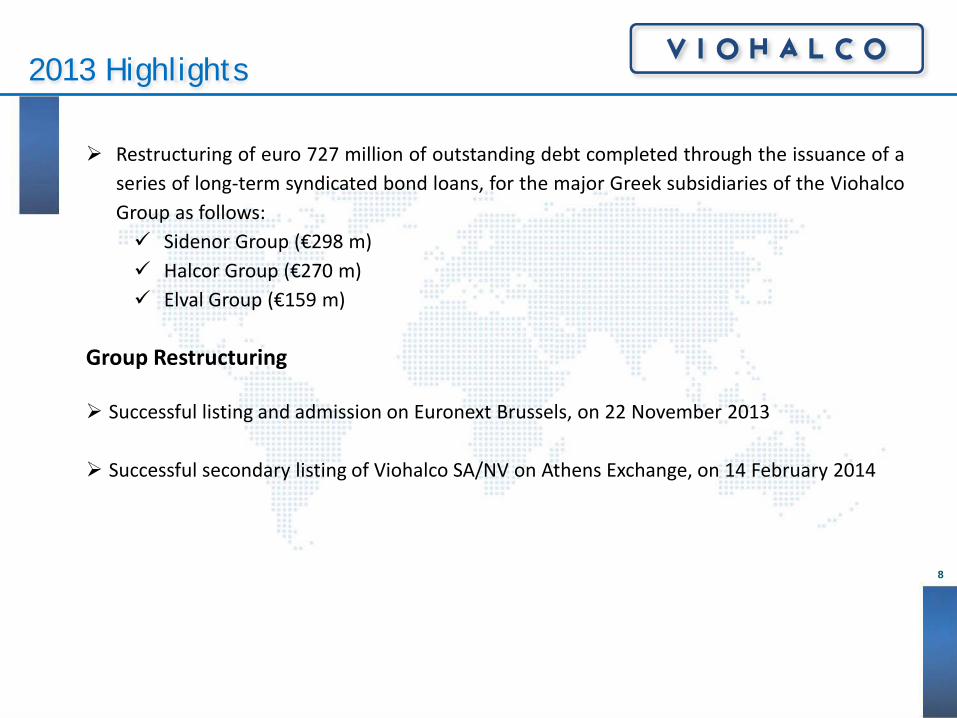
2013 Highlights
Restructuring of euro 727 million of outstanding debt completed through the issuance of a
series of long-term syndicated bond loans, for the major Greek subsidiaries of the Viohalco Group as follows: Sidenor Group (€298 m) Halcor Group (€270 m) Elval Group (€159 m)
Group Restructuring Successful listing and admission on Euronext Brussels, on 22 November 2013
Successful secondary listing of Viohalco SA/NV on Athens Exchange, on 14 February 2014
9
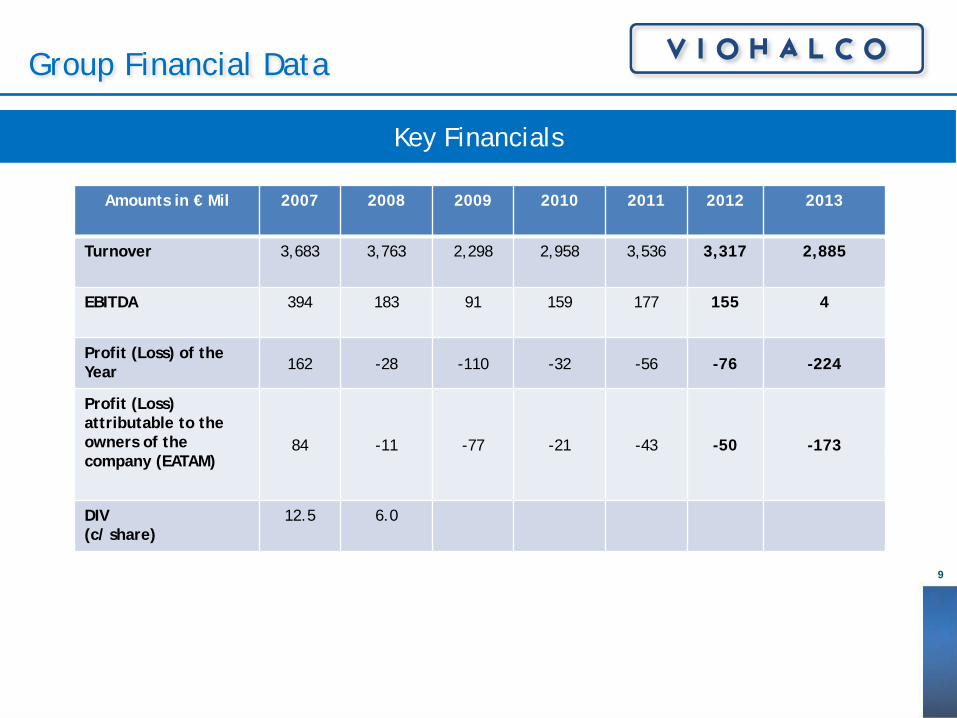
Group Financial Data
Amounts in € Mil 2007 2008 2009 2010 2011 2012 2013
Turnover
3,683 3,763 2,298 2,958 3,536 3,317 2,885
EBITDA 394
183 91
159 177 155 4
Profit (Loss) of the Year 162 -28 -110 -32 -56 -76 -224
Profit (Loss) attributable to the owners of the company (EATAM)
84 -11 -77 -21 -43 -50 -173
DIV (c/ share)
12.5 6.0
Key Financials
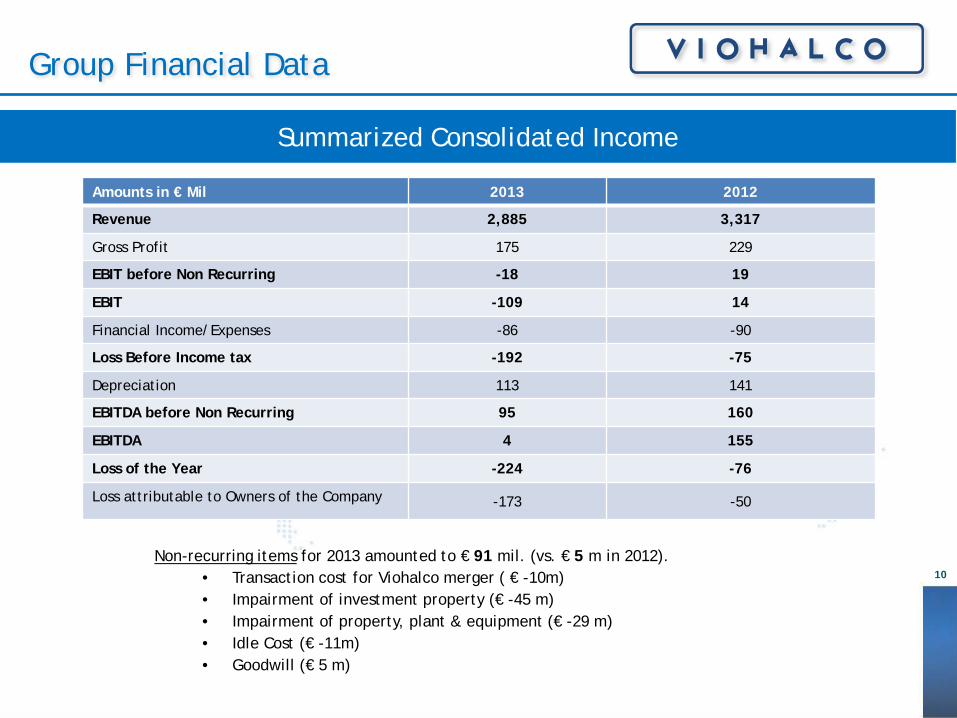
Non-recurring items for 2013 amounted to € 91 mil. (vs. € 5 m in 2012). • Transaction cost for Viohalco merger ( € -10m) • Impairment of investment property (€ -45 m) • Impairment of property, plant & equipment (€ -29 m) • Idle Cost (€ -11m) • Goodwill (€ 5 m)
10
Group Financial Data
Amounts in € Mil 2013 2012
Revenue 2,885 3,317
Gross Profit 175 229
EBIT before Non Recurring -18 19
EBIT -109 14
Financial Income/Expenses -86 -90
Loss Before Income tax -192 -75
Depreciation 113 141
EBITDA before Non Recurring 95 160
EBITDA 4 155
Loss of the Year -224 -76
Loss attributable to Owners of the Company -173 -50
Summarized Consolidated Income
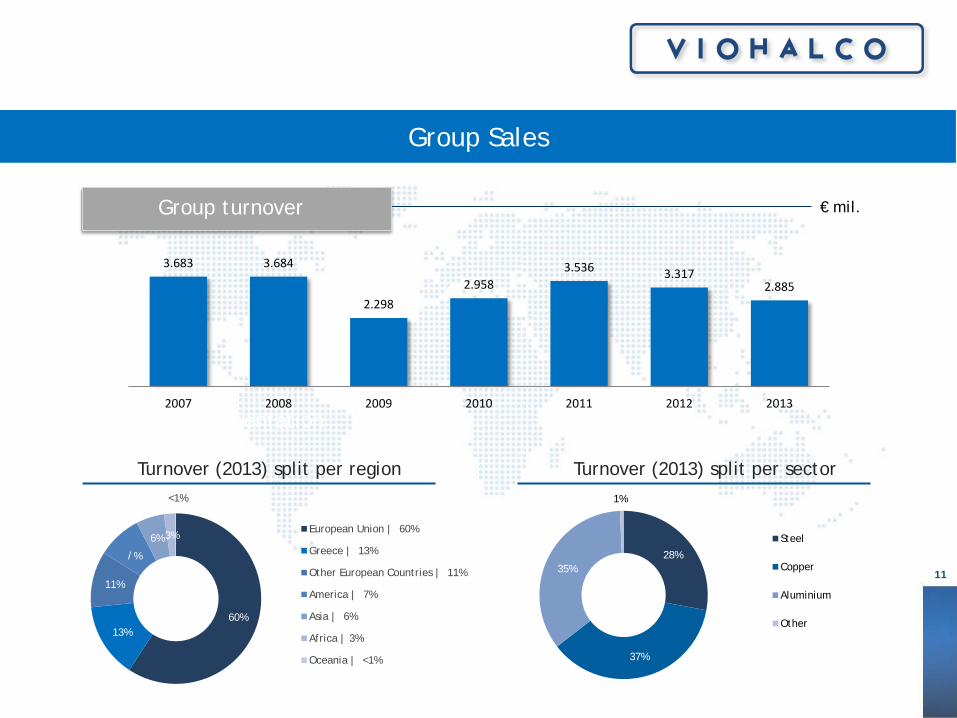
€ mil. Group turnover
2%
Turnover (2013) split per region
Export orientation
11
Group Sales
60% 13%
11%
/%
6% 3%
<1%
European Union | 60%
Greece | 13%
Other European Countries | 11%
America | 7%
Asia | 6%
Africa | 3%
Oceania | <1%
Turnover (2013) split per sector
28%
37%
35%
1%
Steel
Copper
Aluminium
Other
3.683 3.684
2.298 2.958
3.536 3.317 2.885
2007 2008 2009 2010 2011 2012 2013
12
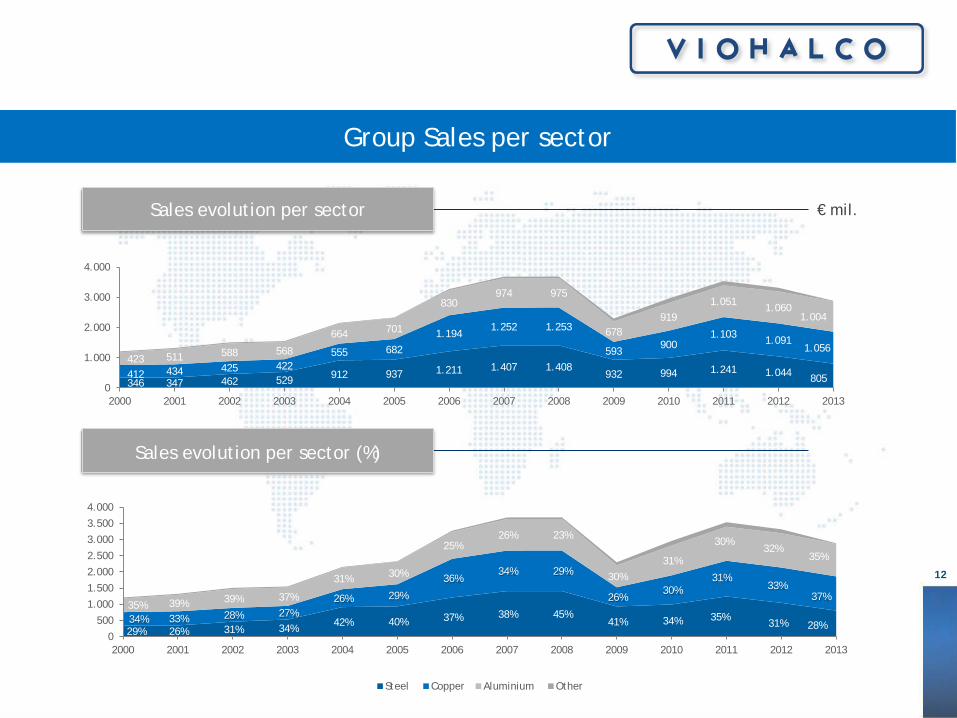
Group Sales per sector
€ mil.
Sales evolution per sector (%)
Sales evolution per sector
29% 26% 31% 34% 42% 40% 37% 38% 45% 41% 34% 35% 31% 28% 34% 33% 28% 27%
26% 29%
36% 34% 29%
26% 30%
31% 33%
37% 35% 39% 39% 37%
31% 30%
25% 26% 23%
30% 31%
30% 32%
35%
0
500
1.000
1.500
2.000
2.500
3.000
3.500
4.000
2000 2001 2002 2003 2004 2005 2006 2007 2008 2009 2010 2011 2012 2013
Steel Copper Aluminium Other
346 347 462 529 912 937 1.211 1.407 1.408 932 994 1.241 1.044 805 412 434 425 422
555 682 1.194
1.252 1.253
593 900
1.103 1.091 1.056
423 511 588 568
664 701
830 974 975
678 919
1.051 1.060 1.004
0
1.000
2.000
3.000
4.000
2000 2001 2002 2003 2004 2005 2006 2007 2008 2009 2010 2011 2012 2013
13
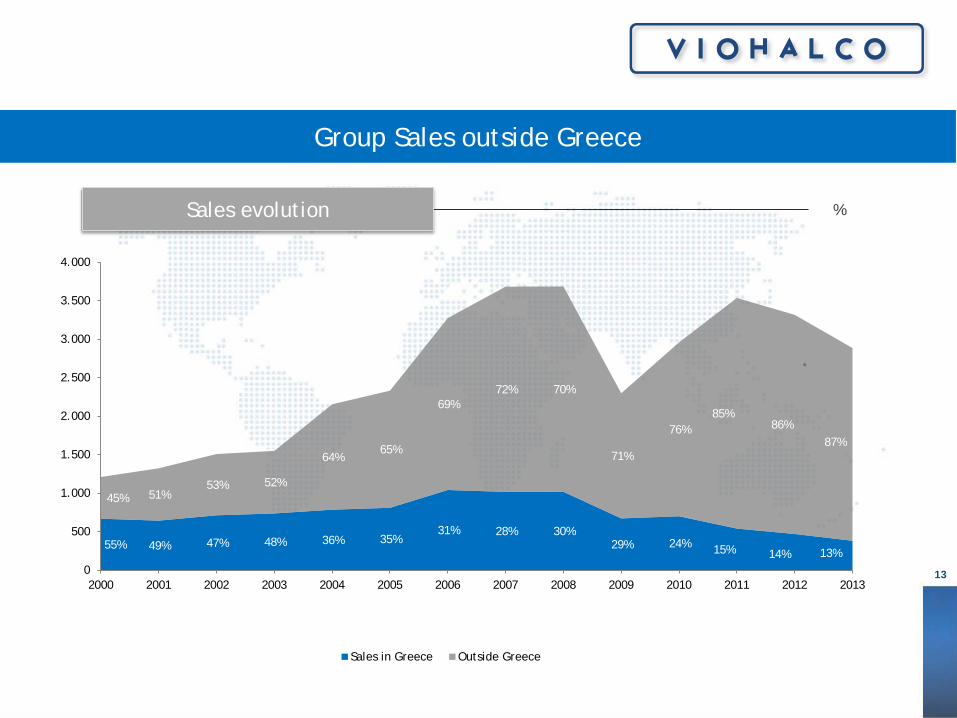
Group Sales outside Greece
%
Sales evolution per sector (%)
Sales evolution
*
55% 49% 47% 48% 36% 35% 31% 28% 30%
29% 24% 15% 14% 13%
45% 51% 53% 52%
64% 65%
69% 72% 70%
71%
76% 85%
86% 87%
0
500
1.000
1.500
2.000
2.500
3.000
3.500
4.000
2000 2001 2002 2003 2004 2005 2006 2007 2008 2009 2010 2011 2012 2013
Sales in Greece Outside Greece
1 VIOHALCO
2 Steel 3 Steel Pipes 4 Aluminium 5 Copper 6 Cables 7 Real Estate 8 Financial Appendix
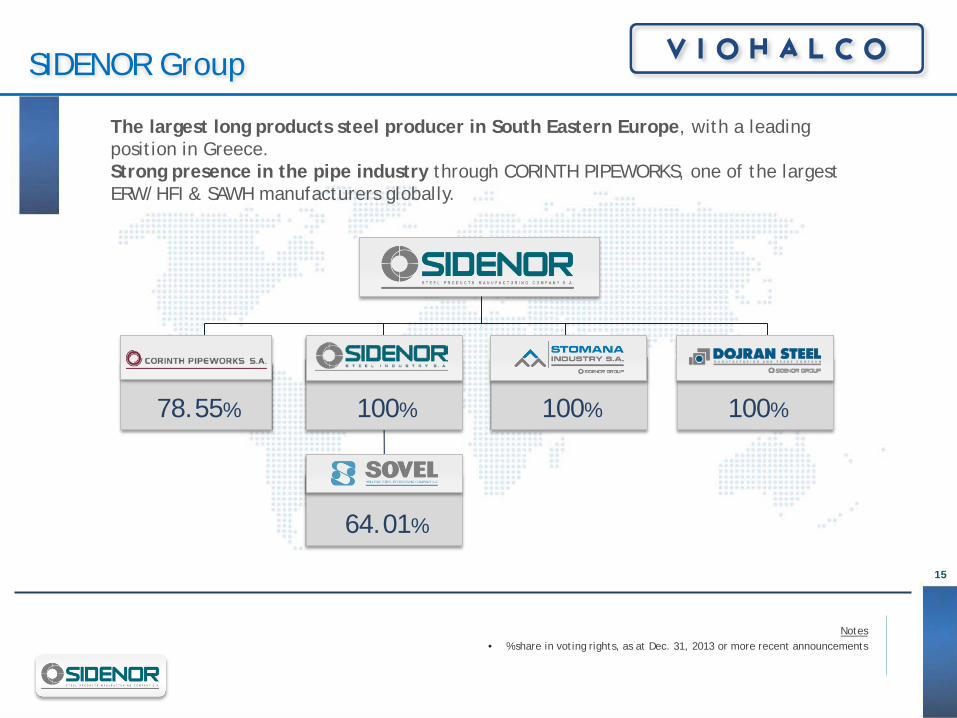
The largest long products steel producer in South Eastern Europe, with a leading position in Greece. Strong presence in the pipe industry through CORINTH PIPEWORKS, one of the largest ERW/HFI & SAWH manufacturers globally.
64.01%
100% 100% 78.55% 100%
Notes • % share in voting rights, as at Dec. 31, 2013 or more recent announcements
SIDENOR Group
15
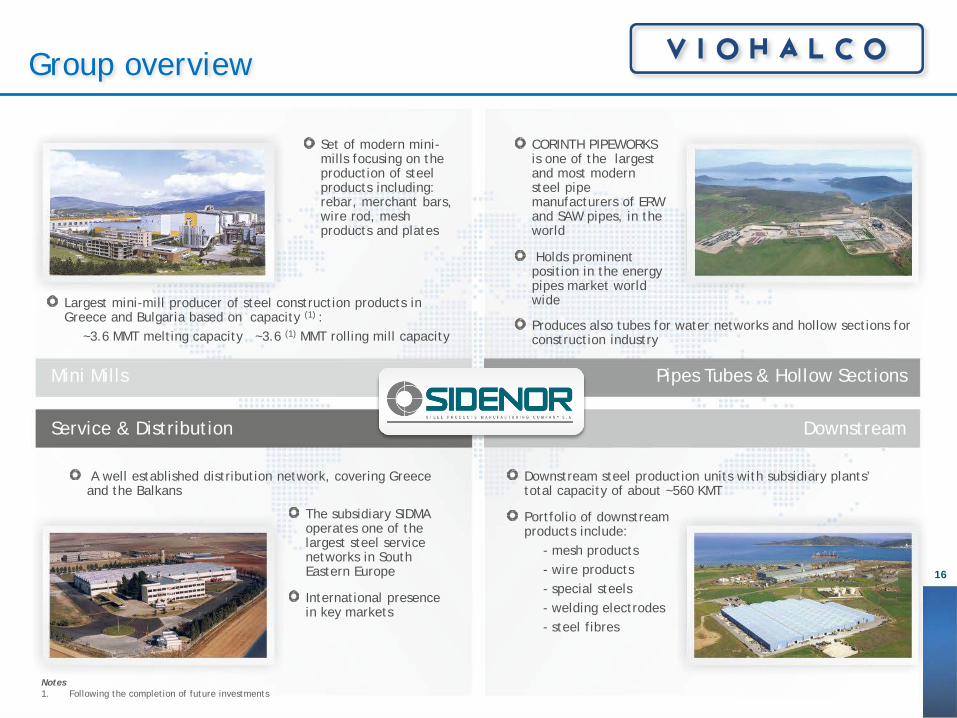
Mini Mills Pipes Tubes & Hollow Sections
CORINTH PIPEWORKS is one of the largest and most modern steel pipe manufacturers of ERW and SAW pipes, in the world
Holds prominent position in the energy pipes market world wide
A well established distribution network, covering Greece and the Balkans
Notes 1. Following the completion of future investments
Largest mini-mill producer of steel construction products in Greece and Bulgaria based on capacity (1) :
~3.6 MMT melting capacity ~3.6 (1) MMT rolling mill capacity
Downstream
Downstream steel production units with subsidiary plants’ total capacity of about ~560 KMT
Portfolio of downstream products include:
- mesh products - wire products - special steels - welding electrodes - steel fibres
Service & Distribution
Produces also tubes for water networks and hollow sections for construction industry
Set of modern mini-mills focusing on the production of steel products including: rebar, merchant bars, wire rod, mesh products and plates
The subsidiary SIDMA operates one of the largest steel service networks in South Eastern Europe
International presence in key markets
Group overview
16
17
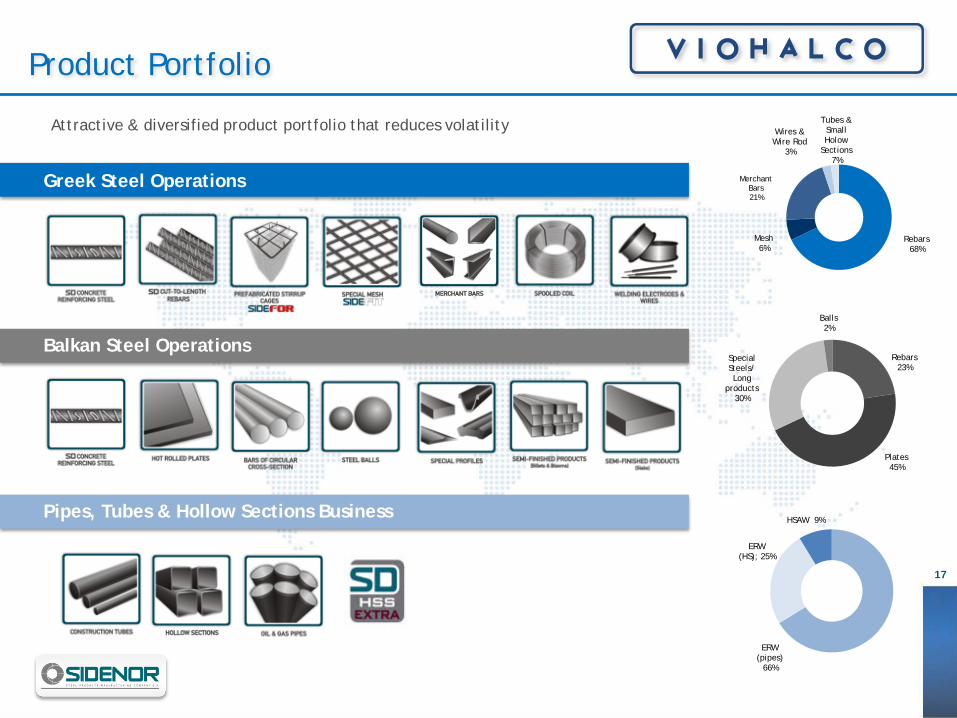
Product Portfolio
Attractive & diversified product portfolio that reduces volatility
Greek Steel Operations
Balkan Steel Operations
Pipes, Tubes & Hollow Sections Business
Rebars 68%
Mesh 6%
Merchant Bars 21%
Wires & Wire Rod
3%
Tubes & Small Holow
Sections 7%
ERW (pipes)
66%
ERW (HS); 25%
HSAW 9%
Rebars 23%
Plates 45%
Special Steels/ Long
products 30%
Balls 2%
18
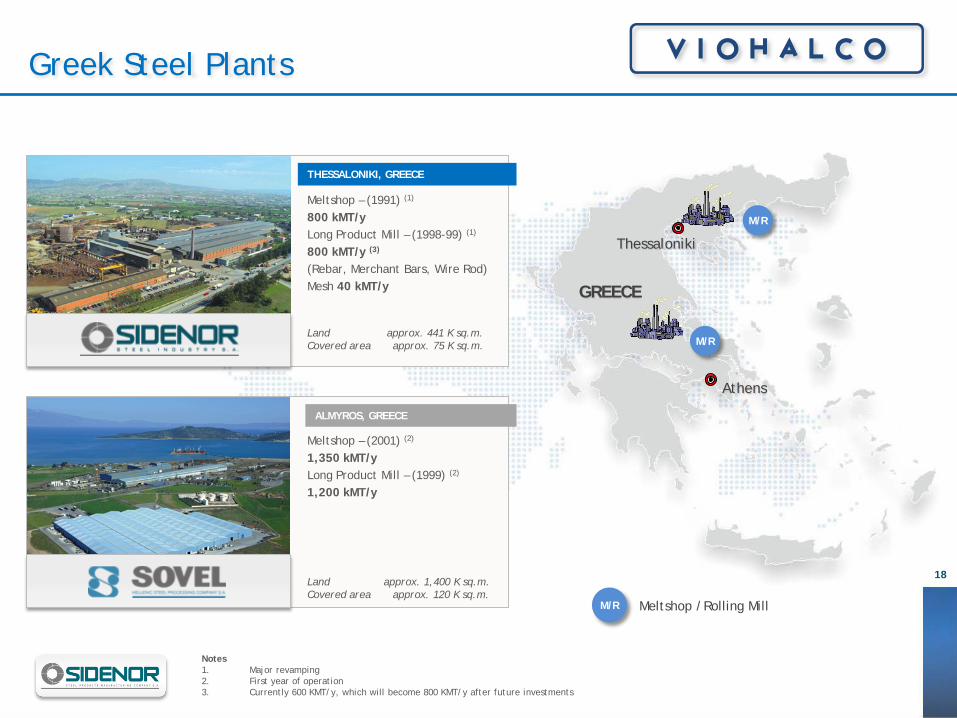
Greek Steel Plants
Notes 1. Major revamping 2. First year of operation 3. Currently 600 KMT/y, which will become 800 KMT/y after future investments
Land approx. 441 K sq.m. Covered area approx. 75 K sq.m.
Meltshop – (1991) (1)
800 kMT/y Long Product Mill – (1998-99) (1) 800 kMT/y (3) (Rebar, Merchant Bars, Wire Rod) Mesh 40 kMT/y
Meltshop – (2001) (2) 1,350 kMT/y
Long Product Mill – (1999) (2) 1,200 kMT/y
Land approx. 1,400 K sq.m. Covered area approx. 120 K sq.m.
GREECE
Athens
M/R Meltshop /Rolling Mill
Thessaloniki
M/R
M/R
ALMYROS, GREECE
THESSALONIKI, GREECE
19
Group Financial Data
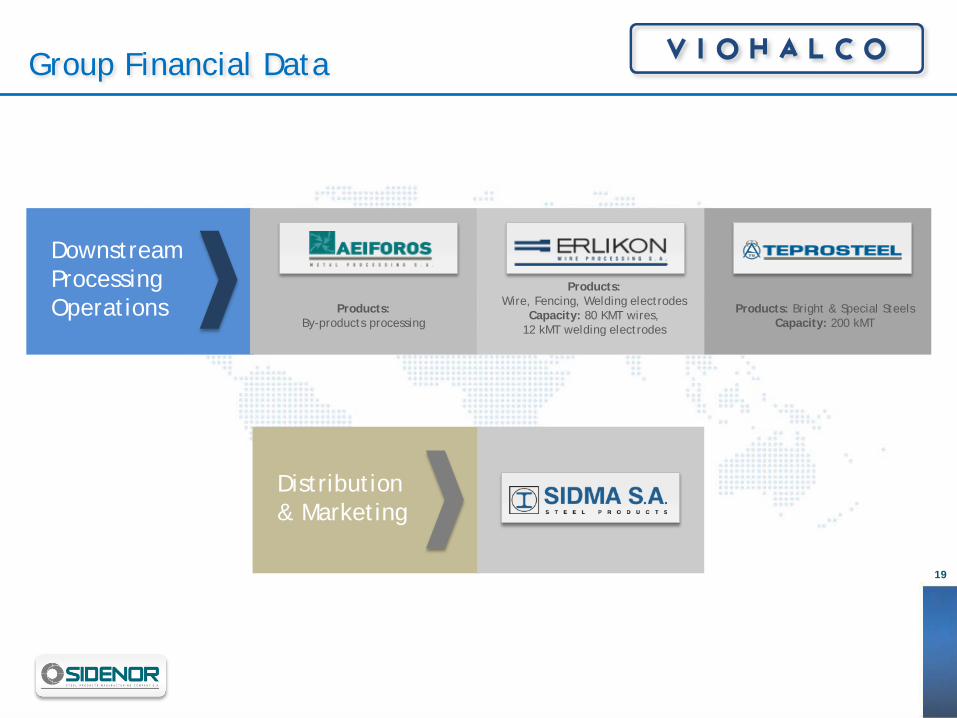
Products: Wire, Fencing, Welding electrodes
Capacity: 80 KMT wires, 12 kMT welding electrodes
Products: By-products processing
Products: Bright & Special Steels Capacity: 200 kMT
Downstream Processing Operations
Distribution & Marketing
20
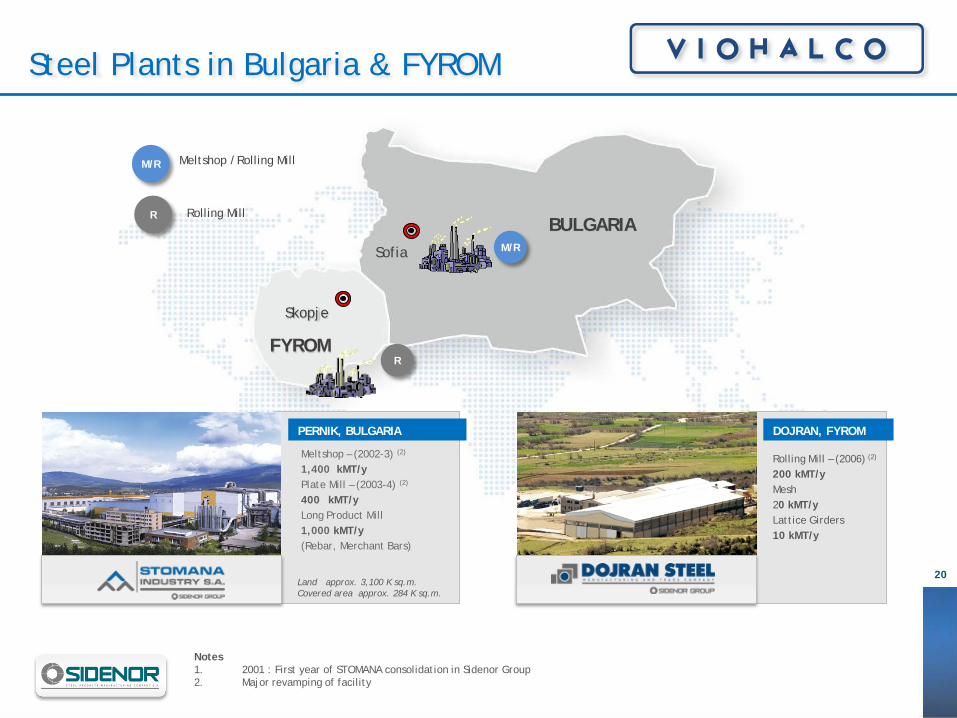
Steel Plants in Bulgaria & FYROM
Meltshop /Rolling Mill
Rolling Mill
M/R
R
FYROM
Skopje
BULGARIA Sofia M/R
R
Notes 1. 2001 : First year of STOMANA consolidation in Sidenor Group 2. Major revamping of facility
Rolling Mill – (2006) (2) 200 kMT/y Mesh 20 kMT/y Lattice Girders 10 kMT/y
DOJRAN, FYROM
Meltshop – (2002-3) (2) 1,400 kMT/y Plate Mill – (2003-4) (2) 400 kMT/y Long Product Mill 1,000 kMT/y (Rebar, Merchant Bars)
Land approx. 3,100 K sq.m. Covered area approx. 284 K sq.m.
PERNIK, BULGARIA
21
Steel Plants in Bulgaria & FYROM
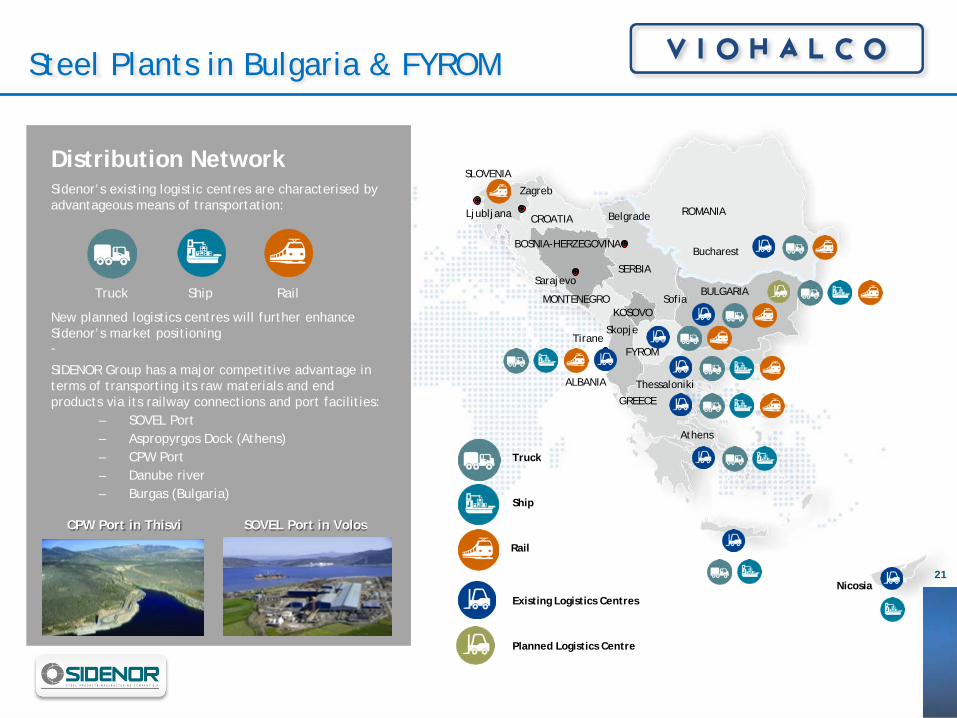
Distribution Network
New planned logistics centres will further enhance Sidenor’s market positioning
SIDENOR Group has a major competitive advantage in terms of transporting its raw materials and end products via its railway connections and port facilities:
– SOVEL Port – Aspropyrgos Dock (Athens) – CPW Port – Danube river – Burgas (Bulgaria)
Sidenor’s existing logistic centres are characterised by advantageous means of transportation:
Truck Ship Rail -
SOVEL Port in Volos CPW Port in Thisvi
Ljubljana ROMANIA
Bucharest BOSNIA-HERZEGOVINA
Sarajevo SERBIA
Belgrade CROATIA
Zagreb
ALBANIA
Tirane FYROM
Skopje
BULGARIA Sofia
GREECE
Thessaloniki
Athens
SLOVENIA
Nicosia
KOSOVO
Ship
Rail
Truck
Existing Logistics Centres
Planned Logistics Centre
MONTENEGRO
22
Projects in Balkan Area
METROPOLITAN CENTER BUCHAREST - ROMANIA
HYGEIA HOSPITAL, TIRANA - ALBANIA
LARNAKA AIRPORT - CYPRUS
THE MALL BUCHAREST - ROMANIA
GRUZANSKOM BRIDGE JEZERU - SERBIA SOFIA AIRPORT - BULGARIA
KRINKAL BRIDGE - SLOVENIA SOFIA SUBWAY - BULGARIA CET BUDAPEST - HUNGARY
CASINO SKOPJE - FYROM CVOR OREHOVICA RIJEKA - CROATIA
BUSINESS CENTER TIRANA - ALBANIA
STADIUM - SLOVENIA
SHOPPING CENTER - SERBIA ARSAKEIO SCHOOL TIRANA - ALBANIA
CVOR OREHOVICA RIJEKA - CROATIA
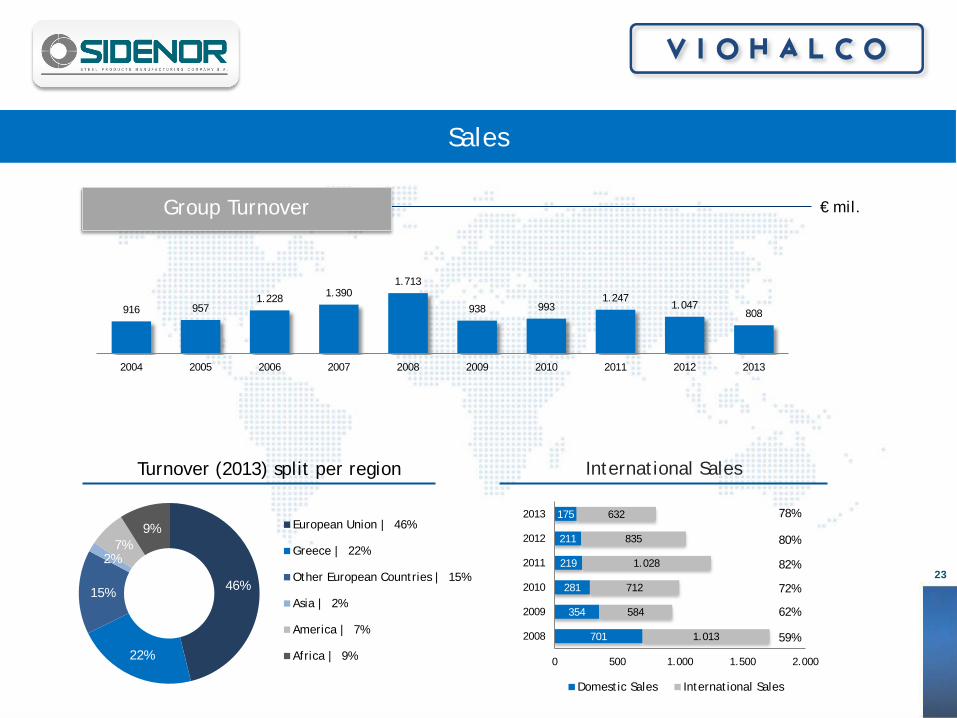
Sales
€ mil.
Turnover (2013) split per region International Sales
Group Turnover
43% 4%
20%
15%
13%
5%
23
916 957 1.228 1.390
1.713
938 993 1.247
1.047 808
2004 2005 2006 2007 2008 2009 2010 2011 2012 2013
701
354
281
219
211
175
1.013
584
712
1.028
835
632
0 500 1.000 1.500 2.000
2008
2009
2010
2011
2012
2013
Domestic Sales International Sales
46%
22%
15%
2% 7%
9% European Union | 46%
Greece | 22%
Other European Countries | 15%
Asia | 2%
America | 7%
Africa | 9%
80%
82%
72%
62%
78%
59%
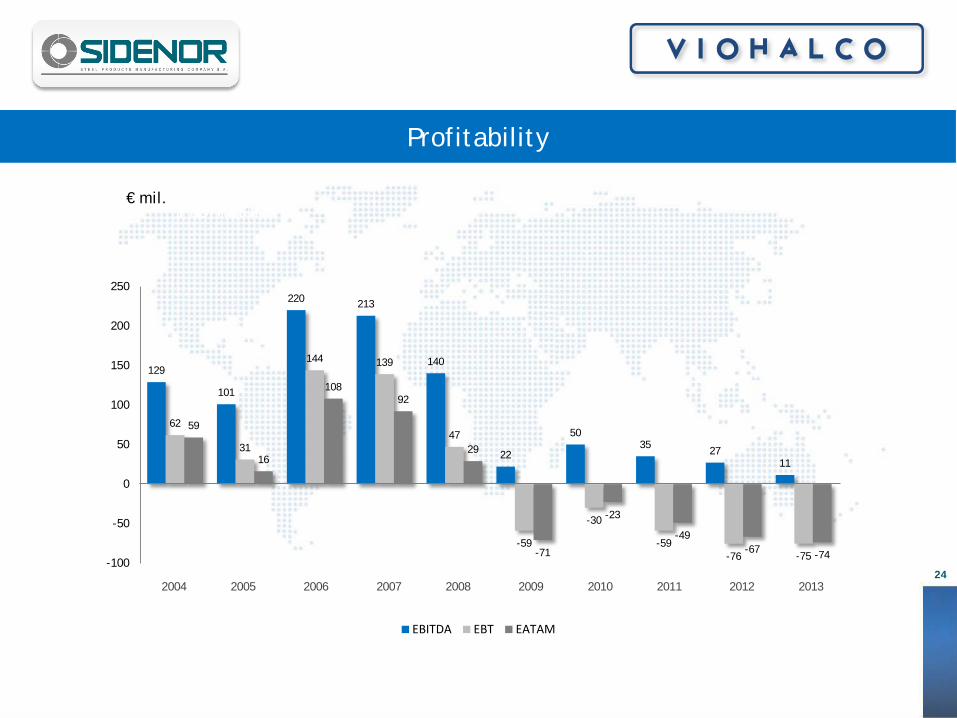
Profitability
€ mil. Profitability
24
129
101
220 213
140
22
50 35 27
11
62
31
144 139
47
-59
-30
-59 -76 -75
59
16
108 92
29
-71
-23
-49 -67 -74
-100
-50
0
50
100
150
200
250
EBITDA EBT EATAM
2004 2005 2006 2007 2008 2009 2010 2011 2012 2013
1 VIOHALCO 2 Steel
3 Steel Pipes 4 Aluminium 5 Copper 6 Cables 7 Real Estate 8 Financial Appendix
26
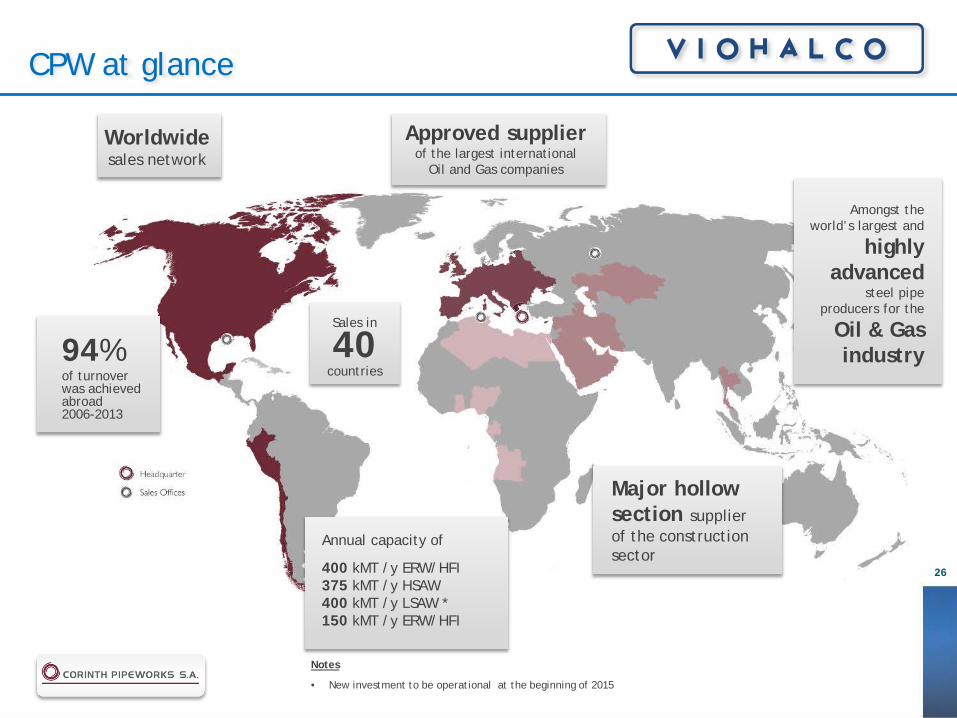
CPW at glance
Annual capacity of
400 kMT /y ERW/HFI 375 kMT /y HSAW 400 kMT /y LSAW * 150 kMT /y ERW/HFI
94% of turnover was achieved abroad 2006-2013
Worldwide sales network
Approved supplier of the largest international
Oil and Gas companies
Amongst the world’s largest and
highly advanced
steel pipe producers for the
Oil & Gas industry
Major hollow section supplier of the construction sector
Sales in
40 countries
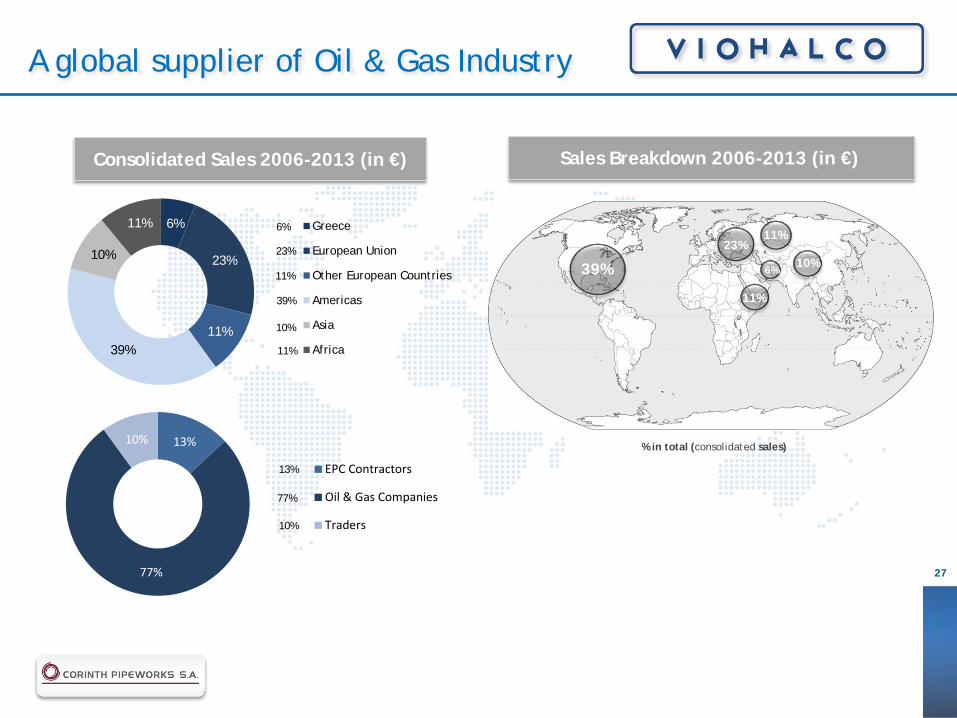
• New investment to be operational at the beginning of 2015
Notes
27
39%
23% 11%
11%
10% 6%
% in total (consolidated sales)
Sales Breakdown 2006-2013 (in €)
13% 10%
77%
23%
11%
10%
11% 6% 6%
23%
11% 39%
10%
11% Greece
European Union
Other European Countries
Americas
Asia
Africa
6%
23%
11%
39%
10%
11%
13%
77%
10%
EPC Contractors
Oil & Gas Companies
Traders
13%
77%
10%
Consolidated Sales 2006-2013 (in €)
A global supplier of Oil & Gas Industry
28
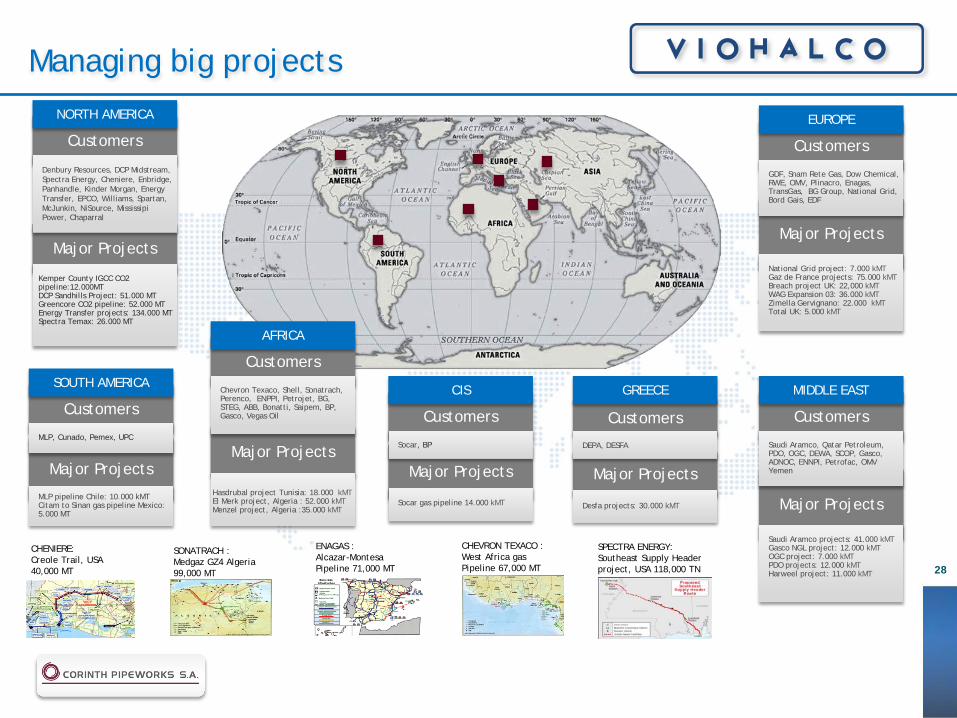
Managing big projects
Major Projects
Kemper County IGCC CO2 pipeline:12.000MT DCP Sandhills Project: 51.000 MT Greencore CO2 pipeline: 52.000 MT Energy Transfer projects: 134.000 MT Spectra Temax: 26.000 MT
Customers
NORTH AMERICA
Denbury Resources, DCP Midstream, Spectra Energy, Cheniere, Enbridge, Panhandle, Kinder Morgan, Energy Transfer, EPCO, Williams, Spartan, McJunkin, NiSource, Mississipi Power, Chaparral
Major Projects
MLP pipeline Chile: 10.000 kMT Citam to Sinan gas pipeline Mexico: 5.000 MT
Customers
SOUTH AMERICA
MLP, Cunado, Pemex, UPC
Major Projects
Hasdrubal project Tunisia: 18.000 kMT El Merk project, Algeria : 52.000 kMT Menzel project, Algeria :35.000 kMT
Customers
AFRICA
Chevron Texaco, Shell, Sonatrach, Perenco, ENPPI, Petrojet, BG, STEG, ABB, Bonatti, Saipem, BP, Gasco, Vegas Oil
Major Projects
Socar gas pipeline 14.000 kMT
Customers
CIS
Socar, BP
Major Projects
Desfa projects: 30.000 kMT
Customers
GREECE
DEPA, DESFA
Major Projects
Saudi Aramco projects: 41.000 kMT Gasco NGL project: 12.000 kMT OGC project: 7.000 kMT PDO projects: 12.000 kMT Harweel project: 11.000 kMT
Customers
MIDDLE EAST
Saudi Aramco, Qatar Petroleum, PDO, OGC, DEWA, SCOP, Gasco, ADNOC, ENNPI, Petrofac, OMV Yemen
Major Projects
National Grid project: 7.000 kMT Gaz de France projects: 75.000 kMT Breach project UK: 22,000 kMT WAG Expansion 03: 36.000 kMT Zimella Gervignano: 22.000 kMT Total UK: 5.000 kMT
Customers
EUROPE
GDF, Snam Rete Gas, Dow Chemical, RWE, OMV, Plinacro, Enagas, TransGas, BG Group, National Grid, Bord Gais, EDF
CHENIERE: Creole Trail, USA 40,000 MT
SONATRACH : Medgaz GZ4 Algeria 99,000 MT
ENAGAS : Alcazar-Montesa Pipeline 71,000 MT
CHEVRON TEXACO : West Africa gas Pipeline 67,000 MT
SPECTRA ENERGY: Southeast Supply Header project, USA 118,000 TN
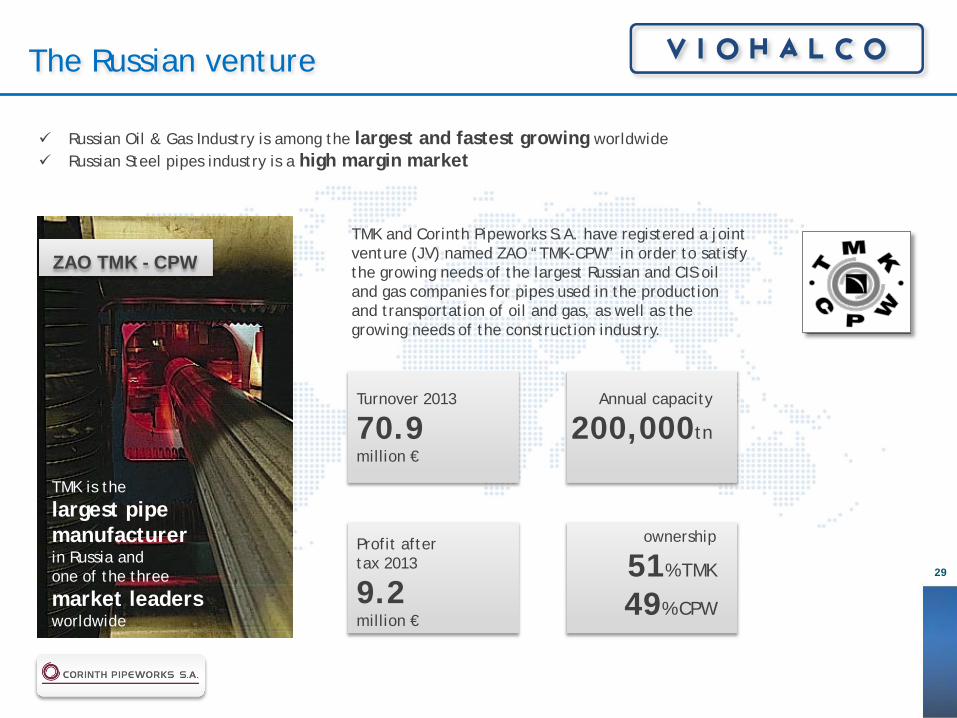
The Russian venture Russian Oil & Gas Industry is among the largest and fastest growing worldwide Russian Steel pipes industry is a high margin market
Profit after tax 2013
9.2 million €
Turnover 2013
70.9 million €
TMK is the
largest pipe manufacturer in Russia and one of the three
market leaders worldwide
TMK and Corinth Pipeworks S.A. have registered a joint venture (JV) named ZAO “TMK-CPW” in order to satisfy the growing needs of the largest Russian and CIS oil and gas companies for pipes used in the production and transportation of oil and gas, as well as the growing needs of the construction industry.
Annual capacity
200,000tn
ownership
51% TMK
49% CPW
ZAO TMK - CPW
29
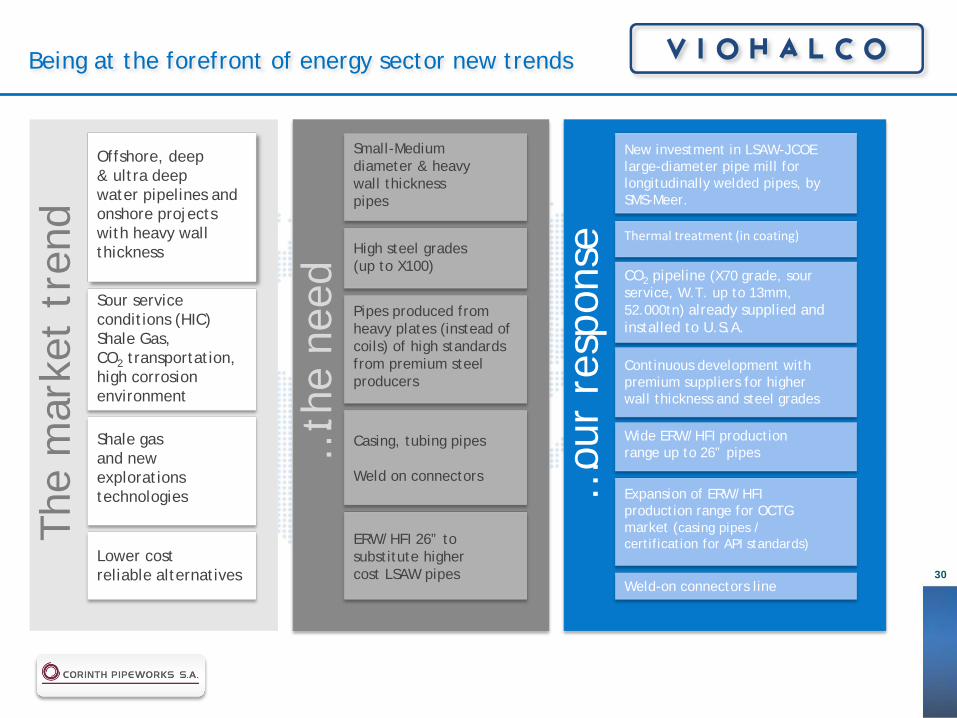
Offshore, deep & ultra deep water pipelines and onshore projects with heavy wall thickness
Sour service conditions (HIC) Shale Gas, CO2 transportation, high corrosion environment
Shale gas and new explorations technologies
Small-Medium diameter & heavy wall thickness pipes
Pipes produced from heavy plates (instead of coils) of high standards from premium steel producers
Casing, tubing pipes Weld on connectors
New investment in LSAW-JCOE large-diameter pipe mill for longitudinally welded pipes, by SMS-Meer.
Wide ERW/HFI production range up to 26” pipes
Weld-on connectors line
High steel grades (up to X100)
Thermal treatment (in coating)
Lower cost reliable alternatives
ERW/HFI 26” to substitute higher cost LSAW pipes
…ou
r re
spon
se
The
mar
ket
tren
d
…th
e ne
ed
CO2 pipeline (X70 grade, sour service, W.T. up to 13mm, 52.000tn) already supplied and installed to U.S.A.
Continuous development with premium suppliers for higher wall thickness and steel grades
Expansion of ERW/HFI production range for OCTG market (casing pipes / certification for API standards)
Being at the forefront of energy sector new trends
30

Being at the forefront of energy sector new trends
Production & Port facilities
4 2
6 7
1 Port
Port facilities (exclusive use):
Berth “A” : Depth: 11.10m, length:205 m
Berth “B”: Depth: 6.30m, length:155m
Berth “C”: Depth: 9.50m, length:90m
Helical SAW plant (375 kMT/year)
Grade up to: X80 O.D. range: 24’’ – 100’’
Wall thickness: 6-25.4 mm Manufacturer:
MEG / SMS MEER (Germany)
NEW LSAW plant (400 KMT/year)
Grade up to: X80 (X100 in the future) O.D. range: 16’’ – 56’’
Wall thickness: up to 40 mm Manufacturer:
MEG / SMS MEER (Germany)
ERW/HFI plant (400 kMT/year)
Grade up to: X80 Hollow Sections:
180x180 – 500x500 Line Pipes (O.D. Range):
8 5/8’’ – 26’’
Wall thickness: 4.78-25.4 mm Manufacturer:
MS-MEER (Germany)
ERW/HFI plant (150 KMT/year)
Grade up to: S355J2H (upgrade to API grades)
Line Pipes O.D.: 2’’–7 5/8’’ (HS: 50x50 – 160X160)
Wall thickness: 3,0-10,0 mm Manufacturer:
SMS-MEER (Germany)
Coating (2 lines)
Capacity: 6,300,000 sq.m/y
O.D. range: 4 1/2’’ – 100’’
Lining
Capacity: 2,000,000 sq.m/y
O.D. range: 8 5/8’’– 56’’
Connectors facilities
4,500 joints/y
1
2 4 6
7
8
8
3 5
3
5
31
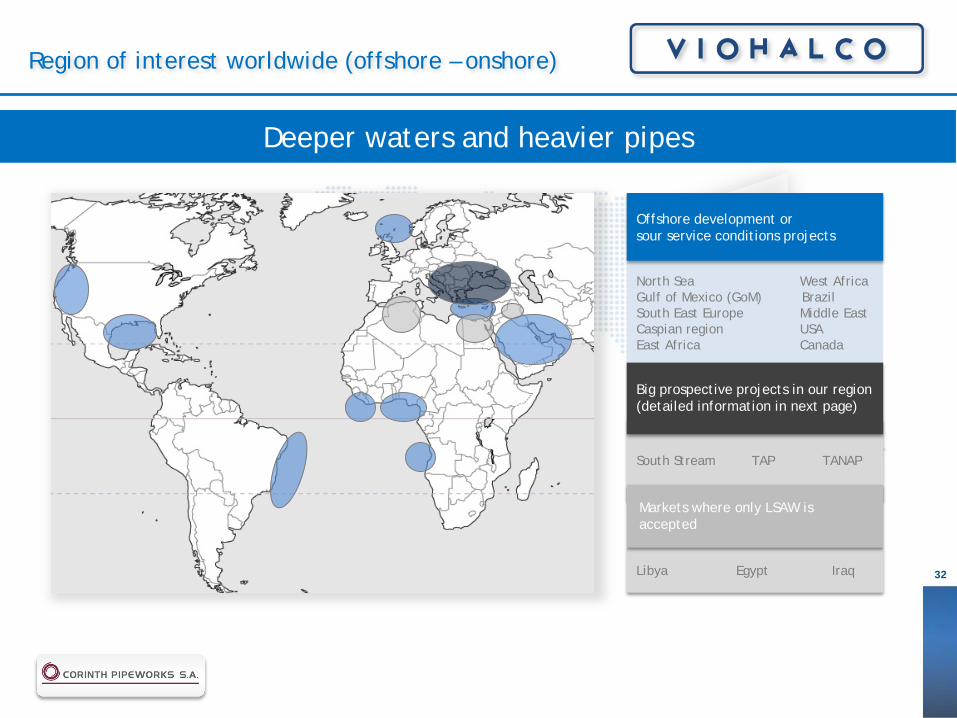
Deeper waters and heavier pipes
South Stream TAP TANAP
North Sea West Africa Gulf of Mexico (GoM) Brazil South East Europe Middle East Caspian region USA East Africa Canada
Offshore development or sour service conditions projects
Big prospective projects in our region (detailed information in next page)
Libya Egypt Iraq
Markets where only LSAW is accepted
Region of interest worldwide (offshore – onshore)
32
Major prospective projects in our region
Onshore Length: 755km Offshore Length: 110 km
Capacity: 10 bcm
Total quantity of steel pipes: 400 kMT / y
Source: TAP, Pipelines International
TAP
Onshore Length: 183km
Capacity: 3-5 bcm Total quantity of steel pipes:
35 kMT / y
Source: ICGB
IGB
Onshore Length: 2.581km
Investment: 7 billion $ Capacity: 16-31 bcm
Total quantity of steel pipes: 1,300 kMT / y
Source: TANAP, Nabucco
TANAP
Onshore Length: 1.455km
Number of Lines: 1 Offshore
Length: 925 km Number of lines : 4
Total quantity of steel pipes: 2,250 kMT / y
Capacity: 63 bcm
Source: South stream, Hatch Associated Ltd
SOUTH STREAM
33
34
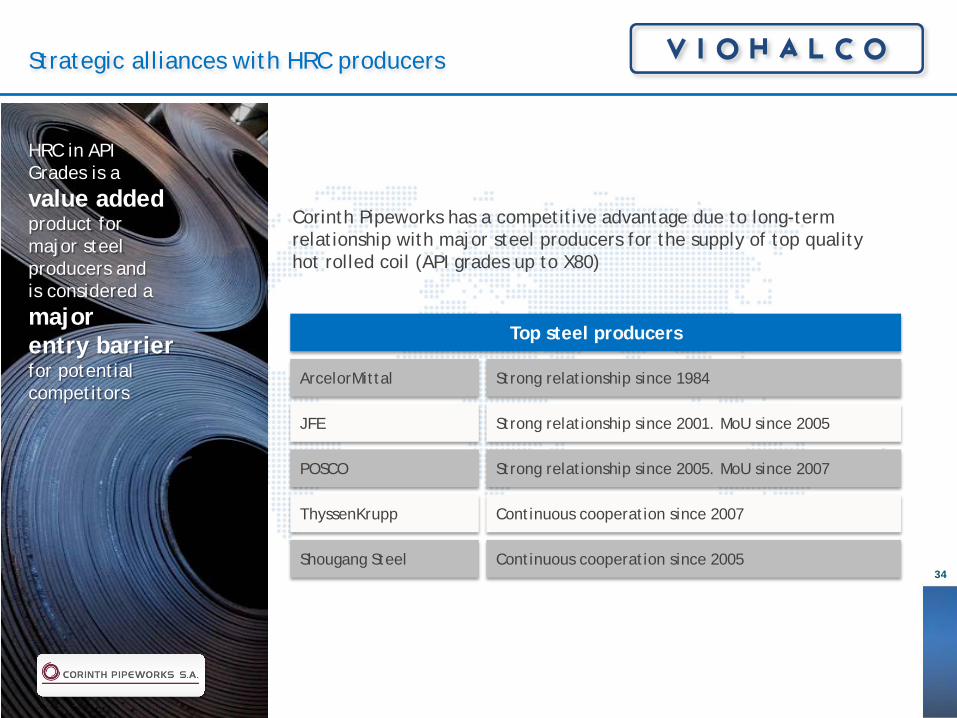
Strategic alliances with HRC producers
Corinth Pipeworks has a competitive advantage due to long-term relationship with major steel producers for the supply of top quality hot rolled coil (API grades up to X80)
HRC in API Grades is a value added product for major steel producers and is considered a major entry barrier for potential competitors
Top steel producers
ArcelorMittal Strong relationship since 1984
JFE Strong relationship since 2001. MoU since 2005
POSCO Strong relationship since 2005. MoU since 2007
ThyssenKrupp Continuous cooperation since 2007
Shougang Steel Continuous cooperation since 2005
12
13
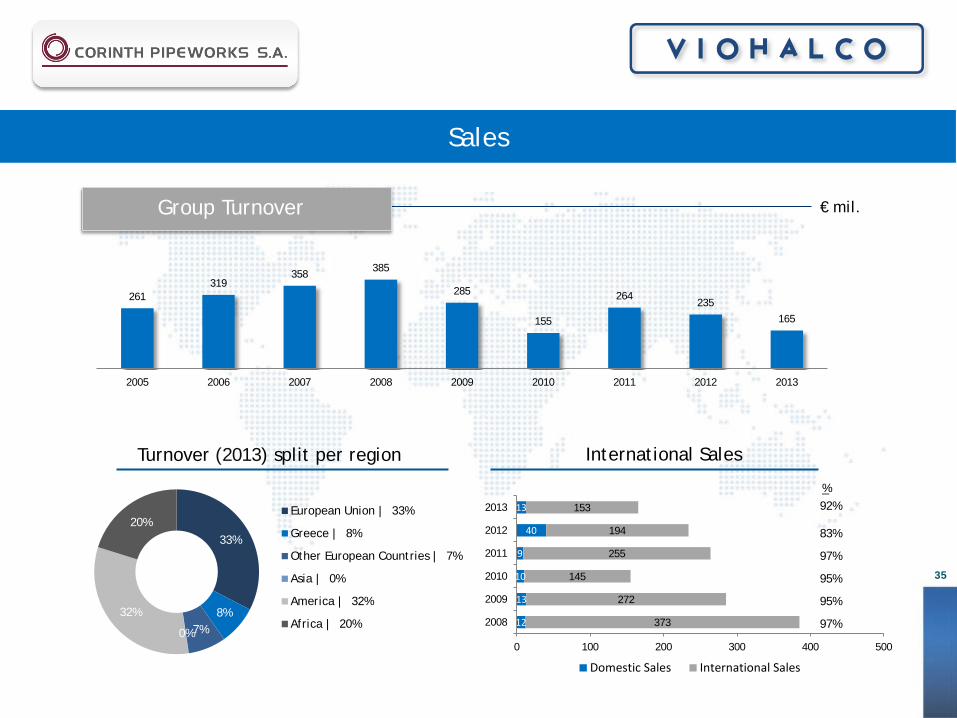
10
9
40
13
373
272
145
255
194
153
0 100 200 300 400 500
2008
2009
2010
2011
2012
2013
Domestic Sales International Sales
€ mil. Group Turnover
Turnover (2013) split per region International Sales
%
83%
97%
95%
95%
97%
58% 9%
14%
9% 2%
35
Sales
33%
8% 7% 0%
32%
20% European Union | 33%
Greece | 8%
Other European Countries | 7%
Asia | 0%
America | 32%
Africa | 20%
261 319
358 385
285
155
264 235
165
2005 2006 2007 2008 2009 2010 2011 2012 2013
92%
€ mil.
36
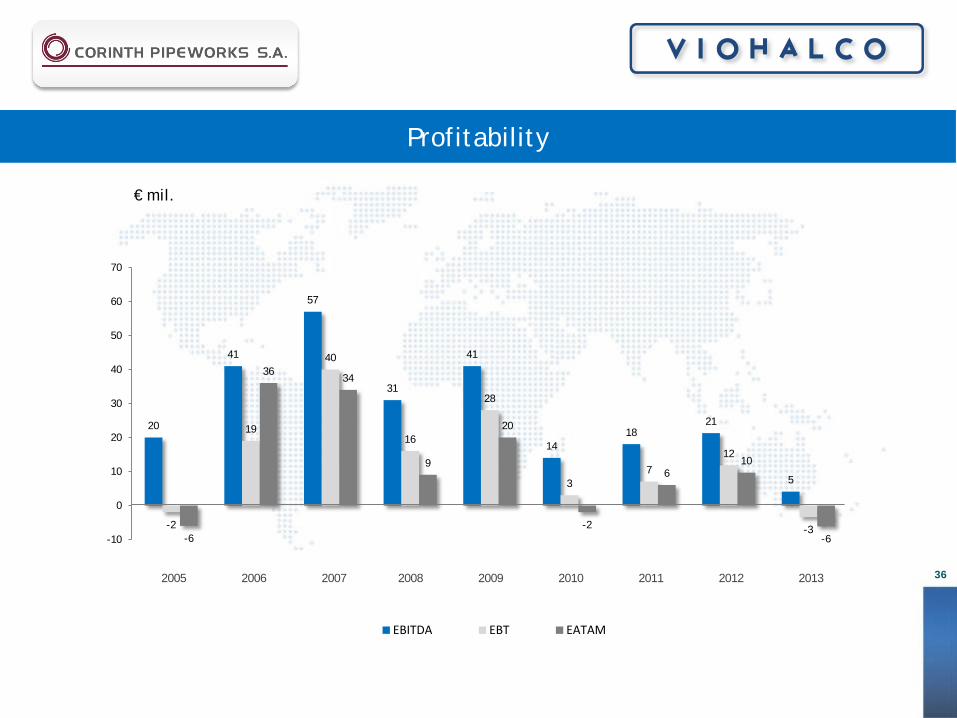
Profitability
20
41
57
31
41
14 18
21
5
-2
19
40
16
28
3 7
12
-3 -6
36 34
9
20
-2
6 10
-6 -10
0
10
20
30
40
50
60
70
EBITDA EBT EATAM
2005 2006 2007 2008 2009 2010 2011 2012 2013
1 VIOHALCO 2 Steel 3 Steel Pipes
4 Aluminium 5 Copper 6 Cables 7 Real Estate 8 Financial Appendix
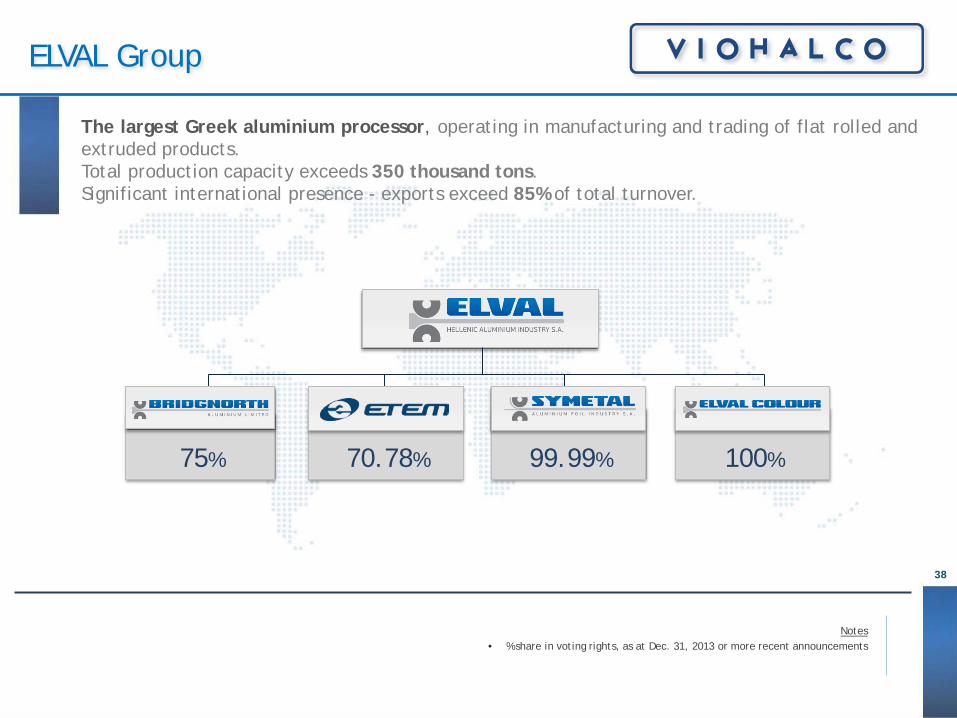
ELVAL Group
38
The largest Greek aluminium processor, operating in manufacturing and trading of flat rolled and extruded products. Total production capacity exceeds 350 thousand tons. Significant international presence - exports exceed 85% of total turnover.
100% 99.99% 75% 70.78%
Notes • % share in voting rights, as at Dec. 31, 2013 or more recent announcements
39
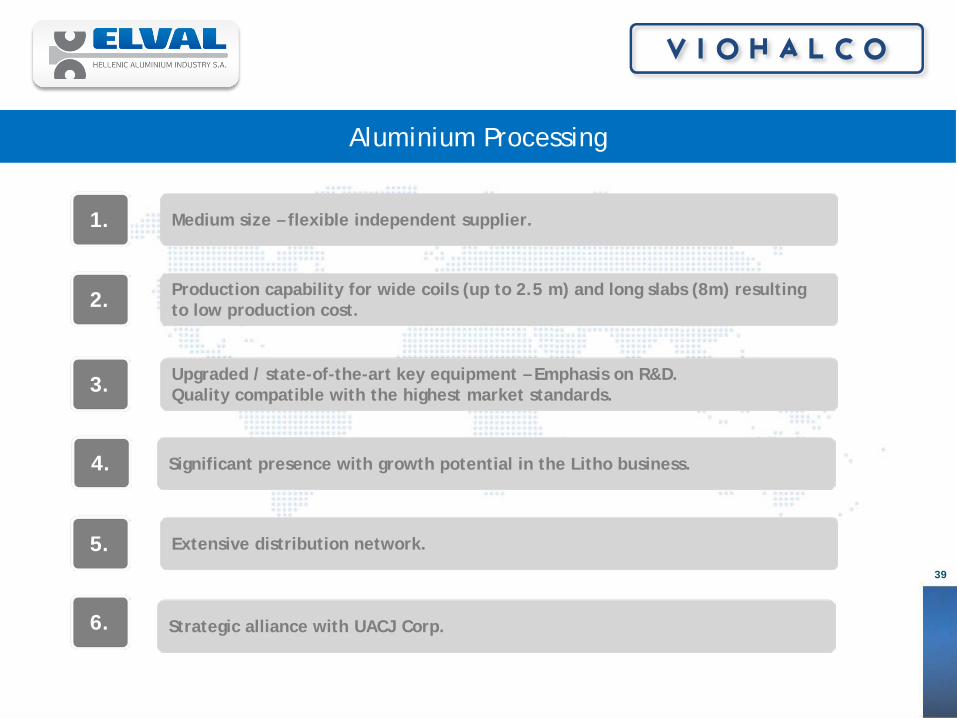
Aluminium Processing
Medium size – flexible independent supplier.
Production capability for wide coils (up to 2.5 m) and long slabs (8m) resulting to low production cost.
Upgraded / state-of-the-art key equipment – Emphasis on R&D. Quality compatible with the highest market standards.
Significant presence with growth potential in the Litho business.
Extensive distribution network.
Strategic alliance with UACJ Corp.
1.
2.
3.
4.
5.
6.
40
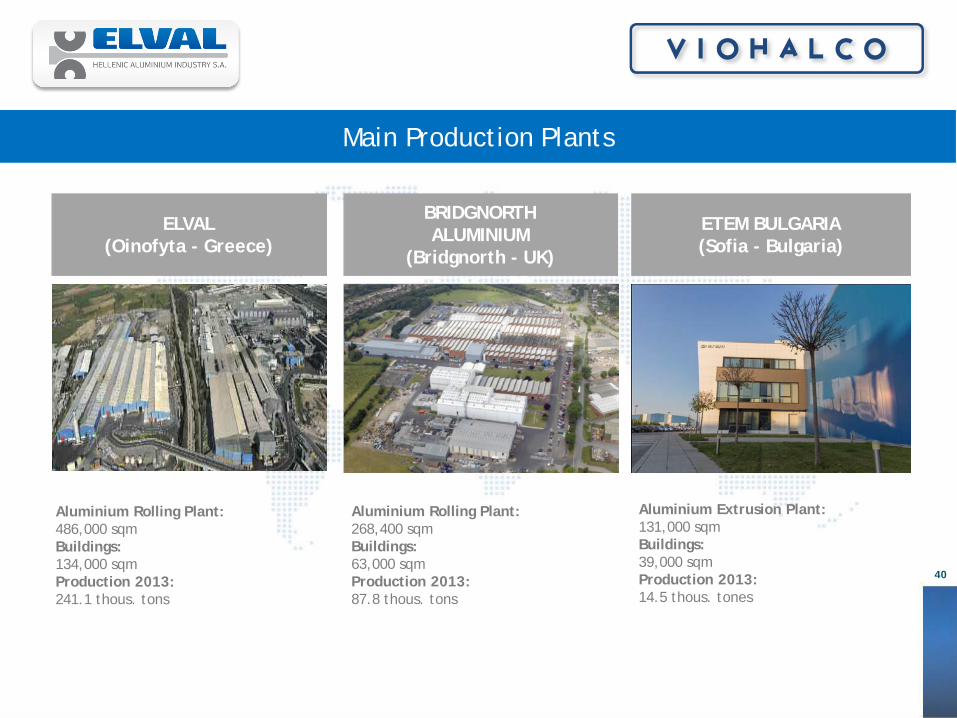
Main Production Plants
Aluminium Rolling Plant: 268,400 sqm Buildings: 63,000 sqm Production 2013: 87.8 thous. tons
Aluminium Rolling Plant: 486,000 sqm Buildings: 134,000 sqm Production 2013: 241.1 thous. tons
Aluminium Extrusion Plant: 131,000 sqm Buildings: 39,000 sqm Production 2013: 14.5 thous. tones
ELVAL (Oinofyta - Greece)
BRIDGNORTH ALUMINIUM
(Bridgnorth - UK)
ETEM BULGARIA (Sofia - Bulgaria)

41
Transportation (Sheets, Coils)
Rigid Packaging (Sheets, Coils)
Building (Sheets & Coils)
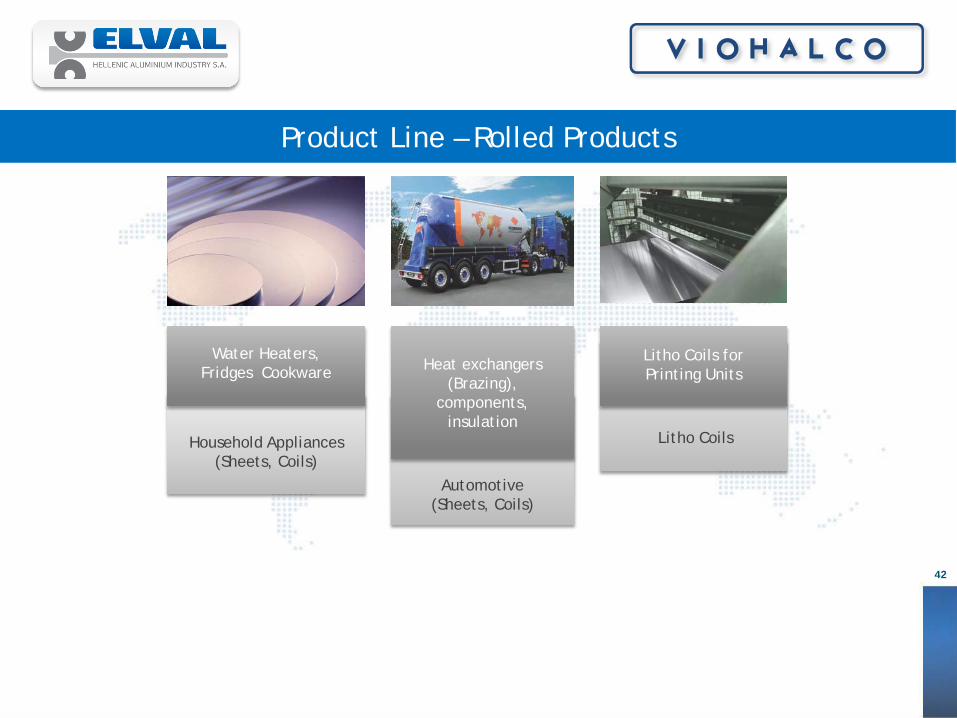
Product Line – Rolled Products
Flexible packaging (Foil)
Household foil, Cigarette packing,
Confectionary packaging, Frozen
Food, etc.
Beverage cans, food cans & closures
Facades (Etalbond ®, ELVAL ENF), Gutters
(Ydoral), Roller Shutters, Roofing,
Wall cladding
Shipbuilding & Marine applications,
Trucks & Trains
42
Product Line – Rolled Products
Litho Coils
Automotive (Sheets, Coils)
Household Appliances (Sheets, Coils)
Water Heaters, Fridges Cookware Heat exchangers
(Brazing), components,
insulation
Litho Coils for Printing Units
43
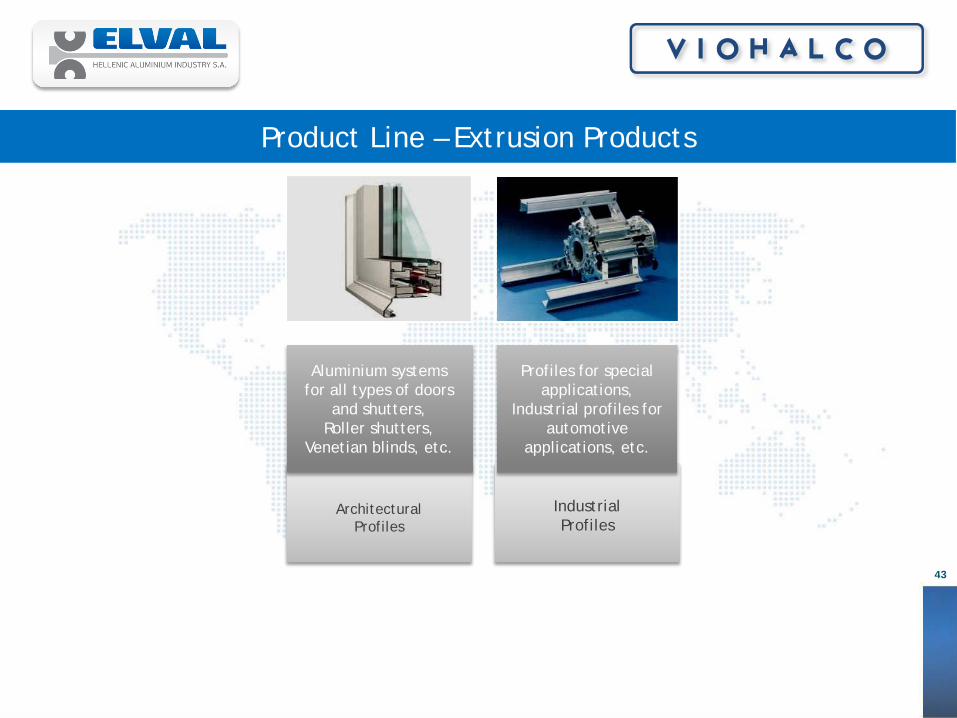
Industrial Profiles
Architectural Profiles
Product Line – Extrusion Products
Aluminium systems for all types of doors
and shutters, Roller shutters,
Venetian blinds, etc.
Profiles for special applications,
Industrial profiles for automotive
applications, etc.
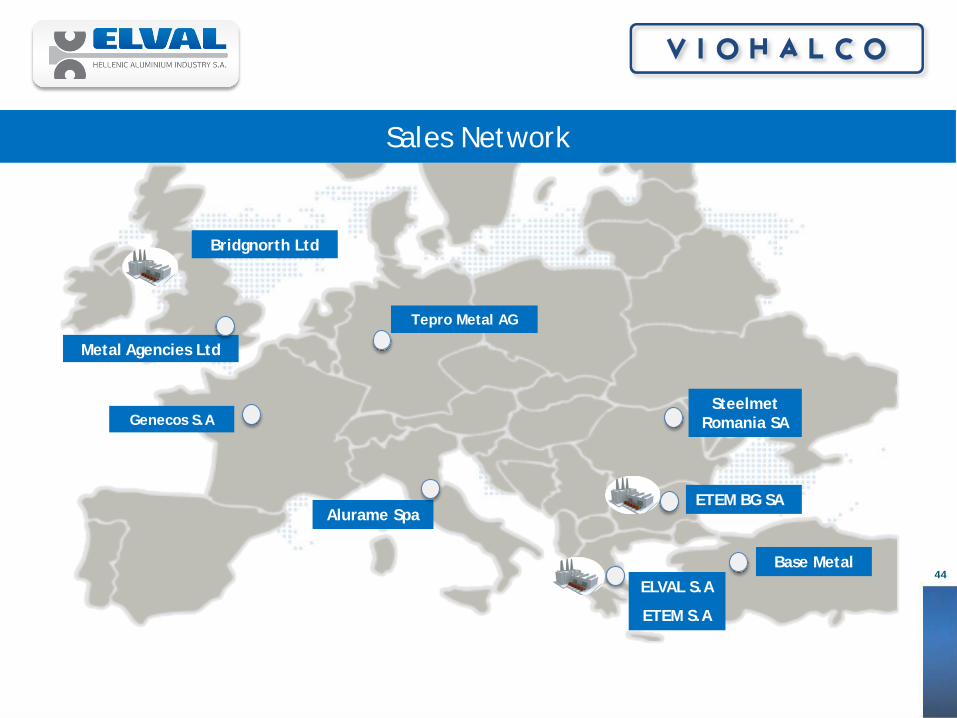
44 ELVAL S.A
ETEM S.A
ETEM BG SA Alurame Spa
Tepro Metal AG
Steelmet Romania SA
Bridgnorth Ltd
Metal Agencies Ltd
Genecos S.A
Base Metal
Sales Network
€ mil. Group Turnover
Turnover (2013) split per region
45
Sales
668 706 860
980 902 690
930 1.062 1.064 1.009
2004 2005 2006 2007 2008 2009 2010 2011 2012 2013
62% 11%
8%
10% 9%
European Union
Greece
Asia
America
Other European Countries
International Sales %
89%
88%
85%
83%
89%
83% 156
114
140
132
118
107
747
576
790
930
946
902
0 200 400 600 800 1000 1200
2008
2009
2010
2011
2012
2013
Domestic Sales abroad
€ mil.
46
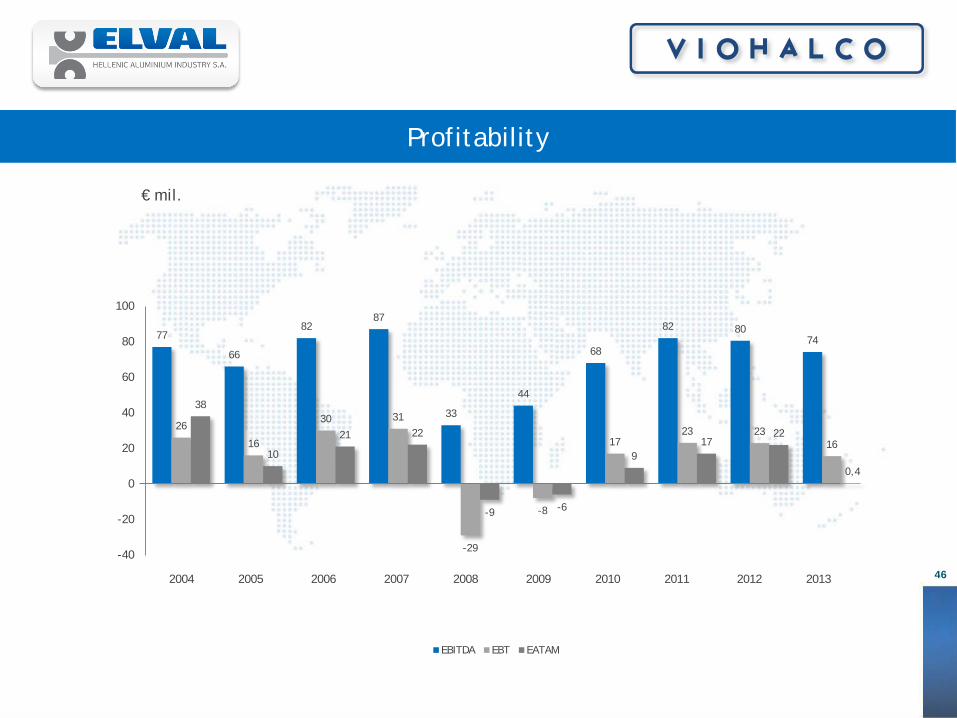
Profitability
77
66
82 87
33
44
68
82 80 74
26
16
30 31
-29
-8
17 23 23
16
38
10
21 22
-9 -6
9 17
22
0,4
-40
-20
0
20
40
60
80
100
EBITDA EBT EATAM
2004 2005 2006 2007 2008 2009 2010 2011 2012 2013
1 VIOHALCO 2 Steel 3 Steel Pipes 4 Aluminium
5 Copper 6 Cables 7 Real Estate 8 Financial Appendix
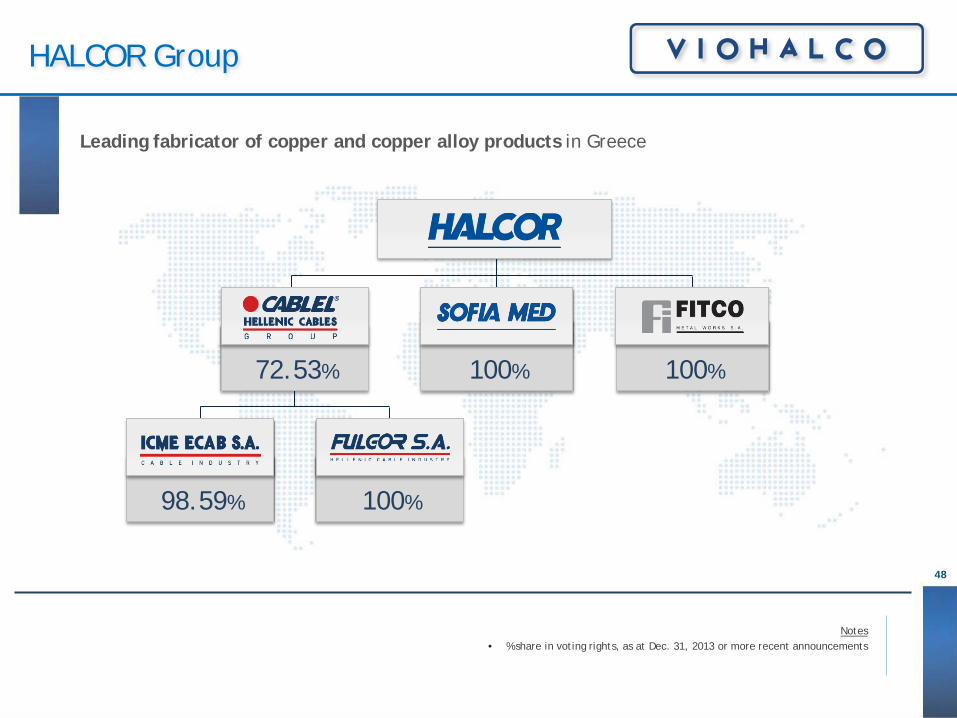
HALCOR Group
48
Leading fabricator of copper and copper alloy products in Greece
100% 72.53% 100%
98.59% 100%
Notes • % share in voting rights, as at Dec. 31, 2013 or more recent announcements
49
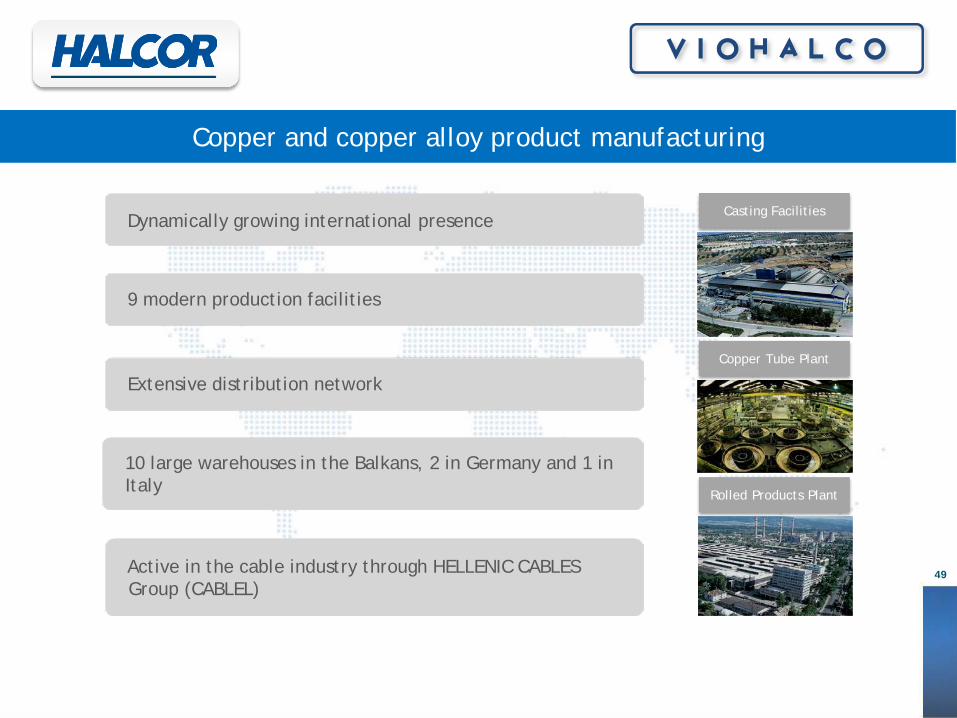
Copper and copper alloy product manufacturing
Dynamically growing international presence
9 modern production facilities
Extensive distribution network
10 large warehouses in the Balkans, 2 in Germany and 1 in Italy
Active in the cable industry through HELLENIC CABLES Group (CABLEL)
Casting Facilities
Copper Tube Plant
Rolled Products Plant
50
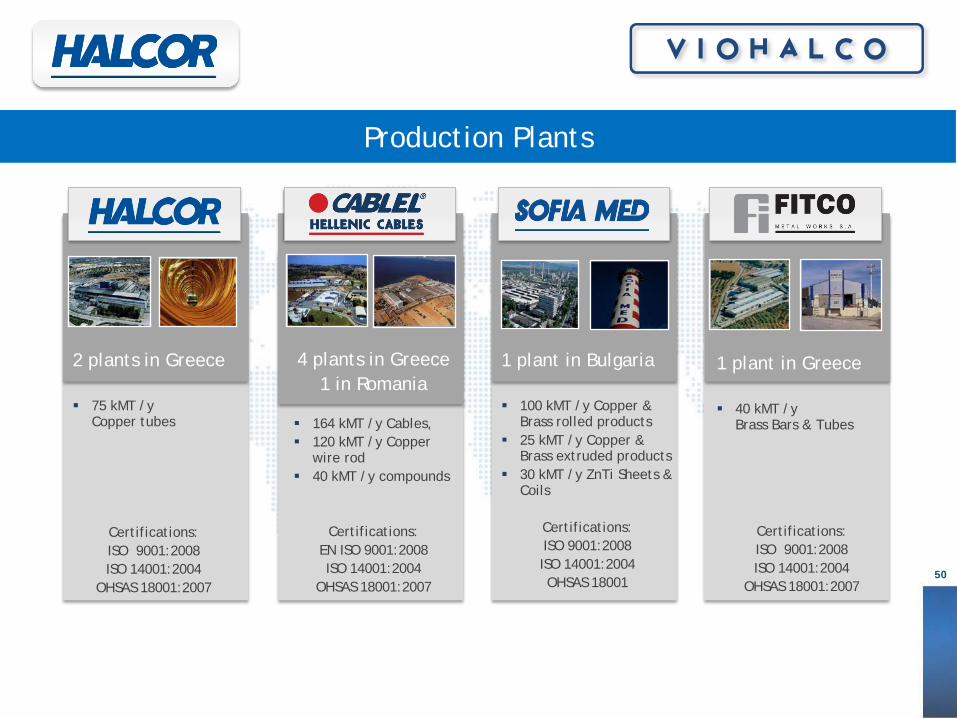
Production Plants
2 plants in Greece 75 kMT /y
Copper tubes
Certifications: ISO 9001:2008 ISO 14001:2004
OHSAS 18001:2007
4 plants in Greece 1 in Romania
164 kMT /y Cables, 120 kMT /y Copper
wire rod 40 kMT /y compounds
Certifications:
EN ISO 9001:2008 ISO 14001:2004
OHSAS 18001:2007
1 plant in Bulgaria 100 kMT /y Copper &
Brass rolled products 25 kMT /y Copper &
Brass extruded products 30 kMT /y ZnTi Sheets &
Coils
Certifications: ISO 9001:2008 ISO 14001:2004 OHSAS 18001
1 plant in Greece 40 kMT /y
Brass Bars & Tubes
Certifications: ISO 9001:2008 ISO 14001:2004
OHSAS 18001:2007
51
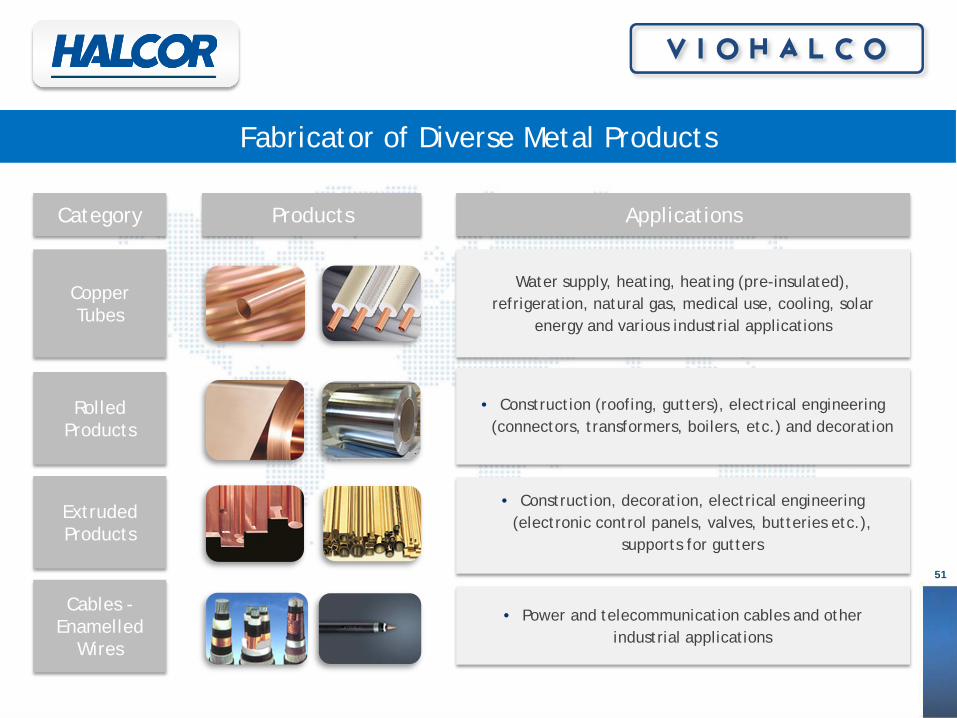
Fabricator of Diverse Metal Products
Copper Tubes
Rolled Products
Extruded Products
Cables - Enamelled
Wires
Category Products Applications
Water supply, heating, heating (pre-insulated), refrigeration, natural gas, medical use, cooling, solar
energy and various industrial applications
• Construction (roofing, gutters), electrical engineering (connectors, transformers, boilers, etc.) and decoration
• Construction, decoration, electrical engineering (electronic control panels, valves, butteries etc.),
supports for gutters
• Power and telecommunication cables and other industrial applications
52
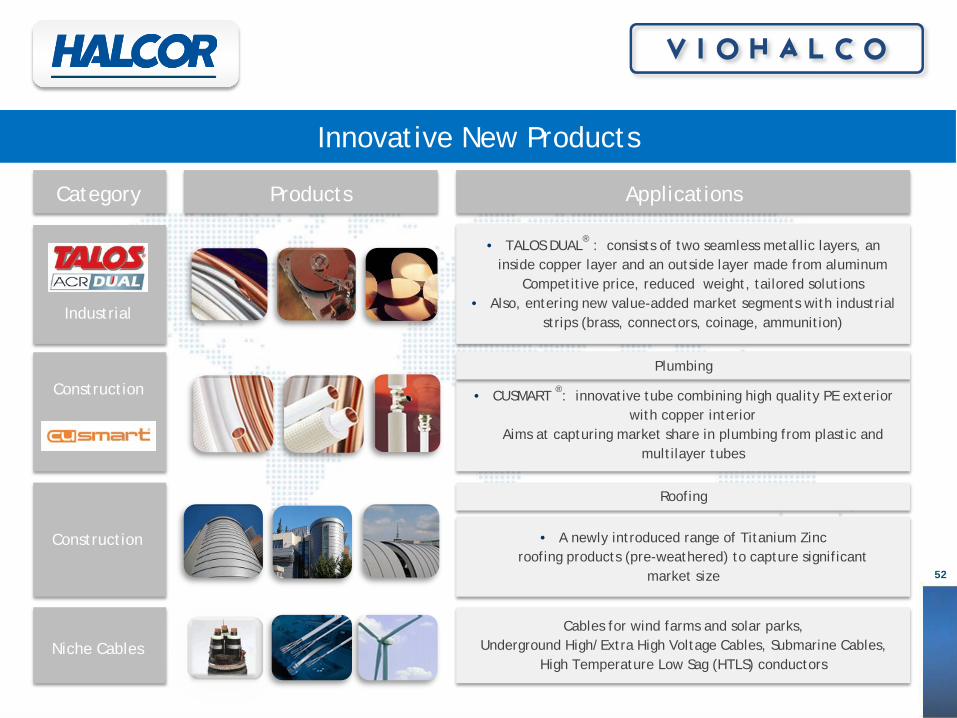
Innovative New Products
Category Products Applications
Industrial
• TALOS DUAL® : consists of two seamless metallic layers, an inside copper layer and an outside layer made from aluminum
Competitive price, reduced weight, tailored solutions • Also, entering new value-added market segments with industrial
strips (brass, connectors, coinage, ammunition)
• CUSMART ®: innovative tube combining high quality PE exterior
with copper interior Aims at capturing market share in plumbing from plastic and
multilayer tubes
• A newly introduced range of Titanium Zinc roofing products (pre-weathered) to capture significant
market size
Plumbing
Roofing
Cables for wind farms and solar parks, Underground High/Extra High Voltage Cables, Submarine Cables,
High Temperature Low Sag (HTLS) conductors
Construction
Construction
Niche Cables
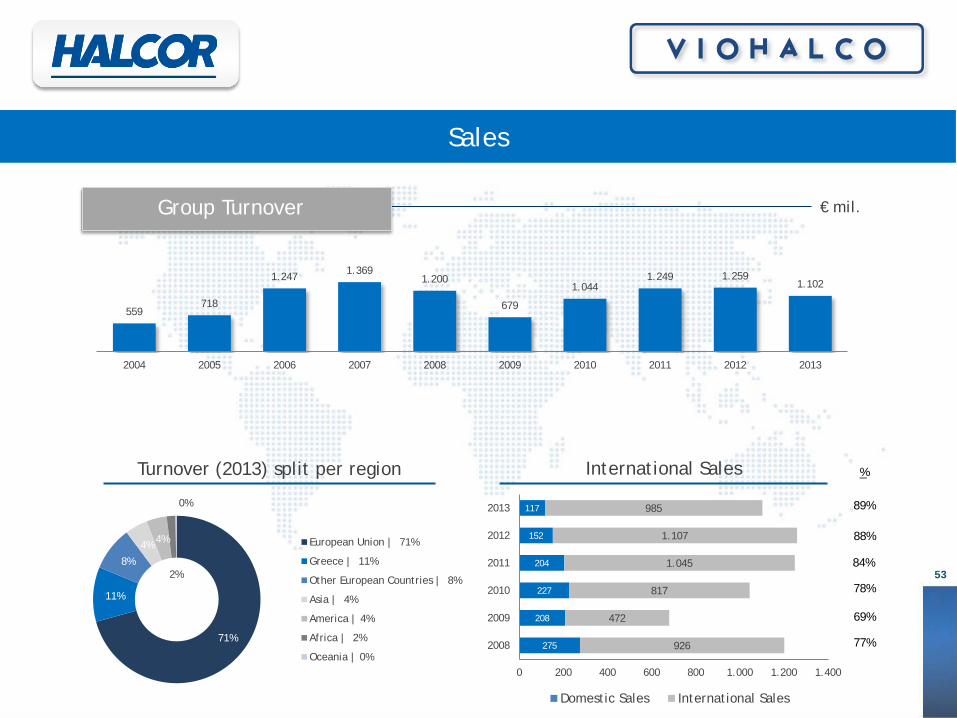
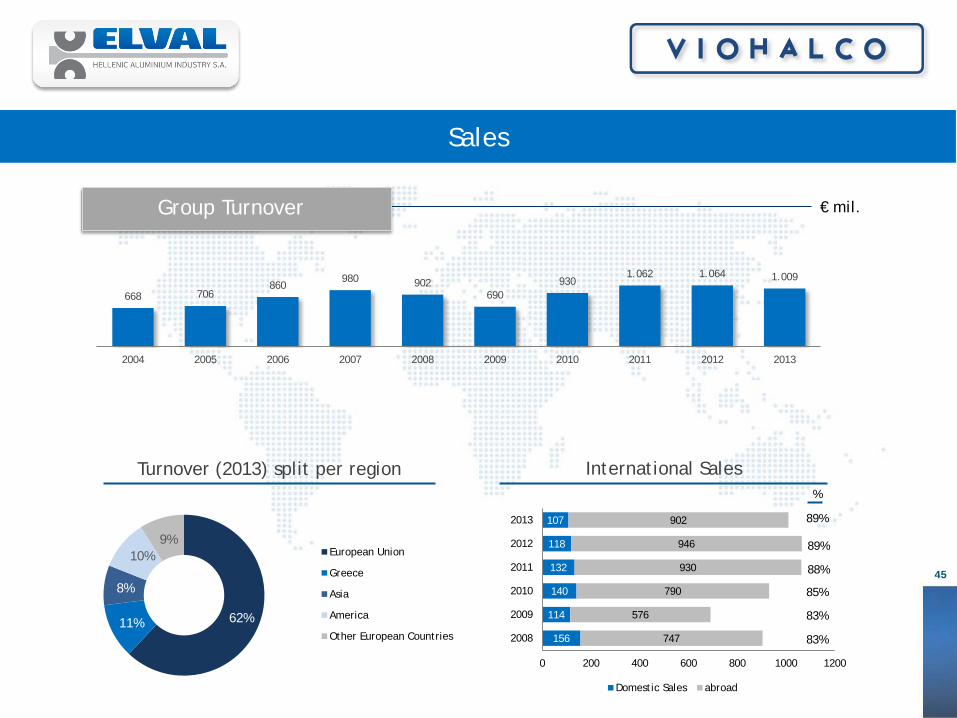
€ mil. Group Turnover
Turnover (2013) split per region International Sales
53
Sales
559 718
1.247 1.369 1.200
679
1.044 1.249 1.259
1.102
2004 2005 2006 2007 2008 2009 2010 2011 2012 2013
71%
11%
8%
4% 4%
2%
0%
European Union | 71%
Greece | 11%
Other European Countries | 8%
Asia | 4%
America | 4%
Africa | 2%
Oceania | 0%275
208
227
204
152
117
926
472
817
1.045
1.107
985
0 200 400 600 800 1.000 1.200 1.400
2008
2009
2010
2011
2012
2013
Domestic Sales International Sales
%
88%
84%
78%
69%
89%
77%
€ mil.
54
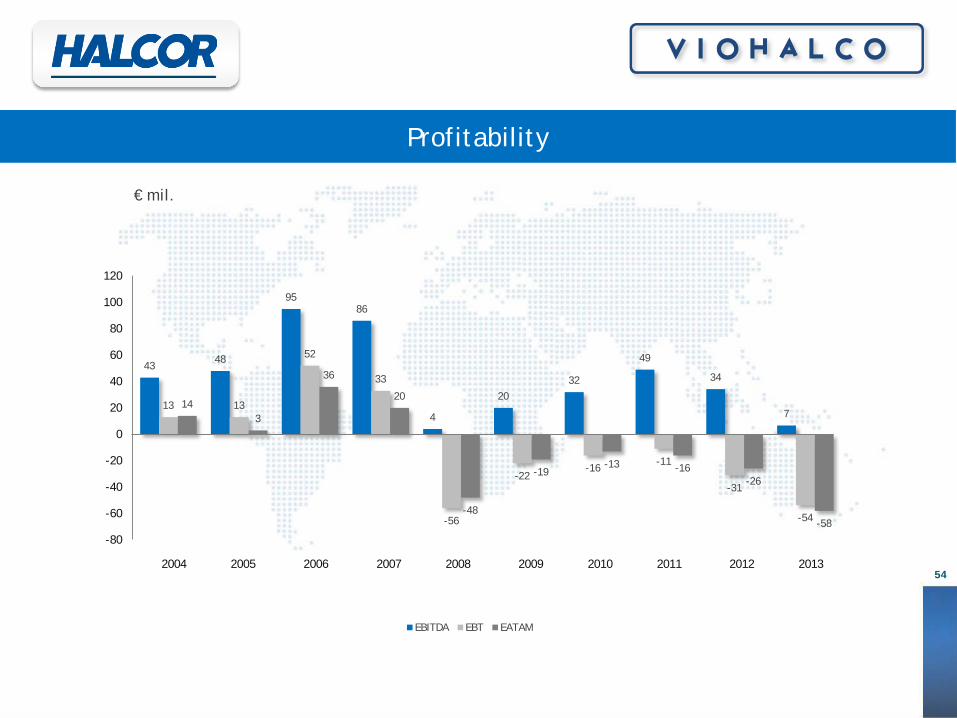
Profitability
43 48
95 86
4
20 32
49
34
7 13 13
52
33
-56
-22 -16
-11
-31
-54
14 3
36
20
-48
-19 -13 -16
-26
-58
-80
-60
-40
-20
0
20
40
60
80
100
120
EBITDA EBT EATAM
2004 2005 2006 2007 2008 2009 2010 2011 2012 2013
1 VIOHALCO 2 Steel 3 Steel Pipes 4 Aluminium 5 Copper
6 Cables 7 Real Estate 8 Financial Appendix
56
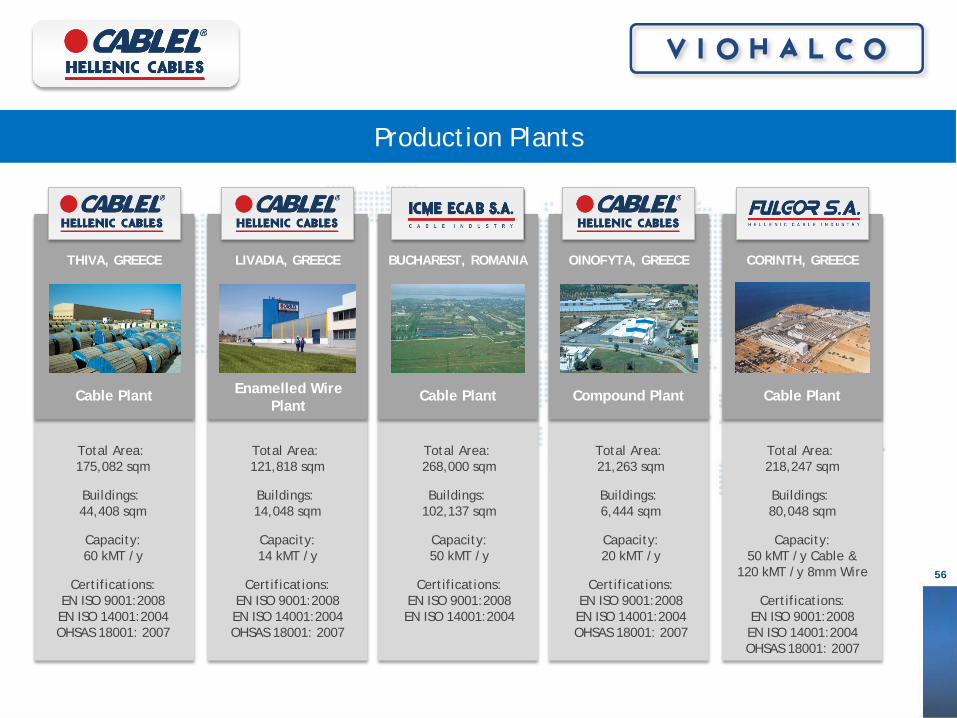
Production Plants
THIVA, GREECE LIVADIA, GREECE BUCHAREST, ROMANIA OINOFYTA, GREECE CORINTH, GREECE
Cable Plant Enamelled Wire Plant
Compound Plant Cable Plant
Total Area: 175,082 sqm
Buildings: 44,408 sqm
Capacity: 60 kMT /y
Certifications:
EN ISO 9001:2008 EN ISO 14001:2004 OHSAS 18001: 2007
Cable Plant
Total Area: 121,818 sqm
Buildings: 14,048 sqm
Capacity: 14 kMT /y
Certifications:
EN ISO 9001:2008 EN ISO 14001:2004 OHSAS 18001: 2007
Total Area: 21,263 sqm
Buildings: 6,444 sqm
Capacity: 20 kMT /y
Certifications:
EN ISO 9001:2008 EN ISO 14001:2004 OHSAS 18001: 2007
Total Area: 268,000 sqm
Buildings:
102,137 sqm
Capacity: 50 kMT /y
Certifications:
EN ISO 9001:2008 EN ISO 14001:2004
Total Area: 218,247 sqm
Buildings: 80,048 sqm
Capacity:
50 kMT /y Cable & 120 kMT /y 8mm Wire
Certifications:
EN ISO 9001:2008 EN ISO 14001:2004 OHSAS 18001: 2007
57
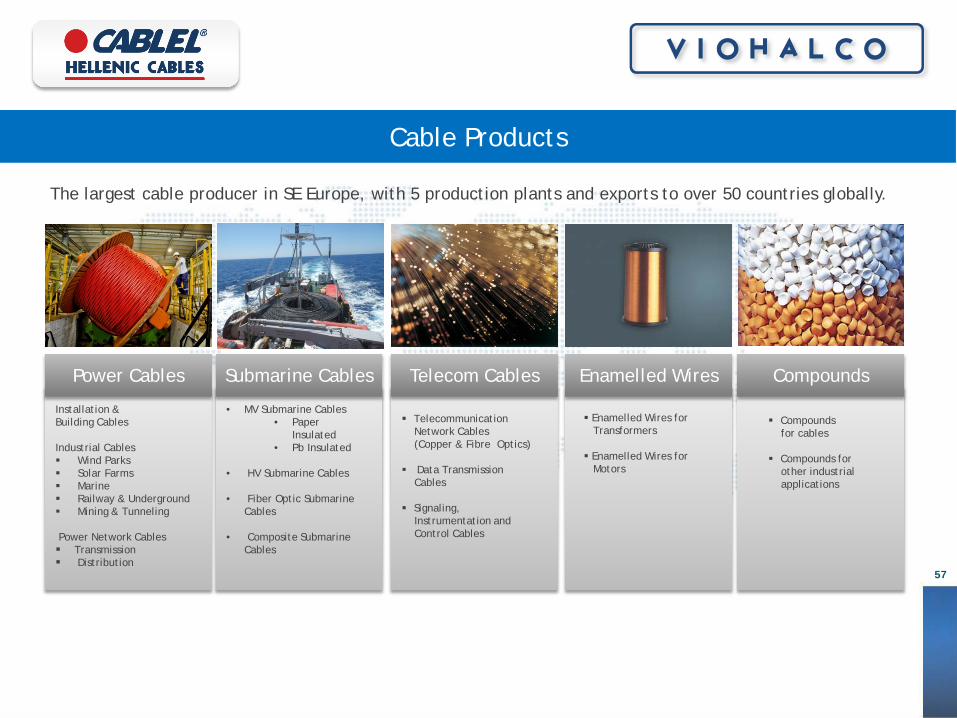
Cable Products
Power Cables
Installation & Building Cables Industrial Cables Wind Parks Solar Farms Marine Railway & Underground Mining & Tunneling Power Network Cables Transmission Distribution
Enamelled Wires
Enamelled Wires for Transformers Enamelled Wires for Motors
Compounds
Compounds for cables Compounds for other industrial applications
Telecom Cables
Telecommunication Network Cables (Copper & Fibre Optics)
Data Transmission Cables Signaling, Instrumentation and Control Cables
Submarine Cables
• MV Submarine Cables • Paper
Insulated • Pb Insulated
• HV Submarine Cables
• Fiber Optic Submarine
Cables
• Composite Submarine Cables
The largest cable producer in SE Europe, with 5 production plants and exports to over 50 countries globally.
58
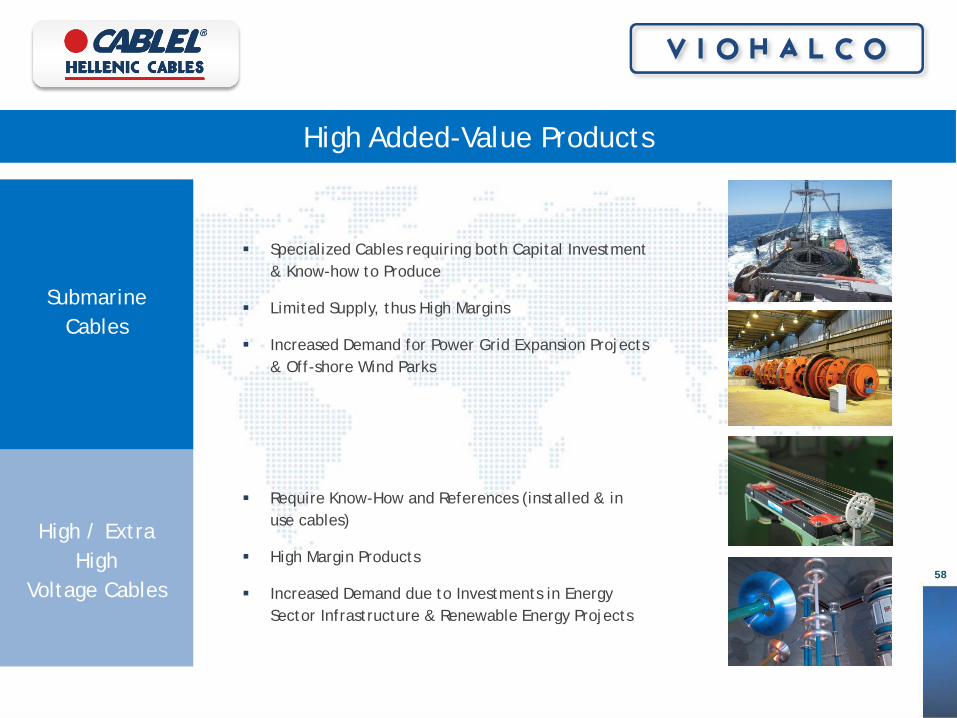
Specialized Cables requiring both Capital Investment & Know-how to Produce
Limited Supply, thus High Margins
Increased Demand for Power Grid Expansion Projects & Off-shore Wind Parks
Submarine Cables
High / Extra High
Voltage Cables
Require Know-How and References (installed & in use cables)
High Margin Products
Increased Demand due to Investments in Energy Sector Infrastructure & Renewable Energy Projects
High Added-Value Products
59
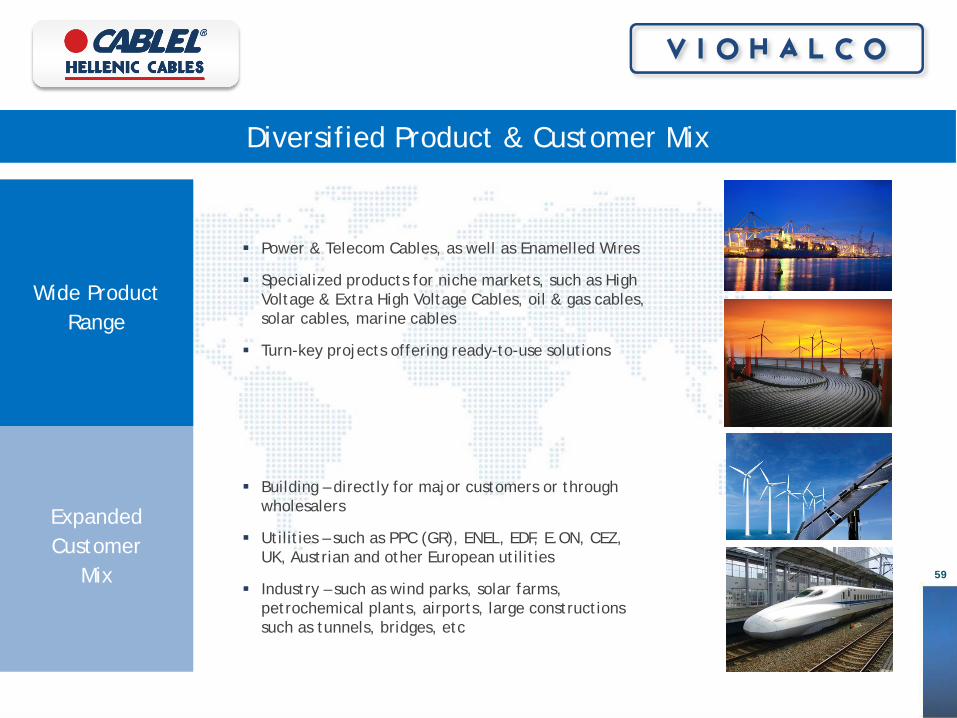
Power & Telecom Cables, as well as Enamelled Wires
Specialized products for niche markets, such as High Voltage & Extra High Voltage Cables, oil & gas cables, solar cables, marine cables
Turn-key projects offering ready-to-use solutions
Wide Product Range
Expanded Customer
Mix
Building – directly for major customers or through wholesalers
Utilities – such as PPC (GR), ENEL, EDF, E.ON, CEZ, UK, Austrian and other European utilities
Industry – such as wind parks, solar farms, petrochemical plants, airports, large constructions such as tunnels, bridges, etc
Diversified Product & Customer Mix
60
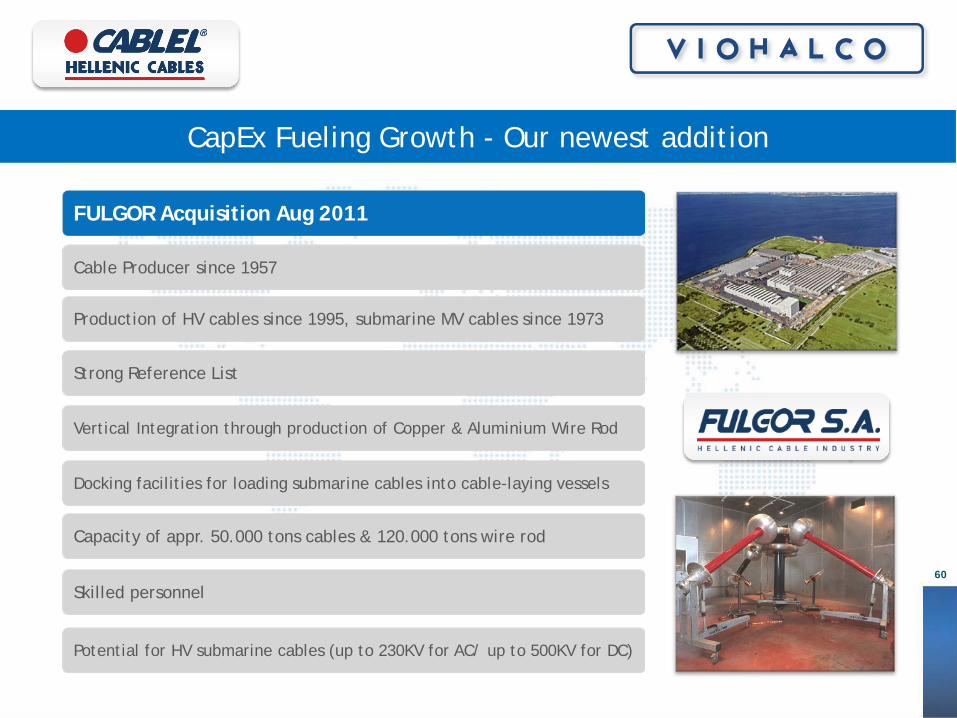
CapEx Fueling Growth - Our newest addition
Cable Producer since 1957
Production of HV cables since 1995, submarine MV cables since 1973
Strong Reference List
Vertical Integration through production of Copper & Aluminium Wire Rod
Docking facilities for loading submarine cables into cable-laying vessels
Capacity of appr. 50.000 tons cables & 120.000 tons wire rod
Skilled personnel
Potential for HV submarine cables (up to 230KV for AC/ up to 500KV for DC)
FULGOR Acquisition Aug 2011
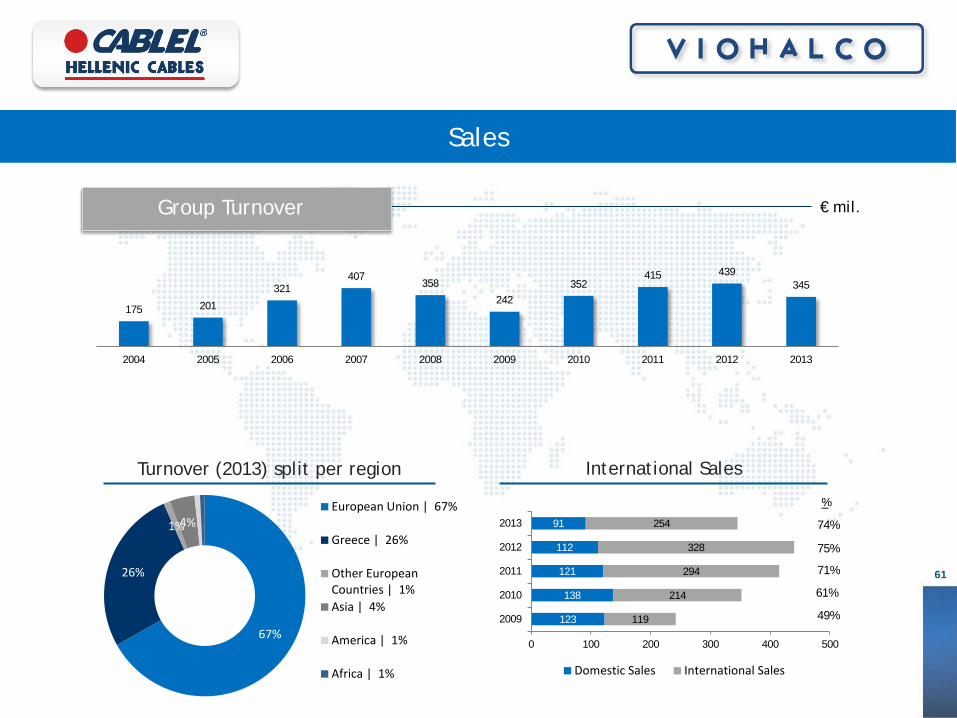
123
138
121
112
91
119
214
294
328
254
0 100 200 300 400 500
2009
2010
2011
2012
2013
Domestic Sales International Sales
€ mil. Group Turnover
Turnover (2013) split per region International Sales
%
75%
71%
61%
49%
Sales
175 201
321 407
358
242 352
415 439 345
2004 2005 2006 2007 2008 2009 2010 2011 2012 2013
74%
67%
26%
1% 4% European Union | 67%
Greece | 26%
Other EuropeanCountries | 1%Asia | 4%
America | 1%
Africa | 1%
61
62
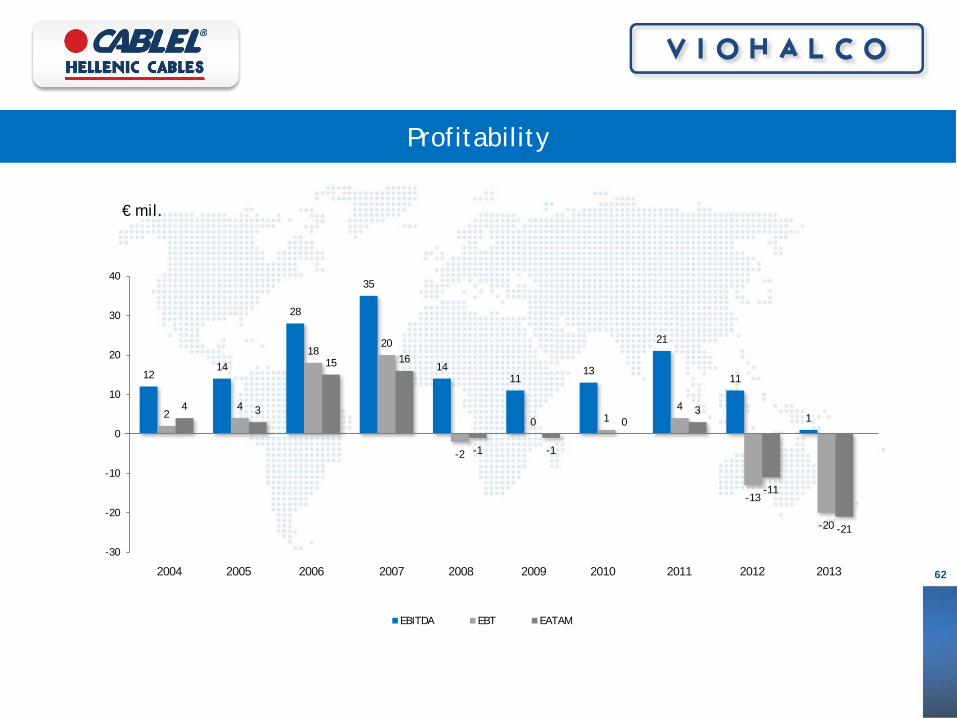
Profitability
€ mil.
12 14
28
35
14 11
13
21
11
1 2 4
18 20
-2
0 1 4
-13
-20
4 3
15 16
-1 -1
0 3
-11
-21
-30
-20
-10
0
10
20
30
40
EBITDA EBT EATAM
2004 2005 2006 2007 2008 2009 2010 2011 2012 2013
1 VIOHALCO 2 Steel 3 Steel Pipes 4 Aluminium 5 Copper 6 Cables
7 Real Estate 8 Financial Appendix
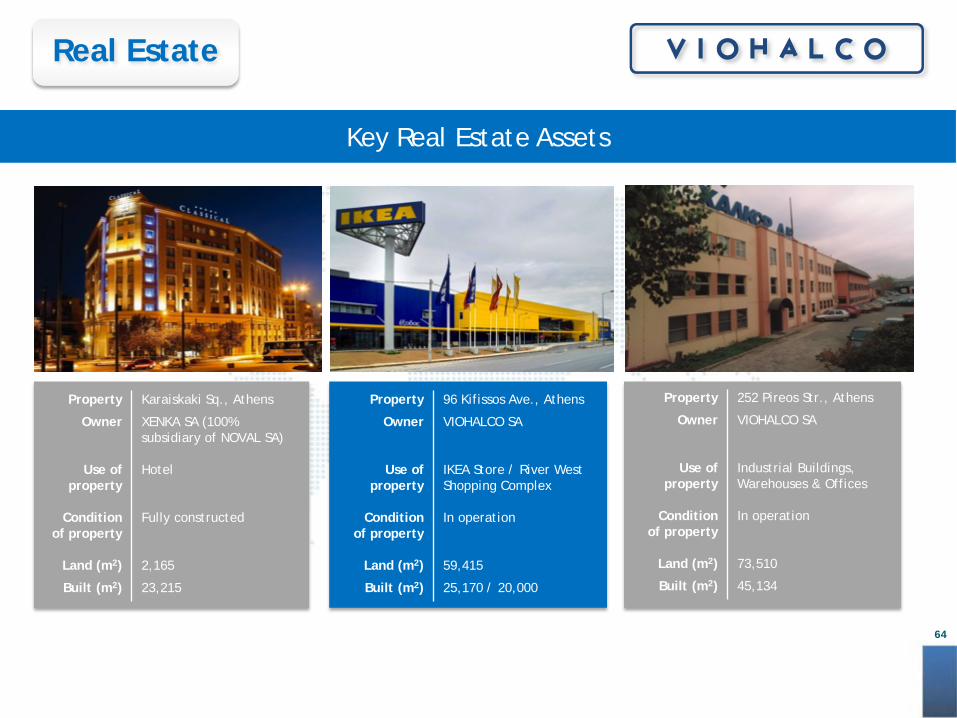
Property Karaiskaki Sq., Athens
Owner XENKA SA (100% subsidiary of NOVAL SA)
Use of property
Hotel
Condition of property
Fully constructed
Land (m2) 2,165
Built (m2) 23,215
Property 96 Kifissos Ave., Athens
Owner VIOHALCO SA
Use of property
IKEA Store / River West Shopping Complex
Condition of property
In operation
Land (m2) 59,415
Built (m2) 25,170 / 20,000
Property 252 Pireos Str., Athens
Owner VIOHALCO SA
Use of property
Industrial Buildings, Warehouses & Offices
Condition of property
In operation
Land (m2) 73,510
Built (m2) 45,134
Key Real Estate Assets
64
Real Estate
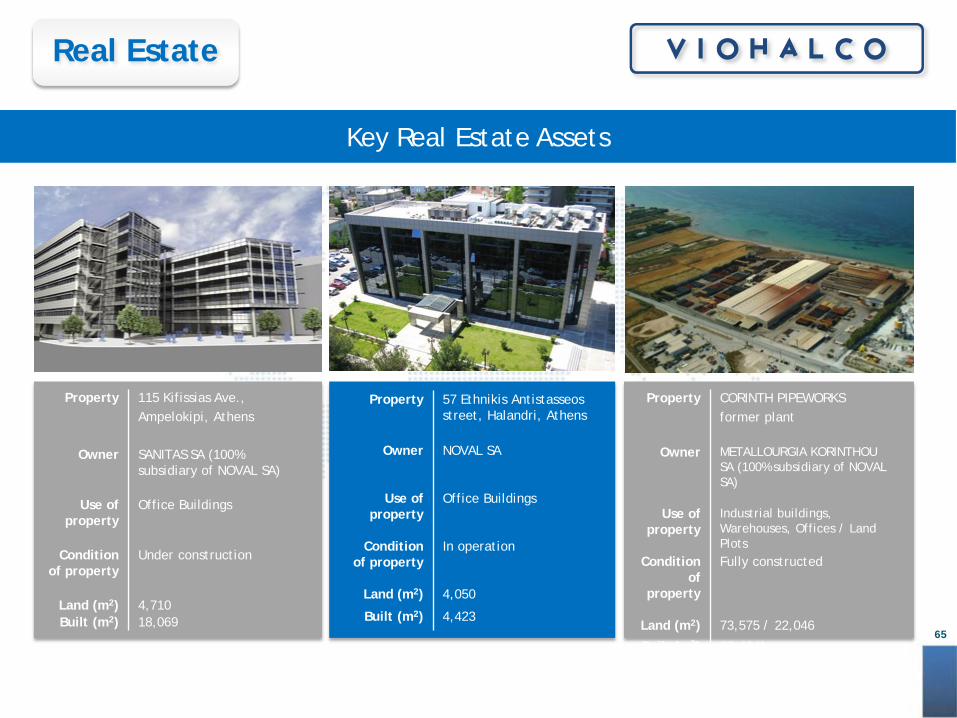
Property 115 Kifissias Ave., Ampelokipi, Athens
Owner SANITAS SA (100% subsidiary of NOVAL SA)
Use of property
Office Buildings
Condition of property
Under construction
Land (m2) 4,710 Built (m2) 18,069
Property 57 Ethnikis Antistasseos street, Halandri, Athens
Owner NOVAL SA
Use of property
Office Buildings
Condition of property
In operation
Land (m2) 4,050
Built (m2) 4,423
Property CORINTH PIPEWORKS former plant
Owner METALLOURGIA KORINTHOU SA (100% subsidiary of NOVAL SA)
Use of property
Industrial buildings, Warehouses, Offices / Land Plots
Condition of
property
Fully constructed
Land (m2) 73,575 / 22,046
Built (m2) 22,404/ -
Key Real Estate Assets
65
Real Estate
Corporate Presentation
1 VIOHALCO 2 Steel 3 Steel Pipes 4 Aluminium 5 Copper 6 Cables 7 Real Estate
8 Financial Appendix
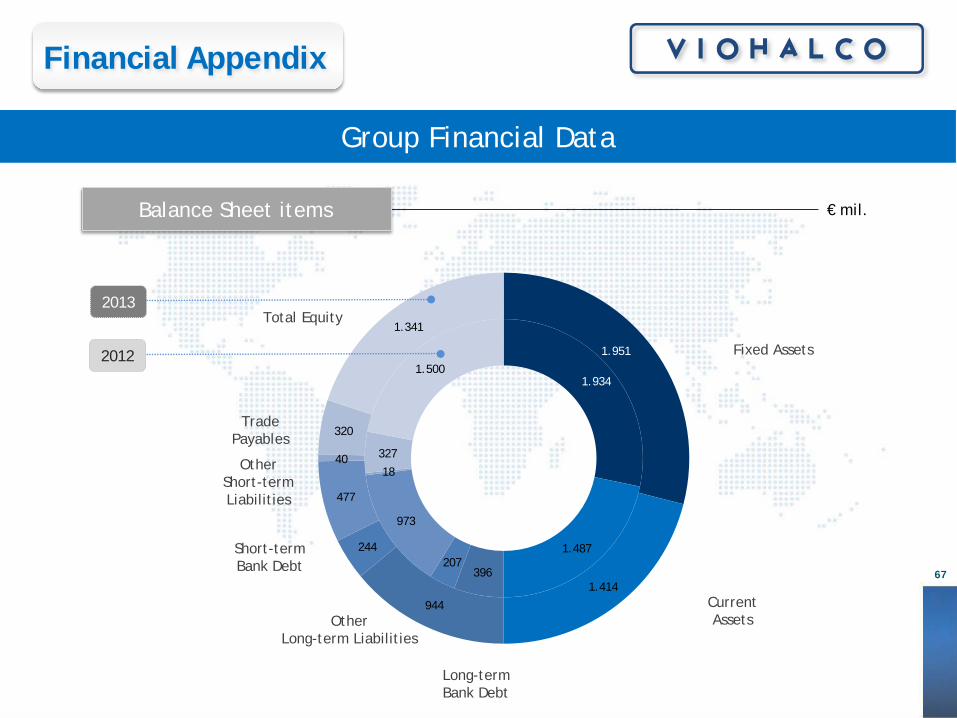
1.934
1.487
396 207
973
18
327
1.500 1.951
1.414
944
244
477
40
320
1.341
Group Financial Data
€ mil. Balance Sheet items
Current Assets
Fixed Assets
Long-term Bank Debt
Other Long-term Liabilities
Short-term Bank Debt
Other Short-term Liabilities
Trade Payables
Total Equity 2013
2012
67
Financial Appendix
Group Financial Data
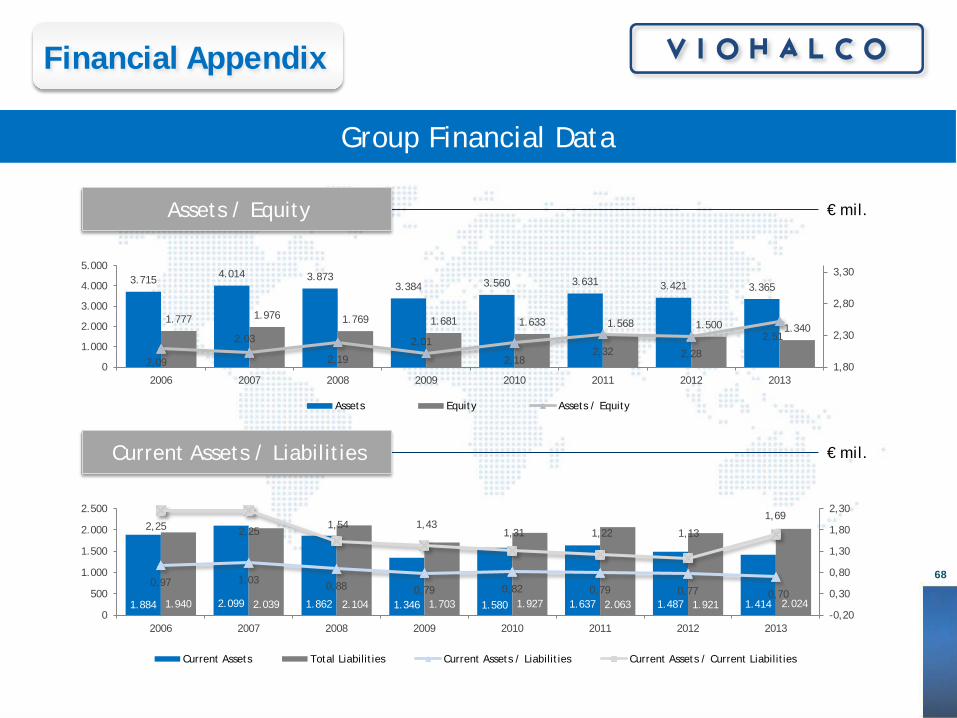
€ mil. Assets / Equity
€ mil. Current Assets / Liabilities
68
Financial Appendix
1.884 2.099 1.862 1.346 1.580 1.637 1.487 1.414 1.940 2.039 2.104 1.703 1.927 2.063 1.921 2.024
0,97 1,03 0,88 0,79 0,82 0,79 0,77 0,70
2,25 2,25 1,54 1,43
1,31 1,22 1,13
1,69
-0,20
0,30
0,80
1,30
1,80
2,30
0
500
1.000
1.500
2.000
2.500
2006 2007 2008 2009 2010 2011 2012 2013
Current Assets Total Liabilities Current Assets / Liabilities Current Assets / Current Liabilities
3.715 4.014 3.873 3.384 3.560 3.631 3.421 3.365
1.777 1.976 1.769 1.681 1.633 1.568 1.500 1.340
2,09
2,03
2,19
2,01
2,18 2,32 2,28
2,51
1,80
2,30
2,80
3,30
0
1.000
2.000
3.000
4.000
5.000
2006 2007 2008 2009 2010 2011 2012 2013
Assets Equity Assets / Equity
Group Financial Data
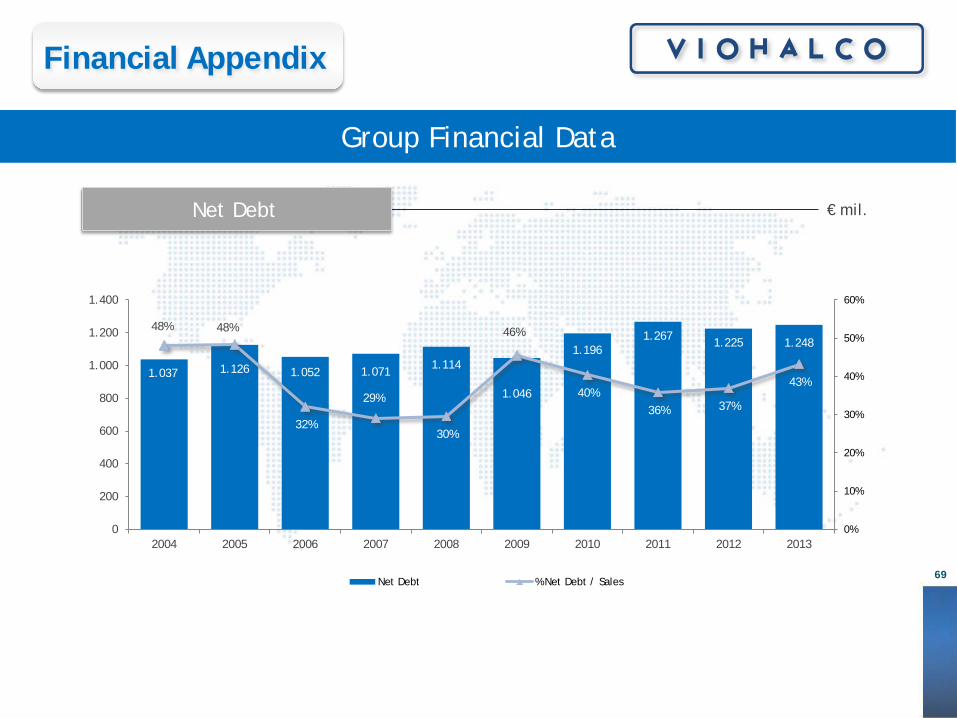
€ mil. Net Debt
69
Financial Appendix
1.037 1.126 1.052 1.071 1.114
1.046
1.196 1.267 1.225 1.248
48% 48%
32%
29%
30%
46%
40% 36% 37%
43%
0%
10%
20%
30%
40%
50%
60%
0
200
400
600
800
1.000
1.200
1.400
2004 2005 2006 2007 2008 2009 2010 2011 2012 2013
Net Debt % Net Debt / Sales
Group Financial Data
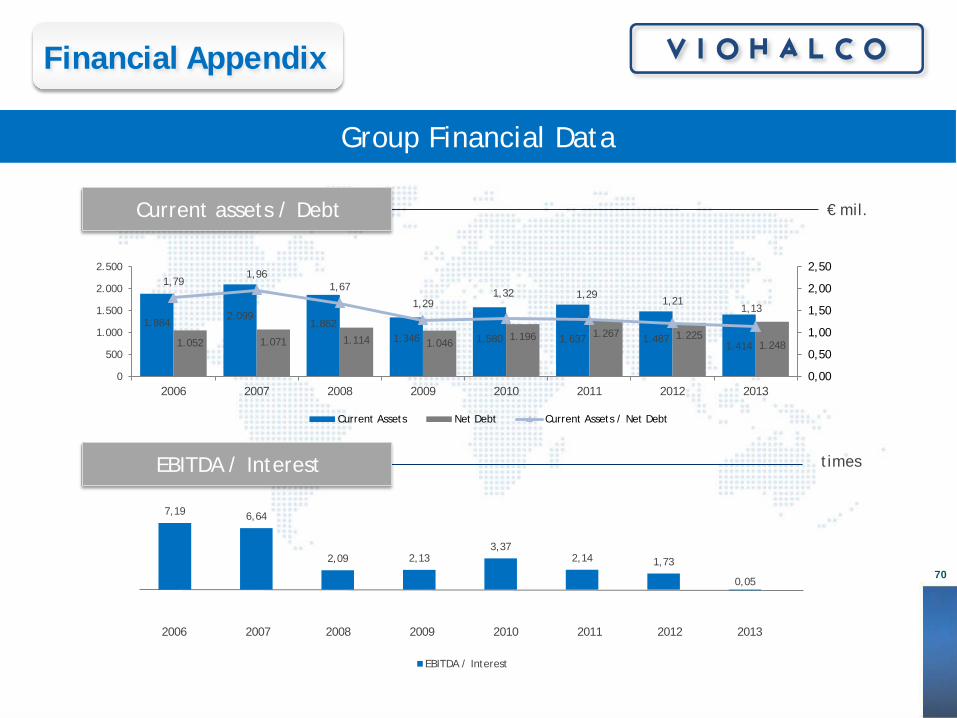
€ mil. Current assets / Debt
times EBITDA / Interest
70
Financial Appendix
1.884 2.099
1.862 1.346 1.580 1.637 1.487
1.414 1.052 1.071 1.114 1.046 1.196 1.267 1.225
1.248
1,79 1,96
1,67
1,29 1,32 1,29
1,21 1,13
0,00
0,50
1,00
1,50
2,00
2,50
0
500
1.000
1.500
2.000
2.500
2006 2007 2008 2009 2010 2011 2012 2013
Current Assets Net Debt Current Assets / Net Debt
2006 2007 2008 2009 2010 2011 2012 2013
7,19 6,64
2,09 2,13 3,37
2,14 1,73
0,05
EBITDA / Interest
71
This document has been prepared by VIOHALCO SA/NV (the “Company”) for use at this presentation. The information contained in this presentation has not been independently verified and no representation or warranty, express or implied, is made as to, and no reliance should be placed on, the fairness, accuracy, completeness or correctness of the information or opinions contained herein. None of the Company, shareholders or any of their respective affiliates, advisers, representatives or employees shall have any liability whatsoever (in negligence or otherwise) for any loss howsoever arising from any use of this document or its contents or otherwise arising in connection with this document. Unless otherwise stated, all financials contained herein are stated in accordance with International Financial Reporting Standards (‘IFRS’ ). This presentation does not constitute an offer or invitation to purchase or subscribe for any shares and neither it or any part of it shall form the basis of, or be relied upon in connection with, any contract or commitment whatsoever. The information included in this presentation may be subject to updating, completion, revision and amendment and such information may change materially. No person is under any obligation to update or keep current the information contained in the presentation and any opinions expressed in relation thereof are subject to change without notices. This presentation has been prepared by the management of the Company solely for use by you at this presentation. “Presentation” means this document, any oral presentation, the question and answer session and any written or oral material discussed or distributed during this presentation. This presentation and its contents are confidential and must not be distributed, published or reproduced (in whole or in part) or disclosed by recipients to any other person. This presentation does not contain all the information that may be important for investors. This presentation is not an offer of securities for sale, nor a solicitation of any offer to purchase securities, in the United States or any other jurisdiction. Neither this presentation nor any part or copy of it may be taken or transmitted into the United States or distributed, directly or indirectly, in the United States. Neither this presentation nor any part or copy of it may be taken or transmitted into Australia, Canada or Japan, or distributed directly or indirectly in Canada or distributed or redistributed in Japan or to any resident thereof. Any failure to comply with these restrictions may constitute a violation of U.S., Australian, Canadian or Japanese securities laws. The distribution of this presentation in other jurisdictions may be restricted by law and persons into whose possession this document comes should inform themselves about, and observe, any such restrictions. The Company’s securities have not been and will not be registered under the Securities Act and may not be offered or sold in the United States.. The recipients of this presentations should not use the information in this presentation in any way which would constitute "market abuse" (as defined by the law of 2 August 2002 on the supervision of the financial sector and on financial services). This presentation does not constitute a recommendation regarding the securities of the Company. FORWARD LOOKING STATEMENTS This document contains forward-looking statements. Except for historical information, the matters discussed in this presentation are forward-looking statements that are subject to certain risks and uncertainties that could cause the actual results of operations, financial condition, liquidity, performance, prospects and opportunities to differ materially, including but not limited to the following: the uncertainty of the national and global economy; economic conditions generally and the Company’s sector specifically; competition from other companies. Although the Company believes the expectations reflected in such forward-looking statements are based on reasonable assumptions, it can give no assurance that its expectations will be attained. The forward-looking statements are made as of the date of this presentation, and we undertake no obligation to publicly update or revise any forward-looking statement, whether as a result of new information, future events or otherwise. By attending this presentation, you agree to be bound by the foregoing limitations.
Disclaimer