Embed Size (px)
Citation preview
1
1-USO032 Plug and Play Solar
Project results and lessons learnt
Lead organisation: Commonwealth Scientific and Industrial Research Organisation
Project commencement date: 7th January 2013 Completion date: 7th April 2017
Date published: 10th March 2017
Contact name: Chris Knight
Title: Project Leader
Email: [email protected] Phone: +61 2 4960 6049
Website: www.CSIRO.au
1-USO032-Plug and Play Solar Public Dissemination Report | Page 2
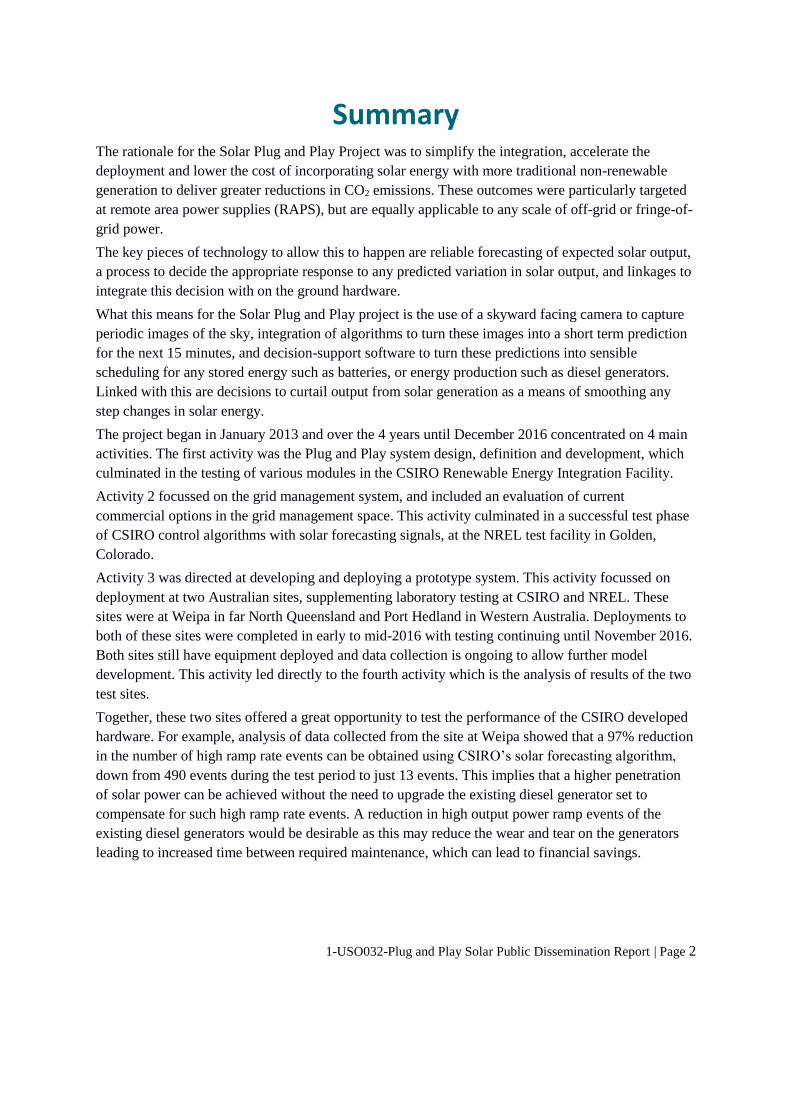
Summary The rationale for the Solar Plug and Play Project was to simplify the integration, accelerate the
deployment and lower the cost of incorporating solar energy with more traditional non-renewable
generation to deliver greater reductions in CO2 emissions. These outcomes were particularly targeted
at remote area power supplies (RAPS), but are equally applicable to any scale of off-grid or fringe-of-
grid power.
The key pieces of technology to allow this to happen are reliable forecasting of expected solar output,
a process to decide the appropriate response to any predicted variation in solar output, and linkages to
integrate this decision with on the ground hardware.
What this means for the Solar Plug and Play project is the use of a skyward facing camera to capture
periodic images of the sky, integration of algorithms to turn these images into a short term prediction
for the next 15 minutes, and decision-support software to turn these predictions into sensible
scheduling for any stored energy such as batteries, or energy production such as diesel generators.
Linked with this are decisions to curtail output from solar generation as a means of smoothing any
step changes in solar energy.
The project began in January 2013 and over the 4 years until December 2016 concentrated on 4 main
activities. The first activity was the Plug and Play system design, definition and development, which
culminated in the testing of various modules in the CSIRO Renewable Energy Integration Facility.
Activity 2 focussed on the grid management system, and included an evaluation of current
commercial options in the grid management space. This activity culminated in a successful test phase
of CSIRO control algorithms with solar forecasting signals, at the NREL test facility in Golden,
Colorado.
Activity 3 was directed at developing and deploying a prototype system. This activity focussed on
deployment at two Australian sites, supplementing laboratory testing at CSIRO and NREL. These
sites were at Weipa in far North Queensland and Port Hedland in Western Australia. Deployments to
both of these sites were completed in early to mid-2016 with testing continuing until November 2016.
Both sites still have equipment deployed and data collection is ongoing to allow further model
development. This activity led directly to the fourth activity which is the analysis of results of the two
test sites.
Together, these two sites offered a great opportunity to test the performance of the CSIRO developed
hardware. For example, analysis of data collected from the site at Weipa showed that a 97% reduction
in the number of high ramp rate events can be obtained using CSIRO’s solar forecasting algorithm,
down from 490 events during the test period to just 13 events. This implies that a higher penetration
of solar power can be achieved without the need to upgrade the existing diesel generator set to
compensate for such high ramp rate events. A reduction in high output power ramp events of the
existing diesel generators would be desirable as this may reduce the wear and tear on the generators
leading to increased time between required maintenance, which can lead to financial savings.
1-USO032-Plug and Play Solar Public Dissemination Report | Page 3
Project Overview
Project summary Hybrid renewable energy systems combine renewable generators, such as solar photovoltaics and
wind, together with more conventional, non-renewable sources such as diesel or gas generation.
Often some form of energy storage is also incorporated. This can take various forms, including
intelligent building HVAC, ice storage, hot water storage or chemical systems like batteries. These
integrated systems play an important role in the journey toward a lower carbon electricity system but
they are subject to two key barriers: cost and technical complexity.
This project addresses these key barriers by developing a ‘plug and play’ (PnP) technology that allows
more efficient use of key technical components like solar generation, energy storage, and traditional
energy sources through dynamic configuration of the control systems. This will reduce the need for
extensive retrofitting, ongoing expert user intervention which are costly and inconvenient. This
problem is particularly pressing in remote area hybrid systems such as those in Western Australia, Far
North Queensland and the Northern Territory where travel times and costs for people and equipment
are significant, and fossil fuel supply is expensive, due to the large distances involved.
For this project, CSIRO collaborated with US research partner the U.S. National Renewable Energy
Laboratory (NREL) and multinational engineering firm ABB. NREL has extensive experience in
energy systems research, testing and the development of planning technologies to help grid designers
and renewable energy proponents. This experience includes the development of the HOMER energy
modelling software platform, a powerful tool for designing and analysing hybrid power systems.
ABB is a multinational supplier of equipment and services to the global electricity industry and is a
leader in developing power and automation technologies that enable utility and industry customers to
improve performance while lowering environmental impact.
Hybrid distributed generation systems are those that incorporate renewable energy (such as solar
power) in addition to conventional generation, typically where generation and load are co-located.
Often, these systems are considered in the context of remote area power systems (RAPS) but hybrid
grids also include 'town size' solar-diesel and solar-gas systems and, increasingly, describe major
electrical grids such as the National Energy Market (NEM) and South West Interconnected System
(SWIS).
Concerns about solar penetration approaching or exceeding a grid's 'hosting capacity' have prompted
grid operators to impose additional requirements on new solar PV systems. Such requirements need to
be carefully developed to ensure they do not reduce the incentive to increase solar deployment in
areas of greatest potential benefit - principally where the cost of supply is greatest.
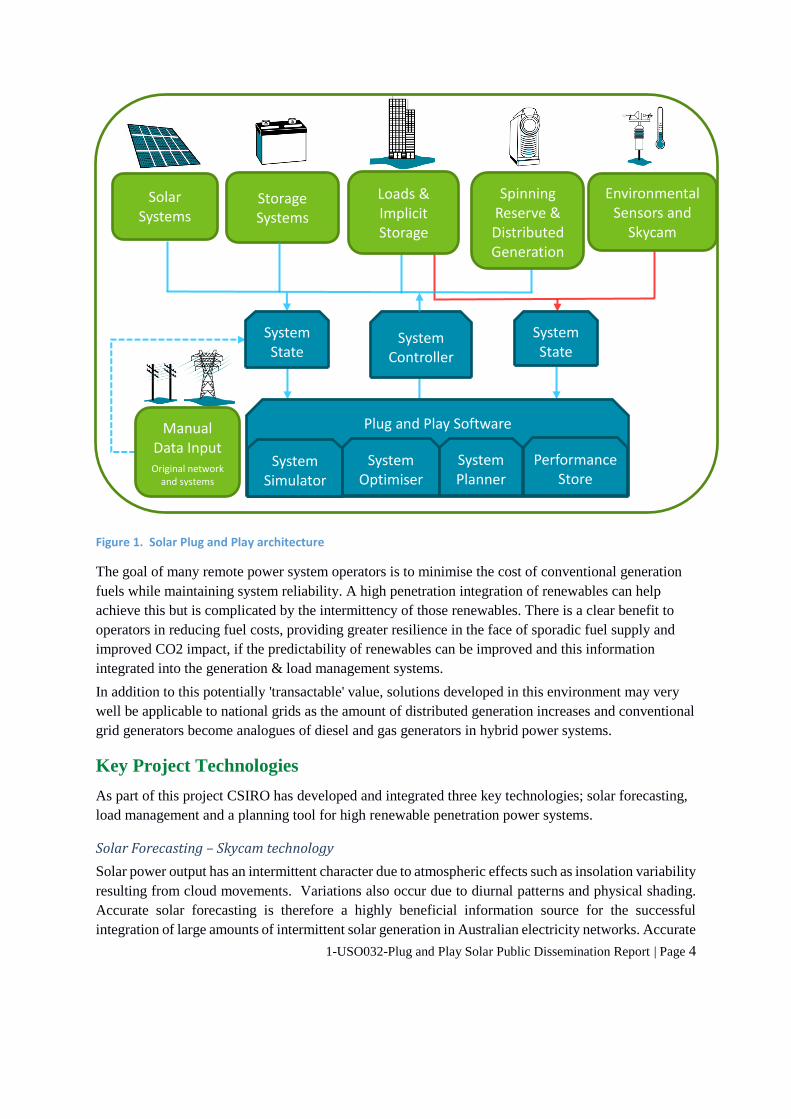
The basic architecture of the Plug and Play system is shown in Figure 1. A variety of hardware is
shown, and this is typically already part of the deployed system. The addition of the skycam hardware
allows predictive forecasting of solar energy availability.
1-USO032-Plug and Play Solar Public Dissemination Report | Page 4
Figure 1. Solar Plug and Play architecture
The goal of many remote power system operators is to minimise the cost of conventional generation
fuels while maintaining system reliability. A high penetration integration of renewables can help
achieve this but is complicated by the intermittency of those renewables. There is a clear benefit to
operators in reducing fuel costs, providing greater resilience in the face of sporadic fuel supply and
improved CO2 impact, if the predictability of renewables can be improved and this information
integrated into the generation & load management systems.
In addition to this potentially 'transactable' value, solutions developed in this environment may very
well be applicable to national grids as the amount of distributed generation increases and conventional
grid generators become analogues of diesel and gas generators in hybrid power systems.
Key Project Technologies
As part of this project CSIRO has developed and integrated three key technologies; solar forecasting,
load management and a planning tool for high renewable penetration power systems.
Solar Forecasting – Skycam technology
Solar power output has an intermittent character due to atmospheric effects such as insolation variability
resulting from cloud movements. Variations also occur due to diurnal patterns and physical shading.
Accurate solar forecasting is therefore a highly beneficial information source for the successful
integration of large amounts of intermittent solar generation in Australian electricity networks. Accurate
Plug and Play Software
System Simulator
System Optimiser
System Planner
Manual Data Input
Original network and systems configuration
Performance Store
Solar Systems
Storage Systems
Loads & Implicit Storage
Spinning Reserve & Distributed Generation
System State
Record
System Controller
System State
Forecas
Environmental Sensors and
Skycam
1-USO032-Plug and Play Solar Public Dissemination Report | Page 5
solar forecasting enables variability to be managed and enables optimal matching of solar supply and
electrical demand in applications employing energy storage or load control. System operators and
planners already use load forecasting as one of the mechanisms to ensure infrastructure levels are
sufficient to satisfy reliability standards and similarly, the introduction of solar forecasting potentially
provides energy distributors, energy retailers and solar operators with an opportunity to achieve a better
understand of Australia’s solar resource and how to exploit it.
Load Management
In order to better understand load management requirements, CSIRO explored typical load profiles
across different system sizes. Aggregate network loads for large systems can be reasonably stable and
predictable, despite device switching and sporadic individual usage. When embarking on load
management, loads can be broken into:
1. Fixed loads – the power consumption and time of operation of these loads cannot be changed
– such as running a ventilation fan or watching a television show;
2. Controllable Loads – loads where there is some scope for changing run times and power levels
in response to the needs of the plug and play system. This can include loads such as ‘off-peak’
water heating, air-conditioning and refrigeration where thermal energy storage exists. Pumping
loads can often be shifted and rescheduled forward and back with reasonable flexibility
however loads such as lighting and air-conditioning are often only adjustable up or down to
reduce demand - through dimming, cycling or set-point changes.
The Network Planning Tool
CSIRO has developed proof-of-concept integrated decision support software for the design of high-
penetration renewable systems. The software brings together leading energy systems design tool
HOMER and the powerful OpenDSS power-flow suite to explore the network-level performance of
potential energy solutions. The key technological advancement here is the development of interfacing
systems that allow for the efficient translation of HOMER outputs into the OpenDSS platform – a
process that would otherwise be laborious and manual. The result is an improved work-flow that
enables a more rapid transition from initial high-level planning and to deeper network modelling that
considers generation placement and network losses.
Project scope
This project sought to simplify the integration, accelerate the deployment and lower the cost of solar
energy in hybrid distributed generation applications by creating technology which is capable of
planning, optimising and operating these systems. The project’s technology was developed to assist
system developers, owners and operators by simplifying the process of implementing, expanding and
operating solar hybrid systems and enabled a reduction in cost and complexity by reducing the
requirement for on-site specialised labour, reducing connection time and associated outages.
The key problems addressed by the Plug and Play project were those associated with reducing system
cost, enabling higher solar performance in hybrid grids and increasing the uptake of solar power. At
the planning stage the developed software can help by reducing the need for complicated and
protracted integration studies, commissioning and system modifications. During operations the
1-USO032-Plug and Play Solar Public Dissemination Report | Page 6
improved performance, both in terms of reduced fuel usage and reduced high ramp rate events, drives
down the cost of onsite skilled labour and maintenance hardware costs. This problem is particularly
pressing in remote area hybrid systems, such as those in Western Australia, Far North Queensland and
the Northern Territory where travel times and costs for people and equipment are significant due to
the large distances involved.
The key elements that the project sought to develop were around short term solar forecasting, diesel
and battery scheduling, network planning tools, and load management. The integration of these
elements allows a project to be planned with higher performance certainty with reduced project risk
`in order to lower financing costs and improve capital availability – reducing system cost and
increasing the uptake of solar power
The project was initially a partnership between the US National Renewable Energy Laboratory, ABB
Group, HOMER Energy and CSIRO. In the last 12 months of the project, and continuing after the
project completion, further partners were added as test beds for the technology. These were Energy
Made Clean Pty Ltd and the Pilbara Meta Maya Regional Aboriginal Corporation (Port Hedland,
Western Australia) and Weipa Solar Farm Pty Ltd and Rio Tinto (Weipa, Queensland). These two
sites were used as test beds for the core solar forecasting hardware.
Outcomes
Project Outcomes were:
• A prototype plug and play technology system • A configurable system for the real-time operation, optimisation and
control of minigrid energy systems, utilising solar forecasting inputs and computational intelligence techniques
• Two operating prototype plug and play solar power systems in Australia • A market potential report outlining next steps to commercialisation • A research alliance formed between CSIRO and ABB to undertake this
project • Significant research cooperation experience between CSIRO and NREL
The early part of the project consisted of system specification and analysis of existing hardware for
control of minigrid components. This allowed a research alliance between CSIRO and ABB to
develop. A number of components were tested, improved and further developed. These items were
thoroughly tested in the CSIRO Renewable Energy Integration Facility (REIF), Newcastle Energy
Centre. Further testing was also undertaken at the National Renewable Energy Laboratory (NREL),
Golden Colorado. This testing allowed a significant research cooperation to develop between CSIRO
and NREL, which has resulted in further collaboration on various projects.
As the testing moved to real world locations, we were unable to identify suitable test sites, with the
specific hardware, in either Australia or the US. After further discussions with Energy Made Clean
(EMC) and First Solar Australia, two test sites were found and our prototype hardware was installed.
1-USO032-Plug and Play Solar Public Dissemination Report | Page 7
This system collected solar and cloud data from the test sites in Western Australia and Queensland.
This data was then analysed and predictions made of short term solar resource. These forecasts were
then used to provide real-time operation, optimisation and control of various minigrid energy
components, principally diesel and battery set points and solar PV output power settings.
The system performance testing in Australia, utilising the REIF laboratory, and in the US at the
NREL facility, allowed an excellent opportunity for debugging and error checking the hardware and
software interactions. This initial phase was critical in developing a body of knowledge for system
operation. Onsite testing at Weipa and Port Hedland allowed collection of real world data which was
then used to train the forecasting algorithms and set point decision systems. Both laboratory and in
field testing of forecasting systems were critical in advancing the technology and improving system
commercial readiness.
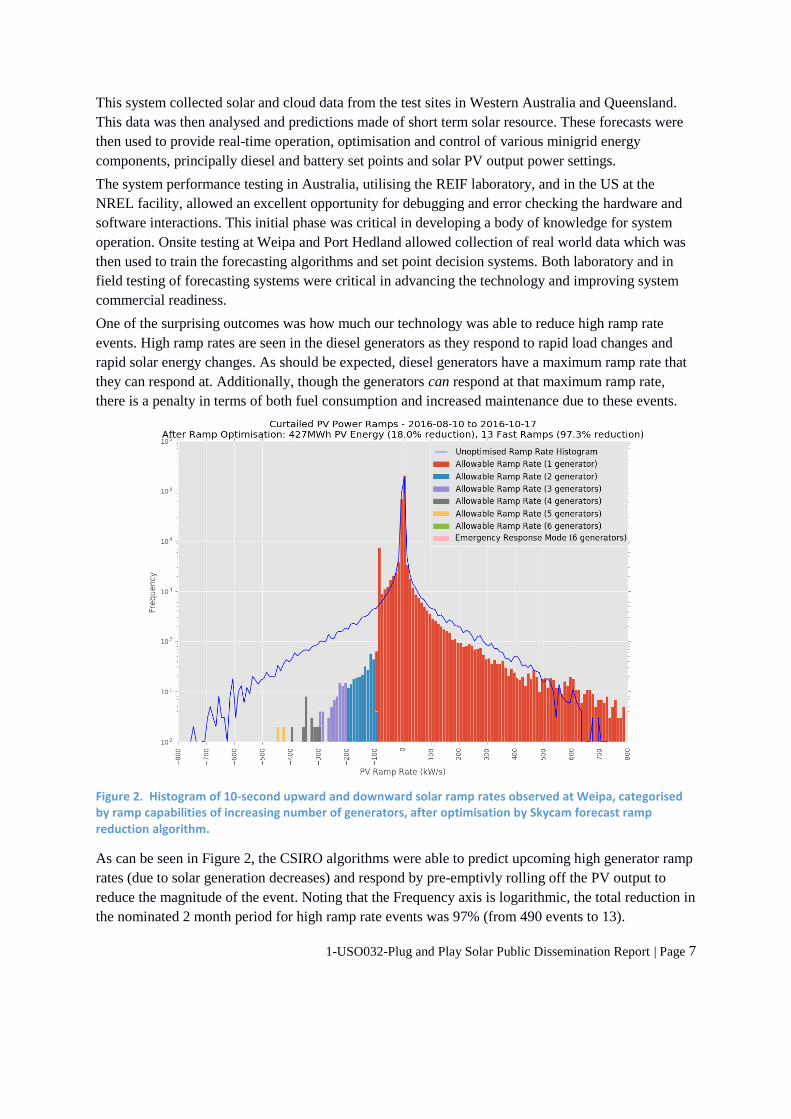
One of the surprising outcomes was how much our technology was able to reduce high ramp rate
events. High ramp rates are seen in the diesel generators as they respond to rapid load changes and
rapid solar energy changes. As should be expected, diesel generators have a maximum ramp rate that
they can respond at. Additionally, though the generators can respond at that maximum ramp rate,
there is a penalty in terms of both fuel consumption and increased maintenance due to these events.
Figure 2. Histogram of 10-second upward and downward solar ramp rates observed at Weipa, categorised by ramp capabilities of increasing number of generators, after optimisation by Skycam forecast ramp reduction algorithm.
As can be seen in Figure 2, the CSIRO algorithms were able to predict upcoming high generator ramp
rates (due to solar generation decreases) and respond by pre-emptivly rolling off the PV output to
reduce the magnitude of the event. Noting that the Frequency axis is logarithmic, the total reduction in
the nominated 2 month period for high ramp rate events was 97% (from 490 events to 13).
1-USO032-Plug and Play Solar Public Dissemination Report | Page 8
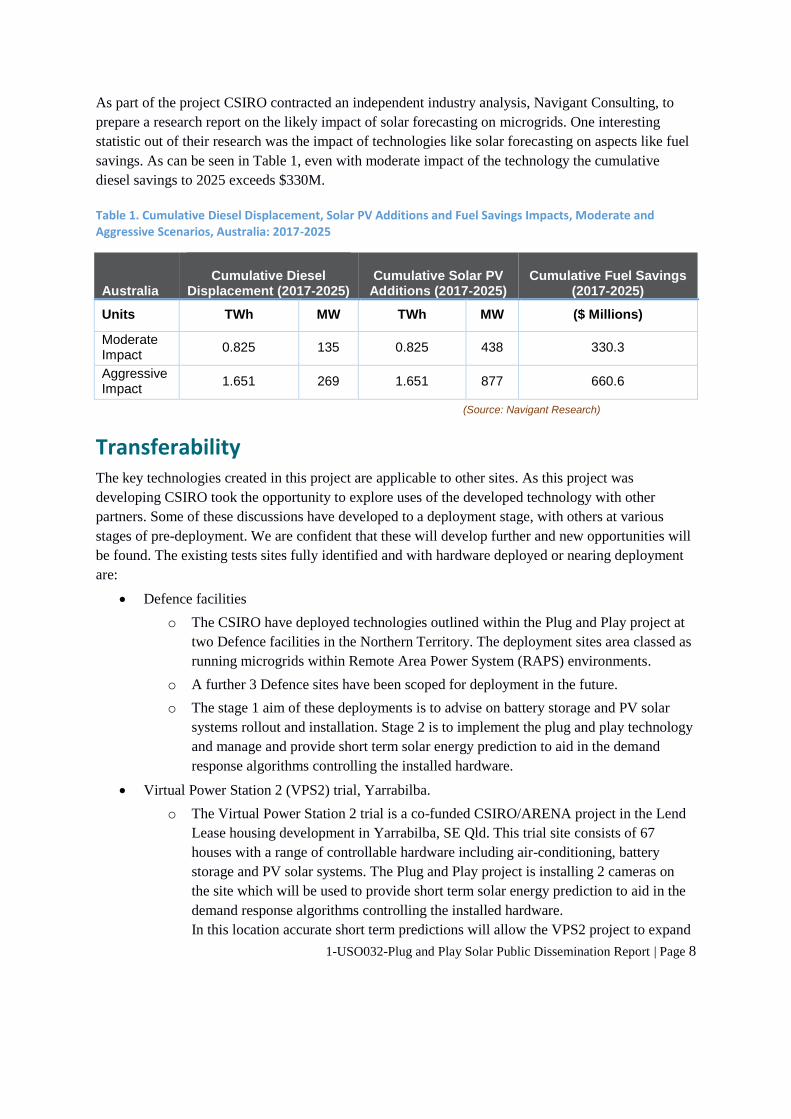
As part of the project CSIRO contracted an independent industry analysis, Navigant Consulting, to
prepare a research report on the likely impact of solar forecasting on microgrids. One interesting
statistic out of their research was the impact of technologies like solar forecasting on aspects like fuel
savings. As can be seen in Table 1, even with moderate impact of the technology the cumulative
diesel savings to 2025 exceeds $330M.
Table 1. Cumulative Diesel Displacement, Solar PV Additions and Fuel Savings Impacts, Moderate and Aggressive Scenarios, Australia: 2017-2025
Australia
Cumulative Diesel
Displacement (2017-2025) Cumulative Solar PV
Additions (2017-2025) Cumulative Fuel Savings
(2017-2025)
Units TWh MW TWh MW ($ Millions)
Moderate Impact
0.825 135 0.825 438 330.3
Aggressive Impact
1.651 269 1.651 877 660.6
(Source: Navigant Research)
Transferability
The key technologies created in this project are applicable to other sites. As this project was
developing CSIRO took the opportunity to explore uses of the developed technology with other
partners. Some of these discussions have developed to a deployment stage, with others at various
stages of pre-deployment. We are confident that these will develop further and new opportunities will
be found. The existing tests sites fully identified and with hardware deployed or nearing deployment
are:
Defence facilities
o The CSIRO have deployed technologies outlined within the Plug and Play project at
two Defence facilities in the Northern Territory. The deployment sites area classed as
running microgrids within Remote Area Power System (RAPS) environments.
o A further 3 Defence sites have been scoped for deployment in the future.
o The stage 1 aim of these deployments is to advise on battery storage and PV solar
systems rollout and installation. Stage 2 is to implement the plug and play technology
and manage and provide short term solar energy prediction to aid in the demand
response algorithms controlling the installed hardware.
Virtual Power Station 2 (VPS2) trial, Yarrabilba.
o The Virtual Power Station 2 trial is a co-funded CSIRO/ARENA project in the Lend
Lease housing development in Yarrabilba, SE Qld. This trial site consists of 67
houses with a range of controllable hardware including air-conditioning, battery
storage and PV solar systems. The Plug and Play project is installing 2 cameras on
the site which will be used to provide short term solar energy prediction to aid in the
demand response algorithms controlling the installed hardware.
In this location accurate short term predictions will allow the VPS2 project to expand

1-USO032-Plug and Play Solar Public Dissemination Report | Page 9
on the useful output of the overlaying demand response trial and improve power
quality in line with the new AS/NZ4777 Demand Response standard.
A number of other sites that are in early discussion phase across Australia within minigrid and
large scale solar farm environments.
As part of the dissemination strategy, CSIRO communications will be using our social networks,
principally Facebook and Twitter, to communicate the key outcomes from a public perception view.
In addition to these, there are technical and scientific communication activities. Some of these have
been completed and others are planned for the early to mid-period of 2017. These include:
International Microgrids Symposium, Niagara-on-the-Lake, 20-21 October 2016
This invite-only, international symposium is held annually, and for 2016 was held in Niagara, Canada.
The symposium attracts researchers from around the world to present their work on microgrids. Two
Solar Plug and Play project team members attended this conference. Dr John Ward presented on
Australian Outback Microgrids, and chaired a session on challenges to a renewable energy based
microgrid.
In his presentation, John outlined details of who CSIRO is, some background of Australian
microgrids, and details of the Plug and Play Solar project, including preliminary results.
In addition Dr Saad Sayeef chaired a session on the challenges of solar intermittency remote
microgrids, and introduced the location of the 2017 Symposium.
International Microgrids Symposium, Newcastle, November 2017
In an excellent outcome for the industry in Australia, the location of the 2017 symposium was
announced as Newcastle, NSW. This represents a great opportunity to present a number of outcomes
from both the ARENA Plug and Play project, sky camera work, diesel optimisation results, and of
course detailed results from both the Port Hedland and Weipa sites, which will have 18 months of
data to work with. This is also a great opportunity to showcase and share with international microgrids
research experts the progress and current status of Australian microgrids, considering the unique
nature of our climate, electricity networks and population density.
In addition to this, the symposium local organising committee is made up of four Plug and Play team
members, Saad, John, Dr Adam Berry and Tim Moore.
3rd Annual Remote Area Power Supply Conference, 22-23 March 2016, Melbourne
Saad presented preliminary work from the Solar Plug and Play project at the 3rd Annual RAPS
conference. His presentation was titled Bringing the Smart Grid to RAPS.
4th Annual Remote Area Power Supply Conference, 21-22 March 2017, Sydney
Saad has also been invited to attend the upcoming 4th RAPS conference to be held in Sydney in early
2017. This represents another great opportunity to broadcast the outcomes from the Solar Plug and
Play project.
As a final note, the Solar Plug and Play Project has been a major piece of work for CSIRO over the
last 4 years. Although the project had no specific Knowledge Dissemination requirements it should be
clear from the items above that ongoing presentations of the key outcomes of the project will
continue.
1-USO032-Plug and Play Solar Public Dissemination Report | Page 10
Conclusion and next steps
After four years, the ARENA Plug and Play project has drawn to a close. The project was initiated to
focus research and practical effort on maximising renewable energy, in remote area power supplies. It
should be noted from the scale of the project’s tests sites that the technology is also applicable to
larger scale off-grid and fringe of grid applications.
Recent success in integrating large and increasing amounts of PV into fringe of grid applications has
revealed problems in stability of those grids as solar intermittency impacts in short time frames. The
approach explored in this project was to develop from existing CSIRO expertise a combination of
network planning, solar forecasting and demand management tools.
CSIRO has developed decision support software for the design of high penetration renewable energy.
Key to the success of this is the development of interfacing systems between the global standard for
microgrid design, HOMER, and the powerful OpenDSS power flow software. The outcome of this is
a fast transition from planning to network modelling.
The solar forecasting was completed using inexpensive hardware, based on sky facing cameras,
coupled with highly optimised and developed algorithms to detect cloud edges and provide accurate
and timely forecasts of impending solar energy changes.
Demand management tools were based on CSIRO developed algorithms initially deployed in the
building heating, ventilation and air-condition space. This software use historical data, weather
forecasts and learning algorithms to develop high level predictions of building loads, and optimised
data for decision making.
These key technologies were integrated into hardware that was initially tested at the CSIRO Energy
Centre, Newcastle. The Renewable Energy Integration Facility used its various power sources,
including PV and gas turbines, and controllable loads, to test the developed hardware.
This same hardware was then put through further testing at the National Renewable Energy
Laboratory (NREL), to evaluate the ability of the Plug and Play control system to provide stable and
reliable operation of a microgrid, with suitable power quality at every source and load. The results of
these two phases of testing revealed success in limiting or mitigating high ramp rate events, such as
cloud shadowing of PV installations.
After this testing CSIRO was able to partner with two remote sites to provide preliminary real word
testing of the system. The first site was in Western Australia at Port Hedland. This was at the Pilbara
Meta Maya Regional Aboriginal Corporation office. That site has approximately 100kW of PV, a
110kVA diesel generator and a 77 kWh lithium battery.
The second site was a remote Queensland bauxite mine at Weipa operated by Rio Tinto, with an
associated PV farm operated by First Solar Weipa. This site was much larger and had 1.7MW of
installed PV panels and six 5.5MVA diesel generators. Together these two sites offered a great
opportunity to test the real world performance of the CSIRO developed hardware. Due to the
operational nature of both sites, we were not able to fully control the grids. However, the data
collected during the trials has been used in this report to generate predictions of outcomes from the
solar forecasting in energy production and grid stability.

1-USO032-Plug and Play Solar Public Dissemination Report | Page 11
Perhaps of all the outcomes, the reduction in high ramp rate event is the most revealing. High ramp
rate events come about when the diesel generators are obliged to replace PV generated power on short
notice. Typically this is due to shading events. The specification of the diesels provides a limit on how
quickly the generator scan ramp up to replace the lost load. High ramp rates are hard on the mechanics
of a generator and thus a reduction in these is of great benefit.
At Weipa, in the test period, there were 490 of these fast ramp events, our algorithms were able to
forecast the incoming solar loss to an extent that reduced these ramp rates by more than 97% to just
13 events.
At Port Hedland, our analysis saw the potential for reduction in fuel consumption of up to 7.8%, as
well as a reduction in the number of generator starts of up to 36.1%.
1-USO032-Plug and Play Solar Public Dissemination Report | Page 12
Lessons Learnt
Lessons Learnt Report
Optimising does not always reduce fuel usage
Knowledge: Technical
Technology: Solar PV
In order to properly evaluate the value-add of Plug and Play Solar control to the Weipa power supply
system, we must be able to determine an approximate fuel consumption based on the expected
operation of the diesel generators. MAN, the manufacturer of these generators publishes the expected
fuel-oil consumption of a new unit at specific load-points. The best-fit polynomial for these
parameters, based on fuel-oil consumed per unit time, can then be calculated.
While these parameters can only give a broad estimation of the fuel used by a diesel generator in
dynamic operation, it is expected that it would suffice for the purposes of this evaluation. However as
Rio Tinto was able to supply us with actual fuel consumption data it is of course worthwhile to
validate this estimation algorithm against these values.
The diesel usage estimation algorithm was run over the full dataset of diesel data provided by Rio
Tinto, resulting in the following:
Total fuel used during the analysis period: 3,600kL (approximate)
Fuel usage from estimation algorithm: 3,800kL (approximate)
Over-estimation: 5.5%
While clearly not perfect, it is within the bounds of a reasonable estimate – as such it is acceptable to
use this to estimate a likely change in fuel usage based on proposed control modifications. Note that at
all times the diesel estimation algorithm will be used for calculating fuel consumed for both the
‘control’ and the modified operations, to ensure we’re “comparing apples with apples”.
Skycam based imagery was used to produce a 1-minute ahead forecast of solar power production by
training a machine learning regression model using measured power produced by the Weipa solar
farm during the first half of the 4-month data set available. The second half of the data was then used
for validation and optimisation to mitigate the effect of fast downward solar power ramps on the
diesel generators, which are required to ramp up to compensate but are limited in their ramp rates.
The ramp rate limits generator’s operating manual for the generators in use, and specify the maximum
upward (load acceptance) and downward (load reduction) loading per 10-second interval (to match
the resolution of the skycam forecasts). Over the period examined, it was rare for fewer than three
generators to be running simultaneously, so we considered a load acceptance rate for three or fewer
generators to be desirable during optimisation. The optimisation process can be easily run with new
figures for different operating conditions or for other sites.
1-USO032-Plug and Play Solar Public Dissemination Report | Page 13
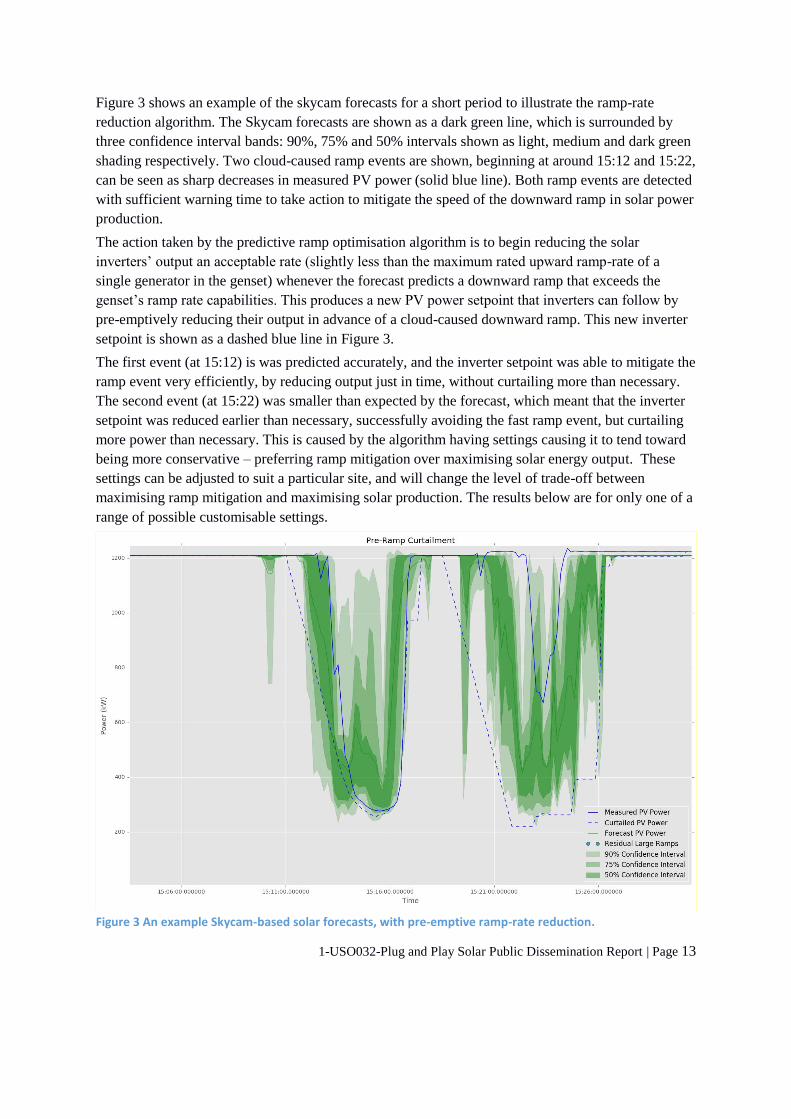
Figure 3 shows an example of the skycam forecasts for a short period to illustrate the ramp-rate
reduction algorithm. The Skycam forecasts are shown as a dark green line, which is surrounded by
three confidence interval bands: 90%, 75% and 50% intervals shown as light, medium and dark green
shading respectively. Two cloud-caused ramp events are shown, beginning at around 15:12 and 15:22,
can be seen as sharp decreases in measured PV power (solid blue line). Both ramp events are detected
with sufficient warning time to take action to mitigate the speed of the downward ramp in solar power
production.
The action taken by the predictive ramp optimisation algorithm is to begin reducing the solar
inverters’ output an acceptable rate (slightly less than the maximum rated upward ramp-rate of a
single generator in the genset) whenever the forecast predicts a downward ramp that exceeds the
genset’s ramp rate capabilities. This produces a new PV power setpoint that inverters can follow by
pre-emptively reducing their output in advance of a cloud-caused downward ramp. This new inverter
setpoint is shown as a dashed blue line in Figure 3.
The first event (at 15:12) is was predicted accurately, and the inverter setpoint was able to mitigate the
ramp event very efficiently, by reducing output just in time, without curtailing more than necessary.
The second event (at 15:22) was smaller than expected by the forecast, which meant that the inverter
setpoint was reduced earlier than necessary, successfully avoiding the fast ramp event, but curtailing
more power than necessary. This is caused by the algorithm having settings causing it to tend toward
being more conservative – preferring ramp mitigation over maximising solar energy output. These
settings can be adjusted to suit a particular site, and will change the level of trade-off between
maximising ramp mitigation and maximising solar production. The results below are for only one of a
range of possible customisable settings.
Figure 3 An example Skycam-based solar forecasts, with pre-emptive ramp-rate reduction.
1-USO032-Plug and Play Solar Public Dissemination Report | Page 14
Figure 2 shows a histogram of solar ramps for the same period, but after the PV output has been
curtailed using the predictive ramp optimisation algorithm illustrated in Figure 3 and discussed above.
The blue line shows the observed (unoptimised) ramp histogram for comparison. This result shows
that the predictive ramp optimisation algorithm combined with skycam forecasts has reduced the
number of large ramps (requiring 4 or more generators to compensate) from 490 to 13, a 97.3%
reduction, with no ramps that were beyond the response capabilities of the genset remaining. This was
achieved with only an 18% curtailment in solar energy production, which was reduced from 521 to
427MWh over this period. There was a slight increase in upward ramps because the optimisation
algorithm does not yet implement any upward ramp rate limits, but these are still well within the rate
capabilities of a single generator, and this can be easily corrected in future development. There was
also an increase in downward ramps at around 95kW/s, as this was the rate chosen for the pre-
curtailment PV power set-point, and is within the capabilities of a single generator.
The above curtailment is a clear improvement in terms of increasing stability, however it is important
to determine the cost in diesel fuel (and hence fuel-cost). To calculate likely fuel costs, the diesel-
estimation method described above was run on both the actual power profile of the diesel generators
for the analysis period, and on the same data with any PV lost due to curtailment spread equally
across all diesel generators currently running.
The above diesel-split calculation, combined with the fuel-estimation method described previously,
was run over the curtailed-PV dataset to determine the additional fuel that would be consumed by pre-
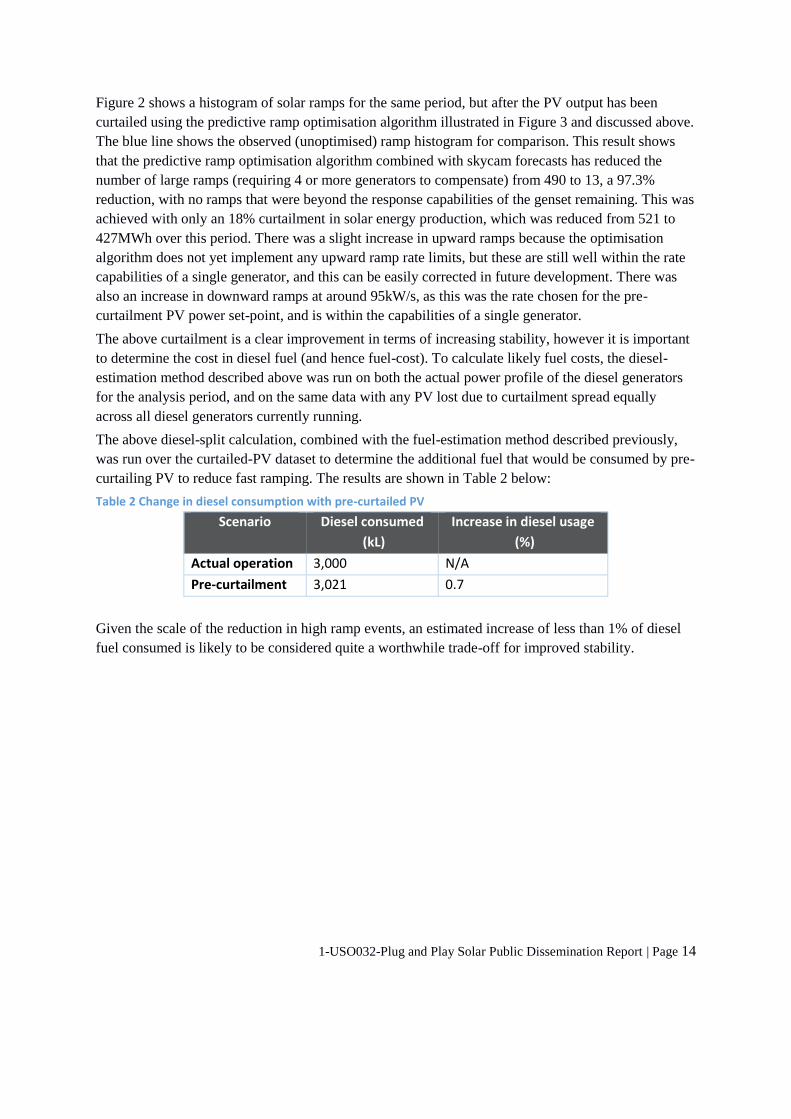
curtailing PV to reduce fast ramping. The results are shown in Table 2 below:
Table 2 Change in diesel consumption with pre-curtailed PV
Scenario Diesel consumed
(kL)
Increase in diesel usage
(%)
Actual operation 3,000 N/A
Pre-curtailment 3,021 0.7
Given the scale of the reduction in high ramp events, an estimated increase of less than 1% of diesel
fuel consumed is likely to be considered quite a worthwhile trade-off for improved stability.
1-USO032-Plug and Play Solar Public Dissemination Report | Page 15
Lessons Learnt
Lessons Learnt Report
Impact of Battery Sizing on System Operation
Knowledge: Technology
Technology: PV/Battery Systems
The Energy Made Clean site in Port Hedland has a 77kWh battery. During the planning process for
the site, various energy components were analysed to optimise the size of the generator, PV modules
and the battery system. With the benefit of the data we collected it is worthwhile validating these
decisions against the dataset to determine whether a different sized system may be more beneficial for
the site. In particular the battery system is a key component to maximising use of solar generation, but
is also a very substantial capital cost.
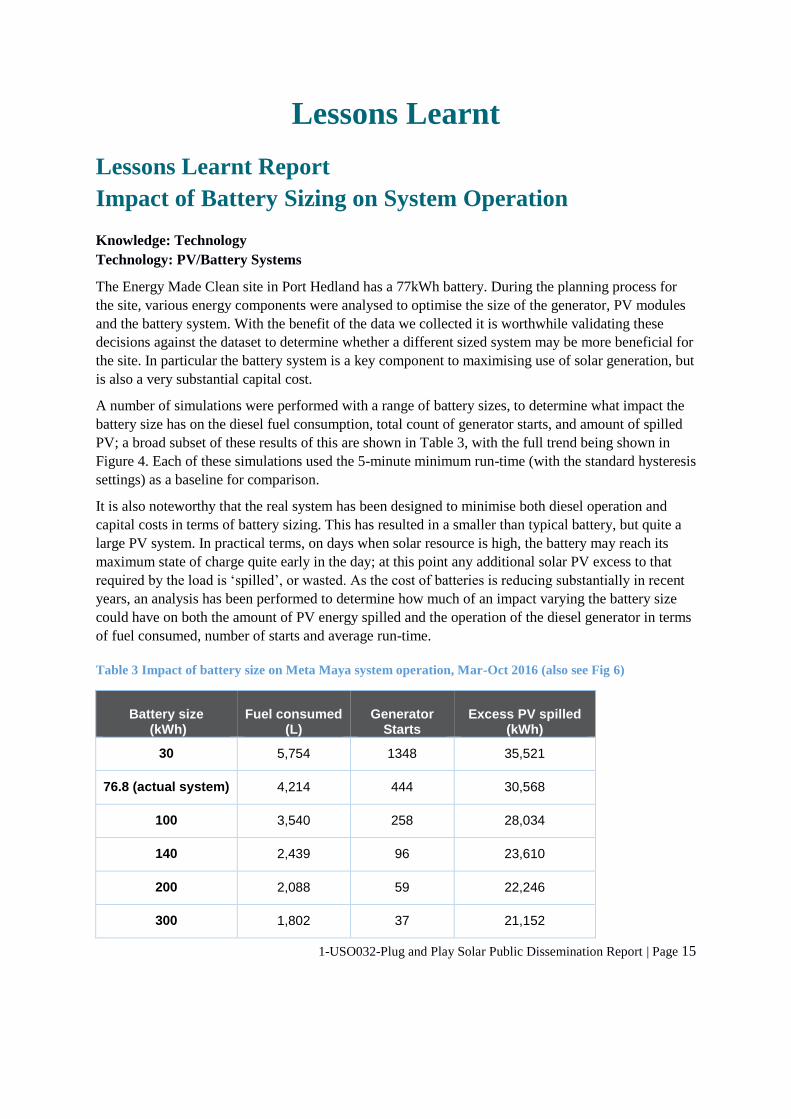
A number of simulations were performed with a range of battery sizes, to determine what impact the
battery size has on the diesel fuel consumption, total count of generator starts, and amount of spilled
PV; a broad subset of these results of this are shown in Table 3, with the full trend being shown in
Figure 4. Each of these simulations used the 5-minute minimum run-time (with the standard hysteresis
settings) as a baseline for comparison.
It is also noteworthy that the real system has been designed to minimise both diesel operation and
capital costs in terms of battery sizing. This has resulted in a smaller than typical battery, but quite a
large PV system. In practical terms, on days when solar resource is high, the battery may reach its
maximum state of charge quite early in the day; at this point any additional solar PV excess to that
required by the load is ‘spilled’, or wasted. As the cost of batteries is reducing substantially in recent
years, an analysis has been performed to determine how much of an impact varying the battery size
could have on both the amount of PV energy spilled and the operation of the diesel generator in terms
of fuel consumed, number of starts and average run-time.
Table 3 Impact of battery size on Meta Maya system operation, Mar-Oct 2016 (also see Fig 6)
Battery size
(kWh)
Fuel consumed
(L)
Generator
Starts
Excess PV spilled
(kWh)
30 5,754 1348 35,521
76.8 (actual system) 4,214 444 30,568
100 3,540 258 28,034
140 2,439 96 23,610
200 2,088 59 22,246
300 1,802 37 21,152
1-USO032-Plug and Play Solar Public Dissemination Report | Page 16
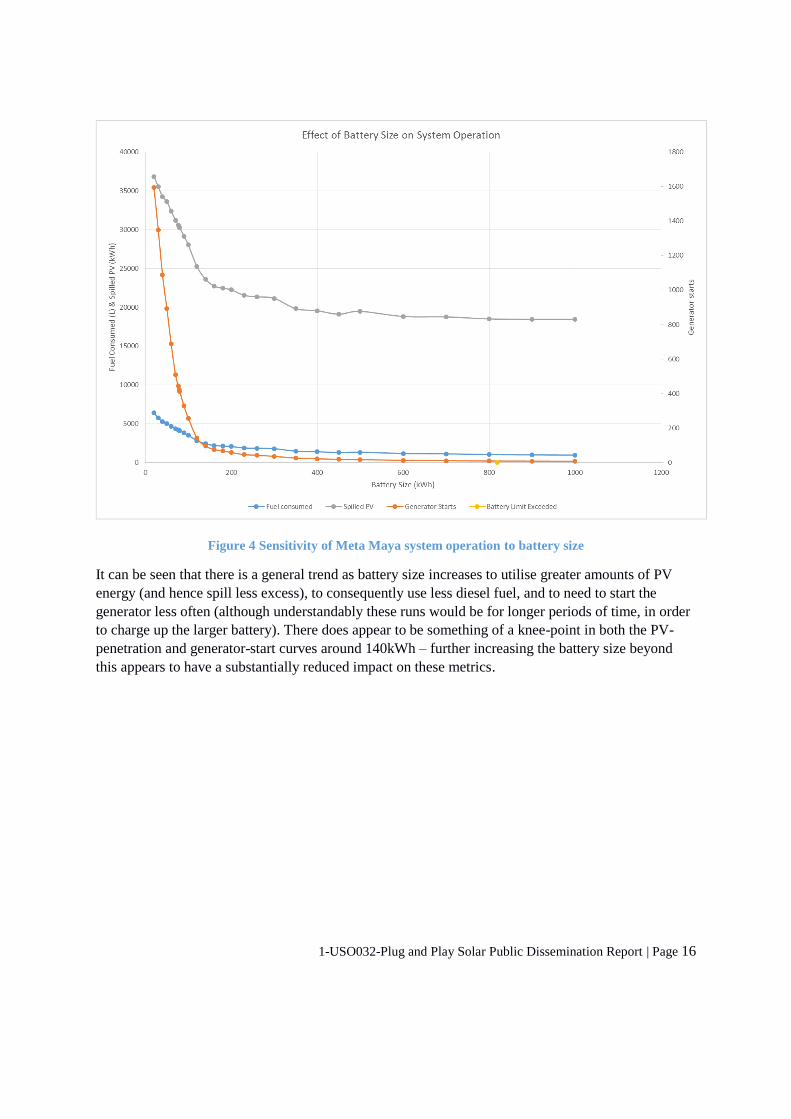
Figure 4 Sensitivity of Meta Maya system operation to battery size
It can be seen that there is a general trend as battery size increases to utilise greater amounts of PV
energy (and hence spill less excess), to consequently use less diesel fuel, and to need to start the
generator less often (although understandably these runs would be for longer periods of time, in order
to charge up the larger battery). There does appear to be something of a knee-point in both the PV-
penetration and generator-start curves around 140kWh – further increasing the battery size beyond
this appears to have a substantially reduced impact on these metrics.