Embed Size (px)
Citation preview
1
Using PPG Morphology to Detect Blood Sequestration
Stephen Linder Suzanne WendelkenSusan McGrath
2
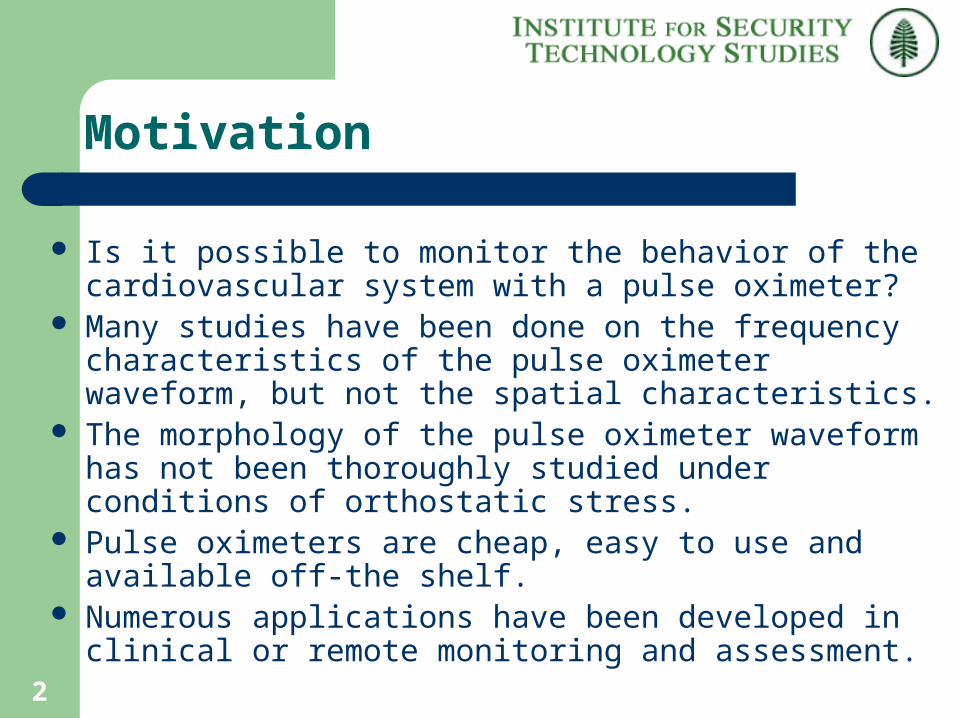
Motivation
Is it possible to monitor the behavior of the cardiovascular system with a pulse oximeter?
Many studies have been done on the frequency characteristics of the pulse oximeter waveform, but not the spatial characteristics.
The morphology of the pulse oximeter waveform has not been thoroughly studied under conditions of orthostatic stress.
Pulse oximeters are cheap, easy to use and available off-the shelf.
Numerous applications have been developed in clinical or remote monitoring and assessment.

3
Background
The photoplethysmogram (PPG) measures the temporal variation in blood volume of peripheral tissue, and thus blood flow
Used to detect Apnea and possibly airway obstructions
PPG has been used in mechanically ventilated patients to Ascertain breathing status from the Respiratory Sinus
Arrhythmia Blood Volume

4
Methods
Sensor: 3 FDA approved Nonin® pulse oximeters - Ear, finger, forehead
Supine-Standing experiment We monitored 11 healthy subjects
4 women, 7 men, ages 20-43 3 trials each
One minute lying down followed by one minute standing up. Repeat.
Grad student Beth Knorr with the Nonin pulse oximeter probes

5
Methodology
Data segmented by feature extractor
Pulses characterized by features: Instantaneous Hear Rate Pulse Height Normalized Peak Width
Wilcoxon Rank Sum test for equal means to detect changes in features real-time
105
80
85
90
95
100
110
115
120
125
592 592.5 593 592 592.5 593
Time (sec)
PP
G
Pulse Height (PH)
Peak Threshold (PT)
Cardiac Period (CP)
Peak Width (PW)
Normalized Peak Width (NPW) is the ratio of PW to CP.

6
Results
Significant changes were found during standing for the following parameters: Heart rate Normalized Pulse Width Pulse Height from the ear probe Full Width Half max

7
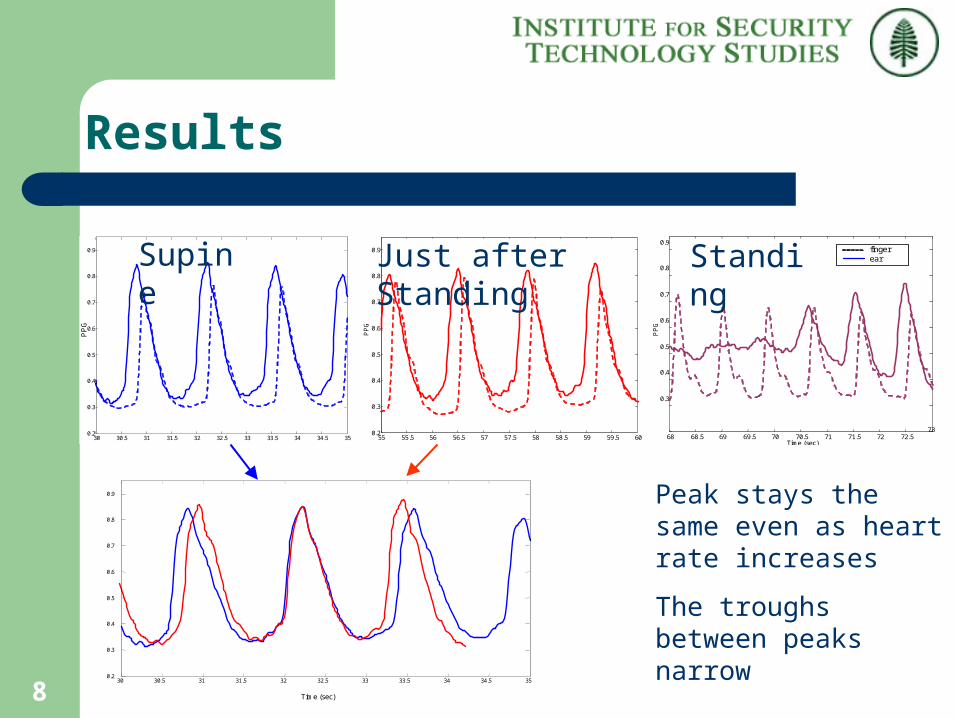
Results
Pulse amplitude decreases significantly for the ear probe, but not as much for the finger probe
Interesting differences in the pulse envelope
0 20 40 60 80 100 120
3.2
3.3
3.4
3.5 x 10 4 finger
0 20 40 60 80 100 120 3.22
3.26
3.3
3.34 x 10 4 ear
Time (sec)
8
Results
30 30.5 31 31.5 32 32.5 33 33.5 34 34.5 35 0.2
0.3
0.4
0.5
0.6
0.7
0.8
0.9
PP
G
55 55.5 56 56.5 57 57.5 58 58.5 59 59.5 60 0.2
0.3
0.4
0.5
0.6
0.7
0.8
0.9
PP
G
finger ear
0.3 0.4 0.5 0.6 0.7 0.8 0.9
68 68.5 69 69.5 70 70.5 71 71.5 72 72.5 Time (sec)
PP
G
73
30 30.5 31 31.5 32 32.5 33 33.5 34 34.5 35 0.2
0.3
0.4
0.5
0.6
0.7
0.8
0.9
Time (sec)
Peak stays the same even as heart rate increases
The troughs between peaks narrow
Supine Just after Standing Standing
9
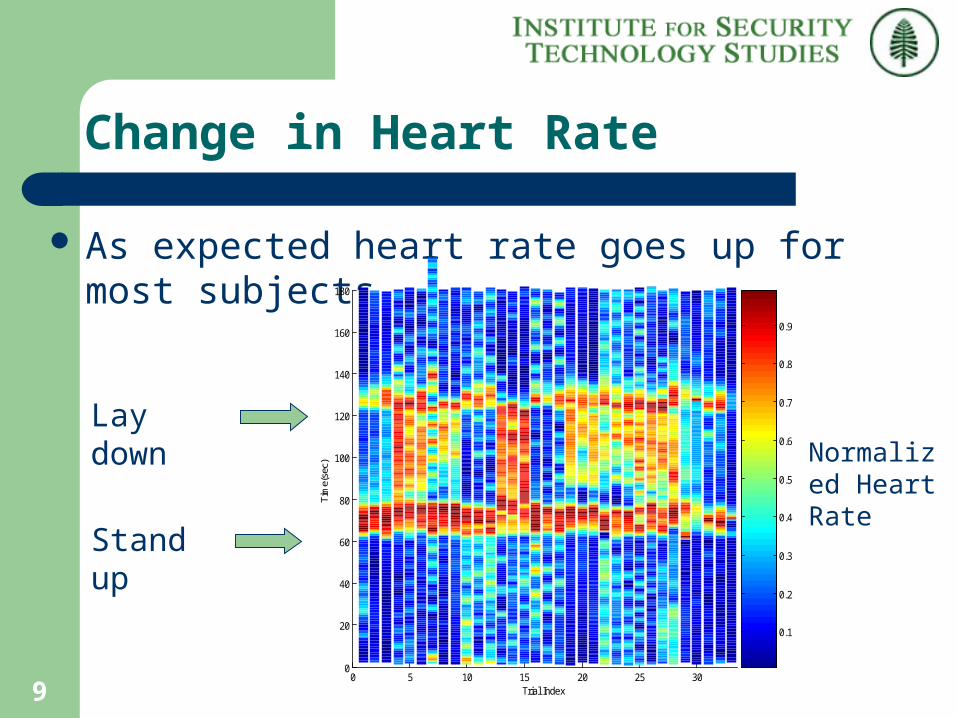
Change in Heart Rate
As expected heart rate goes up for most subjects
0 5 10 15 20 25 300
20
40
60
80
100
120
140
160
180
Trial Index
Tim
e(se
c)
0.1
0.2
0.3
0.4
0.5
0.6
0.7
0.8
0.9
Stand up
Lay downNormalized Heart Rate

10
Change in PPG Amplitude
Ear PPG amplitude pinches
Stand up
Lay downNormalized Ear PPG Amplitude
0 5 10 15 20 25 300
20
40
60
80
100
120
140
160
180
Trial Index
Tim
e(s
ec)
0
0.1
0.2
0.3
0.4
0.5
0.6
0.7
0.8
0.9
1

11
Change in Normalized Pulse Width
Pulse become a large percentage of cardiac cycle
Stand up
Lay downNormalized Pulse Width
0 5 10 15 20 25 300
20
40
60
80
100
120
140
160
180
Trial Index
Tim
e(se
c)
0
0.1
0.2
0.3
0.4
0.5
0.6
0.7
0.8
0.9
1
12
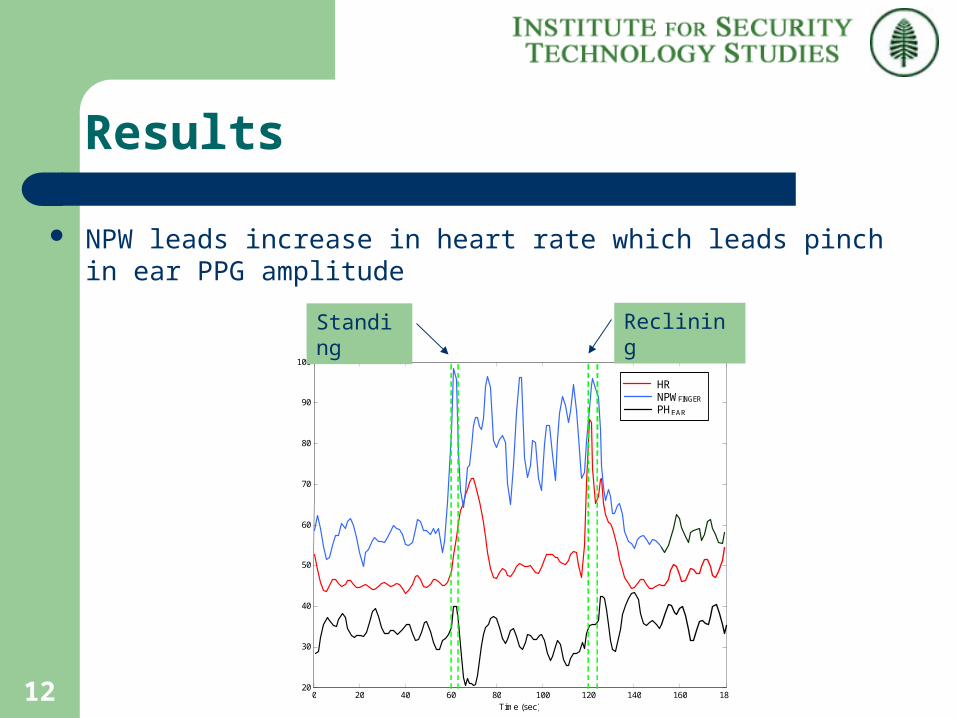
Results
NPW leads increase in heart rate which leads pinch in ear PPG amplitude
0 20 40 60 80 100 120 140 160 180 20
30
40
50
60
70
80
90
100
Time (sec)
HR NPWFINGER PHEAR
Standing Reclining
13
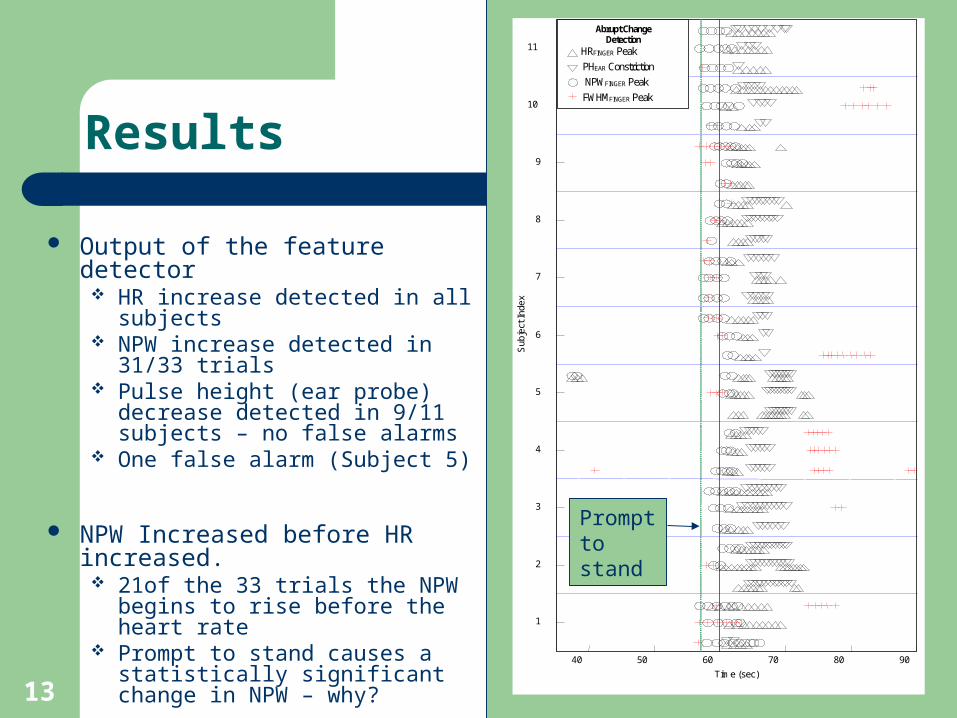
Results
Output of the feature detector HR increase detected in all
subjects NPW increase detected in 31/33
trials Pulse height (ear probe)
decrease detected in 9/11 subjects – no false alarms
One false alarm (Subject 5)
NPW Increased before HR increased. 21of the 33 trials the NPW begins
to rise before the heart rate Prompt to stand causes a
statistically significant change in NPW – why?
40 50 60 70 80 90
1
2
3
4
5
6
7
8
9
10
11
Time (sec)
Sub
ject
Ind
ex
Abrupt Change Detection
HRFINGER Peak PHEAR Constriction NPWFINGER Peak FWHMFINGER Peak
Prompt to stand
14
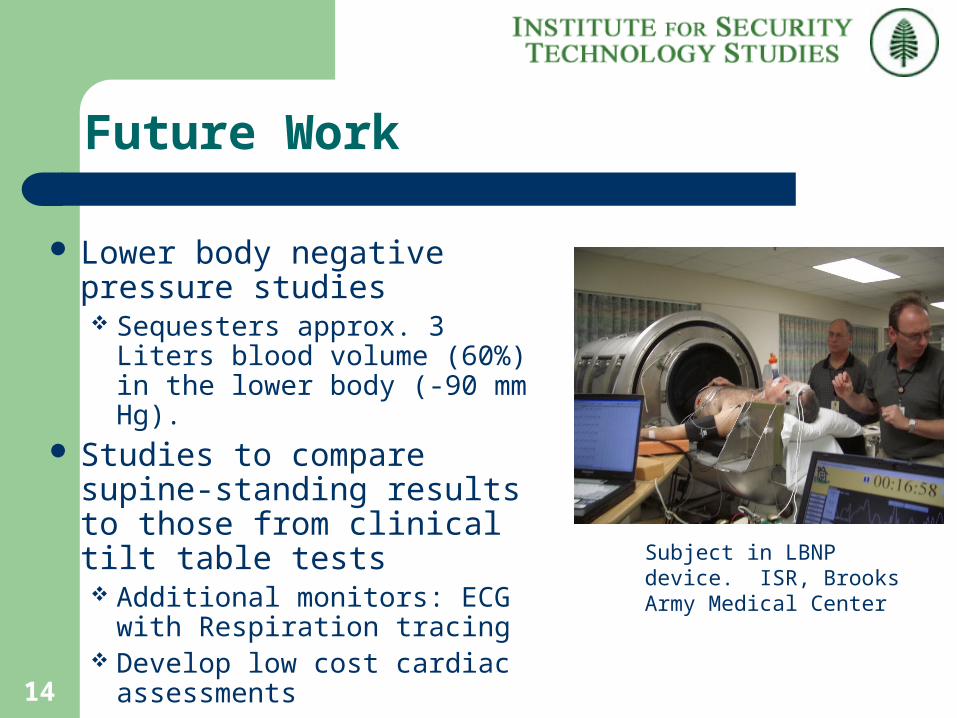
Future Work
Lower body negative pressure studies Sequesters approx. 3 Liters
blood volume (60%) in the lower body (-90 mm Hg).
Studies to compare supine-standing results to those from clinical tilt table tests Additional monitors: ECG with
Respiration tracing Develop low cost cardiac
assessments
Subject in LBNP device. ISR, Brooks Army Medical Center

15
Acknowledgements
Thanks to Dr. Kirk Shelly for his valuable input All the volunteers who stood up for us so many times
Collaboration? Contact: [email protected]
DisclaimerThis project was supported under Award No. 2000-DT-CX-K001 from the Office for Domestic Preparedness, U.S. Department of Homeland Security. Points of view in this document are those of the author(s) and do not necessarily represent the official position of the U.S. Department of Homeland Security.

16
Pulse Oximetry OverviewPulse Oximetry Overview
Uses the different light absorption properties of HbO2 and Hb to measure heart rate, oxygen saturation (SpO2) and pleth waveform
Two LED’s of different wavelength Red 660 nm Infrared 940 nm
HbO2 absorbs less red and more infrared than HB.
Hb absorbs less infrared and more red than HbO2.
Two equations, two unknowns… we can solve for SpO2
HbHbO
HbOp CC
COS
2
2
2
Extinction Curve
0.00E+00
2.00E-04
4.00E-04
6.00E-04
8.00E-04
1.00E-03
600 700 800 900 1000 1100
Wavelength (nm)
Absorp
tion
A(Hb)
A(HbO)
The pleth waveform consist of the IR tracing.
Indirect measurement of blood volume under the sensor