Embed Size (px)
Citation preview

'l ·,
..__ .~
-·'- "
-, /' ,,,:
, 12:,48-14,;85.T
'1-1,' - -- . \ ,'' I , :,,',
' ' - '._- -: - ' - ' -·: ;--._· .. ·_' .. ·_ '-:_,_. ... . , , I . . , . - - .
FIF'.l:H · /lmllJAL REPORT . · · CROP Y,EAR.
1954
·-.-.,
10,02-io , .... · J.1~96 T ...
':-·.·.··1 -· ,: __ --.:; -- ' i,
, , , , 1 · j
\
", . '\ ·.:
''" ,•,
""·
'•- . . - . .,.-- '
. ' /.
. ~ '
'. '·' ' . '\'
./
·. ,·
' ·-·- --.·- -- .
'i .33.;. •, . ,., 3~62 ·T ..
;B '.: , : · ars•, = LinO:~
Tons per aero produced .in ·orchards Cqst. p'!'lr ton in' these b_rcihdrds
iilcl,udcd in hi.s stuqy, _,_,
\,
,!·,: ,
. ,
'::i '- \ -s-.:
!'
. ,.-_,,.
'!'•'
-.. /,
. ,,: . - ~··
'- - . '
S~d~ Conducted by Univeh:-si tj- of' 'call.fornia .
Agricul tUral Ex;tension Se hci.:10 · . 1• • , ,' ' , I, -. ., . ,1
., ' 1In Cqop(,>ra ti on with . ' .. · . Soli:r.ho County Peach' Grow'ers
·- ' ' ' ... '.• ' ' -
: /
-.:, ..
. ;-.,.,
'-,, .. j_
. >-; - ,_,
. . Issued by .\ . . University of Caiiforliia , · .. · .
ict;riGultural Tui:tonsioh. Se:r:visio · · · \Jounty Li bi-ary ~uilding. .' ·
........ '.·. FC\irfield~ Ci1;lifornia ; ._ ' '-.
·. \ ~.
"

Pages
Introduction 1"2
Definition of Terms 3
Table 1- General Summary of Costs) Income nnd EatLihgs Per Acre - Individual Orchards 4
Table .2- Costs, Returns and Earnings pe~ ftesh ton ri
Individual Orchards 5
Table 3- Cultural Cos ts per acre "" Individual Ore hards 6
labie 4- Cash Overhead and Depreciation Costs per acre -Indj vi dual Orchards 7
Table 5- Investment per Acre ·- Individual Orchards 8
Tnble 6- Drying Costs per Fresh Ton - Indi vidue.l Orchcr.0cs 9
Table 7- Gonaral Summary of Costs, Income and Earnings Per Acre - 4-Year Averages 1951-1954 10
Table 8- Costs, Returns and Earnings per fresh ton -4-Year Averages 1951-1954 11
Table 9- Cultural Costs per acre - 4-Year Averases -1~51-1954 12
Table 10- Cash Overhead and Depreciation Costs per acre -4-Year Averages 1951-1954 13
Table 11·· Investment per Acre - 4-Year Avera~es 1951-1954 14
Tu. to. Camp ilo d by B. B. Burlingame Extension Economist Fnrm Me.nagoment
Supervised by V, w. De Tar Farm .ddvi so r
Solano County

INTRODUCTION
The purpose of this study has been to learn the management practices which will enable Solano County Freestone peach growers to reduce their costs and improve their management income. In addition, the study should furnish t-he l'>cnl in<lutitry with some infarmn ti on regarding current production costs•
This report presents the results of the fifth and final year of this study. In addition, it includes a £our year summary for each of the 10 orchards >'lhich have cooperated in the study for the last four years•
The study has been based on monthly reports of labor costs made by the cooperators. These, combined with a record of expenses and income, and a final inventory, furnish the material from which each individual record is computed. These records are then averaged, and this average serves as a standard with which each individual grower may compare his yields, costs and returns. This furnishes a good opportunity to learn which management practices are most efficient.
The 1954 year was profitable year for most of the peach growers in this study. The management income varied however, from ~7.87 per acre up to ~~400.97 per acre. This emphasizes the importance of studying the methods which will result in a satisfactory management income.
The Farm Advisor has found this study a very effective means of determining changes in management practices which will enable the individual cooperators to reduce their costs and improve their management income. It is more difficult to draw general conclusions regarding the management practices which, if generally adopted, would reduce the costs and improve the management income of all orchards. However, the following conclusions have been reached: --
High yield per acre usually results in low cost per ton. During the past 4 years, 47 grower accounts have been included in this study. Eight of these accounts showed an average production of over 15 tons per acre, four an average af·12 to 14.85 tons per acre, nine an average of 10 _to ll.96 tons per acre, nine an -average of 9 to 9.91 tons per acre, ten an average of
----8 to8~97 ton.S per acre, two an average of6 to 7.72 toris per acre, three ari a:verage of 4 to 4.98 tons per acre. The bar graph on the front page of this report shows a bar for each of these group accounts, representing the average production for the group, and a line indicating the average cost of production per ton for the group. Without exception, the bar graph shows that when production per acre increased, cost per ton was lOW"er. Most growers, therefore, should find it profitable to carry on these cultural operations which will result in a higher yield per acre.
It is profitable to produce a quality of fruit which the buyer will buy readily at going prices. Most growers in this study believe that the cannery market is more profitable than the dried fruit market. The 5 most profitable orchards sold an average of 65.J.i% of their crop to the cannery, while the 5 least profitable orchards sold only 60,J.i% of their crop to. the cannery. This indicates that in the more profitable orchards, 11 larger part of the crop was of cannery grade.
- 1 ~

Efficient production methods must be used in order to earn a management income above the average. 'The average total cultural costs for labor and materials in the 5 most profitable orchards w~s $9.6~ per ton. In the 5 least profitable o~chards these costs were $14•44 per ton.
Effective use must be made of the fruit which does not meet cannery gradeo In the 5 most profitable orchards, an average income of $1.µ.50 was secured for each fresh ton of peaches dried. In the 5 least profitable,
. this average was only $37 .50, This difference appears to be due to a lower drying ratio: and a lower drying cost per fresh ton. The average price received per dried pound was also slightly higher for the 5 most profitable orchards, indicating ·that a good quality dried peach was produced.
The cooperation of progressive peach growers in Solano County made it possible to conduct this study. We very much appreciate their assistance.
We would like to point out that average costs and return figures presented in this report are net intended to be representative of county averages, since those who participated were better than average producers, and only a small percentage of Solano County peach growers took part in the study.
•
- 2 -

DEFINITION OF TERYS Peach Management Study
COSTS
CULTURAL LABOR ·COSTS are composed of the cost of hired labor and the value of the operator's actual labor at the going wage rates, and th.e value or cost of tractor and truck work for all orchard operations prior to· harvesting. Tractor and truck work, termed field power, are charged at hourly rates figured to cover the overhead, maintenance and operating costs. ·
CULTURAL MATERIAL COSTS are for pumping power, fertilizer, spray material and other materials used in producing the crop.
HARVESTING includes picking and hauling labpr. This c.lso includes field power equipment cos ts of tractors and trucks,
CASH OVER'lEAD COSTS include all cash costs not listed under labor and material cos ts• 'l:ney cover ~taxes, machinery repairs (other than tractors and trucks,) compensation insurance and general expense. The gene!'al expense item is cor.:puted at 5 percent of the total labor and material costs and covers 1d.scellaneous unreported costs such as interest on operating capital, use of family car in conjunction with the enterprise and office expenses,
TOTJ,L CASH AND IJ,BOR COSTS are a sum o:f all labor, materir.l and cash overhead costs as indicated above.
DEPRECIATION is that part of the original cost of trees, improvements and equipmen·b which is charged to each year of operation in order to absorb the cost of such facilities during their period of usefulness.
_INTEREST on investment is :figured at 5 percent of the average values (t> of original costS}'Cif trees, improvements and equip~ent. The land values used in calculating interest on investment charge were conservative and belcw current market values.
TOTAL COST includes all of the above costs.
INCOME
TOTAL IlTCOME PER ACRE OR iLVEFJ,GE NET RETURNS PER TOlJ rei'lects the returns for t!-uo naked fruit at the first delivery point after the deduction of marketing expenditures, Costs of drying were deducted from returns for the dried fruit in order to s how a comparable net income to the fruit which was sold fresh.
MANAGEMENT INCOME is the amount by which total income exceeds totc.l cos ts; as indicated above. It represents the operator's income for mruiagement after he has already paid himself wages for his v·ork and interest on invested capi:Oal at 5 percent. When total income f'ails to cover total costs, a loss occurs which is indicated by a minus sign (-) •
- 3 -
I
TABLE l - GENERAL SUMMARY QF COSTS, INCOME JIND EARNINGS PER ACRE - INDIVIDUAL ORC!iAROO "' 1954
--- pcvorago I Record luge I Numbe.r of trees
1
7 18 11 2/.i. 12 31 3 21 4 23
17 26 16 17 9 21 2 13 5 18
Yield tons por acre 15.64 16.93 9.41
10.99 8.22
8.97 8.83 9.32 9.60 8.89
Average net return ~r ton
56.35 52,34 55.85 45.48 49,90
1.i3.66 51.52 /.i6.69 48.12 44.04
Costs er Acre Total ~anageme: ·1 Cult- I' Har- I Mat- Cash Total Dopreo- Interest Total income income ural vest erial over- co.sh & iation on per er acre labor , labor head labor 112.77 232,42 31.68 36.24 413.11 l/.i6.28 199.06 /.i0.66 36.18 422.18 93.72 99.88 27.61 24.17 245.38
119.42 120.54 25.J.i6 27.78 293.20 61.45 81.83 26.97 28.38 198.63
49.93 102.12 101.05 138.58 l/.i.2.08
95.50 36.26 126.74 20.17 l/.i6.55 31.32 143.36 53.27
89.14 40.73
20.89 28.65 28.87 31.37 30.04
202.,58 277.68 307.79 366.58 301.99
36.34 54.59 28,83 33.80 44.37
32.81 45.44 39.27 41.18 47.32
Invest. 31.97 39.70 30.19 23.50 32.81
26.29. 33.44 31.79 41.71 34.32
acre 481.42 881.49 516.47 886,15 304.J.io 525 • 77 350.50 499.93 275.81 410.31
261.68 391. 71 356;,56 454. 71 378,85 435.17 449,47 /.i61.97 383.63 391.50
I.ioo.07 369.68 221.37 149•43 134 .. 50
130.03 98.15 56.32 12.50 7.87
I . Av. l.9?4 --21___ 10.10 9,77 ""AV;-1953 20 9.07 9.31
--
S-Y'Oa%'Av,I 19 9.44 I 51.93 88.27 I no. 73 I 22.33 I 25 .35 I 21jb.6a 1 39.68 30,0'7 317.03 1420.26 I 173.23
A Wide variation in yield, total costs per acre, and total income per acre, is shown by the above summary. Orchard No. 11, had the highest yield per acre, for the fourth consecutive year, Orchard No. 7, however, had the largost management income per acre for the second con,seoutive year, due to higher returns per ton, and 10\'lor costs per acre.
The 1954 year wus more profituble on the ~verage for these growers, than either th.a 1952 or 1953 year, but less profitable than the five year average, The increased management income was due to higher average yield per acre, o.nd slightly higher average return per ton. The :avorage costs per acre were higher than any of the other four years in this study,
Records are arranged in tables l to 5 inclusive, in decreasing management income per acre, as shOl'ln in the extreme right column above. - 4 -
'.i:ABLE 2 - COSTS, RETURNS AllD EARNINGS PJ;;R JiR:&:SH TON - INDIVIDUAL ORCHARIB - 1954
1 -- Tot l 1--,- Per cent of fruit Av. net return per fresh ton Picking Hauling Total-- -Depree" Total Mgt,
I Record yield Sole. Fresh costs costs cash & and Costs income Number tons to can- Sales ]} Dried* c.annery Fresh ,
/ Fruit* All per per labor int. per per
\ er A,_ n.Gry fruit fruit :l:L Dried Fruit ton** ton costs costs ton ton -1
' 7 15064 f 3:~04 - 68,6 50.03 - 59.24 56.35 12.92 1,93 26.41 4,36 30.77 25.58 I 11 16093 I 64.5 - 35 .5 49.90 - 56, 77 52.34 8,63 3,13 24,94 5 .56 30•50 2lo84 12 9o41 51,8 17,3 30.9 50ol6 117,74 30074 55,85 9.12 1049 26,07 6.27 32,34 23,51
3 10.99 41.6 - 58.4 50.00 - 42.27 45.48 9.10 1.87 26.68 5.21 31.89 i3.59 4 8,22 70,2 - 29.8 48.90 - 52.24 49.90 7.74 2.21 24.15 9.39 33.54 16.36
17 16 9 2
5
8.97 8.83 9.32 9.60 8,89
100.0 58ol 77.1 93.7 54.6
loO
.3
40.9 22.9 6.3
45.1
43.66 - - 43.661 8.86 1.78 22.58 50.00 79,30 53.01 51.52 12.16 2.20 31.46 50.00 - 35.55 46,69113.19 2.54 . 33.03 50.00 - 19.94 48.12 12.08 2.86 38.18 51.50 ao.oo 34.76 44.04, 8.89 1.14 33 .• 97
6.59 8.94 7.62 8.64 9,18
[A.Vj-l95h 110~1§,_J.?9 ci l.l 7 .14 Av. 19:.iJ 9,,c·; I 6<?. 5 .o 8013 v. 1952· 9:i1.;r1,r,0- 2o+ 7.11
f..v, 1951 9, :3 l':'3 l.l 7,17 - ------------- - -
29.17 40.40 40.65 46.821 43.15 .
14.49 11.12 6.04 1.30
.89
~v. 19:;0 i 8~5~ __ 72--;8 I Ool 127.1 I 60.60 I 77.69 148.401 57~31j 8.82 j 1.80 I 25.re I 7.72 133.21124.10 I
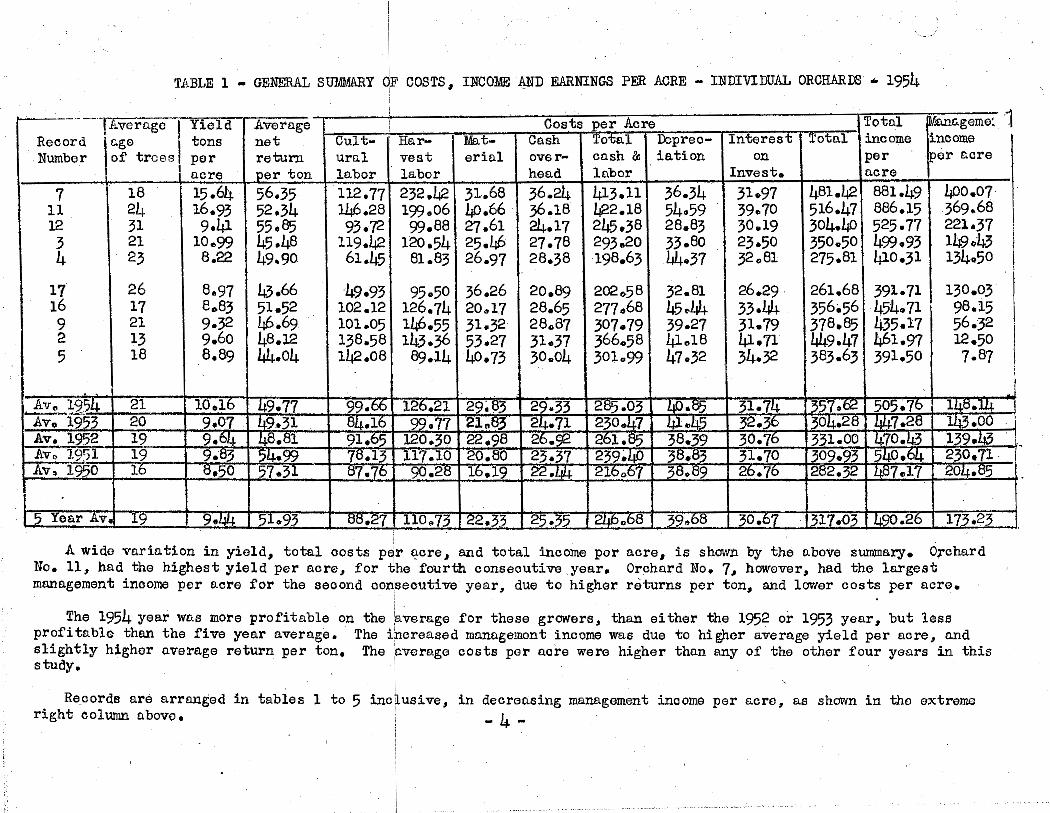
!)Year Av'-9;.ui--r63._7 j 1.9 I 34.4 I 55.10 I 87.21 l· Mostly local r0tail sales with some to wholesale market. * Includes fruit sold for drying as well as that dried by the ** Average for all fruit harvested, including that picked from
sorting in a few cases,
l li4· 121 51.93 I 9.63 i2.05 26.1.? 7.45 133,58 I 18,35
grower, the ground for drying in some cases. Also, includes some
Average total costs per ton were higher 'in 1954 than in any of the four previous years, even though the average yield per acre was the·hir,hest for any year in this'. study. Thel'e was a wide variation in costs of individual growers, but with a few exceptions, growers who had the lowest ,cost per ton, also had the highest management income per ton.
The average price received for all fruit was slightly higher than last year, but was below the 5 year average. Prices received from canners by individual growers d.id not show much variation, but net returns per fresh ton for fruit dried varied from $19.94 to $59.24.
- 5 -
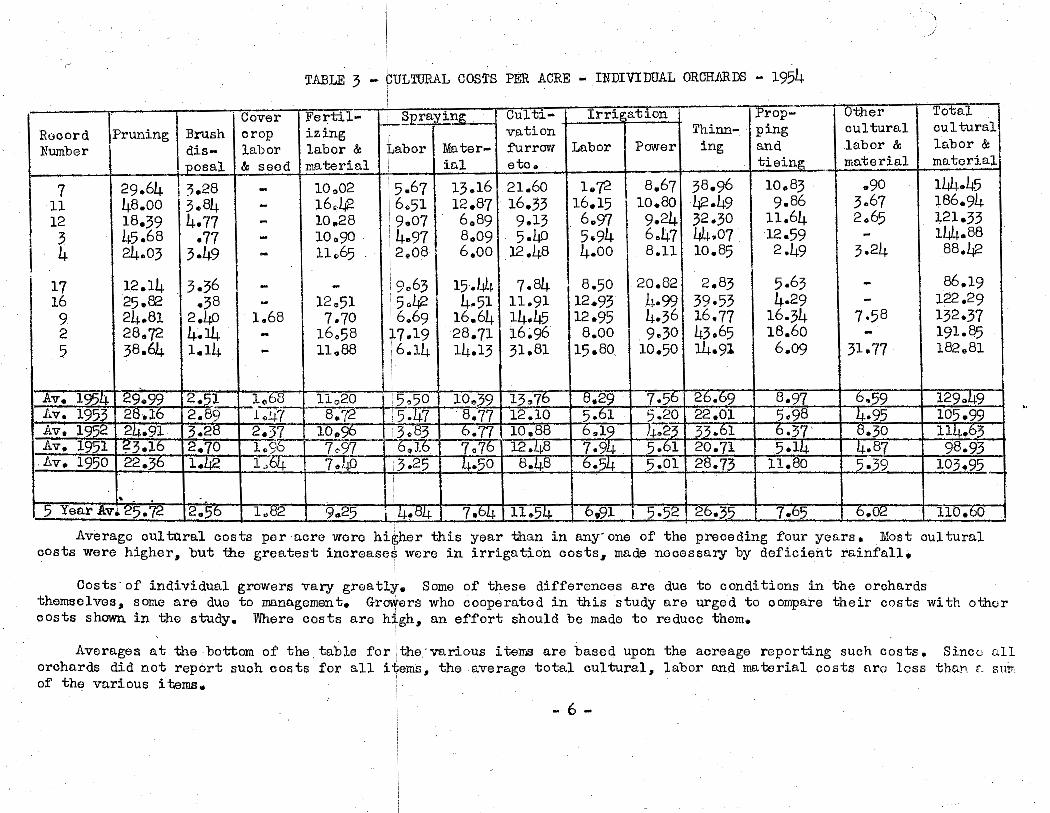
TABLE 3 - CULTURAL COSTS PER ACRE - INDIVIDUAL ORCHARilS - 1954
Record NumbGr
I I · Cover Pruning Brush crop
I dis- labor
Fertilizing labor & material __ )_.E._osal & seed
-1 29.64 I ').28 7
11 12 3 4
48.oo 3.84 18.39 4.77 45.68 .77 24.03 3.49
i 17 12.14 16 25.82 9 24.81 2 28.72 5 38.64
'3.36 .38
2.40 4.14 1.14
10.02 16,./.i2 10.28 10.90 11.65
- I 12.51 1.68 I 7. 10
- 16,58 - 11.88
·--~lllg Labor
i 5.67 6.51 9.07 4.97 2.08
9.63 - /.i2 ~:69 I
~ 7.191 6.14
'
Material
13.16 12.87 6.89 8,09 6.oo
15.44 4.51
16.64 28.71 14.13
~-- _J_____ _ _l. I I
CUJ.trvation furrow eto.
21.60 16.33 9.13 5.40
12.48
7.84 11.91 14.45 16;96 31.81
Im~at-ioii -l
Labor
1.72 16.15 6.97 5.94 4.00
8.50 12.93 12.95
8.00 15.80,
Power
8.67
110.80 9.24 6.47 8.11
20.82 4.99 4.36 9.30
10.50
Thinning
38.96 42.49 32.30 44.07 10.85
2.83 39.53 16.77 43.65 14.91
[Propping and tiei~
10.83 9.86
11.64 12.59 2.49
5.63 4.29
16.34 18.60 6.09
otner cultural labor & material
.90 3.67 2.65
3.24
7.58
31.77
Tat al cultural labor & matoriali
lWJ.45 186.94 121.33 144.88
88.42
86.19 122.29 132.37 I 191.85 182.81
I Av. 1950122.jo fl-;42 I 1,64 I 7.40 1.3.25 I -4.50 I 8.48 I 6.54 j 5.011 28.73 j 11.80 I 5.39 I 103.95
' 110.60 5 YearAv•25.72 12.76-
_j_ l.s2 r 9.25 - 1_11-..__8ti.J -7.64-111.54 - 1 6,91 i 5.521 26.35 7-;c7 -a.oz
Average cultural costs por aero wore higher this year than in any· one of the preceding four years. Most cultural costs were higher, but tho greatest increases were in irrigation costs, made necessary by deficient rainfall.
Costs-of individual growers vary greatly. Some of these differences are due to conditions in the orchards themselves, some are due to management. Growers who cooperated in this study are urged to compare their costs with other costs shown in the study. Where costs are high, an effort should be made to reduce them.
Averages at the bottom of the. table for the-various i tams are based upon the acreage reporting such costs. Since [•ll orchards did not report such costs for all items, the average total cultural, labor and material costs aro less thc.n r .. s1ur of the various items.
- 6 -

TJ,BLE 4 - CASH OVERHEJ.D J,ND DEI;RECIJ,TION COSTS PER ACRE - INDIVIDUJ,1 ORCRiillDS - 1954
Cash overhead costs per acre ~reciation costs...J2_0r acre Record GenoraT I County Ropairs Comp Total II Trees I ~ild- Irrig- Tillage Spray Props Other Total Number Expanse te.xes except insur- : i.ngs at ion equip- equip- etc. equip- ex. field
field pr ance - ..l S][_stem ment ment ment ..E_ower
7 18.84 I 8.51 1.25 7.58 36.24 20.00 l 2.91 4.36 .58 4.70 .67 3.12 36.34 ll 19.30 ' 9.03 l.67 6.18 36.18 20.00 3.64 11.98 2.59 l0.51 3.70 2.17 54.59 12 ll.06 7.99 1.22 3.90 24.17 20.00 .98 4.45 .47 - . 1.05 1.88 28,83
3 13.27 7.10 1,18 6.23 27.78 20,00 3.53 2.75 .49 I l.26 2-.94 2.83 33.80 4 8.51 11.01 5.48 3,38 28.38 20.00 4.21 12.41 .94 2.70 1.02 3.09 44.37
i 17 9.09 7.99 1.90 l.91 20.89 6.46 1.55
! .$7 I .11 2.29 32.81 20.00 1.07
16 12.45 7.16 3.33 5.71 28,65 20.00 3.53 1.91 .89 1.28 . 3.20 14.63 45.44 9 13.94 8.30 1.12 5.51 28.87 20.00 4,84 5.04 .84 2.22 ,96 5.37 39.27 2 16.76 7.14 l.50 5.97 31.37 20.00 1.34 2.35 .45 1.67 1.67 13.70 41.18 5 13.60 9.41 2.84 4.19 30.04 20.00 3.55 14.17 5.36 1.97 - 2.27 47.32
Av. i]5li 12.79 8.77 2.70 5.07 29.33 -'- 20.00 3~) 7.07 l.15 2.71 1 •. 72 4.87 J±Q_.85 i>Vo 1953 10.29 7.73 2.86 3.83 ~71 20.00 3.46 ~.85 .93 3.00 l.!0 5.97 ~ J.v. 1952 11.75 7._65 1.96 5.~ ~92 20.00 3.3..2_ ~.32 ~ 2&_8 1.~ 5 .1:Jtj 38.39 J,v, 1951 10.80 7~ .9J:!: 3.70 . 23.37 20.00 2.22 7.01 &2 l.oo 1.35 7.'52 3J!_.tl3 lcv. 1950 9.71 7.91 1.79 3 ·'22. 22 J:ILi.- 20.00 2.92 5.40 Q.7 l.~ 1.82 7.01 38.89
'
15 Yoar J,v • 11.07 7.99 2.Q§_ ~-S!±. ~-~ 20.00 3.11 . ___s_.53 -~ 2.~ 1.58. ~.25 39.68
Cash overhead costs as shown above inciude all cash costs not classified under labor and material costs. Interest -paid on mortaged indebtedness is not included as a cash cost since an interest on investment charge, as shown in Table 5, is included for all orchards in the study and would normally cover any interes.t paid on indebtedness, Interest paid on operating capital is covered by the general 'expense item which is explained on the pq~e 11 Defini tion of Terms" at the faro purt. of this report,
Depreciation on buildings and equipment varies considerably between orchards depending upon individual situations. The size of' the f'c.rn. unit on which such facilities are used is: an important factor influencing depreciation costs per aero. Depreciation on trees was figured the same for all orchards at $20 per acre. This is based upon. an original cost to bring trees to bearing age of $400 per aero ond o. ,productive life t~ereafter of 20 years. Depreciation of field power equipment is not included in the total depreciation cost in this table s;ince it is included in the hourly rate charged for the use of such equipment in the labor record.
f,veraf(eS o.t tho bottom of' the table for the various items' are orchr.crds did not report investment in all items, the avernge t.-to.l
based upon tho acreago reporting such costs, Since all d~reciation cost is less than a sum of the various items .•
7 -

\
TABLE 5 + INVESTMENT PER AdRE - INDIVIDUAL ORCHARDS - 1954
' Irriga- Tillage Spray Other Total ·Field Total Interest at Record Trees Build- ti on equip- equip- Props equip- Land except power invest- 5% ex,
in gs system ment ment etc. ment field equip- ment field power ment J;J_ower
7 · 200.00 I 5i.oo 47.60 6.30 21.50 5.00 7,95 300.00 639.35 56.50 695.85 31.97 11 200,00 33.39 101.87 19.0l 47.70 27.78 14.14 350.00 793.89 59.17 853.06 39.70 12 200.00 16.91 64.28 5.26 - 7.89 9,45 300.00 603.79 34.21 638.00 30.19 3 200.00 17.65 29.53 2.45 6.28 7.35 6.17 200.00 470.03 32.90 502.93 23.50 4 200.00 32.62 79.88 8.07 13.52 5.10 17.Q5 300.00 656.24 56,07 712.31 32.81
17 200.00 13.40 73.58 8.60 6,67 5.00 18"48 200.00 525.73 35.Li.0 561.13 26.29 16 200.00 14.19 12.43 5,76 12,84 32.00 91.47 300.00 668.69 59.25 727 ,94 33.44
9 200.00 34.57 59.38 5.16 8,20 4,82 23.~2 300.00 635.95 52.61 688,56 31.79 2 200.00 10,66 25.74 3 .12 7 .ll 12.50 75.02 500.00 834.15 26.13 860.28 41.71 5 200.00 35.48 96.50 28.71 14.81 - 10.85 300.00 686.35 41.62 727.97 34.32
•
Av, 1954 200.00 @;44 57 .'3b 7 ,ljlj 13,71 10.25 ~98 292.99 634.73 }!8.89 683~2 31.7[ Av, 1953 200.00 23,87 '2!±_.57 ~·~ lli"o 79 19~ 35.27 303.79 647.10 -l.iZ~ ::§_89 • 7.1±_ 32 .-2§_ Av, 1952 200.00 22.~ 50,7L 9_.lj) 13.82 8.82 40.07 21:Jo,3_(l_ 615.29 3~ _652.12 30.1§_ Av. 1951 200.00 17 '!!.:±9 59,bL ::§_. l7:i. 10~ 8,25 52,81 293.97 22!±_.07 27 !l:!P 661.47 31.70 Av. 1950 200.00 19.12 38,tll 3.78 7.19 ~.20 33 !3_8 224.82 535.15 21.97 547.12 2~.7§_
T 3~Yr. -y;v [200.00 ~2-,10 5_2_.35 9_.2:r . ll,99 9~20 ]_7.~ 280.39 _§}.3.27 35.55 6l.Jb. 82 30.bb
The investment figures shown in the ab9ve table are calculated at one-half of the original cost except for land values, Such values are maintained throughout the life of fa~ilities and equipment as a basis for calculating an equitable in.terest on investment charge aga~nst each year's c:tjop,
As pointed out in table 4, tree values were considered the same for all orchards with an original cost of $400 per acre. Average· tree values, thus, are shown at $200 per acre. The land values used in this study are conservative agricultural values for the purpose of calci,ilating a nominal interest on investment charge.
The above table should not be used as indicative of the amount of capital required to go into the peach growing business at the present time. Current values are considerably higher than those shown. Interest on investment in field power equipment is excluded from the interest charge shown above since this cost is included in the hourly rate charged for the use of this equipment in the labor record, ·
Averages at the bottom of the table for the various items• are based upon acreages reporting such items, - 8 -

,J
TABLE 6 - DRYING CO~TS PER FRESH TON ~ INDIVIDUAL ORCHARDS - 195.qt
! Total I Drying Costs per' fresh ton Per dried cwt. Record frosh ratfo Tray Cut- Shed Total Sulfur oth01.' Doproo~ Inter".' Total .l.v0. Dry-. Net Number tons ' to l wash, ting & yard labor & other cash iation est on cost price ing returns
dried store work material costs on ~t, invest, rec'd cost
7 128069 5,88 1,48 5o26 2.81 9,55 044 ,78 ,55 ,57 ll,89 20,93 3o50 17,43 4 89.31 5.19 .47 5.71 2.85 9.03 1.54 .78 1.92 ,80 14.07 i7.22 3.65 13.57 5 35.30 6,57 .54 6.28 3.59 10.41 1.18 .90 1.47 .71 14.67 16.23 4.s1 11.42 3 136.20 6.92 1.03 6,58 5.71 13.32 ,45 1.07 .89 .32 16.05 20.17 5.55 14.62
11 43.27 5.76 1.31 7,03 4,25 12.59 ,81 1.01 1,00 ,78 16.19 21.00 4.66 16.34 9 47,53 6,34 1,96 6.06 4,72 12.74 1.22 1,09 1061 1.10 17.76 16,89 5.63 llo26
16 54.21 5,85 1.58 G,58 6,30 14.46 ,60 1.17 1,59 .79 18.61 20.94 5.44 15.50 12 23,83· 6.86 3.33 5,82 6,07 15.22 ,55 .98 i.49 .60 18.84 17.00 6.46 io.54
l Ave, 1954 558 __ , __ ~?~ 1,26 1t>_,08 4,32 ll~f> .78 .95 l,18 ~bii. . 15.21 19,33 ]i_,62 iii.71 Ave, 1953 ~2 , __ <;>_.,·-·~ 2,07 5,99 5,00 13.~ ,97 1.09 1.27 ,73 11.12 18.12 1.£,Hl 13,31 l>ve, 1952 J±:)~I 5.~ lot5b ib_,51 5o3.:+ 13.71 ,132 l.2J±: 1~8 .92 18J.i.Q 18.93 5,30 13~ Ave. 1951 b48 ~.15 l,7Ji @_.35 5.11 13.20 .~ 1.03 l!§_O ,81 17,22 !§_.11 5,25 10.~ Ave. 1950 130 2:,15 2~?- 5:;±p 4~ 12.72 .31 .~ 1.94 .57 ~4tl 19,94 5.~ 14~
. . '
--
5 Year Avh 4,35 5.99 1 1.92 6,08 iJ±>tltl 12,tltl ,70 1.05 1.53 .73 ~.89..i.18~ 5,01 13.!J,tl, Detailed drying cost. data were obtained 'this year from 8 of: the lO growers in this study, In tho above table, records
have been arranged downward in order of incr"!asing total drying: costs per frosh ton, This is different from arrangements in preceding tablas. ·
Total drying costs for records in this s'tudy varied from $11 0 89 to $18,84 per fresh ton, Greatest differences occurred in shed and yard work, tray washing 'and storing, and C)ltting. The averag0 for all records shows total drying costs to be $1.91 per fresh ton less than in ',1953, and $1,68 p<lr fresh ton less than the five year average. The drying costs shown in this table were deducted from 'the gross returns received for the dried fruit to determine the net income per fresh ton dried, as shewn in table 2. ·
Prices rocoived for dried fruit this yo!l.r averaged slightly higher than in the three preceding years, and 8491 por cwt. =re than tho' 5 year average. Final net returns for cooperators belonging to the Cali:f'ornia Pruno and Apricot Grcwcrsf Association wero estimated returns, since actual returns were not available at the time of publication of this report.
- 9 -
.~
'

TABLE { - GENERAL SUMMARY OF COSTS• INCOME AND E.A,RNINGS PER ACRE - 4..,.yEJ,R. AVERA.QES l95), • 1954
1 · . lAveragefYield Average . . -' .. . Costs per Acre . . . . Total ; Menage-Record 1&ge of tons net Cult- fS:r- jMat.. Casn. T. ot·a·l Depre- ·. • Int. er• Total income I ment
trees per return ural r.;est• .. erill:l . ove.r• · cash. & ciation est on per inccir.e acre LE.er ton labor labor. head •· .. labbr invest. acre per ac~ .. . ·. . •. . . . . . .. . . . . .. ·. .·· .· .. . . .• . . . '
7 16 13•99 56.19 97•/.tJ 179.58 30.05 t31.37 r 338.J.t, 32.55 ~5-44 LJ06.45 786.09 ' 379.64 ' 11 23 17.12 · 51.07 139•14 208.20 35 .• 81 36.28 I ljj.9.43 l 48.77 }§•14 506.34 874.30 367 .96
12.· 30· ·• 9 .•.. ··0···2.•· 5.9 .. 87. 88 .•.. "5~5 94·.·._ .. _o.7 2_1~.67 22_ .•• _-.. ~.·_._·••.·· ·2.26.·.· .• 9_··5 .. '.2 .. 9~•_-_8_ .• ·. 130 .•. 52 __ 8§·7 .. _ .. ·•.··.l .. 5 .... 54·0 .. •0_4 252.8.9 17 25 12.13 45.78 54.oc 147,.67 24.95 24.39 251.8,Q 33•48 1 26,44, 311.81. 555.33 243.52 4 .22 9.41 49.39 70.20 97,.05 23.31 26.06 216.62 /+?.Ol , 3g.01 290.64 464.72 174.08
I 18' 16 8.86 ' 52•19 89.53 1021,18 ·. 200 09 25 0 38 . I 23f'•l8 .· 45.58 33o,63 .. 316.39 j 462,36 145•97 3 20 a.60 49.43 a7.4~ 105 .• 13 19.23 1 22.77 234.62 35.16 • 24,02 293,ao j•. 416.50 i22.70 9 20 9.16 49.37 96.9( 129.55 .22.07 27.45 276;.06 38.14. 31.76 1345.96 . 452.21 106.25 5 15 10.25 44. 70 130.351100.21 43.24 33•53 307.33 49.05 37 .40 1393-78 ~58.17 64.39 2 .. 14 7.25 47.03 93.95 · 94.32 30.98 22.a4 · 242.09 37.05 35,54 3:r4.68 340.99 26.31
l I
1 Ave• 20 10.~ 50.@' 94,85 r25•.80 27.14 27.27 · 275;c;7Y · 39.15 32-;Ii."9 34a;70 535.07 18B.37
Ton. Solano County Freestone peach growors cooperGted. in this study c.ontinuously for tho foµrc ~~r i>eriod 1951-1954. Avttragf>S for these 4 years are shown in table 7 for each of the orchards .as well as avl)!'ages .f'()r .alJ,;10 orchardi;.. Records are ~!Tanged •in order of decreasing managemen1t inc.oms. per acre as .. shown· in the extreme right C()l\imrt• '.!'he a 'lte rage at tho bottom· <lf each oolumn is a simple average of ~he• figures appearing 'ill that .. column.
For tbis 4 year period, orchard No. 7 wab. the most profi.table orchard'~ aver.aging. $379.64 llJElnagel!)en~ income per acre, while for orchard No·. 2, the least profite:ble1 orchard,. this average managament; .. inoome was $26.3Lper e.Qre. All 10 orchards !l.Veraged $188~37 m!lll£•.gement income per acre •.
The 5 most profi t&ble orchards in this group had .an average• production QC 12.33 tons per acre, 6ompared with an average of l0.58 for the whole group. They had an average- net return p<lr ton o1'•$52~lj.8 whUe the av<l.tage of the whole grotp was .only·$50.58 per ton. On· the other hand, their average total cos.ts .. per.acre·wert'I. $.3qo.4B, while .the a'lterage for the who1e group was only $346.70. These figures indicate, ·thnt·iri the '.) more proi'i:M.ble'orohards, more ll)oney was spent per c.cro for bette·r care, which resulted in more yield' per acre. This fruit was sold'.ttel:" a higher price than average.
- 10 -

TABLE 8 - COSTS, RETURNS AlD El\RNINGS PER FRESH TON - 4-YEAR AVER.b.GES 1951-1954
Total Percent of fruit Ave •. net return per fresh ton Picking Hauling Total Depree. Tot rel Mgt. -
Record yield Sold Fresh costs costs cash & and int. cost income-Number tons to can- sales Dried* Cannery Fresh Fruit All per per labor costs per per
per A. m:ry y_ fruit fruit dried fruit ton** ton costs ton ton
7 13.99 50.5 - 49.5 56.15 - 56..23 56..19 9.76 3.08 24.19 4.86 29.05 27.14 11 17.12 70.9 .8 28.3 53.11 65.00 45.57 51.07 ·8.86 3.30 24.50 5.08 29.58 21.49 12 9.02 60.6 17 .2 22.2 54.:33 107.54 38.08 59.87 8.55 1.88 25.16 6.67 31.83 28.04 17 12.13 '76.9 .3 22.8 51~45 107.00 25_.82 I 45~78 10.39 1.78 20.77 4.94 25.71 20.07 4 9.1µ 68.l - 31.9 53.02 - 41.6l 49.39 8.94 1.37 23.02 7.87 30.89 18.50
16 8.86 57.2 1.8 41.0 53~89 75.12 48.79 52.19 10.01 1.52 26.77 8.94 35.71 16.48 3 8.60 46.7 - 53.3 56.22 ·- 4~59 48.43 10.06 2.17 27.28 6.88 34.16 14.27 9 9.16 79.8 1.2 19.0 52.99 81.55 32..1-0 49.37 12.04 2.10 30.14 7.63 37.77 11.60 5 10~f35 60.6 .9 38.5 53;1.i4 80.45 30.14 J.i4. 70 8.14 1.64 29.98 8.41.~ 38.42 6.28 2 7.25 57.9 .1 l.i2 .o 53,86 92.00 37.45 47.03 10.34 2.67 33.39 10.01 43.40 3.63
Ave. 10.58 _§?.9 3.2 ~9 53.$5 ~7 39-74 [_0'.64 9.73 2.f§_ ~.oo j_.77 32.77 JJ..81
This table compares the 10 orchards which were in this study continuously for 4 years. Records are arranged in the same order as in table 7. The average at the bottom of each column is a simple average of the figures appearing in that columno
Averages shown in this table show that the average net return per fresh ton was higher for cannery fruit than 'for fruit dried. They also show that in tho 5. mqst profitable orchards, the return per fresh ton for fruit dried was $51.46, much above the average of $39.74 for nll 10 orchards.
The average total cost per ton for the 5 most profitable orchards was $29.41 while for all 10 orchards in tho study, it was $32.77. This lower cost was due chiefly to higher yield per aero.
Management income per ton varied from $27.14 down to $3.63. The larger management income, found in the more profitable orchards, was the result of both higher income per ton and lower costs per ton.
-11 -

i
TABLE 9 - CULTURAL COSTS PER ACRE - 4-YElill AVERAGES 1951-1954
cover I J<'erti!- CUltl.- l':op- u·cner 'l'O't;a.L Record Pruning Brush cropq . izing Spraying vation Irrigation ping cult- cult. Number dis- labor labor & Labor Me.ter- furrow Labor . Power Thin- and ural labor &
.Jl_osal & seed mater. . · ial eto • ning tieing L&M material
7 30.55 1.71 - 12.28 6.32 13.13 14.52 2.74 6.21 31.47 7.78 .so 127.51 11 44,18 5.86 - 15.27 5.84 12.08 16.29 9.66 9.29 43.95 9.98 2.55 174095 12 19.82 4.69 - 7.97 7.97 6.28 13.10 6.82 6.99 27.44 6.58 2.76 110.22 17 11.91 2,81 - - 5.38 11.72 13.28 6.71 13.23 5.72 9.07 - 79.83 4 20.18 3.19 - 10.03 4.49 6.52 11.77 3,09 6.90 21.99 4.33 1,02 93.51
16 22.43 2.43 - 10,76 5.26 6.21 11.19 9.69 3,95 35.78 1.92 - 109.62 3 36.38 .97 - 9.00 3.83 6,89 6.22 5.02 3.18 26.54 6.97 l.72 106,72 9 26.80 4.27 l,89 6.17 5.88 10.00 12.72 12.19 3.36 21.32 8,66 ·5.80 119.06 5 30.05 4.46 .69 s.41 6.89 12.36 26.05 19.08 6.17 18,97 7.41 33.05 173.59 2 26.45 1.83 - 11.88 7.07 n.63 12.50 5,04 5.43 25.48 12.62 5.00 124.93
Ave, ~.88 3.22 1.29 10.20 5~ 9~ 13.~ 7 .fj§_ ~7 25.87 7.53 _§_.59 121.99
Average annual cultural costs for each of the 10 orchards which were in this study for 4 years, are shown in tc.ble 9. Records are arranged in the same order as in 'tables 7 and 8, The average at the bottom of each column is a simple aver&ge of the figures appearing in that column.
Cultural costs vary widely in these 10 (\rchards, The average total cultural labor .il.nd material cost for the 5 most profitable orchards is only slightly lower than the average for the 10 orchards. Apparently, the greater profit earned by these 5 orchards was the result of better yields and better income per ton rather than from reduced cos ts per acre.
This table is designed primarilly, for u'se by the individual cooperators involved. It enables each cooperator to compare his mrcrc.ge costs with those of othe!'.s in the study.
- 12 -

TABLE 10 - CASH OVERHEAD:AND DEPRECIATION COSTS PER ACRE - 4-YEAR llVERl>GES 1951-1954
Cash overhead costs per acre ~reciation costs per acre Record General! County Repairs Comp, I Total Trees Build- Irrig- Tillage Spray Props Other Total Number expense I truces except insur- in gs ation equip- equip- etce , equip- ex. field
field pr. ance system ment ment ment power
7 15.35 8.40 1.63 5,99 '31.37 20.00 2,63 4.36 ,58 3.85 .72 3.30 35.44 ll 19.16 8.73 l.46 6.93 36,28 20.00 2,87 11.89 2.30 7.64 1.85 2.22 48.77 12 l0.21 8.02 l,06 3,37 22,66 20.00 .60 4.45 ,47 - 1.05 3.11 29.68 17 ll.38 e.02 1050 3.49 24.39 20,00 1.07 6.;46 1.28 .67 ,77 3.23 33.48
4 9.53 8.95 3.66 3.92 26.06 20.00 3.21 12.46 .94 2.70 ,87 1,83 42,01
16 ' io.59 7.03 3.37 4.39 25.38 20.00 3.53 l.91 .89 1,28 3.20 14.77 45,58 3 10.59 6.93 .79 4.46 I 22.77 20.00 3.53 2.81 .49 1.26 2,65 4,42 35 • .16 9 12.43 8.07 1.57 5,38 27.45 20.00 4,56 4,68 ,73 2.06 .72 5.39 38~14 5 13.69 9.10 3.49 7.25 I 33.53 20.00 3~34 8,69 2,98 2.63 - 11.41 49.05 2 10.97 6.92 ' 1,08 3.87 22.84 20.00 1,34 2.35 .45 1.40 1,67 9.a4 37.05
I Ave, 12.39 8.02 1.96 l{.90 27.27 20,00 2-;§..7 ·~6.0l l.11 2~1 1,.35 5.95 39.44
Average annual cash overhead and depreciation costs for each of the 10 orchards which were in this silldy for /:i. years are shown in table 10, Records are arranged in the same order as in tables 7, 8 and 9. The average at the bottom of each column is a simple average of the figures appearing in that column.
Cash overhead costs as sh""'"' a'to;,-e inulu;de all cash costs not classified under labor and material costs, Interest paid on mortaged indebtedness is not included as a cash cost since an interest on investment charge, as shown in Table 5, is included for all orchards in the study and would normally cover any interest paid on indebtedness. Interest paid on operating capital is covered by the general expense item which is explained on the page "Definition of Terms" at the fore part of this report,
Depreciation on buildings and equipment ~aries considerably between orchards depending upon individual situations, The size of the farm unit on which such facilities are used is an important factor influencing depreciation costs per acre. ·nepreciation on trees was figured the same for all orchards at $20 per acre, This is based upon an original cost to bring to bearing age of $400 per acre and a prorluct1ve life thereafter of 20 years, Depreciation of field power equipment is not included in the total depreciation cost in this table since it is included in the hourly rate charged for the use of such equipment in the labor record,
- 13 -

TABLE 11 ~ INVESTMENT PER ACRE - 4-YE.l\R AVERltGES 1951-1954
Irri- Till,age Spray Props Other Total Fi0ld Total ·Int. i:.t Record Trees Build• gation equip- equip- etc. equip- Land except power invest- 5% ex. Number in gs system ment ment ment field equip- ment f'ie ld
power ment i power
7 200.00 46.oo 47.60 6.30 19.37 5.36 26.30 300.ioo 650.93 56.50 707.43 32.55 11 200.00 22.16 100.94 16.85 40.52 13.89 18.40 350.00 762.76 60.05 822.81 38.14 12 200.00 13.11 64.28 5.26 - 7.89 19.80 300.00 610.34 34.21 644.55 30.52 17 200.00 13,40 73.58 7.27 6.67 5.00 22.76 200.00 528.68 35.40 564,08 26.44 4 200,00 22.97 80,90 8,07 13,52 4.37 10.37 300.00 640.20 36.07 676.27 32.01
16 200 .• 00 14.19 12.43 5.76 12.84 32.00 95.38 300.00. 672.60 49.07 721.67 33,61 3 200.00 11.65 28.66 2,45 6.28 6.62 18,78 200.00. 4ao.44 24.05 504.49 . 24.02 9 200.00 33.14 55.77 4,83 7.72 3.61 30.10 300.00 635.17 46,95 682.12 31.76 5 200.00 33,38 77.4a 17.14 19.75 - 100.17 300.00 747.92 55.49 803.41 37,40 2 200.00 10,66 25,74 3.12 ·6.44 12.50 52.43 400.00 710.89 25.73 736.62 35.54
Ave. :::g:oo .oo 22~()_7 !;;6,74 7.70 14.77 10.i[J. 39:45. 295.00 l-O!i3 .99 r1.i2 .35 I 686.3!.i. 32.20
Average investment per acre is shown in table 11. fo:t" each of the 10 orchards which were in this study for 4 years• Records are arranged in the srune order as in tables 71 81 9 and 10. The average at the bottom of each column is a simple average of the figures appearing in that column.
The investment figures shown in the above table are calculated at one-half of the original cost except for lnnd _vnlues. Such values are maintained throughout the life of facilities and equipment as a basis for calculnting nn equitnble interest on investment charge against each year.•s crop.
As pointed out in table 101 ·tree values were considered the same for all orchards with an original cost of $400 per acre. Average tree values, thus, are shown at $200 per acre, The land values used in this study are conservative agricultural values for the purpose of calcul~ting a nominal interest on investment charge.
The above table should not be used as indicative of the amount of capital required to go into the peach growing business at tho present time, Current values· are considerably higher than those shown, Interest on investment in field power equipment is excluded from the interest. charge shown nbove since this cost is included in tho hourly rate. charged f'or tho use of this equipment in the labor record.
- 14 -