Embed Size (px)
Citation preview

3/29/2010
1
Pradeep ShrivastavapBarkatullah universityBhopal India
River obtains its sustenance from the environment .The quality of river water is linked with the quality of environment it has. Therefore it is necessary to ensure that the demand on the river environment does not exceed its present and future carrying capacity.
3/29/2010
2
Water is fundamental to life on earth. For human populations and ecosystems to thrive, that water must be clean, it must stay clean and, most importantly, it must be accessible to all. The degradation of water quality in rivers, streams, lakes, and groundwater systems has a direct impact on ecosystems and human health. This state of affairs represents an unspeakable human tragedy, and is also major obstacle to development. Irina BokovaIrina Bokova Director‐General of UNESCO
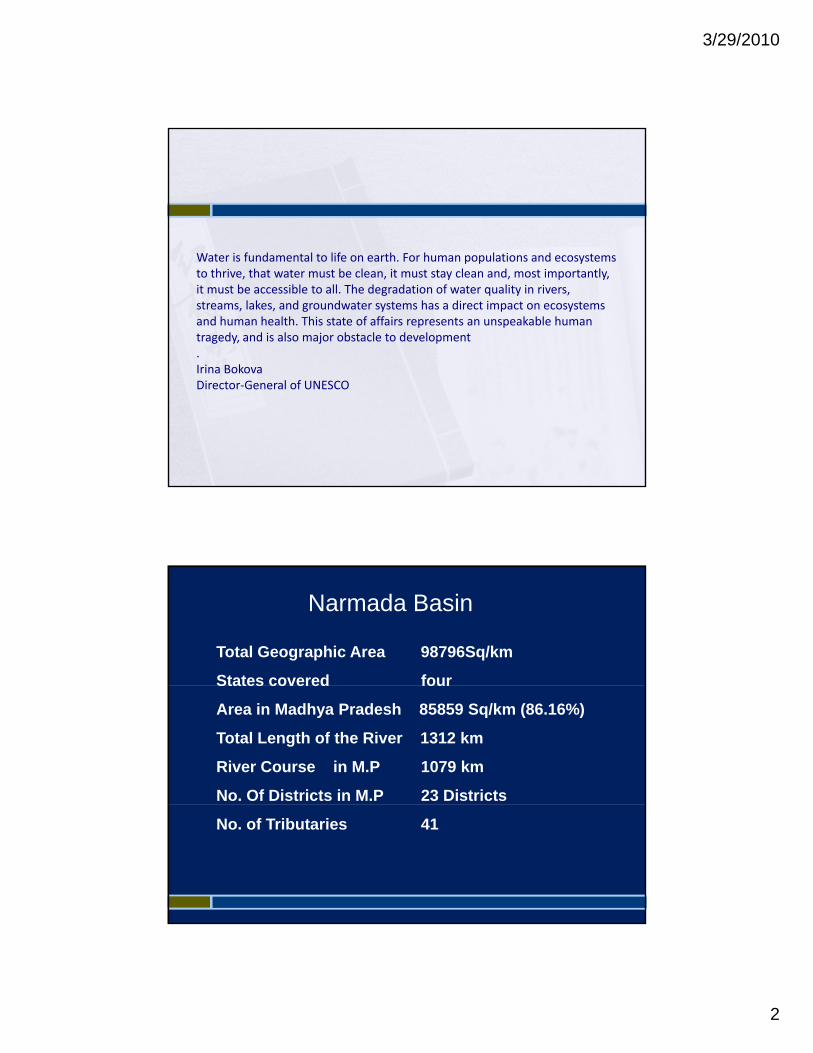
Narmada Basin
Total Geographic Area 98796Sq/km
States covered fourStates covered four
Area in Madhya Pradesh 85859 Sq/km (86.16%)
Total Length of the River 1312 km
River Course in M.P 1079 km
No. Of Districts in M.P 23 Districts
No. of Tributaries 41

3/29/2010
3
Map showing various study sites of River Narmada

3/29/2010
4
DINDORIAMARKANTAK
BARGI NARAYANGANJ
Plate A : Photograph showing the selected study sites of Narmada River.

3/29/2010
5
POPULATION POPULATION
BASIN POPULATION ( MP) 12 7 MILLIONBASIN POPULATION ( MP) 12.7 MILLION
RURAL 84%
URBAN 16%
RURAL GROWTH RATE 5.49 – 44.09 %
URBAN GROWTH RATE 16.88 – 60.36 %
RATE OF URBANISATION 31.39 %
1400
1600
Total geographical Area of the district( Ha x 1000 ) Basin Area (ha x 1000)
DISTRIBUTION OF BASIN AREA IN DIFFERENT DISTRICTS
400
600
800
1000
1200
0
200
400
Shahdo
l
Mandala
Balaghat
Seon
i
Jabalpur
Narsingpu
r
Sagar
Dam
oh
Chhind
wara
Hoshangabad
Betul
Raisen
Seho
re
Khandawa
Khargone
Jhabua
Indo
re
Dhar
Dew
as

3/29/2010
6
100
1
10
0.1
1
Fraction of district lying in the Basin (%)
Fraction of Basin lying in the district (%)
Higher rate of development and growthoccurring in the districts with comparativelysmaller area of river basin:
Population growth rate: 21‐60.3%Population density: 186‐663 /sq kmRate of urbanisation: 31 39%Rate of urbanisation: 31.39%Industrial development
Activities concentrating in certain districts only
3/29/2010
7
25000
30000
5000
10000
15000
20000
0
BOD load Kg / day Rural BOD load Kg / day Urban Total BOD load Kg / day
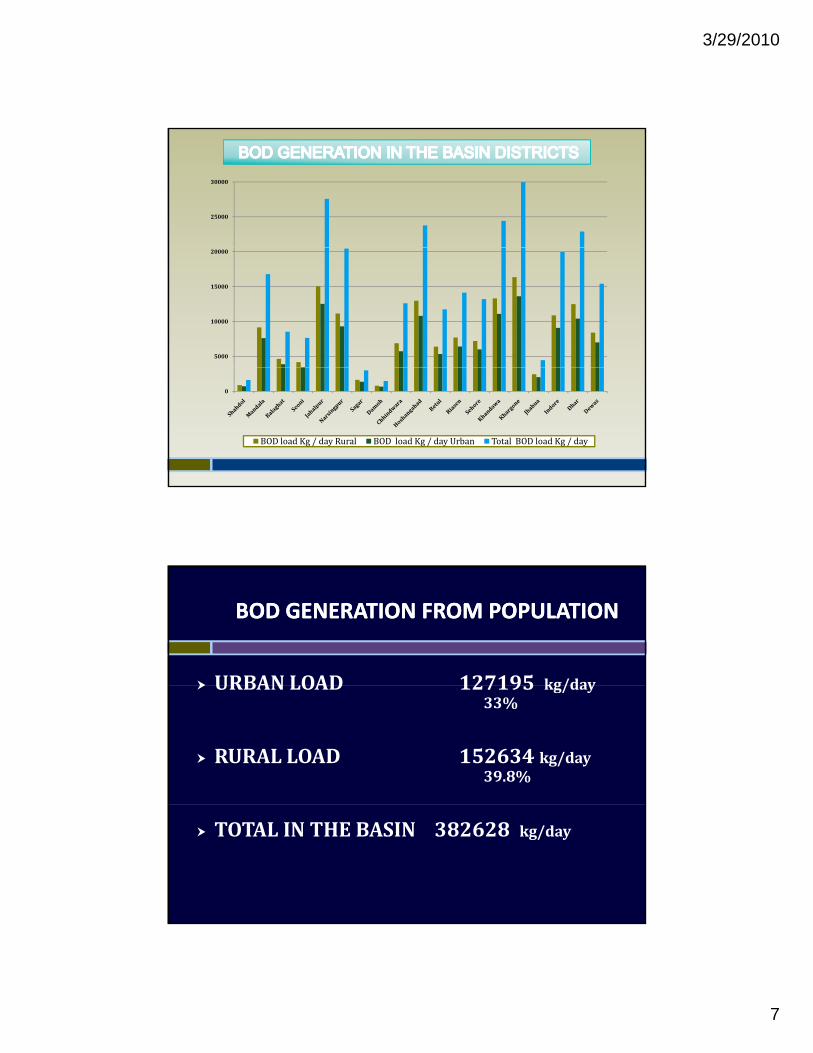
BOD GENERATION FROM POPULATIONBOD GENERATION FROM POPULATION
URBAN LOAD 127195 kg/day URBAN LOAD 127195 kg/day 33%
RURAL LOAD 152634 kg/day 39.8%
TOTAL IN THE BASIN 382628 kg/day

3/29/2010
8
POPULATION LOAD
URBAN POPULATION DECADAL GROWTH RATE IS HIGHER UPTO 60% AND LOWER IN RURAL AREAS
POINT ORIGIN WASTE WATER IN URBANNON POINT ORIGIN IN RURAL AREAS
TOTAL BOD DUE TO CATTLE POPULATION RELEASED IN THE RIVER BASIN HAS BEEN ESTIMATED TO BE 220154 kg/d REMAINS UN TREATED
HOSPITAL WATER CONSUMPTION IN THE BASIN4030400 l/d
THE AVERAGE BOD VALUE OF THE RIVER HAS INCREASED FROM AVERAGE OF 2.3 mgl I N 1994 TO 5.4 mgl IN 2004-05
WASTE WATER GENERATION IN BASIN
TOTAL 238.79 MCM
INDUSTRIAL 13.93 MCM
SHARE OF INDUSTRIES IS 5.83%

3/29/2010
9
BOD GENERATION FROM INDUSTRIESBOD GENERATION FROM INDUSTRIES
FROM INDUSTRIES 18972 7 FROM INDUSTRIES 18972.7 kg/day
TOTAL IN THE BASIN 382628 kg/day
% OF INDUSTRIES 4.95 %
Annual total and irrigational waste water generation in Narmada basin
30
35
40
45
50
Waste water by Irrigation
Total waste water generated
0
5
10
15
20
25
30
Mandla
Balagh
atSeo
ni
Shahd
ol
shan
gaba
d
arsing
hpur
Jaba
lpur
Raisen
Betul
Chindw
ara
Damoh
Sagar
Khargo
ne
Khand
waDha
r
Dewas
Sehore
Jhab
uaInd
ore
MC
M
Hosh
Nar Ch K K
Districts

3/29/2010
10
60000
70000
Annual Fertilizer consumption in the districts of the basin
(1991-2000)
(2004-05)
0
10000
20000
30000
40000
50000
Man
dla
Din
dori
Bala
ghat
Seon
i
Shah
dol
anga
bad
Har
da
sing
hpur
abal
pur
Rai
sen
Betu
l
indw
ara
Dam
oh
Saga
r
harg
one
hand
wa
Dha
r
Dew
as
Seho
re
Jhab
ua
Indo
re
Tons
B S
Hos
ha
Nar
s J
Ch Kh Kh
Districts of the basin
ANNUAL FERTILIZER CONSUMPTION IN THE BASIN
199091 3,35,541 TONS
200405 5,56,337 TONS
% INCREASE : 40% (15 YRS)

3/29/2010
11
199091 : 27,258 TONS
POLLUTANT LOAD BY THE USE OF FERTILISERS
200405 : 55,633 TONS
%INCREASE : 51% (15 YRS)
Fertilisers pollutant load in river water
6000
70001990-912004-05
0
1000
2000
3000
4000
5000
a i t i l d a r r n l h r e r e a e
Tons
/Yea
r
Man
dla
Din
dor
Bala
gha t
Seon
i
Shah
dol
Hos
hang
abad
Har
da
Nar
sing
hpur
Jaba
lpur
Rai
sen
Betu
l
Chi
ndw
ara
Dam
o h
Saga
r
Khar
gone
Khan
dwa
Dha
r
Dew
as
Seho
r e
Jhab
ua
Indo
re
Districts

3/29/2010
12
Marked change in application rate of the pesticides from 1990-91 to 2006-07
10.71115 1990 91
PESTICIDES APPLICATION RATEIN THE RIVER BASIN DISTRICTS
0.10.89 0.16 0.04 0.04 0.16
1.110.26 0.29
4.3
8 7.67
4.38
10.71
0.440.12
1.670.911.63 0.88
0.34
1.14
00.511.522.533.544.555.566.577.588.599.51010.51111.5
agha
t
gaba
d
Rai
sen
Betu
l
Dam
oh
Saga
r
ndw
a
Dha
r
ewas
ehor
e
ndor
e
1990-91
2006-07
Bal
Hos
hang R D S
Khan D Se I
Districts
ASSIMILATIVE CAPACITY OF RIVER ATASSIMILATIVE CAPACITY OF RIVER ATURBAN AGGLOMERATIONURBAN AGGLOMERATION
JABALPUR HOSHANGABAD
BOD loadKg/day
43000 - 217866 94241 - 511362
Distance 115 km> 71 km>Distance considered
115 km> 71 km>
Water discharge
9.37km3 yr-1 23.82 km3 yr-1

3/29/2010
13
Assimilative Capacity of Rivrt at Jabalpur & Hoshangabad
ASSIMILATIVE CAPACITY OF THE RIVER
100000
200000
300000
400000
500000
600000
BO
D L
oad
(Kg/
day)
0
June Ju
ly
Augus
t
Septem
ber
Octobe
r
Novem
ber
Decem
ber
Janu
ary
Februa
ryMarc
hApri
lMay
MonthBOD Load Kg/day of Jabalpur BOD Load Kg/day Hoshangabad
ABSENCE OF SEWERAGE SYSTEM FOR COLLECTION AND TREATMENT OF SEWAGESEWAGE/WASTE WATER FLOWS THROUGH NATURAL DRAINAGE CONVERTED INTO CITY WASTE WATER DRAINAGE JOINS RIVER.SEPTIC TANK PROVISION FOR LIMITED POPULATIONABSENCE OF MEDICAL WASTE TREATMENT FACILITY IN MOST OF THE DISTRICTS.CITY DEVELOPMENT PLANS DO NOT INDICATE FUTURE DEVELOPMENT/TECHNOLOGY OPTIONS
3/29/2010
14
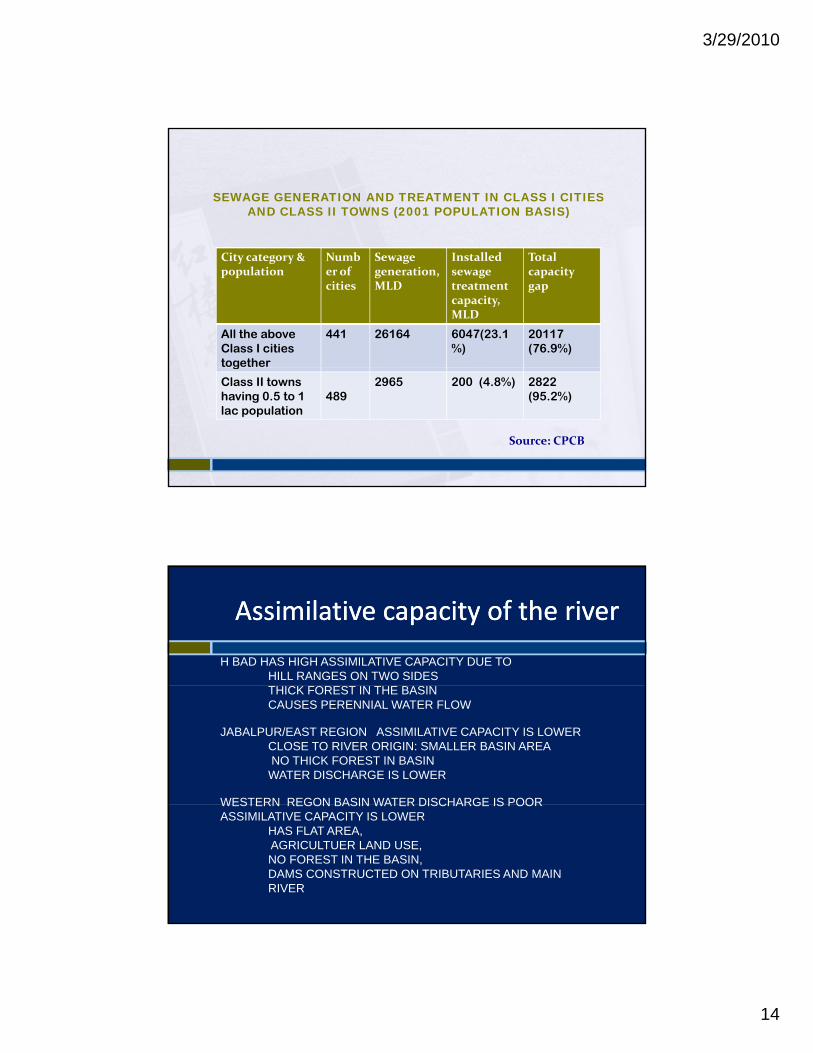
SEWAGE GENERATION AND TREATMENT IN CLASS I CITIES AND CLASS II TOWNS (2001 POPULATION BASIS)
City category & population
Number of cities
Sewage generation, MLD
Installed sewage treatment capacity, MLD
Total capacity gap
All the above Class I cities together
441 26164 6047(23.1%)
20117 (76.9%)
g
Class II towns having 0.5 to 1 lac population
4892965 200 (4.8%) 2822
(95.2%)
Source: CPCB
Assimilative capacity of the riverAssimilative capacity of the river
H BAD HAS HIGH ASSIMILATIVE CAPACITY DUE TO HILL RANGES ON TWO SIDES THICK FOREST IN THE BASIN CAUSES PERENNIAL WATER FLOW
JABALPUR/EAST REGION ASSIMILATIVE CAPACITY IS LOWERCLOSE TO RIVER ORIGIN: SMALLER BASIN AREANO THICK FOREST IN BASINWATER DISCHARGE IS LOWER
WESTERN REGON BASIN WATER DISCHARGE IS POORWESTERN REGON BASIN WATER DISCHARGE IS POOR ASSIMILATIVE CAPACITY IS LOWER
HAS FLAT AREA, AGRICULTUER LAND USE, NO FOREST IN THE BASIN, DAMS CONSTRUCTED ON TRIBUTARIES AND MAIN RIVER
3/29/2010
15
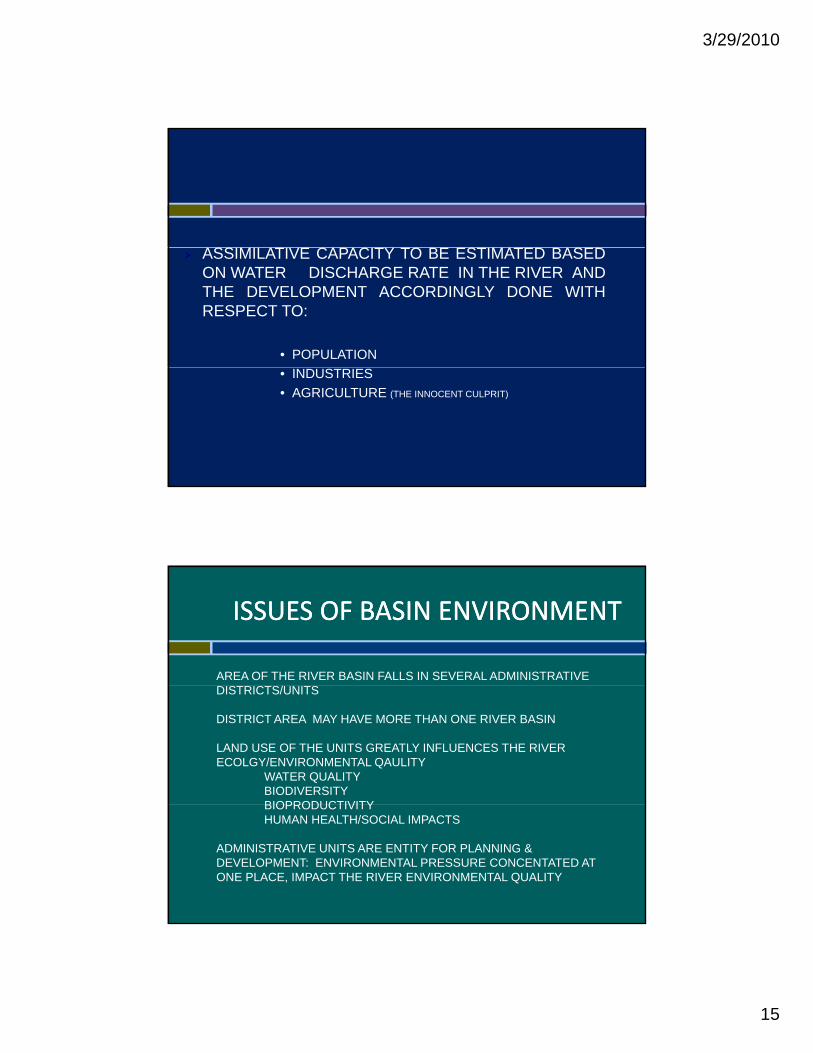
ASSIMILATIVE CAPACITY TO BE ESTIMATED BASEDASSIMILATIVE CAPACITY TO BE ESTIMATED BASEDON WATER DISCHARGE RATE IN THE RIVER ANDTHE DEVELOPMENT ACCORDINGLY DONE WITHRESPECT TO:
• POPULATION• INDUSTRIES• AGRICULTURE (THE INNOCENT CULPRIT)
ISSUES OF BASIN ENVIRONMENTISSUES OF BASIN ENVIRONMENT
AREA OF THE RIVER BASIN FALLS IN SEVERAL ADMINISTRATIVE DISTRICTS/UNITS
DISTRICT AREA MAY HAVE MORE THAN ONE RIVER BASIN
LAND USE OF THE UNITS GREATLY INFLUENCES THE RIVER ECOLGY/ENVIRONMENTAL QAULITY
WATER QUALITYBIODIVERSITYBIOPRODUCTIVITYBIOPRODUCTIVITYHUMAN HEALTH/SOCIAL IMPACTS
ADMINISTRATIVE UNITS ARE ENTITY FOR PLANNING & DEVELOPMENT: ENVIRONMENTAL PRESSURE CONCENTATED AT ONE PLACE, IMPACT THE RIVER ENVIRONMENTAL QUALITY

3/29/2010
16
PRESENT DISTRICT DVELOPMENT PLANS DO NOT PREDICT POSSIBLE ENVIRONMENTAL PRESSURE EMANATING FROM THE DEVELOPMENT OF BASIN DSITRICTS.
SITUATION CAN BE AVERTED BY ADOPTING ALTERNATIVE APPROACH FOR DEVELOPMENT PLANNING
OTHER RIVER BASIN AREAS IN THE DISRICT MAY BE EXPLORED FOR DEVELOPMENT
CARRYING CAPACITY OF THESE BASIN AREAS IN THECARRYING CAPACITY OF THESE BASIN AREAS IN THE DISTRICT SHOULD BE DETERMINED WITH REPECT TO DEVELOPMENT (POPULATION,INDUSTRIES ETC)
THIS ASSESSMENT OF THE DISTRICT BASIN AREA TO PRECEED ITS DEVELOPMENTAL PLANNING
DISTRICT DEVELOPMENT PLAN TO INDICATE CLEAR ENVIRONMENTAL OBJECTIVES ALSO
THE TOTAL WASTE WATER/BOD LOAD NOT TO EXCEED THE RIVER ASSIMILATIVE CAPACITY
DEVELOPMENT PROGRAMMES MAY BE DIVERTED/CONSIDERED FOR OTHER BASIN AREAS OF THE SAME DISTRICT OR
DIVERTED TO ANOTHER DISRICT WHICH PERMITS/ASSIMILATE THE ADDITIONAL POLLUTION LOAD
DEVELOPMENT PLANING TO BE DONE AT DISTRICT BASINLEVEL THAN AT ADMINISTRATIVE AREA LEVEL

3/29/2010
17

3/29/2010
18


![2017 H H H H H H H H H H H H H H H H H H H …...2017 V 25 9 The LEGION LINK C C _ t Á Á X G } ] o P ] } v X } P P 1 H H H H H H H H H H H H H H H H H H H A In This Edition.... 22](https://img.pdfslide.us/doc/110x75/5e9641686b534117c07b3323/2017-h-h-h-h-h-h-h-h-h-h-h-h-h-h-h-h-h-h-h-2017-v-25-9-the-legion-link-c-c-.jpg)