Embed Size (px)
Citation preview
1
Unit 5
Feedback, cont.
Goal Setting
Schedules of Reinforcement
2
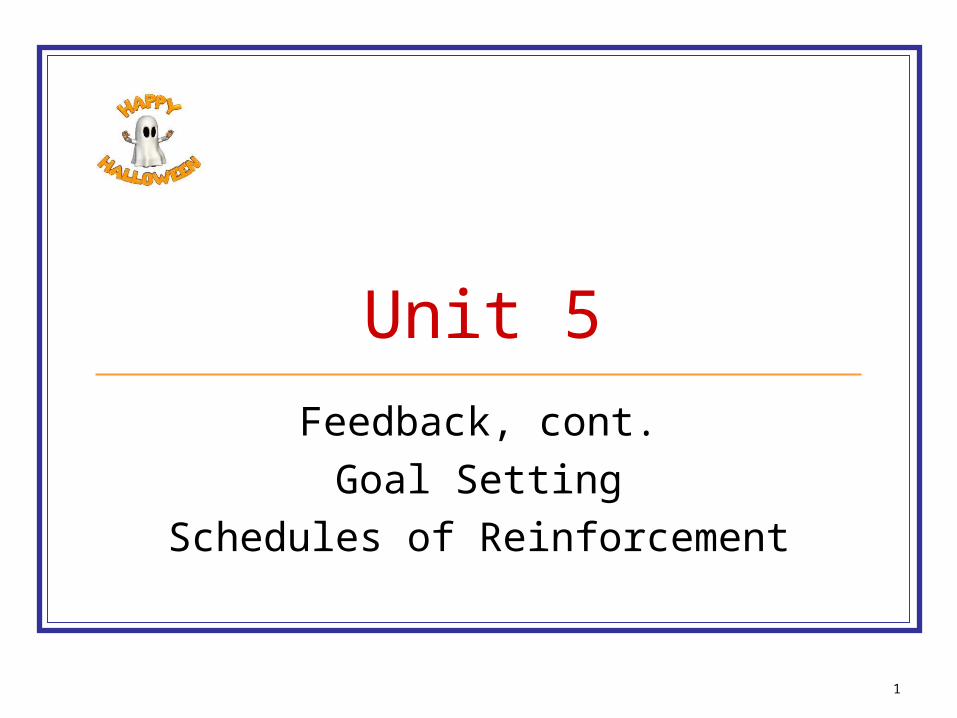
Unit 5: Schedule
Wednesday: Lecture Monday, 10/26
U5 lecture, cont. Exercise: Schedules of reinforcement in the lab and applied settings
Wednesday, 10/28: E5 Monday, 11/02: ME1 over Units 1-4
I’ll hand out study objectives for ME1 on Monday, 10/26
3
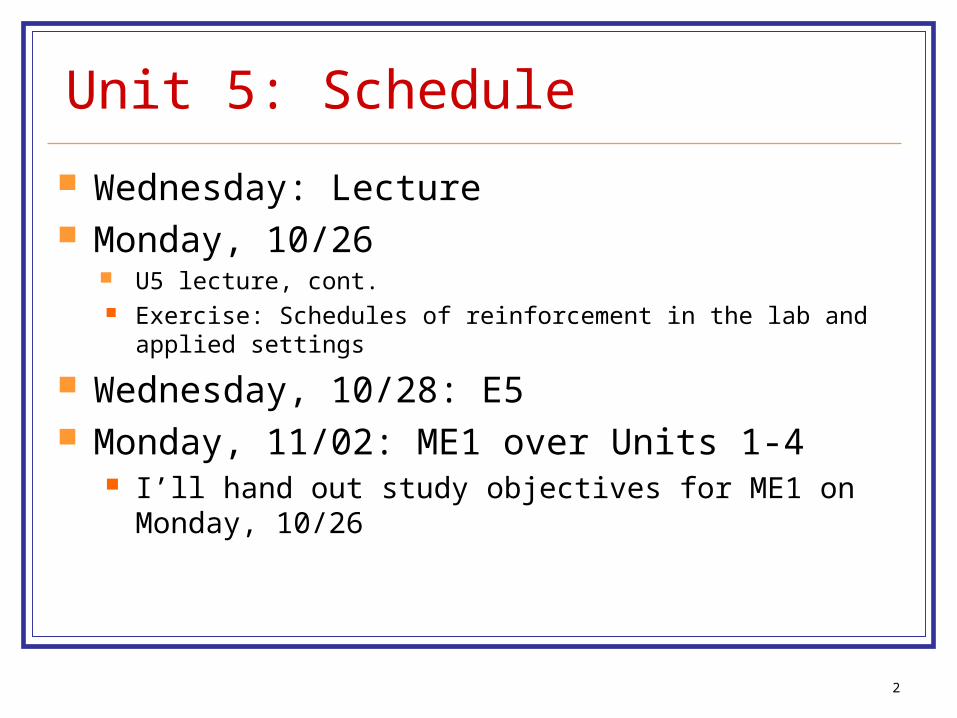
ME1
Covers Units 1-4 (not E5) If you have missed an exam, you need to take ME1 or
your missing exam score turns into a zero If you have taken all the exams to date and would like to
replace your lowest score on Es 1-4, you should take ME1 If your grade on ME1 is lower than your grades on Es 1-4, I
throw out ME1; the ME1 cannot hurt your grade, it can only help your grade
If you have taken all of the exams to date and are satisfied with your scores, you get the day off
(Monday, 11/16 is the last day to withdraw from classes w/o academic penalty)
4
In-class exercise (8 points), Mon. 10/26
Read Latham & Dossett in the coursepack Pay particular attention to the Methods section Was the continuous reinforcement (CRF) schedule used
in the Latham & Dossett article a true CRF schedule? Was the variable ratio 4 (VR4) schedule used in the
Latham & Dossett article a true VR4 schedule? For each question, first say “yes” or “no” List as many reasons as you can You can bullet each reason, then provide an explanation
beneath each bullet
5
In-class exercise (8 points), Mon. 10/26
I am not looking for a long paper: 2 pages max The points you earn will depend upon
whether you identify the most obvious reasons the number of reasons you identify
This is NOT an opinion paper Use the material from this class Possibly others
6
SO1: SMART goals (NFE) Locke & Latham developed “goal setting” theory and have done some
stellar studies in the area While originally, Locke did not believe feedback was important, over the
years he adjusted his opinion about that based on his research Thus, while we would not agree with Locke’s conceptual analyses,
once again, as with expectancy theory, we do agree about practical implementation
SMART goals (Rubin, 2002) Specific, Measurable, Attainable, Relevant, Time-bound
I would add “accompany with feedback and consequences”
Locke & Latham (Eds.) (2013). New developments in goal setting and task performance.
7
SO2A: Specific goals are better than general goals (Locke & Latham). Why from a behavioral perspective?
OBM position: Goals affect performance only because of the consequences that follow behaviors that result in goal attainment.
When goals are specific They specify the response requirements They specify the criterion for reinforcement/reward Thus, both employees and managers can easily discriminate
successful from unsuccessful performance Goals function like task clarification in the sense that the
employee knows exactly what good performance consists of They also provide an explicit “evaluative” component which, as I
have indicated earlier, appears to be necessary for feedback to function effectively in most situations
(material is from an analysis by Fellner & Sulzer-Azaroff, 1984, jOBM. Time to update the literature review, do your best goals next; evaluationcomponent does NOT have to be goals - could be achieved a number of ways, but goals “work” )
8
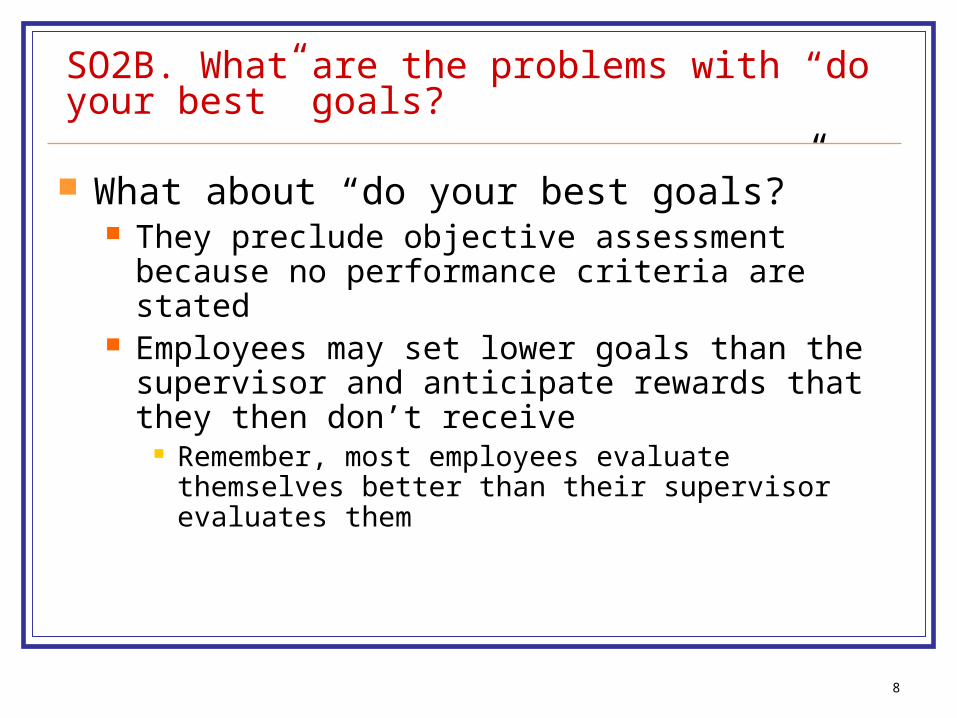
SO2B. What are the problems with “do your best” goals?
What about “do your best goals?” They preclude objective assessment because no
performance criteria are stated Employees may set lower goals than the supervisor
and anticipate rewards that they then don’t receive Remember, most employees evaluate themselves better
than their supervisor evaluates them
9
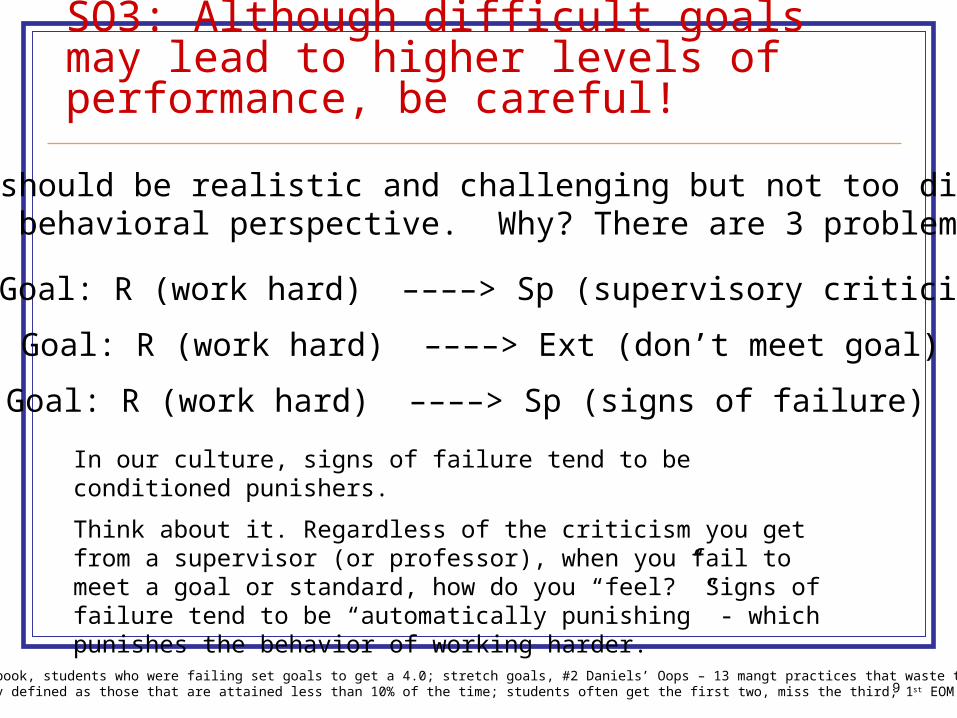
SO3: Although difficult goals may lead to higher levels of performance, be careful!
Goals should be realistic and challenging but not too difficultFrom a behavioral perspective. Why? There are 3 problems.
1. Goal: R (work hard) ––––> Sp (supervisory criticism)
(example in book, students who were failing set goals to get a 4.0; stretch goals, #2 Daniels’ Oops – 13 mangt practices that waste time & money operationally defined as those that are attained less than 10% of the time; students often get the first two, miss the third; 1st EOM programs)
3. Goal: R (work hard) ––––> Sp (signs of failure)
In our culture, signs of failure tend to be conditioned punishers.
Think about it. Regardless of the criticism you get from a supervisor (or professor), when you fail to meet a goal or standard, how do you “feel?” Signs of failure tend to be “automatically punishing” - which punishes the behavior of working harder.
2. Goal: R (work hard) ––––> Ext (don’t meet goal)
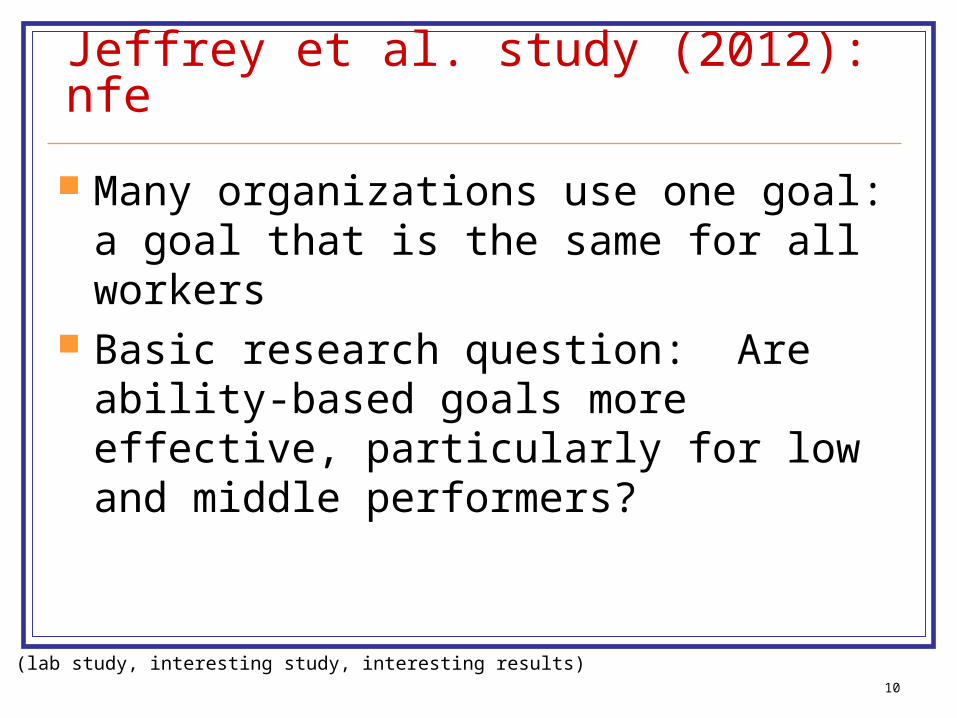
Jeffrey et al. study (2012): nfe
Many organizations use one goal: a goal that is the same for all workers
Basic research question: Are ability-based goals more effective, particularly for low and middle performers?
10
(lab study, interesting study, interesting results)
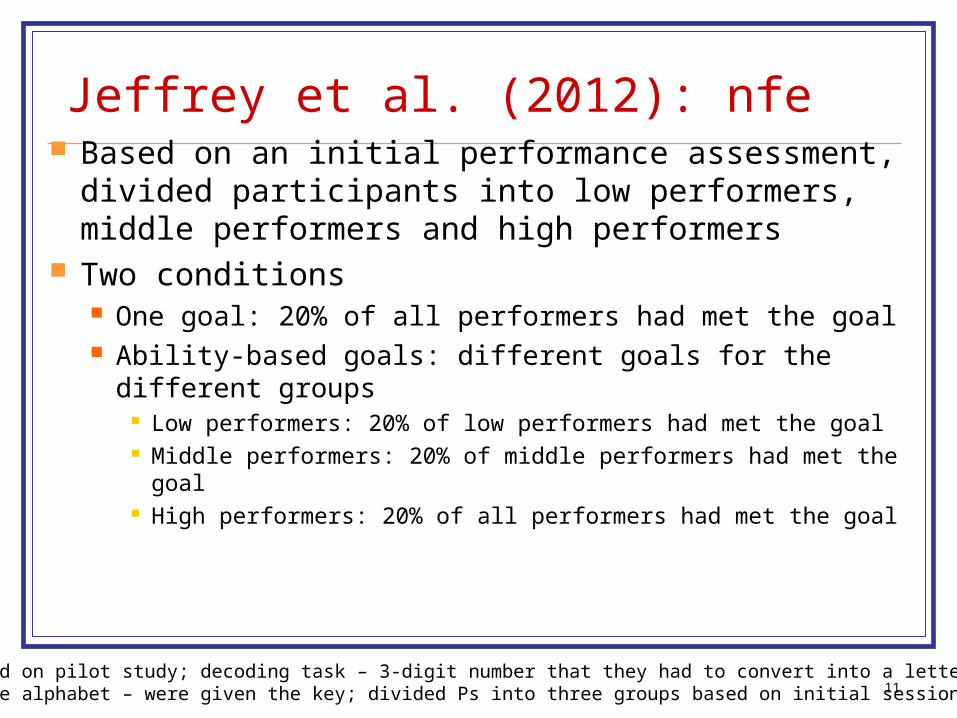
Jeffrey et al. (2012): nfe Based on an initial performance assessment,
divided participants into low performers, middle performers and high performers
Two conditions One goal: 20% of all performers had met the goal Ability-based goals: different goals for the different
groups Low performers: 20% of low performers had met the goal Middle performers: 20% of middle performers had met the
goal High performers: 20% of all performers had met the goal
11(based on pilot study; decoding task – 3-digit number that they had to convert into a letterof the alphabet – were given the key; divided Ps into three groups based on initial session)
Jeffrey et al. (2012): nfe
Pay: $2 base pay + bonus for reaching goal One session, divided into 5 periods
Practice session Assessment session with per piece incentives for each
item correctly decoded: used to assign Ps to low, middle, high performers
Three 5-minute performance periods
12
Jeffrey et al. study (2012): nfe Ability-based goals were more effective than one
goal for all for low performers Low performers who were given goals based on low
performance performed better than their counterparts who were given a higher goal based on the performance of all performers (which included the middle and high performers)
Low and middle performers who received the one goal decreased their performance across 3 sessions
Challenging, but “attainable” goals are the best What is challenging and what is too difficult?? Were the goals in this study too difficult?
13
(the analysis I provided earlier probably explains why: goals were too difficult for the low and middle performers;0% of the low and middle performers in the one goal condition met the goal; only ~35% of high performers did)
Jeffrey et al. follow-up studies Goals may have been too high and bonus system may have influenced the
results Redo the study using goals based on the average performance of the
groups, not a goal that only 20% of individuals can meet Use piece rate pay rather than an all or none bonus system Urschel (2013), Replication using 3 tiered goals versus one high goal or one
medium goal with bonus pay for reaching goals Literature supports the notion that the individuals who are most likely to meet
a goal are the ones who are performing below a goal but not way below the goal (difficult, but achievable)
Given the above, what, at least conceptually, would be the benefit of giving a group of employees multiple tiered goals for the same behavior/accomplishment?
How also does this relate to Daniels’ position that goals should start low and successively increase, so that performers are reinforced for meeting the goal
14
Practical dos and don’ts: still nfe
When possible do use tiered (multiple goals) with successively increasing rewards for meeting each higher goal Performance Matrix is a great tool for this
because of the multiple goals (columns 6-12) Do not have different goals for different
individuals with the same tangible/monetary rewards – disaster
15
(organizations typically can’t set individual goals – too labor intensive; but it may be possible 2-3 tiers;Pampino et al. did that in study in U2; Dan’s dissertation; last slide on this)
16
SO5: Assigned vs participative goals
The research indicates that participating in goal setting does not increase performance when compared to assigned goals Three meta-analysis studies now support this
conclusion, first one in 1986
The key issue, thus, is not how a goal is set, but whether a goal is set
(Back to the Sos: this is a very common misconception; issue keeps coming up at ABAI, with a student -from another program-arguing and maintaining that participative goals were better; just this summer I was asked about this by a consultant who works for a behavioral firm)
17
SO6A: Goals – what is the best combination?
We know that goals combined with feedback are more effective than either alone Feedback enhances the effectiveness of goals Goals enhance the effectiveness of feedback
Studies suggest that graphic feedback is the most effective type of feedback to use with goals: better than vocal or written
We know that goals and feedback are much more effective when consequences are provided Not definitive, but it appears that monetary incentives/rewards are
more effective than nonmonetary incentives/rewards
THUS……….
(next slide)
18
SO6A: What is the best combination of OBM interventions? (answer)
Goals Graphic feedback that displays performance over
time, preferably at least once a week Some type of performance consequence,
preferably monetary incentives
(the same recommendation from Balcazar et al – just add goals when at all possible)
19
SO6B: Group goals When using group goals, what factor should be
taken into account?Group size
Group goals are more effective with small groups than large ones However, we don’t know what the “critical” group size
is This would be a very interesting and valuable study
to conduct Goals, graphic feedback, consequences, while
manipulating group size
(alone, not combining them with individual goals; group size is an issue in ALL groupcontingencies.; recent meta-analysis with incentives..)
SO7: Possible behavioral functions of goals: nfe
Analyses of goals parallel those of feedback Summarized the prevalent ones in SO7 Good summary and starting point if you want to
pursue this:
Tammemagi et al. (2013)
20
21
SO8: Daniels vs. Dickinson
Daniels maintains that if you set a goal and if performance meets but does not exceed that goal, the contingency is a negative rather than positive reinforcement contingency Also maintains that negative reinforcement contingencies are bad
contingencies because they represent aversive control In order for negative reinforcement to work there must be a
pre-existing aversive stimulus that the behavior terminates or avoids
Is this a correct analysis?
22
Dickinson’s position
People are not going to overshoot goals if there is no further reinforcement for doing so, whether the contingency is a negative or positive reinforcement contingency
Negative reinforcement contingency People will perform only to the level that terminates or
avoids criticism or punishment Positive reinforcement contingency
People will perform only to the level that results in maximum positive reinforcement
23
Main point repeated
If there is no further reinforcement for performing above the goal, then people will not exceed the goal, regardless of whether the reinforcement is positive or negative If you want people to perform above the goal, then you must
provide additional reinforcement/rewards for them to do that Daniels’ misconception (I think) comes from the fact that he
encourages further praise/reward/recognition from supervisors for above goal performance; but often those rewards are not qualitatively different than rewards for meeting goals (nontangible socials), so doesn’t view those rewards as “additional” positive reinforcement
24
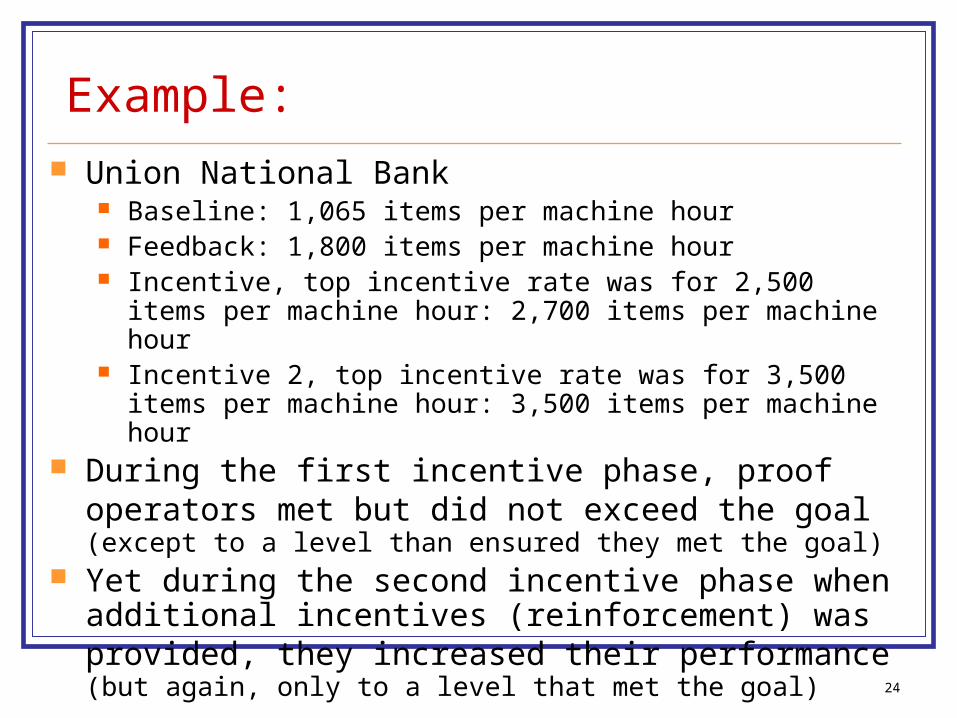
Example: Union National Bank
Baseline: 1,065 items per machine hour Feedback: 1,800 items per machine hour Incentive, top incentive rate was for 2,500 items per machine
hour: 2,700 items per machine hour Incentive 2, top incentive rate was for 3,500 items per machine
hour: 3,500 items per machine hour During the first incentive phase, proof operators met but
did not exceed the goal (except to a level than ensured they met the goal)
Yet during the second incentive phase when additional incentives (reinforcement) was provided, they increased their performance (but again, only to a level that met the goal)
25
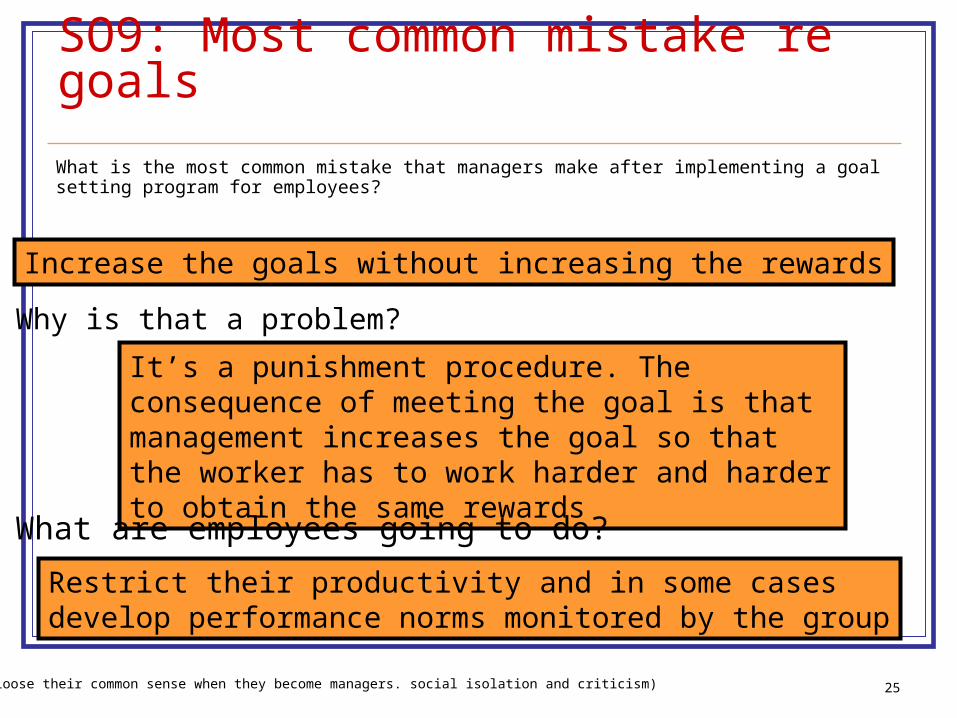
SO9: Most common mistake re goals
What is the most common mistake that managers make after implementing a goal setting program for employees?
Increase the goals without increasing the rewards
Why is that a problem?
It’s a punishment procedure. The consequence of meeting the goal is that management increases the goal so that the worker has to work harder and harder to obtain the same rewards
What are employees going to do?
Restrict their productivity and in some casesdevelop performance norms monitored by the group
(mgrs loose their common sense when they become managers. social isolation and criticism)
26
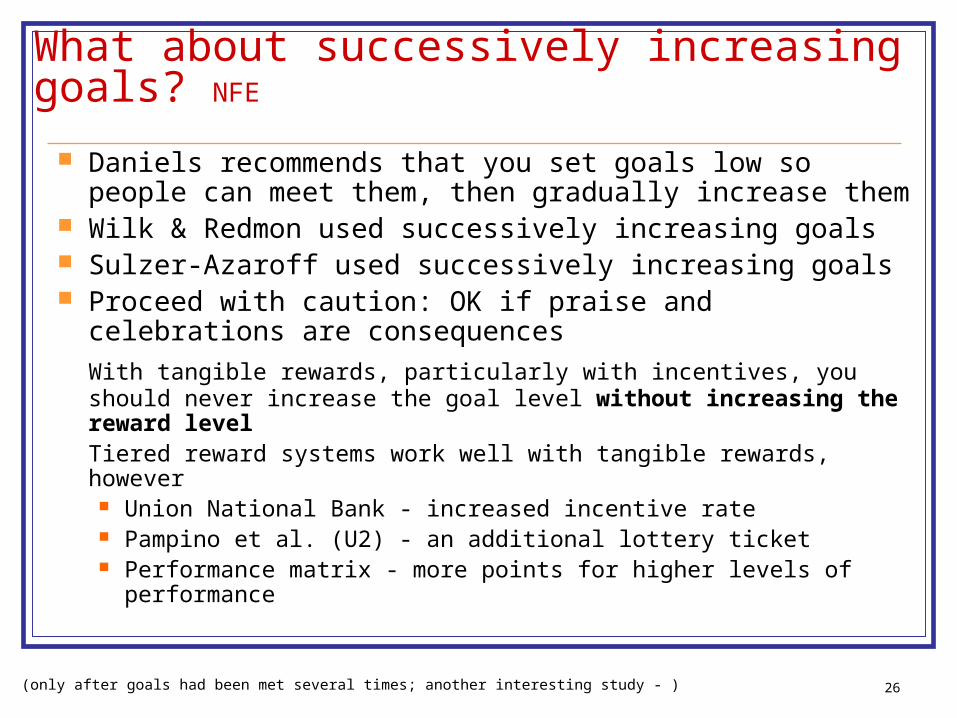
What about successively increasing goals? NFE
Daniels recommends that you set goals low so people can meet them, then gradually increase them
Wilk & Redmon used successively increasing goals Sulzer-Azaroff used successively increasing goals Proceed with caution: OK if praise and celebrations are
consequences
With tangible rewards, particularly with incentives, you should never increase the goal level without increasing the reward levelTiered reward systems work well with tangible rewards, however Union National Bank - increased incentive rate Pampino et al. (U2) - an additional lottery ticket Performance matrix - more points for higher levels of performance
(only after goals had been met several times; another interesting study - )
27
Schedules of Reinforcement
The basic schedules of reinforcement are emphasized way too much in OBM. They are not very relevant. In fact, I would argue they are not relevant at all. I’ll come back to this in a moment
I have provided definitions of basic schedules in SO10 (NFE) You need to know them for your exercise this week
28
SO11A: Is hourly pay is an example of a FI schedule?
Yes or no Why or why not?
(answer not on slide)
29
SO11B: FR3 example, NOT!
Goal of study: increase the extent to which college students rode buses on a college campus (Penn State)
Tokens that could be traded for merchandise from local stores served as the “reinforcers” (pop, reduced price on pizza, etc.)
Gave a token to every third person that got on the bus (FR3)
What is the major problem with calling this schedule an FR3?
30
Schedules of Reinforcement Back to Dickinson’s point: The basic schedules of
reinforcement tend to be emphasized way too much in OBM. They are not very, if at all relevant.
SO12: Hantula’s conclusions after reviewing the effects of schedules of reinforcement on organizational behavior - review covered 1971-1994 Reinforcement schedules (in comparison to hourly pay) are an
effective way to manage work, however The parameters of the schedule did not result in consistent
differences in performance. Rather, the presence of a contingent relationship between performance and rewards was the critical factor with respect to improving performance
Bucklin & Dickinson found the same thing in a review of monetary incentives
31
SO12: What does this mean?
Performance contingent rewards do increase performance, but different schedules of reinforcement (e.g., FR vs VR schedules, FR1 vs FR4, FR1 vs VR2, VR2 vs VR4) do not affect performance differently in work settings
(ABA presentation set up incentives for staff in human service setting - very nice study - spent many, many hours deciding what reinforcement schedule to use - wasted hours).
32
SO13: Why are these results differentthan the results of research on basic schedules?
In the operant laboratory, different schedules of reinforcement do generate different response rates and patterns of performance. So, what may account for the differences seen in the laboratory and in applied settings?
Before answering, why does anyone care? Why is this analysis important? Our basic principles of behavior have been called into question
(particularly by expectancy theorists in I/O) because humans do not show the same response patterns as nonhumans
That is, they claim this proves that our basic principles are incorrect
So, we have to be prepared to answer these criticisms and concerns
33
Two reasons why humans do not usually display the typical performance patterns displayed by nonhumans in an operant laboratory setting
1. Although schedules used in applied settings are indeed schedules of reinforcement, they are rarely, if ever the same schedules examined in the laboratory, even though they are called the same thing (e.g., FR1, FR3, etc.). Given that they are not the same, we should not expect the performance patterns to be the same
FR3 example earlier
34
Two reasons why humans do not usually display the typical performance patterns displayed by nonhumans in an operant laboratory setting
2. Adult humans tend to describe contingencies to themselves and then their behavior is controlled by their self-stated rules
FI: Slow responding is reinforced FR: Fast responding is reinforced Fergus Lowe’s (Welsh behavioral psychologist)
study with infants, 2-3 year olds and 5-year olds
(last slide on this)
35
Crawley et al. article, introduction I have included this article because it is the best one I have ever
seen with respect to improving sales behaviors and I would wager that most many of the behaviors identified in their exquisite analysis would generalize to other sales positions
Study was conducted by one of Ed Feeney’s consultants, Bill Crawley (I didn’t stress Feeney’s accomplishments in U1, but I recommend that you go back and read the Dickinson article for an historical perspective)
(NFE) Note the analysis at the beginning that was designed to determine the best opportunities for intervention, based on both the potential for improving performance (exemplar performer vs. average performer) and the economic pay-off of intervening on the performance
(back to feedback; old study)
36
SO14: What approach was not successful in identifying what made sales reps effective?
Surveys were sent to the top sales representatives in the country asking what is was that they did that made them so effective
This approach did not work because sales representatives could not describe the behaviors that made them successful
I am friendly It’s genetic - my parents were sales representatives You need to be “up” You need to be aggressive
General pointEven though workers are exemplary workers, they often can’t tell you what they do that makes them exemplary workers. Those behaviors are often contingency-shaped (controlled by direct-acting contingencies) and employees never have had to describe them (describing what you do and doing what you do are different behavioral repertoires)
Automobile mechanics Construction workers
37
SO15 (NFE): Exquisite specificity of the targeted behaviors
To determine the behaviors They observed 65 top performers Over a four month period of time For 1,000 hours Both inside the store and at in-home sales calls
Recorded the stimulus-response sequences That is, what were the antecedents that prompted a response by
the sales representative, and how did the sales representatives respond to those antecedents
Also interviewed customers for 50 hours Pilot tested the entire intervention in two stores
First with the consultant as the coach Then with the store manager as the coach (fidelity - did they
create an intervention that could be carried out by employees)
38
SO15 (NFE): Exquisite specificity of the targeted areas and behaviors, cont.
Eight areas with 5-11 behaviors in each area Customer greeted Customer needs identified Needs matched to store product and service benefits Objections identified and overcome Decision maker identified Close made Results of sales contact Follow-up action taken
(48 behaviors in addition to smiling, eye contact, natural voice, and use of customer’s name in each area)
39
SO15 (NFE): Exquisite specificity of the targeted areas and behaviors, cont.
Examples of behaviors in the Customer Greeted area Customers should be approached within 120 seconds after
entering the store The sales representative should stand within 3-4 feet of the
customer, smile and maintain eye contact The sales representative should approach the customer at a
normal pace and maintain a natural and relaxed posture Introduce self using first and last names and identify his/her
position Obtain the customer’s name and use it throughout the sales
interaction
40
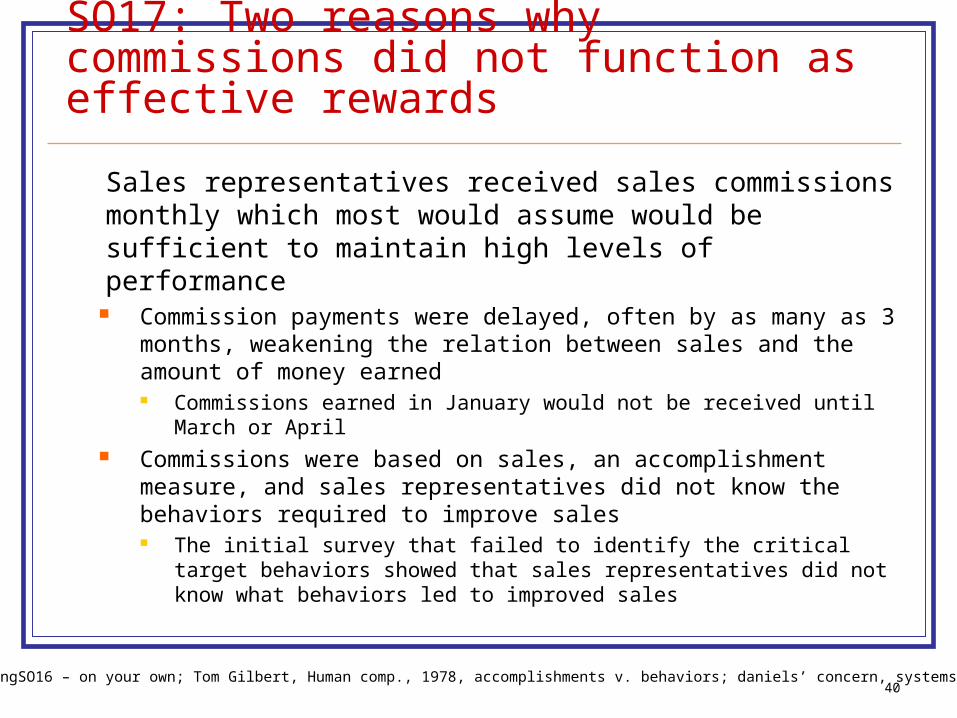
SO17: Two reasons why commissions did not function as effective rewards
Sales representatives received sales commissions monthly which most would assume would be sufficient to maintain high levels of performance
Commission payments were delayed, often by as many as 3 months, weakening the relation between sales and the amount of money earned Commissions earned in January would not be received until March or
April Commissions were based on sales, an accomplishment
measure, and sales representatives did not know the behaviors required to improve sales The initial survey that failed to identify the critical target behaviors
showed that sales representatives did not know what behaviors led to improved sales
(skippingSO16 – on your own; Tom Gilbert, Human comp., 1978, accomplishments v. behaviors; daniels’ concern, systems v. PM)
41
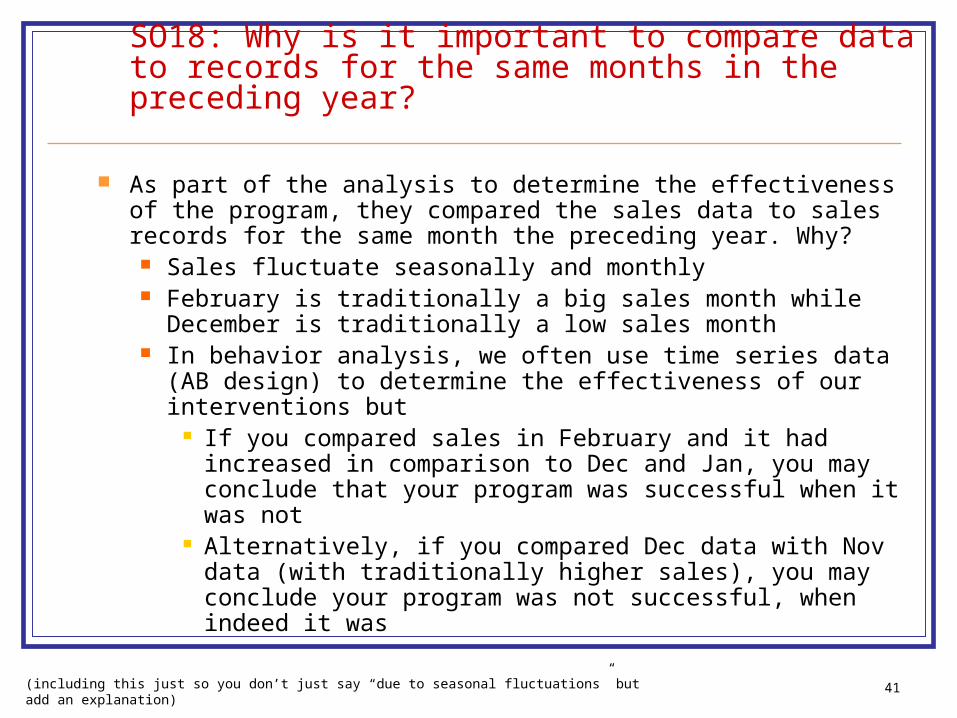
SO18: Why is it important to compare data to records for the same months in the preceding year?
As part of the analysis to determine the effectiveness of the program, they compared the sales data to sales records for the same month the preceding year. Why? Sales fluctuate seasonally and monthly February is traditionally a big sales month while December is
traditionally a low sales month In behavior analysis, we often use time series data (AB
design) to determine the effectiveness of our interventions but If you compared sales in February and it had increased in
comparison to Dec and Jan, you may conclude that your program was successful when it was not
Alternatively, if you compared Dec data with Nov data (with traditionally higher sales), you may conclude your program was not successful, when indeed it was
(including this just so you don’t just say “due to seasonal fluctuations” but add an explanation)
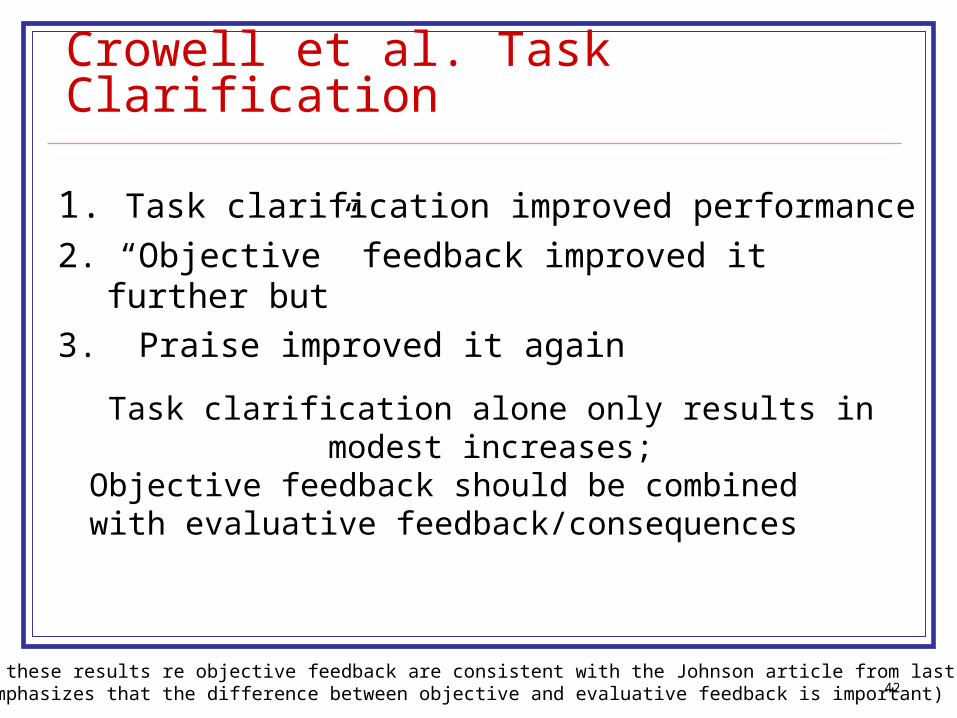
Crowell et al. Task Clarification
1. Task clarification improved performance
2. “Objective” feedback improved it further but
3. Praise improved it again
42
Task clarification alone only results in modest increases;Objective feedback should be combined with evaluative feedback/consequences
(note that these results re objective feedback are consistent with the Johnson article from last unitand thus emphasizes that the difference between objective and evaluative feedback is important)
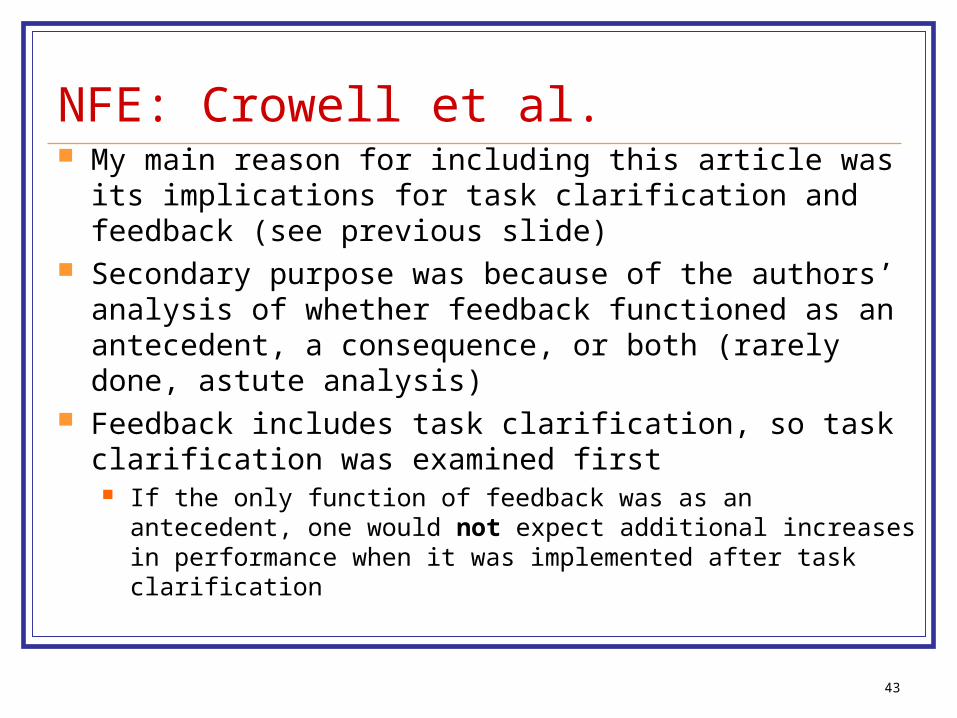
NFE: Crowell et al. My main reason for including this article was its
implications for task clarification and feedback (see previous slide)
Secondary purpose was because of the authors’ analysis of whether feedback functioned as an antecedent, a consequence, or both (rarely done, astute analysis)
Feedback includes task clarification, so task clarification was examined first If the only function of feedback was as an antecedent, one would
not expect additional increases in performance when it was implemented after task clarification
43
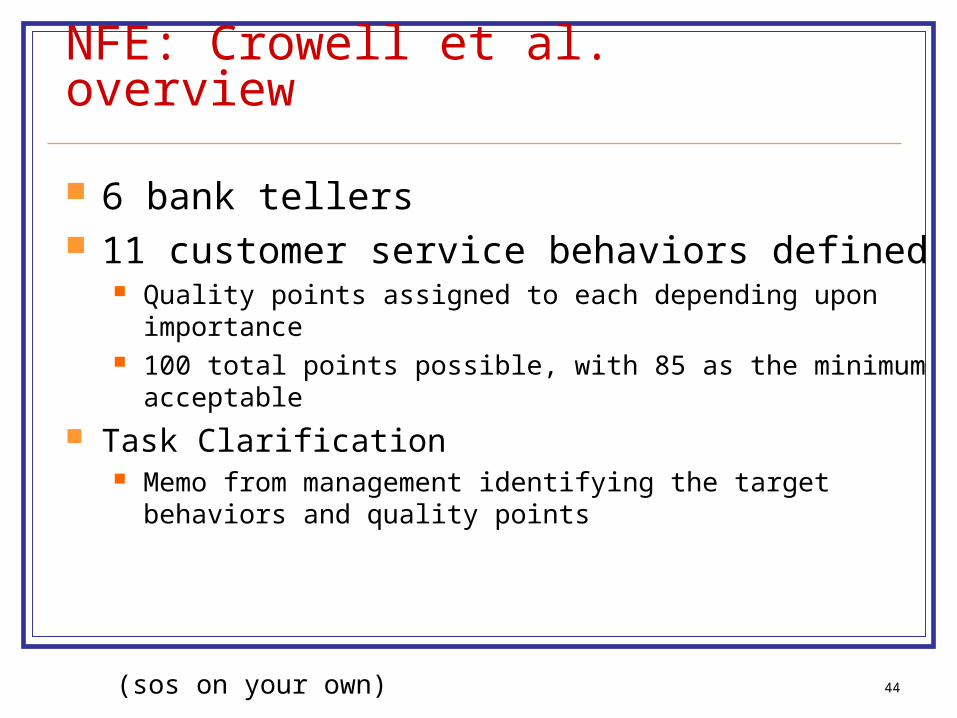
NFE: Crowell et al. overview
6 bank tellers 11 customer service behaviors defined
Quality points assigned to each depending upon importance 100 total points possible, with 85 as the minimum acceptable
Task Clarification Memo from management identifying the target behaviors and
quality points
44(sos on your own)
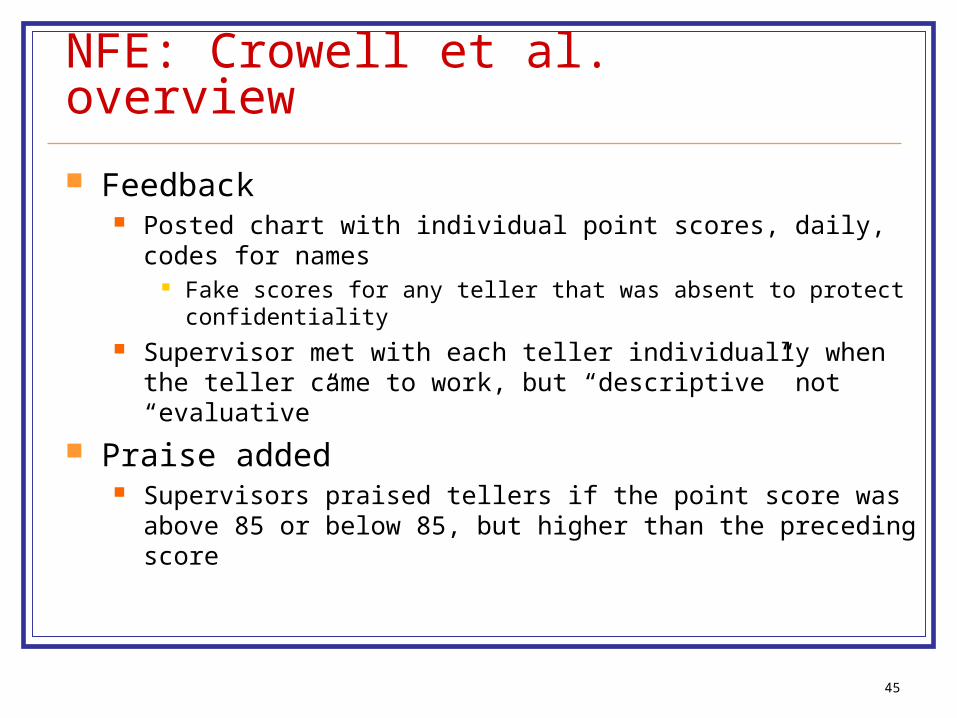
NFE: Crowell et al. overview
Feedback Posted chart with individual point scores, daily, codes for names
Fake scores for any teller that was absent to protect confidentiality Supervisor met with each teller individually when the teller came to
work, but “descriptive” not “evaluative”
Praise added Supervisors praised tellers if the point score was above 85 or below
85, but higher than the preceding score
45
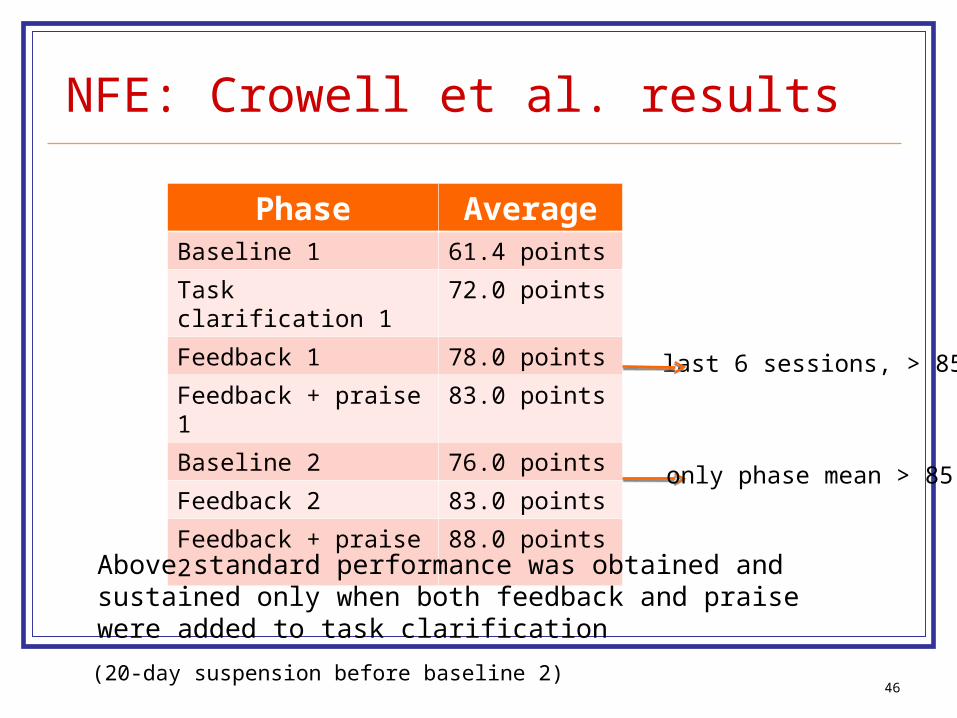
NFE: Crowell et al. results
46
Phase AverageBaseline 1 61.4 points
Task clarification 1 72.0 points
Feedback 1 78.0 points
Feedback + praise 1 83.0 points
Baseline 2 76.0 points
Feedback 2 83.0 points
Feedback + praise 2 88.0 points
Above standard performance was obtained and sustained only when both feedback and praise were added to task clarification
last 6 sessions, > 85
only phase mean > 85
(20-day suspension before baseline 2)
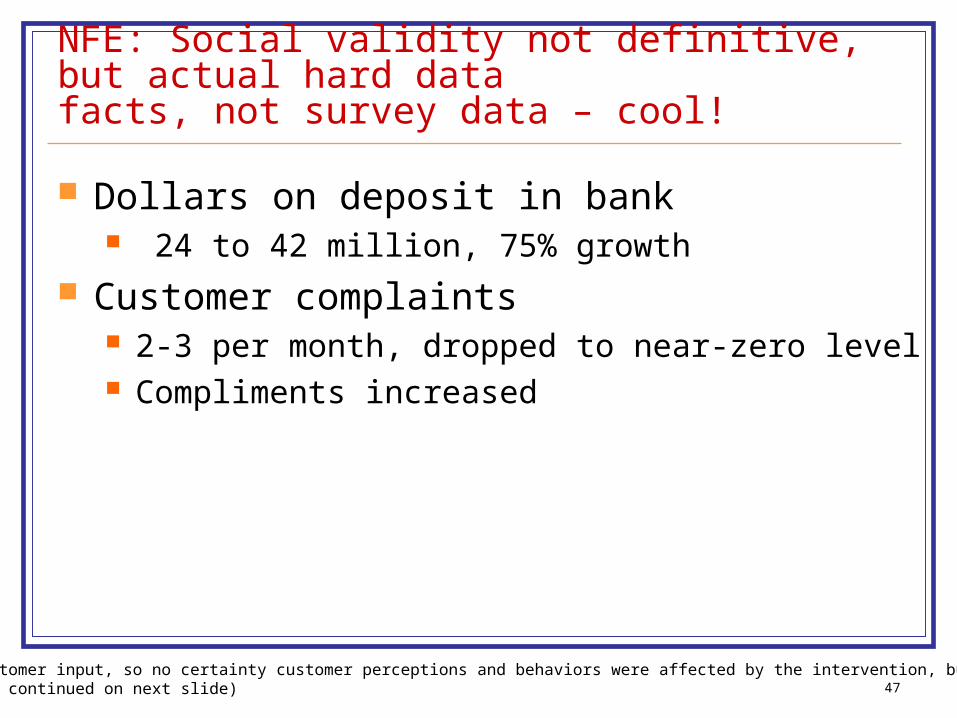
NFE: Social validity not definitive, but actual hard datafacts, not survey data – cool!
Dollars on deposit in bank 24 to 42 million, 75% growth
Customer complaints 2-3 per month, dropped to near-zero level Compliments increased
47
(no customer input, so no certainty customer perceptions and behaviors were affected by the intervention, but …;results continued on next slide)
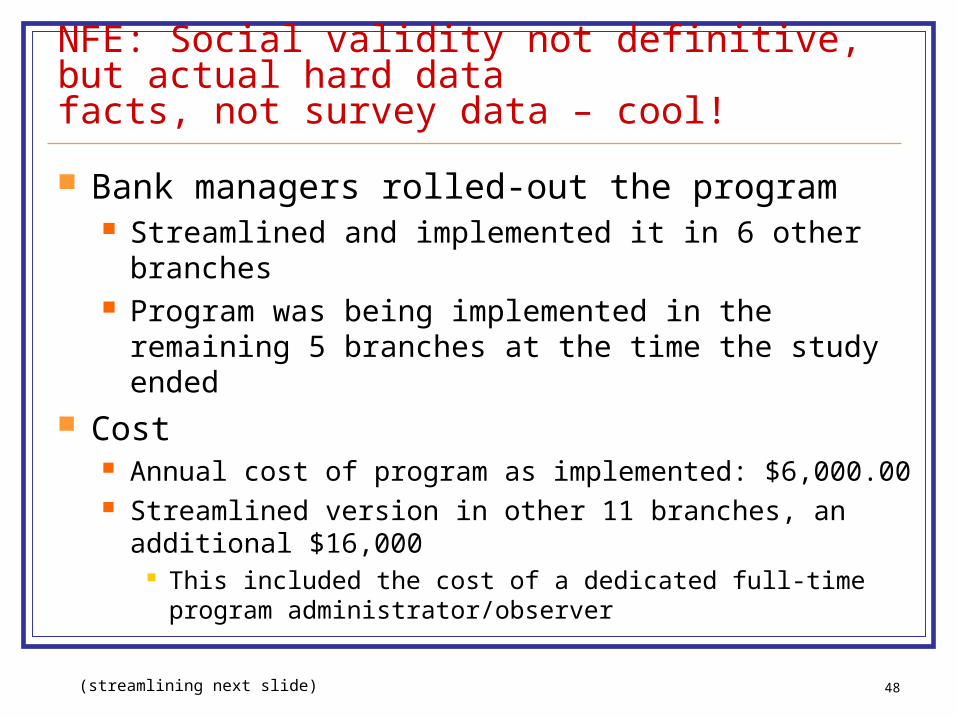
NFE: Social validity not definitive, but actual hard datafacts, not survey data – cool!
Bank managers rolled-out the program Streamlined and implemented it in 6 other branches Program was being implemented in the remaining 5
branches at the time the study ended Cost
Annual cost of program as implemented: $6,000.00 Streamlined version in other 11 branches, an additional
$16,000 This included the cost of a dedicated full-time program
administrator/observer
48(streamlining next slide)
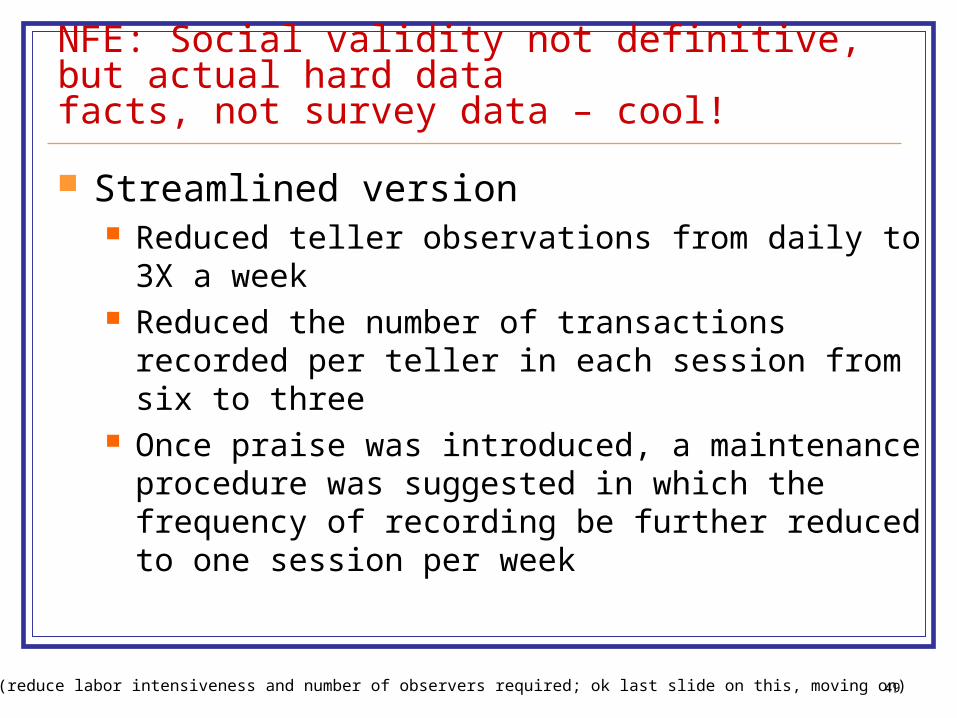
NFE: Social validity not definitive, but actual hard datafacts, not survey data – cool!
Streamlined version Reduced teller observations from daily to 3X a week Reduced the number of transactions recorded per teller
in each session from six to three Once praise was introduced, a maintenance procedure
was suggested in which the frequency of recording be further reduced to one session per week
49(reduce labor intensiveness and number of observers required; ok last slide on this, moving on)
Gaetani & Johnson, cash shortages, intro
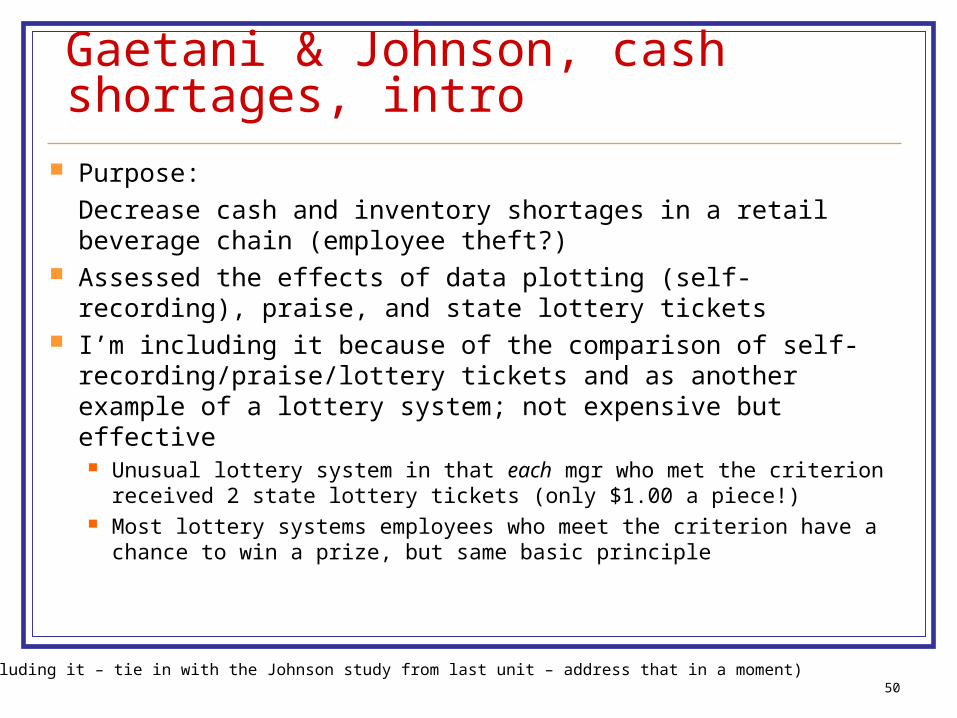
Purpose:
Decrease cash and inventory shortages in a retail beverage chain (employee theft?)
Assessed the effects of data plotting (self-recording), praise, and state lottery tickets
I’m including it because of the comparison of self-recording/praise/lottery tickets and as another example of a lottery system; not expensive but effective Unusual lottery system in that each mgr who met the criterion
received 2 state lottery tickets (only $1.00 a piece!) Most lottery systems employees who meet the criterion have a
chance to win a prize, but same basic principle
50
(also including it – tie in with the Johnson study from last unit – address that in a moment)
Gaetani & Johnson, cash shortages, intro
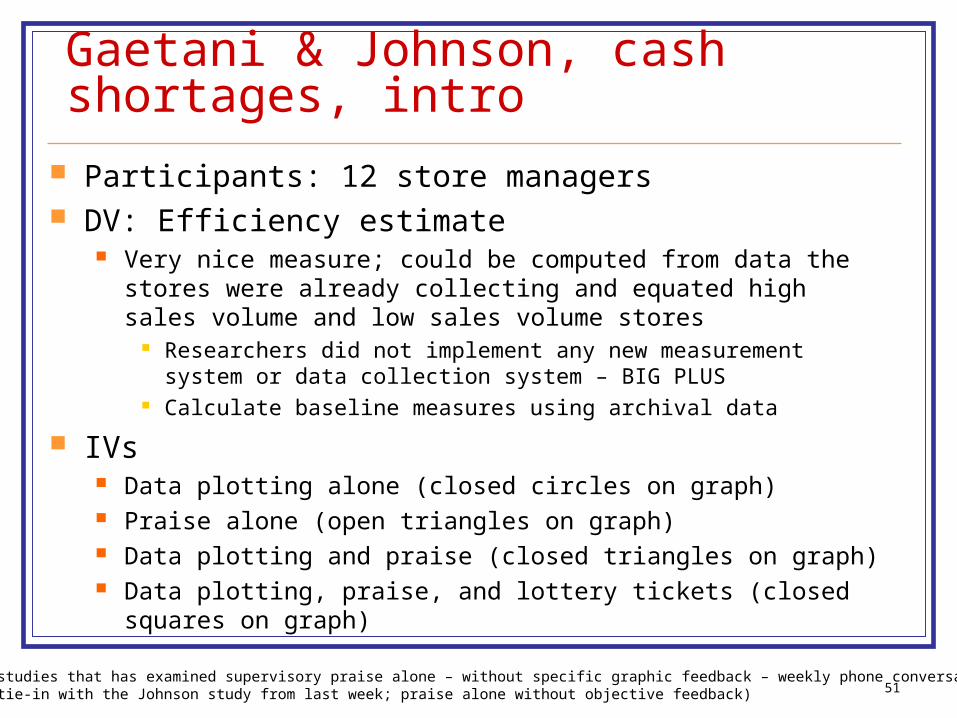
Participants: 12 store managers DV: Efficiency estimate
Very nice measure; could be computed from data the stores were already collecting and equated high sales volume and low sales volume stores
Researchers did not implement any new measurement system or data collection system – BIG PLUS
Calculate baseline measures using archival data
IVs Data plotting alone (closed circles on graph) Praise alone (open triangles on graph) Data plotting and praise (closed triangles on graph) Data plotting, praise, and lottery tickets (closed squares on graph)
51(one of few studies that has examined supervisory praise alone – without specific graphic feedback – weekly phone conversations – this is the tie-in with the Johnson study from last week; praise alone without objective feedback)
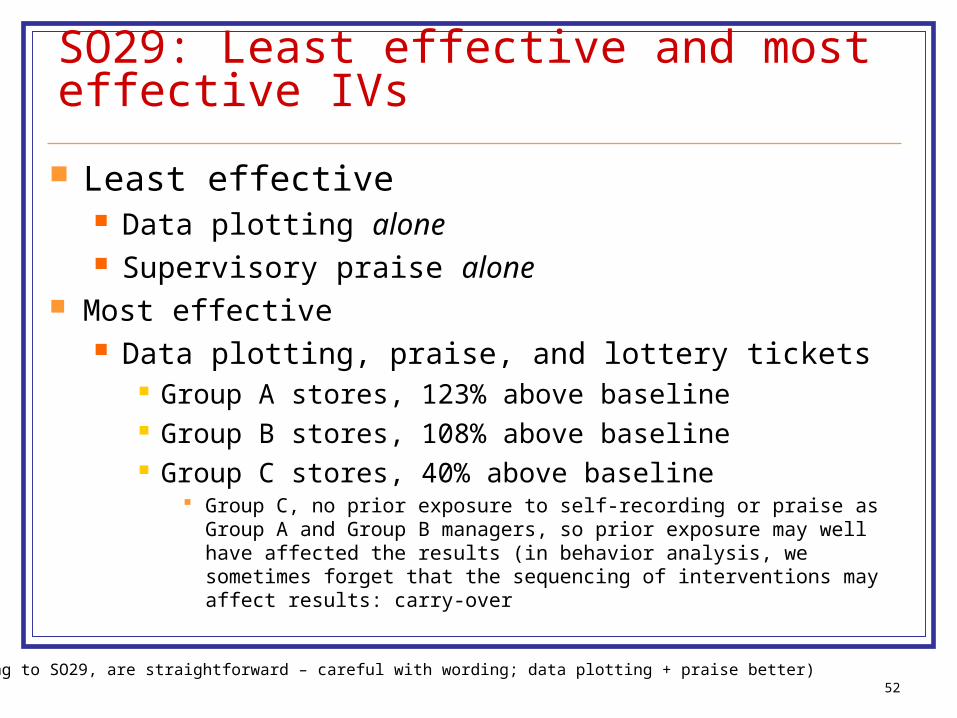
SO29: Least effective and most effective IVs
Least effective Data plotting alone Supervisory praise alone
Most effective Data plotting, praise, and lottery tickets
Group A stores, 123% above baseline Group B stores, 108% above baseline Group C stores, 40% above baseline
Group C, no prior exposure to self-recording or praise as Group A and Group B managers, so prior exposure may well have affected the results (in behavior analysis, we sometimes forget that the sequencing of interventions may affect results: carry-over
52
(skipping to SO29, are straightforward – careful with wording; data plotting + praise better)
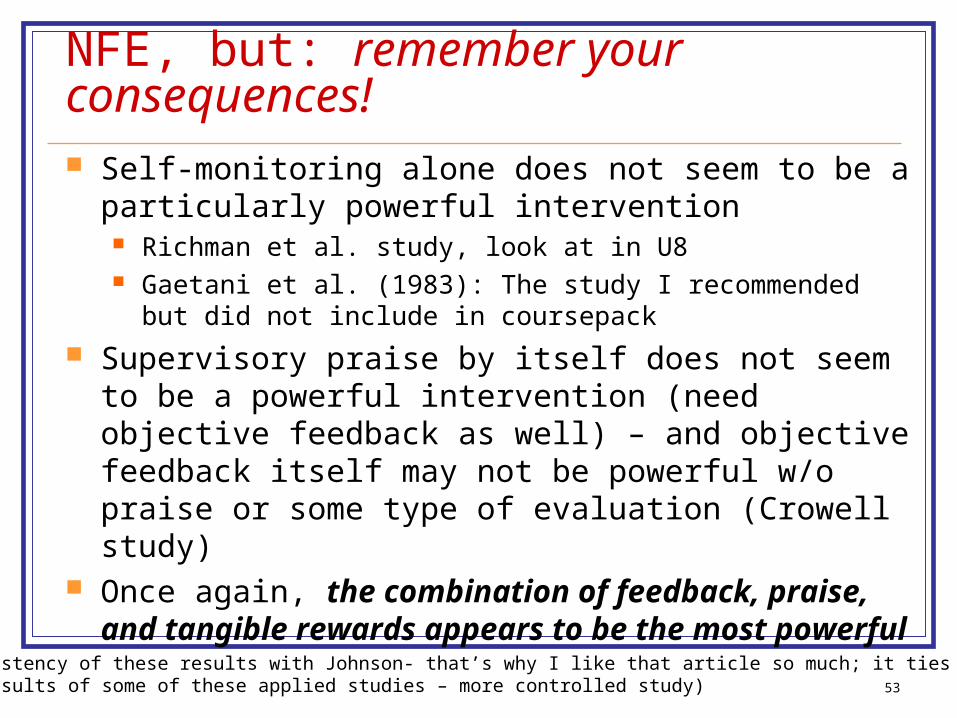
NFE, but: remember your consequences! Self-monitoring alone does not seem to be a particularly
powerful intervention Richman et al. study, look at in U8 Gaetani et al. (1983): The study I recommended but did not
include in coursepack
Supervisory praise by itself does not seem to be a powerful intervention (need objective feedback as well) – and objective feedback itself may not be powerful w/o praise or some type of evaluation (Crowell study)
Once again, the combination of feedback, praise, and tangible rewards appears to be the most powerful
53
(note the consistency of these results with Johnson- that’s why I like that article so much; it ties in andExplains the results of some of these applied studies – more controlled study)
54
Wilk & Redmon article
Study was conducted as Braksick’s (Wilk’s) doctoral dissertation while she was at WMU
Excellent model of how to do research in the real world; few better examples
Follow-up of a study conducted at WMU in our admissions and orientation office Pam Liberacki, Director of Admissions and Orientation, who
retired three years ago Braksick was hired as a consultant to implement the
program at UM based on the success of the program here
(not going to go over many of the Sos; one of CLG’s founders in 1993 – both she and Julie Smith have now left; this study wasExcellent predictor of her future work – excellent, excellent work)
55
Wilk & Redmon intro, cont.
Participants were 16 clerical workers at UM DVs
Number of tasks completed Performance efficiency Employee satisfaction
56
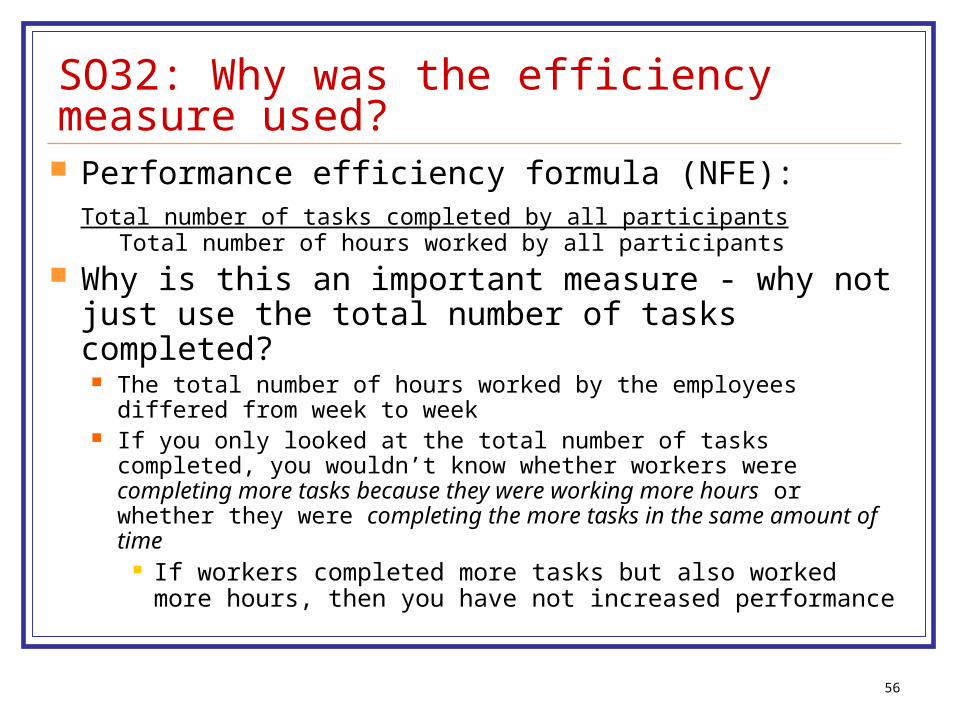
SO32: Why was the efficiency measure used? Performance efficiency formula (NFE):
Total number of tasks completed by all participants Total number of hours worked by all participants
Why is this an important measure - why not just use the total number of tasks completed? The total number of hours worked by the employees differed from
week to week If you only looked at the total number of tasks completed, you
wouldn’t know whether workers were completing more tasks because they were working more hours or whether they were completing the more tasks in the same amount of time
If workers completed more tasks but also worked more hours, then you have not increased performance
57
Skipping to SO37: What procedure was used to verify that the supervisor actually delivered the feedback?
After feedback was given during the week day, the employee placed a check mark on the next entry on their data sheet If you use a graphic feedback display, have employees
initial the graphic feedback display If you post a graph, have employees initial the posted
graph More modern technology: send the graph or feedback
via email with verification that the email has been opened by the recipient
not as good - employees could conceivably open the email and not look at the feedback, but better than nothing
(I am pointing this out because it is an excellent procedure - it’s simple, doesn’t require any extra effort on the part of the researcher, yet does confirmthat feedback was provided as it was supposed to be provided - fidelity of implementation of the IV - a lot of our students at WMU have used this orsomething similar in their studies )
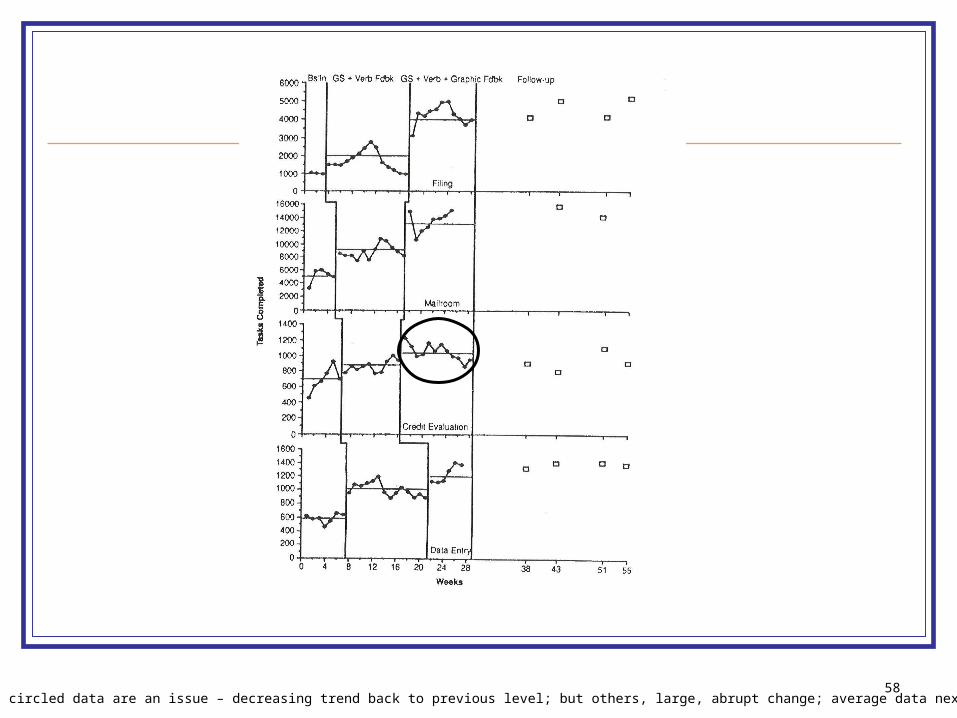
58(Results!; circled data are an issue – decreasing trend back to previous level; but others, large, abrupt change; average data next)
59
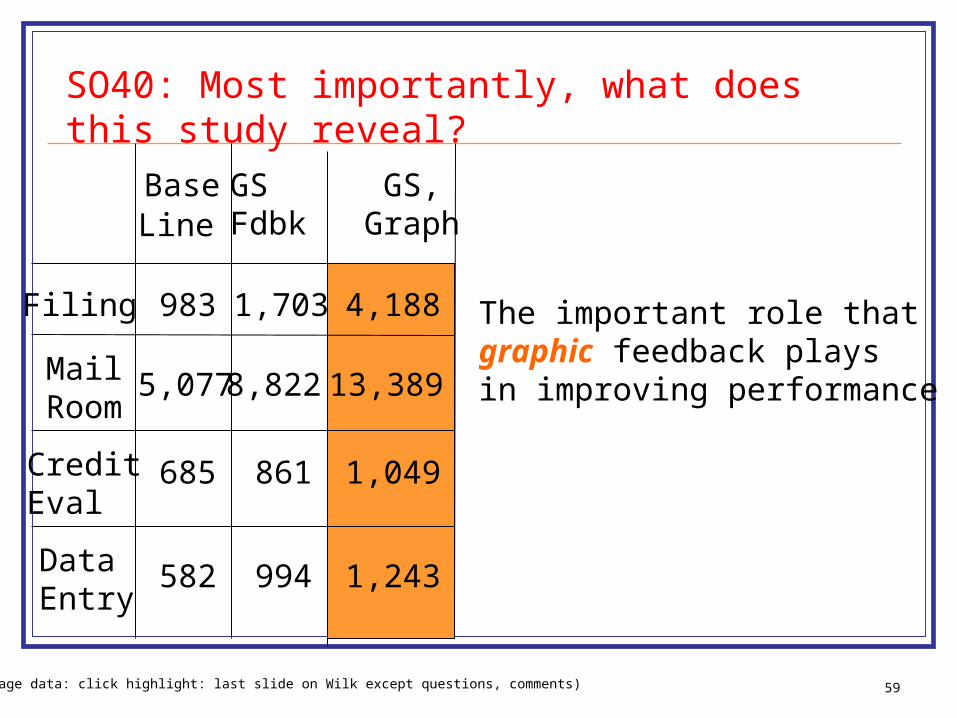
Base GS GS, Fdbk Graph
Filing 983 1,703 4,188
5,077 8,822 13,389MailRoom
685 861 1,049CreditEval
582 994 1,243DataEntry
SO40: Most importantly, what does this study reveal?
The important role thatgraphic feedback playsin improving performance
(average data: click highlight: last slide on Wilk except questions, comments)
Line
60
Questions over Wilk and Redmon?
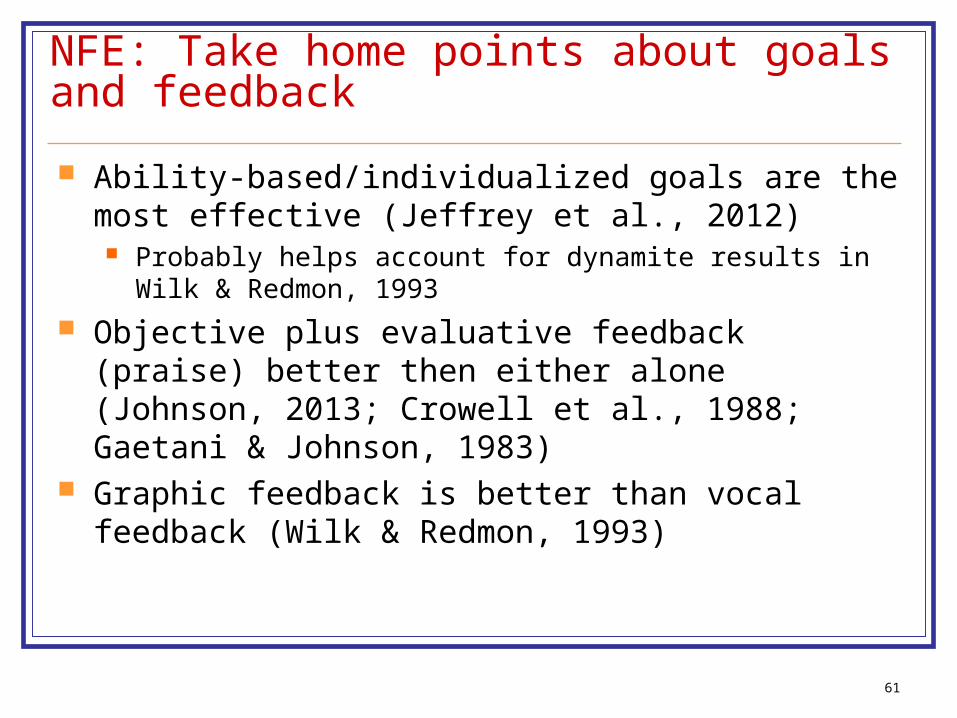
NFE: Take home points about goals and feedback
Ability-based/individualized goals are the most effective (Jeffrey et al., 2012) Probably helps account for dynamite results in Wilk & Redmon,
1993
Objective plus evaluative feedback (praise) better then either alone (Johnson, 2013; Crowell et al., 1988; Gaetani & Johnson, 1983)
Graphic feedback is better than vocal feedback (Wilk & Redmon, 1993)
61
62
In-class exercise
Was the continuous reinforcement (CRF) schedule used in the Latham & Dossett article a true CRF schedule?
Was the variable ratio 4 (VR4) schedule used in the Latham & Dossett article a true VR4 schedule?