Embed Size (px)
Citation preview

1
Uncertainty in Extrapolations of Predictive Land Change Models
R Gil Pontius Jr ([email protected])Joe Spencer ([email protected])
Prepared for presentation at the Open Meeting of the Global Environmental Change Research Community, Montreal, Canada,
16-18 October, 2003.

2
Major Points
• Validation is a waste of time,– unless you use the validation statistic to express
the level of certainty of predictions of the unknown.
• The prediction’s accuracy approaches random as the prediction’s time interval grows.– We estimate how fast the accuracy approaches
random.

3
Worcester Massachusettsand nine surrounding towns

4
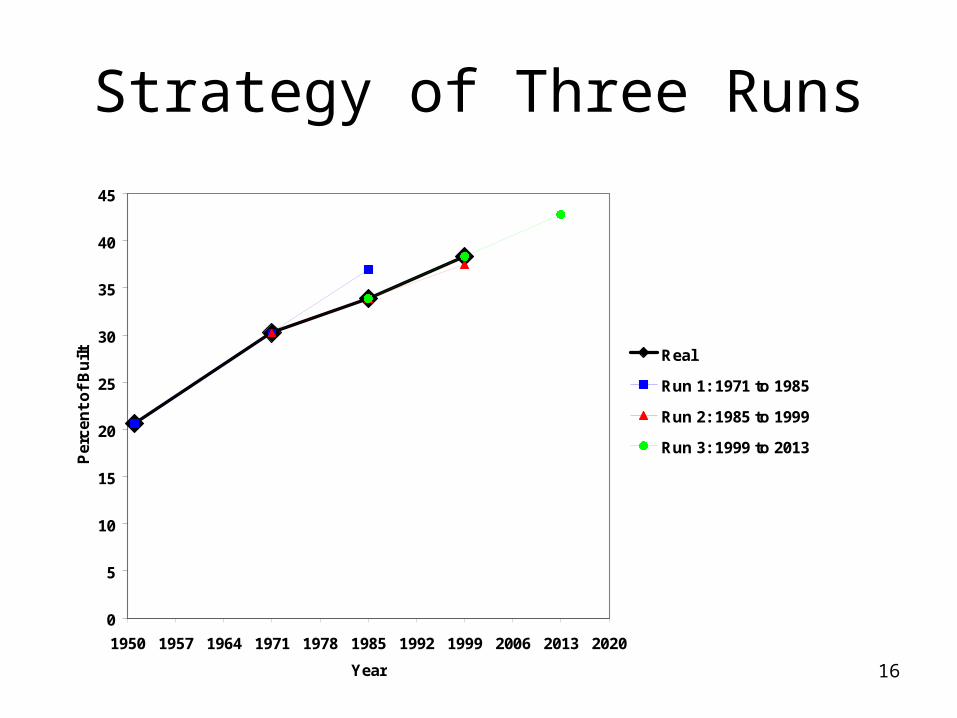
Strategy of Three Runs
0
5
10
15
20
25
30
35
40
45
1950 1957 1964 1971 1978 1985 1992 1999 2006 2013 2020
Year
Per
cen
t o
f B
uil
t Real
Run 1: 1971 to 1985
Run 2: 1985 to 1999
Run 3: 1999 to 2013

5
Percent Built versus Geology 1971
0 5 10 15 20 25 30 35 40 45 50
Sand and Gravel
Till and Bedrock
Floodplain Alluvium
Ge
olo
gy
Typ
e
Lubrication Values

6
Percent Built versus Geology 1985
0 5 10 15 20 25 30 35 40 45 50
Sand and Gravel
Till and Bedrock
Floodplain Alluvium
Ge
olo
gy
Typ
e
Lubrication Values
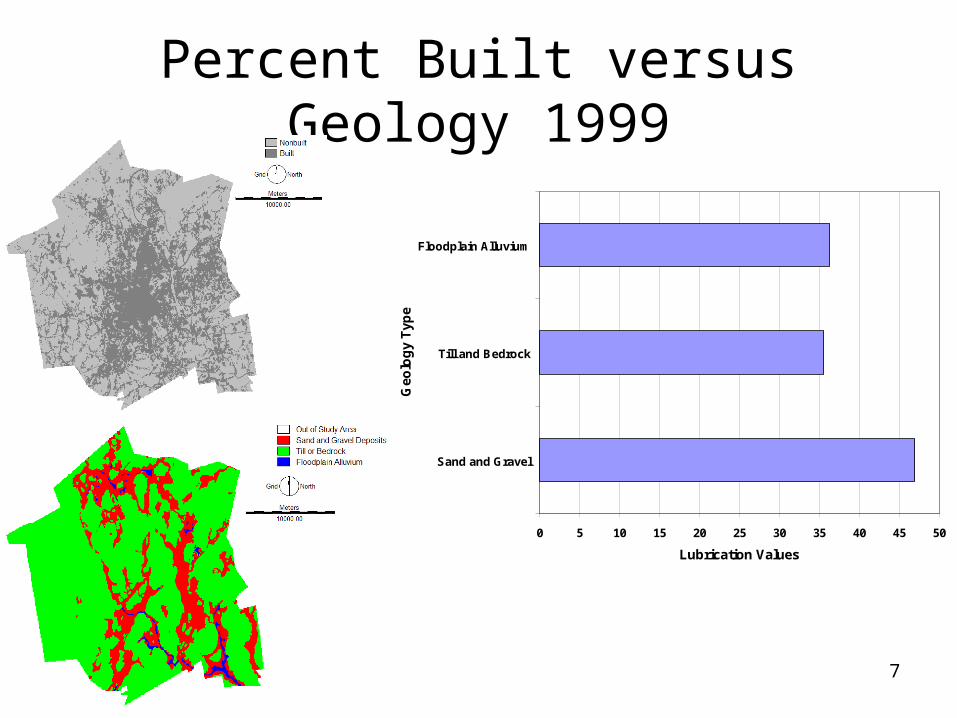
7
Percent Built versus Geology 1999
0 5 10 15 20 25 30 35 40 45 50
Sand and Gravel
Till and Bedrock
Floodplain Alluvium
Ge
olo
gy
Typ
e
Lubrication Values

8
Percent Built versus Slope 1971
0 5 10 15 20 25 30 35 40 45 50
[0,1)[2,3)[4,5)[6,7)[8,9)
[10,11)[12,13)[14,15)[16,17)[18,19)[20,21)[22,23)[24,25)[26,27)[28,29)[30,31)[32,33)[34,35)[36,37)[38,39)Water
Slo
pe
Lubrication Values

9
Percent Built versus Slope 1985
0 5 10 15 20 25 30 35 40 45 50
[0,1)[2,3)[4,5)[6,7)[8,9)
[10,11)[12,13)[14,15)[16,17)[18,19)[20,21)[22,23)[24,25)[26,27)[28,29)[30,31)[32,33)[34,35)[36,37)[38,39)Water
Slo
pe
Lubrication Values

10
Percent Built versus Slope 1999
0 5 10 15 20 25 30 35 40 45 50
[0,1)[2,3)[4,5)[6,7)[8,9)
[10,11)[12,13)[14,15)[16,17)[18,19)[20,21)[22,23)[24,25)[26,27)[28,29)[30,31)[32,33)[34,35)[36,37)[38,39)Water
Slo
pe
Lubrication Values

11
Real Built 1971

12
Simulated Built 1971-1985

13
Real Built 1971-1985

14
Observed Accuracy Run 1: 1985
0
10
20
30
40
50
60
70
80
90
100
Pe
rce
nt
of
La
nd
sc
ap
e error due to quantity
error due to location
correct due to location
correct due to quantity
correct due to chance
4%
6%

15
Estimated Accuracy 1971-2013
0
10
20
30
40
50
60
70
80
90
100
19
71
19
78
19
85
19
92
19
99
20
06
20
13
Time
Pe
rce
nt
of
La
nd
sc
ap
e
Error due to quantity
Error due to location
Correct due to location
Correct due to quantity
Correct due to random
16
Strategy of Three Runs
0
5
10
15
20
25
30
35
40
45
1950 1957 1964 1971 1978 1985 1992 1999 2006 2013 2020
Year
Per
cen
t o
f B
uil
t Real
Run 1: 1971 to 1985
Run 2: 1985 to 1999
Run 3: 1999 to 2013

17
Expected Accuracy 1985-2013
0
10
20
30
40
50
60
70
80
90
100
19
85
19
92
19
99
20
06
20
13
Time
Pe
rce
nt
of
La
nd
sc
ap
e
Error due to quantity
Error due to location
Correct due to location
Correct due to quantity
Correct due to random

18
Expected Accuracy Run 2: 1999
0
10
20
30
40
50
60
70
80
90
100
Pe
rce
nt
of
La
nd
sc
ap
e
error due to quantity
error due to location
correct due to location
correct due to quantity
correct due to chance
4%
6%

19
Real Built 1985
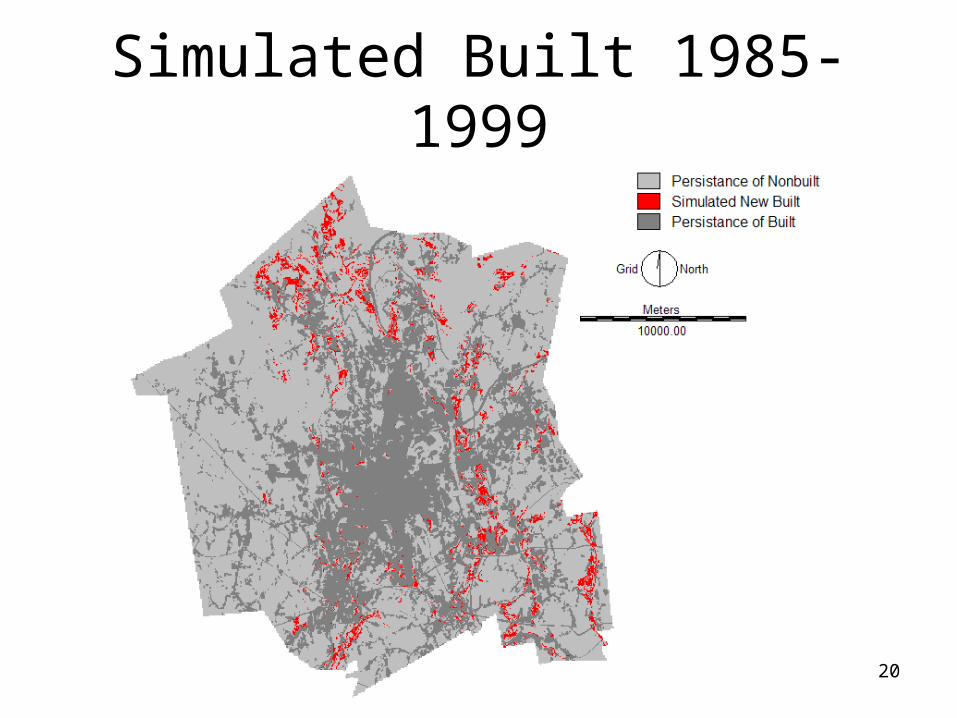
20
Simulated Built 1985-1999

21
Real Built 1985-1999

22
Accuracy Run 2: 1999
0
10
20
30
40
50
60
70
80
90
100
Pe
rce
nt
of
La
nd
sc
ap
e error due to quantity
error due to location
correct due to location
correct due to quantity
correct due to chance
0
10
20
30
40
50
60
70
80
90
100
Pe
rce
nt
of
La
nd
sc
ap
e error due to quantity
error due to location
correct due to location
correct due to quantity
correct due to chance
Observed
1% Quantity Error
9% Location Error
Expected
4% Quantity Error
6% Location Error

23
Expected Accuracy Run 3: 1999-2013
0
10
20
30
40
50
60
70
80
90
100
19
99
20
06
20
13
Time
Pe
rce
nt
of
La
nd
sc
ap
e
Error due to quantity
Error due to location
Correct due to location
Correct due to quantity
Correct due to random
1%
9%

24
Simulated Built 1999-2013

25
Expected Accuracy 1999-2199
0
10
20
30
40
50
60
70
80
90
1001
99
9
20
99
21
99
Time
Pe
rce
nt
of
La
nd
sc
ap
e
Error due to quantity
Error due to location
Correct due to location
Correct due to quantity
Correct due to random

26
Expected Accuracy 1985-2185
0
10
20
30
40
50
60
70
80
90
1001
98
5
20
85
21
85
Time
Pe
rce
nt
of
La
nd
sc
ap
e
Error due to quantity
Error due to location
Correct due to location
Correct due to quantity
Correct due to random

27
Major Points
• Validation is a waste of time,– unless you use the validation statistic to express
the level of certainty of predictions of the unknown.
• The prediction’s accuracy approaches random as the prediction’s time interval grows.– We estimate how fast the accuracy approaches
random.

28
Method is based on:Pontius. 2002. Statistical methods to partition effects of quantity and location during comparison of categorical maps at multiple resolutions. Photogrammetric Engineering & Remote Sensing 68(10). pp. 1041-1049.PDF file is available at www.clarku.edu/~rpontius or [email protected]
National Science Foundation funded this via: Center for Integrated Study of the Human Dimensions of Global ChangeHuman Environment Regional Observatory (HERO)
Plugs & Acknowledgements