Embed Size (px)
Citation preview
1
Twentieth century trends in inequalities in housing consumption:
The case of housing space in England and Wales, 1911-2001
Paper presented to the 2012 Social Policy Association conference, Social Policy in an unequal world,
University of York, 16th-18th July 2012Rebecca Tunstall, Centre for Housing Policy, Uni. of York.
2
Introduction
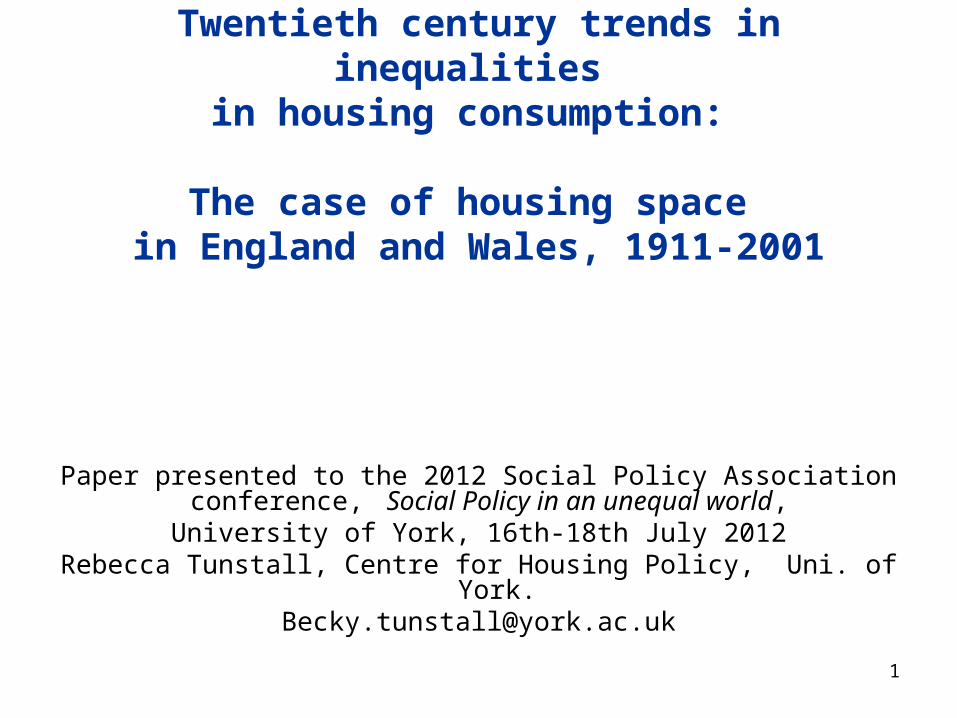
Inequality in consumption has been less explored less than inequality in income
Housing is an important area of consumptionThere are strong arguments for worrying about housing consumption in
relative rather than/as well as absolute terms, where data and measures allow
This paper presents a case study of relative housing consumption, measured via housing space
Using a long-term perspective, and relative measures, it argues:1. We need to reassess assumptions about past achievements on
overcrowding2. Housing space inequality are similar to inequalities in income, and by
some measures are growing3. New space supply and demand problems appear to have emerged over
the past 30 years4. Current policy will exacerbate inequalities, and old-fashioned absolute
problems are on the increase.
3
Absolute housing space standards
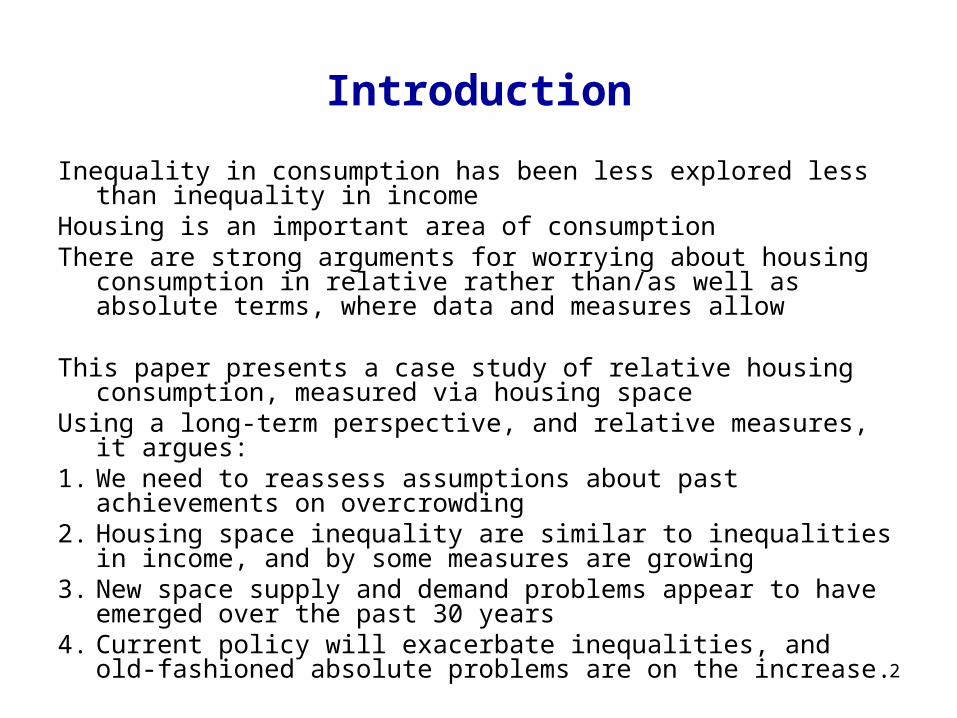
‘Overcrowding’• Households with fewer than 0.5/1/1.5 rooms per person (C19th-)
Bedroom standard’ (1960-)A bedroom for:• Each married/cohabiting couple;• Any other person aged 21+;• Any pair aged 10-20 of the same sex;• Any pair aged under 10.
- The basis for most social rented allocations today (Pawson et al. 2009)’
4
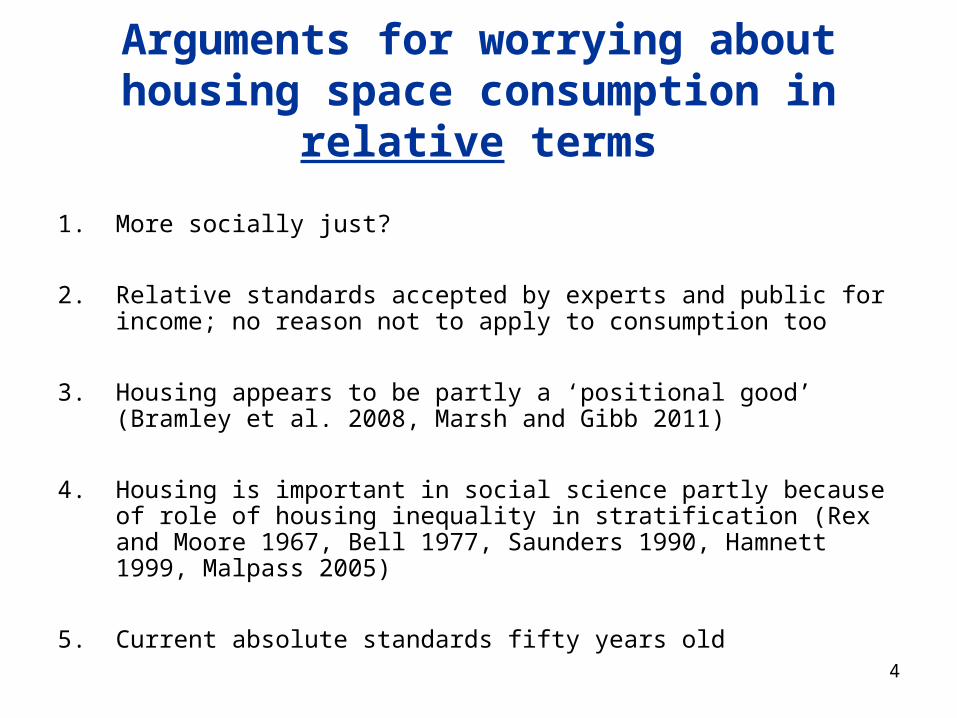
Arguments for worrying about housing space consumption in relative terms
1. More socially just?
2. Relative standards accepted by experts and public for income; no reason not to apply to consumption too
3. Housing appears to be partly a ‘positional good’ (Bramley et al. 2008, Marsh and Gibb 2011)
4. Housing is important in social science partly because of role of housing inequality in stratification (Rex and Moore 1967, Bell 1977, Saunders 1990, Hamnett 1999, Malpass 2005)
5. Current absolute standards fifty years old
5
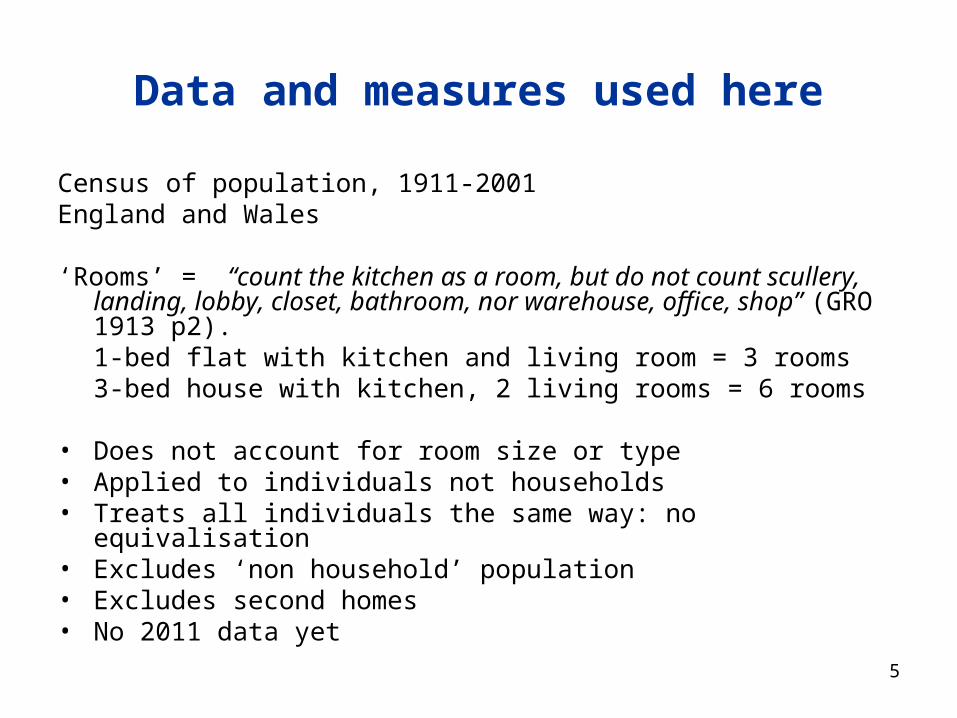
Data and measures used here
Census of population, 1911-2001England and Wales
‘Rooms’ = “count the kitchen as a room, but do not count scullery, landing, lobby, closet, bathroom, nor warehouse, office, shop” (GRO 1913 p2).
1-bed flat with kitchen and living room = 3 rooms 3-bed house with kitchen, 2 living rooms = 6 rooms
• Does not account for room size or type• Applied to individuals not households• Treats all individuals the same way: no equivalisation• Excludes ‘non household’ population• Excludes second homes• No 2011 data yet
6
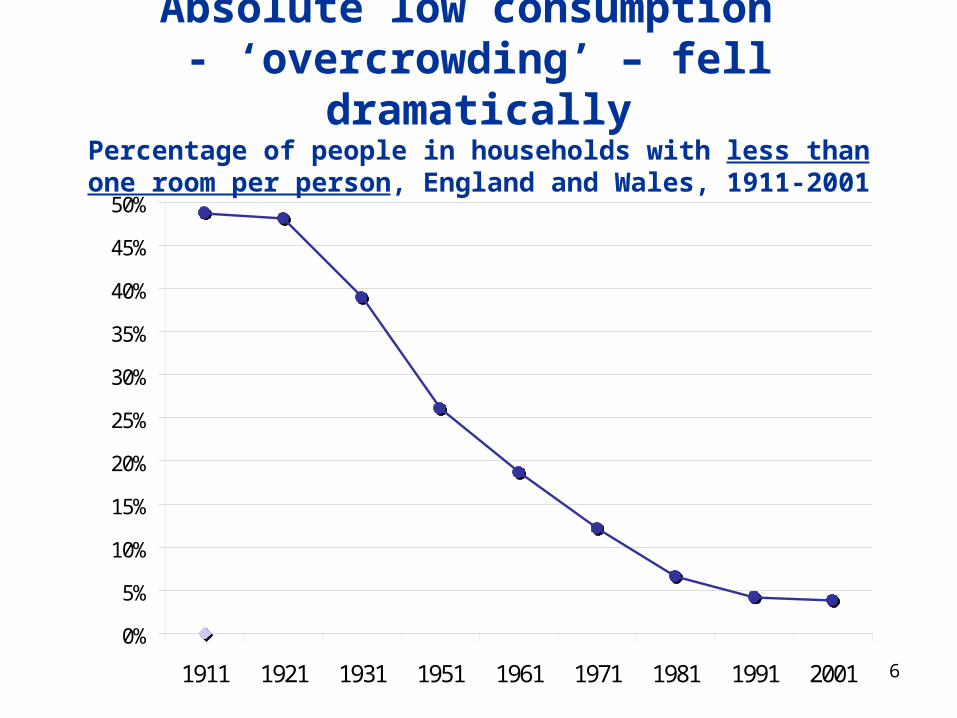
Absolute low consumption - ‘overcrowding’ – fell dramatically
Percentage of people in households with less than one room per person, England and Wales, 1911-2001
0%
5%
10%
15%
20%
25%
30%
35%
40%
45%
50%
1911 1921 1931 1951 1961 1971 1981 1991 2001
7
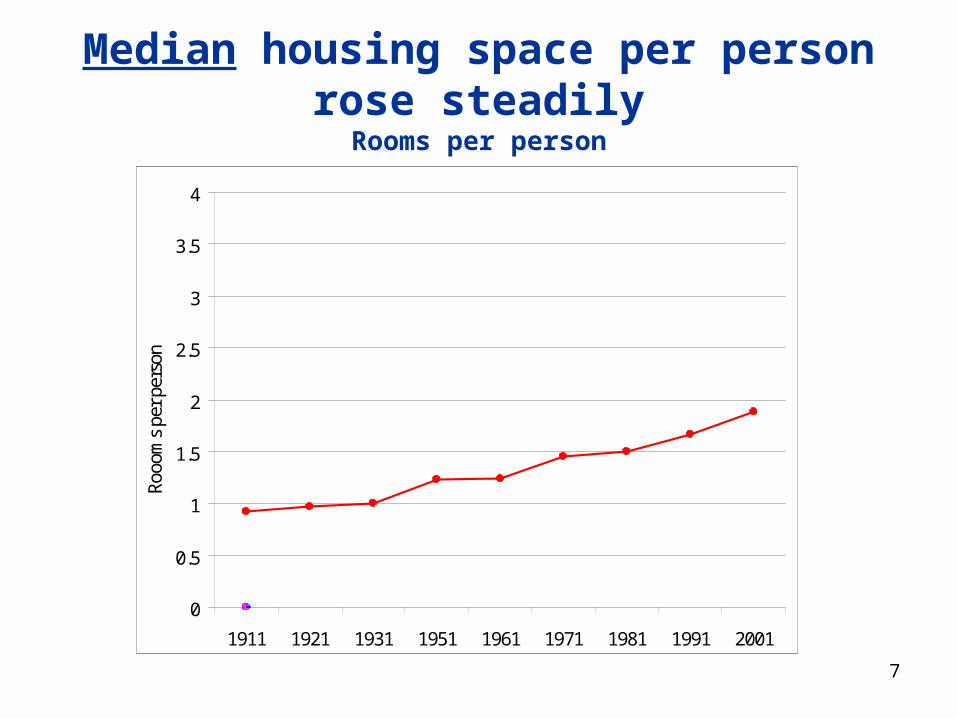
Median housing space per person rose steadilyRooms per person
0
0.5
1
1.5
2
2.5
3
3.5
4
1911 1921 1931 1951 1961 1971 1981 1991 2001
Rooo
ms
per p
erso
n
8
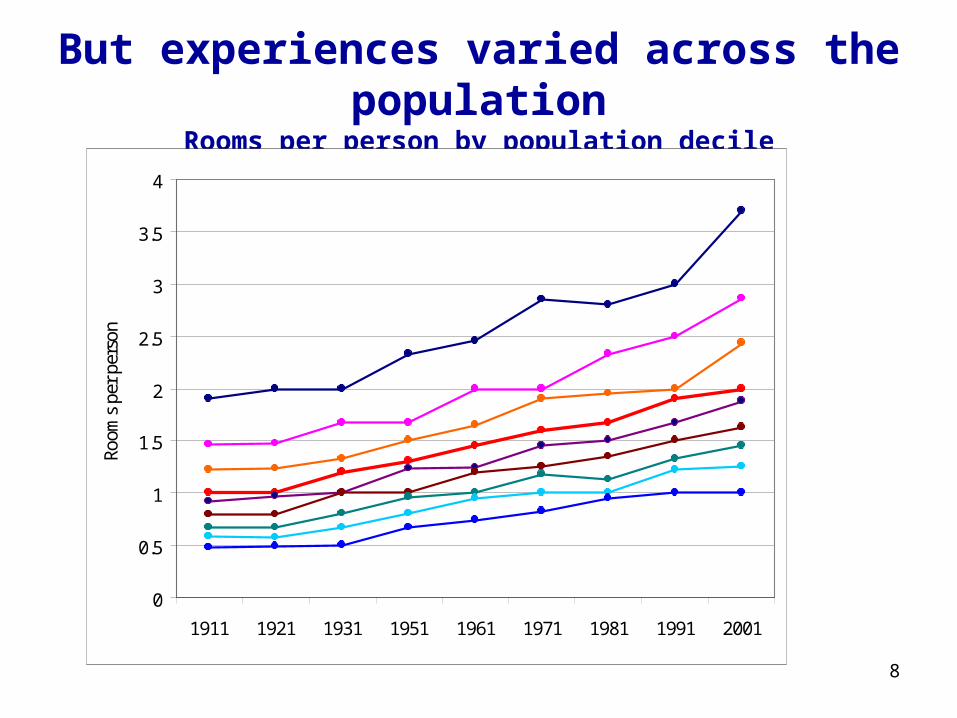
But experiences varied across the populationRooms per person by population decile
0
0.5
1
1.5
2
2.5
3
3.5
4
1911 1921 1931 1951 1961 1971 1981 1991 2001
Room
s pe
r per
son
9
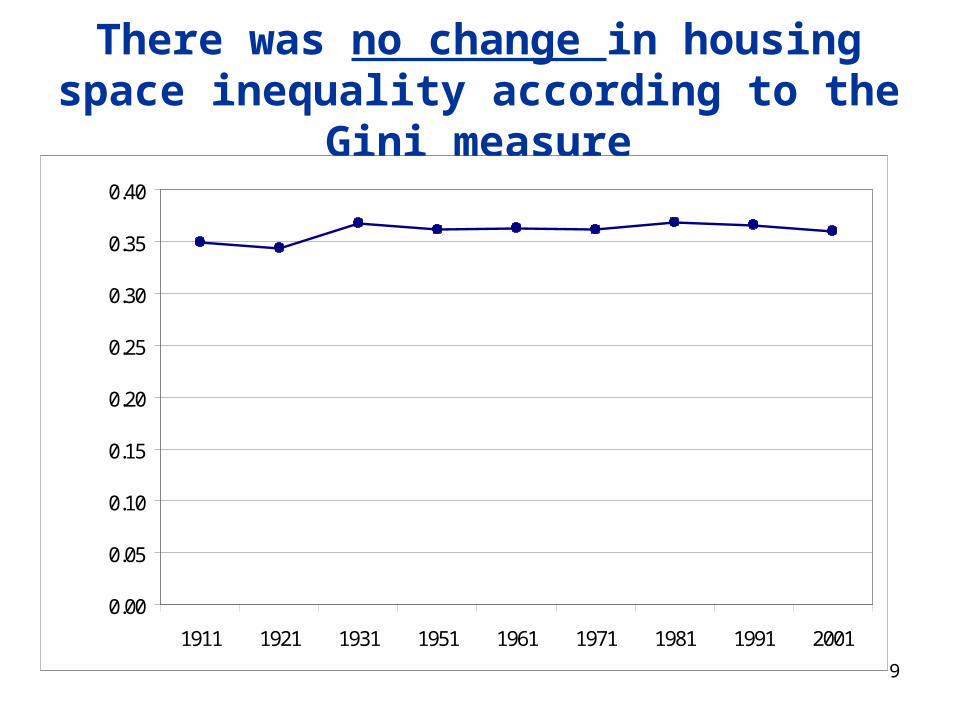
There was no change in housing space inequality according to the Gini measure
0.00
0.05
0.10
0.15
0.20
0.25
0.30
0.35
0.40
1911 1921 1931 1951 1961 1971 1981 1991 2001
10
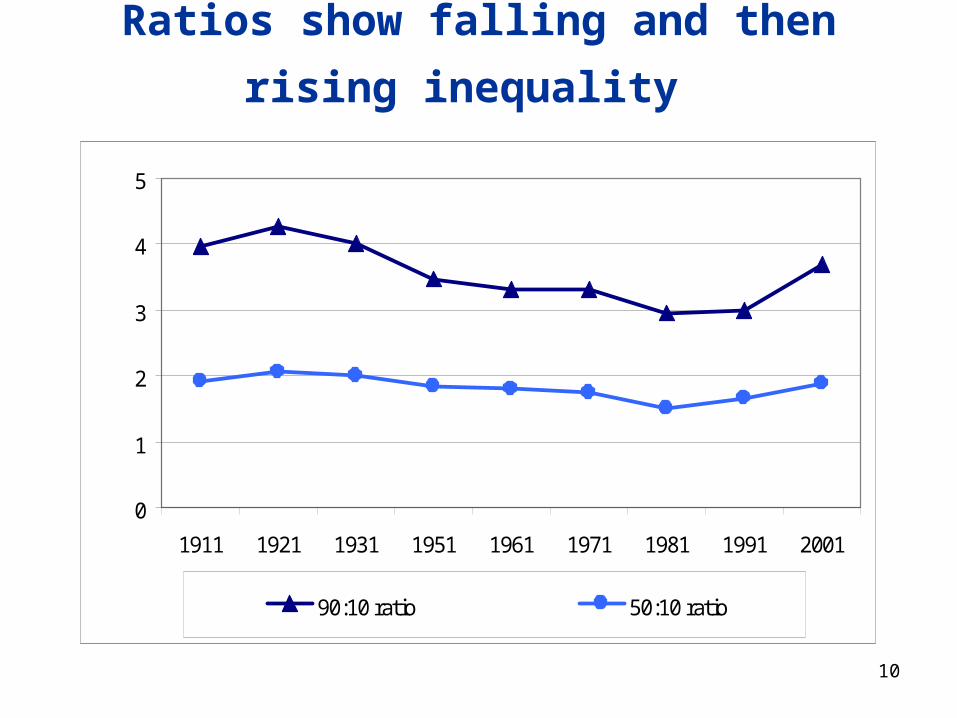
Ratios show falling and then rising inequality
0
1
2
3
4
5
1911 1921 1931 1951 1961 1971 1981 1991 2001
90:10 ratio 50:10 ratio
11
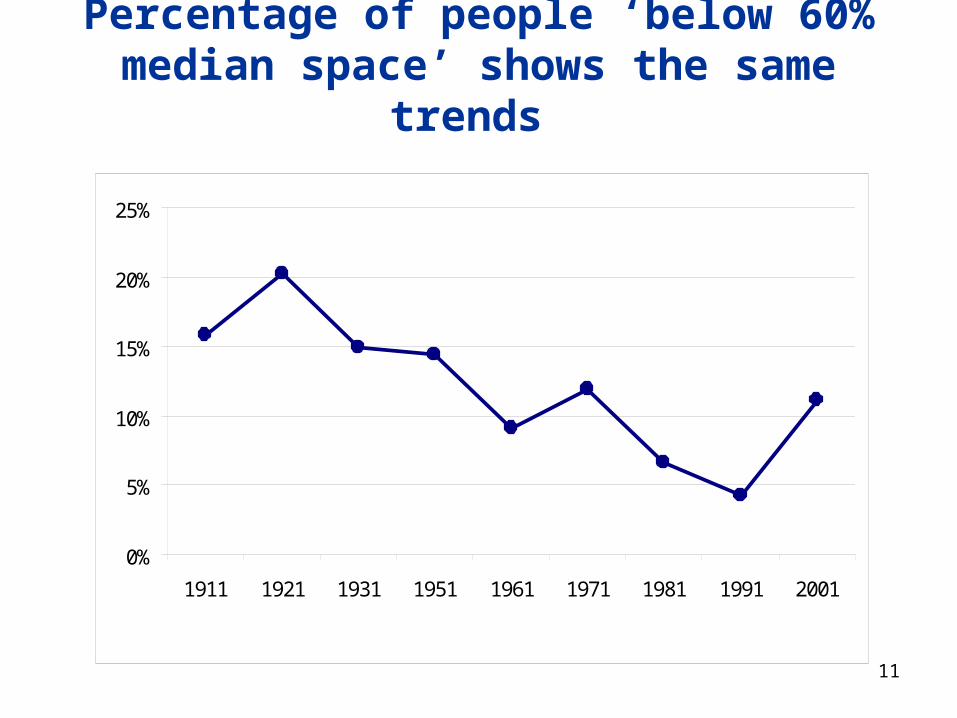
Percentage of people ‘below 60% median space’ shows the same trends
0%
5%
10%
15%
20%
25%
1911 1921 1931 1951 1961 1971 1981 1991 2001
12
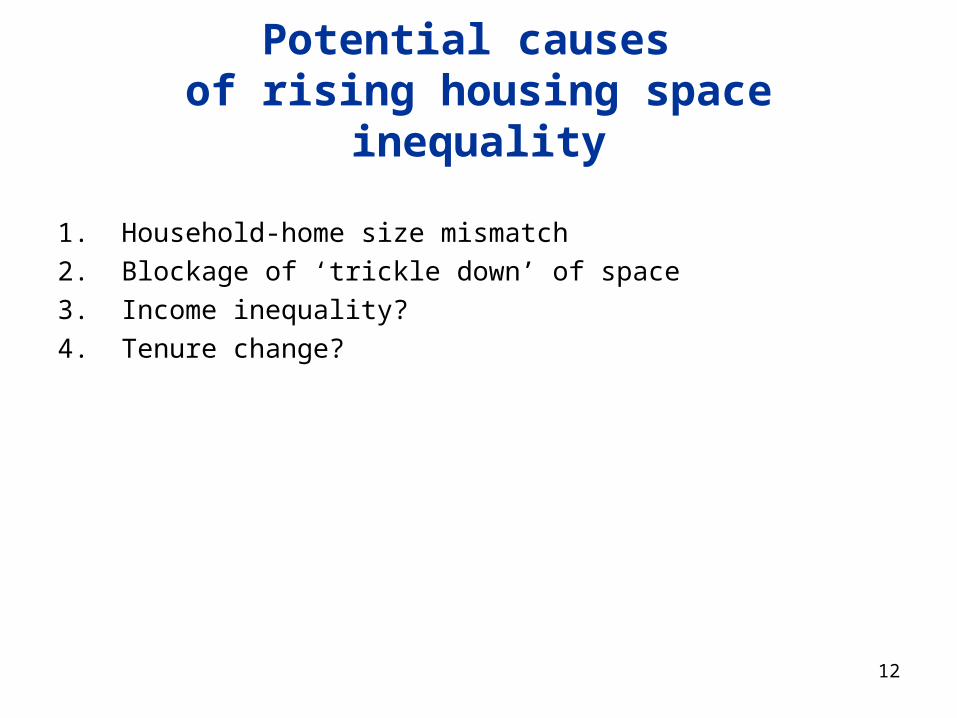
Potential causes of rising housing space inequality
1. Household-home size mismatch2. Blockage of ‘trickle down’ of space3. Income inequality?4. Tenure change?
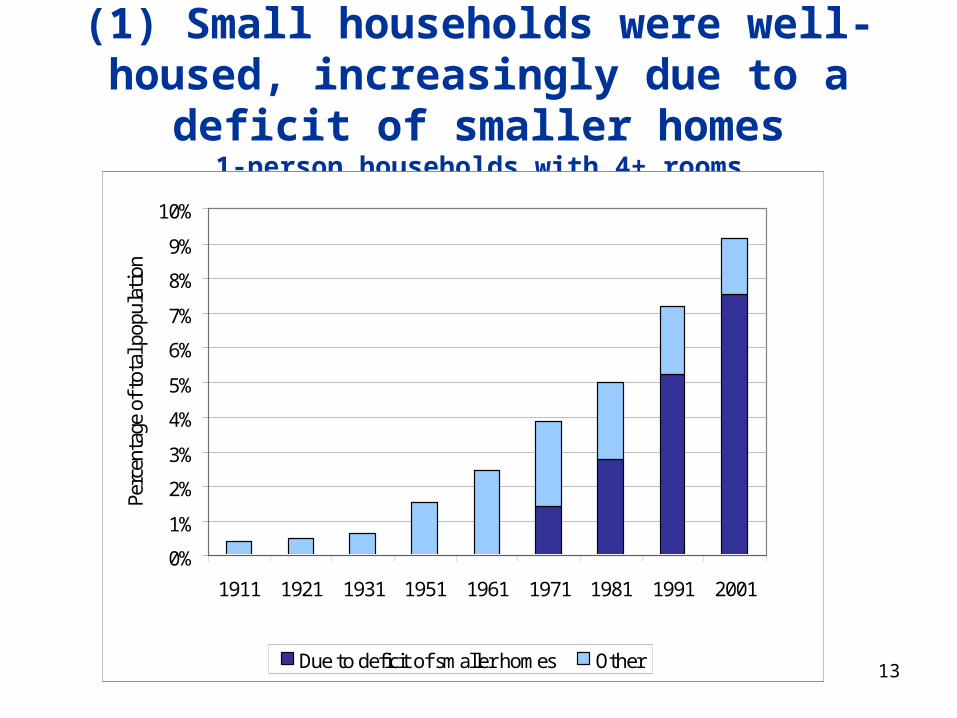
(1) Small households were well-housed, increasingly due to a deficit of smaller homes
1-person households with 4+ rooms
13
0%
1%
2%
3%
4%
5%
6%
7%
8%
9%
10%
1911 1921 1931 1951 1961 1971 1981 1991 2001
Perc
enta
ge o
f tot
al p
opul
ation
Due to deficit of smaller homes Other
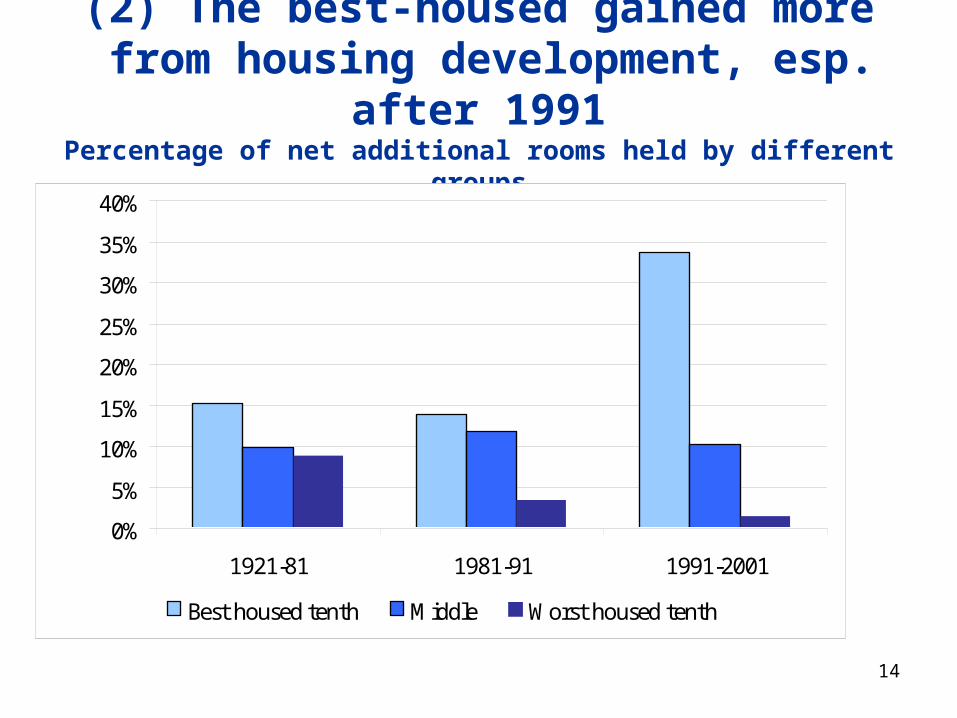
(2) The best-housed gained more from housing development, esp. after 1991
Percentage of net additional rooms held by different groups
14
0%
5%
10%
15%
20%
25%
30%
35%
40%
1921-81 1981-91 1991-2001
Best housed tenth Middle Worst housed tenth
15
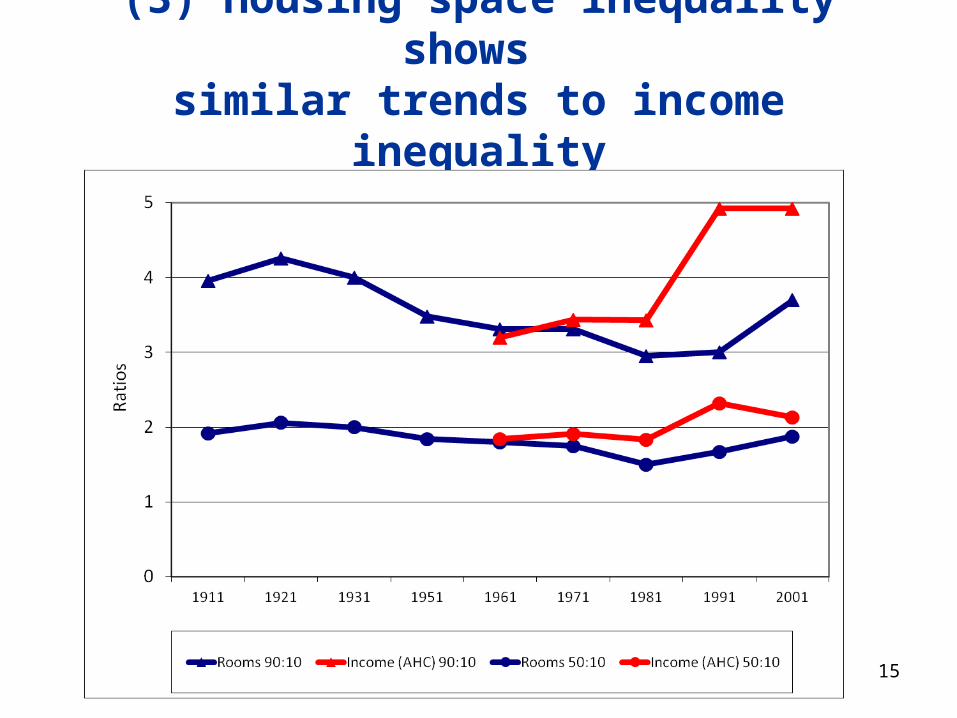
(3) Housing space inequality shows similar trends to income inequality
90:10 and 50:10 ratios
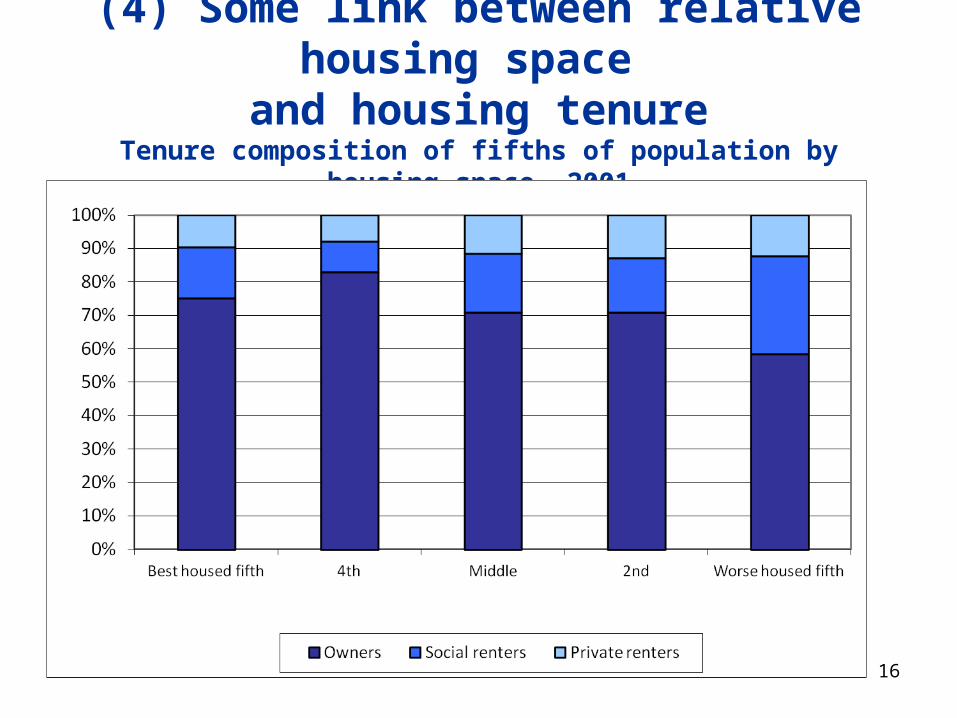
(4) Some link between relative housing space and housing tenure
Tenure composition of fifths of population by housing space, 2001
16
17
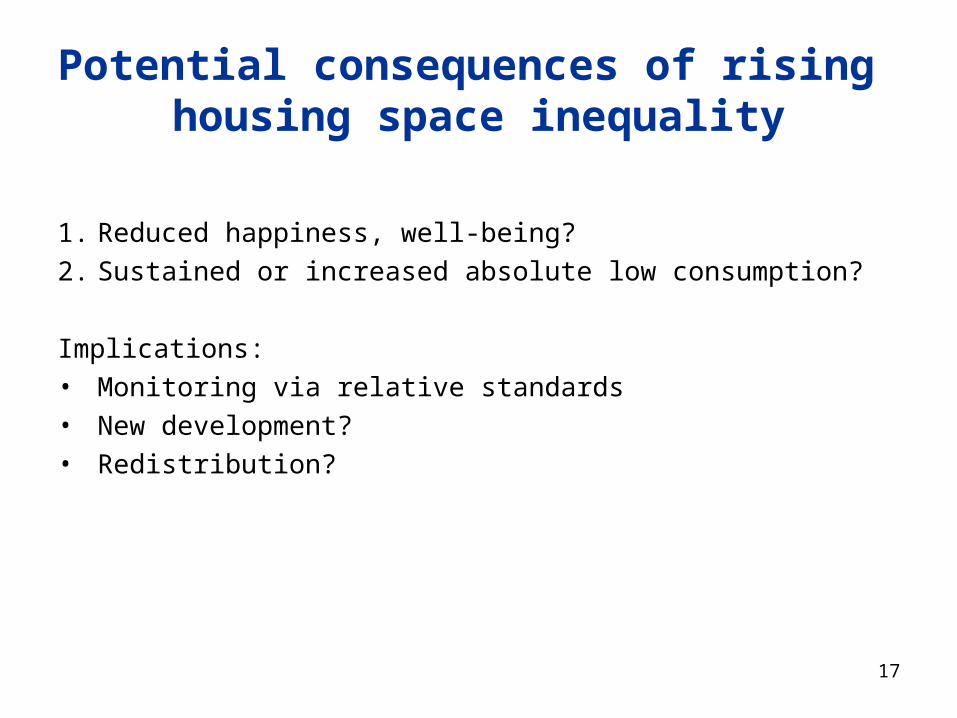
Potential consequences of rising housing space inequality
1. Reduced happiness, well-being?2. Sustained or increased absolute low consumption?
Implications:• Monitoring via relative standards• New development?• Redistribution?
18
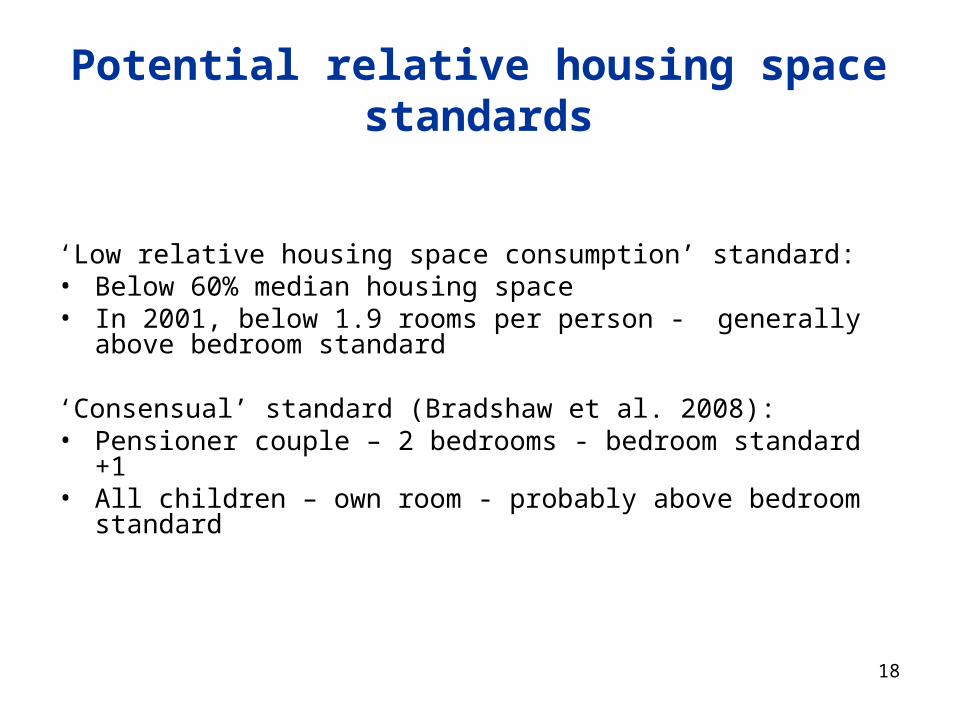
Potential relative housing space standards
‘Low relative housing space consumption’ standard:• Below 60% median housing space• In 2001, below 1.9 rooms per person - generally above bedroom standard
‘Consensual’ standard (Bradshaw et al. 2008):• Pensioner couple – 2 bedrooms - bedroom standard +1• All children – own room - probably above bedroom standard
19
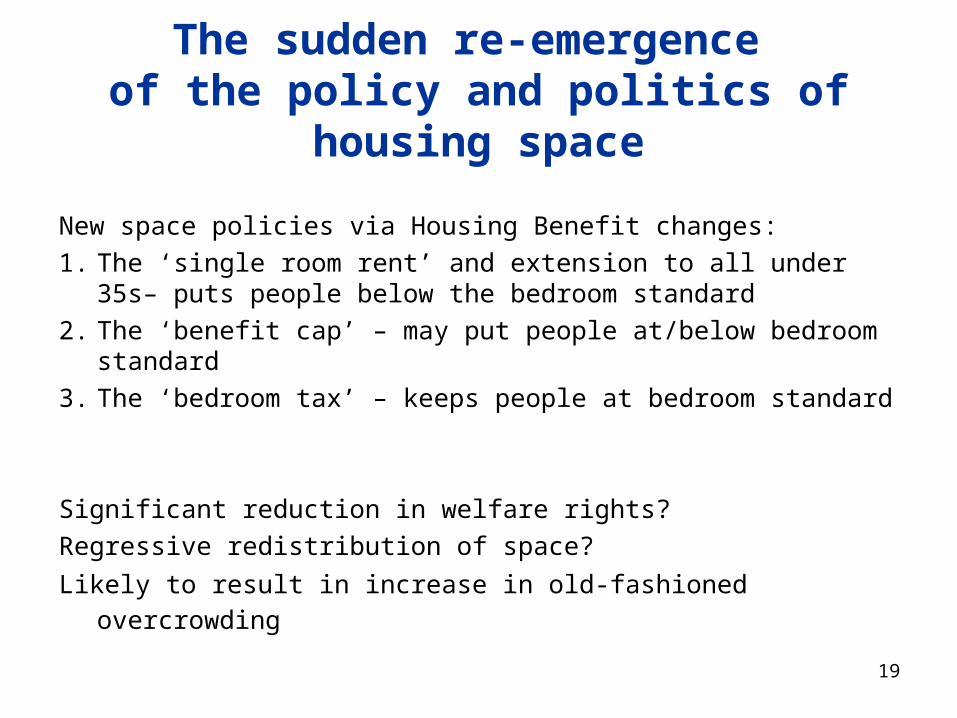
The sudden re-emergence of the policy and politics of housing space
New space policies via Housing Benefit changes:1. The ‘single room rent’ and extension to all under 35s– puts people below
the bedroom standard2. The ‘benefit cap’ – may put people at/below bedroom standard3. The ‘bedroom tax’ – keeps people at bedroom standard
Significant reduction in welfare rights?Regressive redistribution of space?
Likely to result in increase in old-fashioned overcrowding
20
Conclusion
There are strong arguments for worrying about housing consumption in relative rather than/as well as in absolute terms, where data and measures allow
Relative measures suggest:1. We need to reassess assumptions about past achievements on low
housing space: overcrowding could have been reduced faster2. Housing space inequality are similar to inequalities in income, and by
some measures are growing3. New structural space supply and demand problems appear to have
emerged over the past 30 years: size mismatch, trickle down blockage
Current policy will exacerbate inequalities, and old-fashioned absolute problems may be on the increase.
21
References
Bell, C. (1977), ‘On housing classes’ Journal of Sociology 13(1):36-40Bradshaw, J.; Middleton, S., Davis, A., Oldfield, N., Smith, N., Cusworth, L., and Williams, J, (2008), A minimum
income standard for Britain: What people think, York, JRFBramley, G., Leishman, C. and Watkins, D. (2008) Understanding neighbourhood housing markets: regional
context, disequilibrium, sub-markets and supply; Housing Studies 23(2) pp179-212Hamnett, C. (1999), Winners and losers: Home ownership in modern Britain, London, UCLMalpass, P. (2005), Housing and the welfare state: The development of housing policy in Britain, Basingstoke,
Palgrave MacmillanMarsh, A and Gibb, K (2011) ‘Uncertainty, expectations and behavioural aspects of housing market choices’,
Housing, Theory and Society, 28(3), pp215-235Office of the Deputy Prime Minister (2004), Overcrowding in England: The national and regional picture: Statistics,
London, ODPMPawson, H., Brown, C. and Jones, A. (2009) Exploring local authority policy and practice on housing allocations,
London: Communities and Local GovernmentRex, J. and Moore, R. (1967), Race, community and conflict: A study of Sparkbrook, Oxford: Oxford University PressRowntree, B. S. (1901), Poverty: A study of town life, London, Macmillan and Co.Rowntree, B. S. (1985), Poverty and progress, New York, Garland PublishersSaunders, P. (1990), A nation of home owners, London, Allen and UnwinStephens, M., Fitzpatrick, S., Elsinga, M., van Steen, G., and Chzhen, E. (2010), Study on housing exclusion: Welfare
policies, housing provision and labour markets, Brussels, European CommissionWoolf, V. (1991), A room of one’s own London, Hogarth Press.