Embed Size (px)
Citation preview
1
This is Africa’s moment…
But for how long?
And how to take the best and most sustainable advantage of it?

2
1. World Growth is Changing its Engine

3
Relative poverty is declining sharply
Development is the success of the twentieth century
Education is in fast progress
Child mortality is declining

4
MDGs are in real progress
Millennium Development Goals Indicators

5
As well as HDI

6
Developing countries are becoming the engines of growth for the world

7
OECD countries will face a difficult adjustment and the US above all

8
World’s demand structure is shifting
Changes in absolute volumes of GDP – source OECD

9
Many are lagging behind but more and more are catching up
10
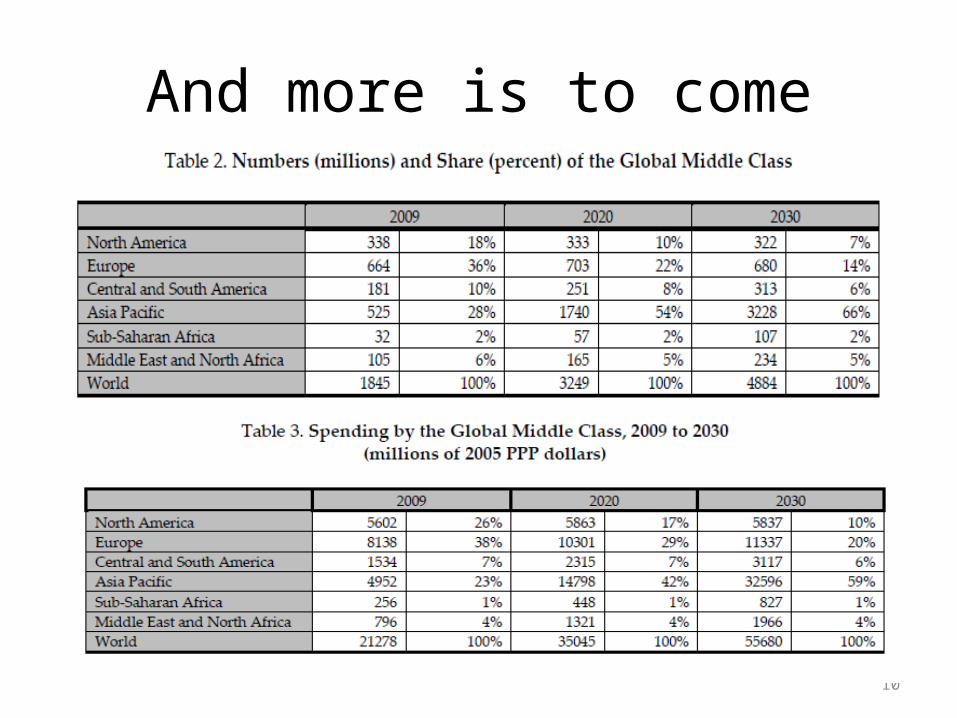
And more is to come

11
2. Four main development models based on world inequalities shape the modern growth
• 2.1 The “Dutch disease vanquisher” model• 2.2 The “double surplus sweatshop” model• 2.3 The “sweatwalker” model• 2.4 The “@sweater” model

12
2.1 The “dutch disease vanquisher” model

13
Crise de la dette et effondrement de la croissance en Amérique latine
Killing the old double deficit models andtheory
Debt crisis and economic collapse in 80’s Latin America(please do not forget Africa’s failure)
2.2 The double surplus sweatshop models (i)

14
The reign of double surpluses
2.2 The double surplus sweatshop models (ii)

15
2.3 Exporting men: the emergence of the sweatwalker model

16
2.4 Newcomers to fast growth pattern: from @sweaters to globalservice sweaters
After the world’s factory, the world’s desk (and hospital)?

17
3. High growth and rapid increase of welfare apparently shape the
world, but…the inversion of scarcities
questions the sustainability of this successful pattern

18
3.1 The great demographic shift, or Man as a disposable commodity

19
3.2 The end of nature
Overshooting: mankind’s footprint
Nature as a competitive asset
Kribi waterfalls, Southern Cameroun

20
4. The three main channels for unsustainability

21
4.1 Macroeconomic un-sustainability: the global link

22
Global imbalances in a world of reversed scarcities generate financial volatility, private and public unsustainable indebtment pressure, exchange rate wars, and
ultimately lead into global recession

23
4.2 Social un-sustainability: both North and South
It is mainly rooted in inequalities and low employment generation growth
Source: MDGs Report 2010

24
All linked
Food riots in Haiti, Apil 2008 Riots in French suburbs, 2005
Al Qaida au Maghreb Islamique (AQMI), October 2010
Subsaharan migrants on their way to Europe

25
4.3 Environmental unsustainability: the major structural economic realignments
The environmental Kuznets Law
Carbon emissions, biodiversity loss, local and global pollutants… all wrong directions: back to the club of Rome? The laws of relative and absolute impacts

26
coco
From the economics of flows to the economics of assets
UNCTAD, Trade and Environment Review 2009/2010
Commodities, space, air, water, land: from expansive to expensive

27
Pierre-Noël Giraud, Denis Loyer, Capital naturel et développement durable en Afrique, octobre 2006
Genuine growth, hidden realities

28
Towards a slow and dirty growth path?

29
2. This is Africa’s Moment (but how long will it be?)
Streets of Lagos

30
Africa is the major question mark of sustainability for the second half of the century
• Growth and demographic patterns make it the combination of India and China in social, environmental and macroeconomic challenge
• Africa’s size is the addition of Europe, the US, China, India, and more: it is the cornerstone of the twentieth century assets economy
• Africa is already a disputed territory between the “new hungrys”: its fate is structured south-south
0
200
400
600
800
1 000
1 200
1 400
1 600
1 800
2 000
1950 1960 1970 1980 1990 2000 2010 2020 2030 2040 2050
Subsaharan Africa China India Europe
World population by region

31
Growth has resumed
-4
-2
0
2
4
6
8
1980 1985 1990 1995 2000 2005 2010e
World EU Subsaharan Africa
Economic Growth, by region, 1980-2010

32
And should last (for some time)Africa dependency ratio
30
40
50
60
70
80
90
100
1950 1960 1970 1980 1990 2000 2010 2020 2030 2040 2050
Subsaharan Africa East Asia Europe
Note: the dependency ratio is the ratio between the "dependent" population (aged 0-14 years old and 65 more) and the population in “working age"(between 15 and 65). It is expressed as the number of "dependent" for 100 people in working age . East Asia = China, Northern, southern Korea, Japan Mongolia Korea. Europe including Russia. Source: United Nations, World Population Prospects: The 2008 revision (median scenario), 2009.

33
A potential horizon of thirty years?…
30
35
40
45
50
55
60
65
1995
1996
1997
1998
1999
2000
2001
2002
2003
2004
2005
2006
2007
2008
2009
Urban population (% of total)
Africa
SSA
SSA less SA
North Africa
South Africa
34
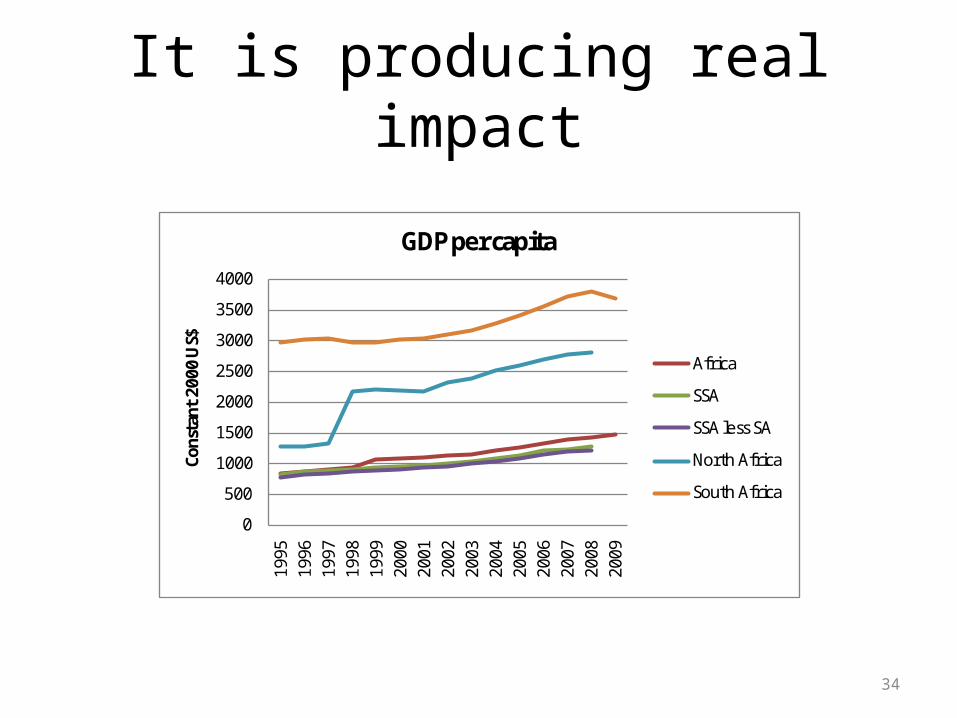
It is producing real impact
0
500
1000
1500
2000
2500
3000
3500
400019
9519
9619
9719
9819
9920
0020
0120
0220
0320
0420
0520
0620
0720
0820
09
Cons
tant
200
0 U
S$
GDP per capita
Africa
SSA
SSA less SA
North Africa
South Africa

35
Africa is also carried by the global move towards the universal middle class
Countries 1990 2005 1990 2005East Asia & Pacific 315,5 1117,1 19,8 59,3
China 173,7 806 15,3 61,8Latin America & Caribbean 276,7 362,1 63,2 65,8
Middle East and North Africa 170,2 240,1 75,5 78,7South Asia 192,7 380,2 17,2 25,8
India 146,8 263,7 17,3 24,1Sub-saharan Africa 177,7 197,1 22,8 25,8
Number living between $2 and $13 per day
Percent of the population

36
A class that is joining the global consummer’s feast
-4
-2
0
2
4
6
8
(ann
ual %
)
Household final consumption expenditure per capita growth
East Asia & Pacific
OECD
Latin America & Caribbean
South Asia
Sub-Saharan Africa

37
Thanks to fiscal space…
-6
-4
-2
0
2
4
6
1995
1996
1997
1998
1999
2000
2001
2002
2003
2004
2005
2006
2007
2008
2009(%
of G
DP)
Cash surplus/deficit
Africa
ASS
AFN
ASS less SA
SA

38
Leading to lower endebtment
0
10
20
30
40
50
60
70
80
90
10019
95
1996
1997
1998
1999
2000
2001
2002
2003
2004
2005
2006
2007
2008
2009
% o
f GD
P
Central government debt, total
Africa
SSA
North Africa

39
And improved external accounts
-3000
-2000
-1000
0
1000
2000
3000
4000
5000
6000
7000
US
Do
lla
rs,
mil
lio
n Overall balance
Africa
Sub saharan Africa
North Africa
Sub saharan africa lessSA
SA
-15
-10
-5
0
5
10
15
19
95
19
96
19
97
19
98
19
99
20
00
20
01
20
02
20
03
20
04
20
05
20
06
20
07
20
08
20
09
% o
f G
DP
Current account balance
Africa
SSA
SSA less SA
North Africa
South Africa

40
Overstated hopes?
Emerging Africa: a book by Steven Radelet, formerly CGDEV, 2010
A McKinsey report, 2010

41
Actually Africa has to accelerate public investment…
0
2
4
6
8
10
1219
9519
9619
9719
9819
9920
0020
0120
0220
0320
0420
0520
0620
0720
08
(% o
f GD
P)
Gross public investment
Africa
Sub-Saharan Africa (developing only)
Sub-Saharan Africa
South Africa
North Africa
42
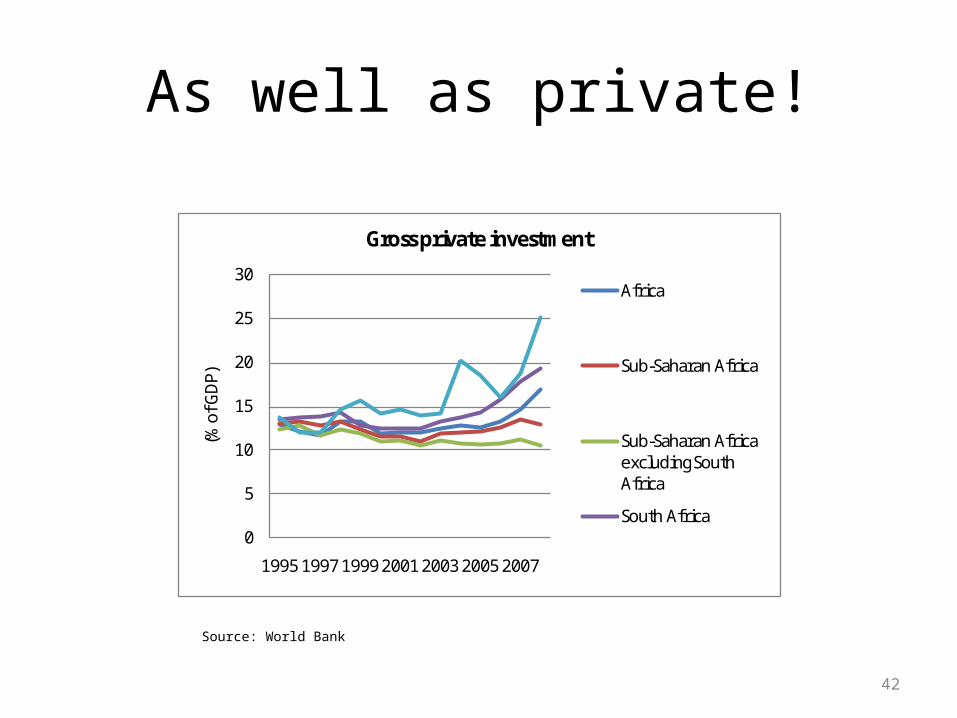
As well as private!
0
5
10
15
20
25
30
1995 1997 1999 2001 2003 2005 2007
(% o
f GD
P)
Gross private investment
Africa
Sub-Saharan Africa
Sub-Saharan Africa excluding South Africa
South Africa
Source: World Bank
43
It will also face huge environmental and social
challenges…• How many wars and civil wars due to migration
led conflicts in 2050?• No more land and water – and expensive energy
in 2050?• How many failed states still in 2050?• One billion Africans below 2 usd a day in 2050?• And how many “dependant”? (on which
economic model base?)

44
One major question is what model will bring Africa its fastest and most sustainable pace of growth?
• The resources model still carries huge macro and environmental challenges
• The double surplus model may not be under reach anymore
• The @sweater and the sweatrunner models cannot fix it all
• Is there a room for a domestic market making oriented policy?

45
key structural “benchmark policies” are “no mistake” options
• An energy policy that reduces dependency• An urban and transportation policy that ensures
productivity gains and environmental upsides• “externalities generating” policies have to be
favored: the case of water and health• Africa has to take care of its elites, and has still to
generate its own private sector• A financial market that allows domestic
currencies long term funding

46
ADB matters
• ADB has to and can carry an african vision of development
• It links from South to North• Its volumes matter• Its instruments can make a difference• It has imposed itself over the past years as the
premier bank of Africa