Embed Size (px)
Citation preview

Mick Carew, PhD, 604-697-6006, [email protected]
Emma Boggio, MSA, CPA, CA, 604-697-6166, [email protected]
For Important Disclosures and Analyst Certification See Pages 38-46
1
The Weekly Dig
1.
32%
13%
12%
11%
9%
6%
3%
3%
2%
1%
0%
Wolfden Resources Corporation
Ascendant Resources Inc.
Western Copper and Gold…
Panoro Minerals Ltd.
Osisko Metals Incorporated
Trevali Mining Corporation
Noront Resources Ltd.
Ivanhoe Mines Ltd.
Hudbay Minerals Inc.
First Quantum Minerals Ltd.
Xanadu Mines Limited
Weekly Performance - Base Metals Producers & Developers
16%
12%
11%
10%
10%
9%
9%
9%
8%
8%
Torex Gold Resources Inc.
Alamos Gold Inc.
Yamana Gold Inc.
Barrick Gold Corporation
McEwen Mining Inc.
Newmont Corporation
Kinross Gold Corporation
B2Gold Corp.
Eldorado Gold Corporation
Centamin plc
Weekly Performance - Senior and Intermediate Gold Producers
33%
31%
25%
16%
15%
15%
14%
14%
11%
11%
Jaxon Mining Inc.
Spanish Mountain…
Goldgroup Mining Inc.
New Pacific Metals…
Minera Alamos Inc.
Rupert Resources Ltd.
Bluestone Resources…
Rubicon Minerals…
Nighthawk Gold Corp.
Teranga Gold…
Weekly Performance - Junior, Developer, and Exploration Gold
1
Source: Bloomberg and Haywood Securities
$-
$200
$400
$600
$800
$1,000
$1,200
$1,400
$1,600
$1,800
$-
$5.00
$10.00
$15.00
$20.00
$25.00
20-Feb-19 20-Jul-19 20-Dec-19
Go
ld U
S$/o
z
Silv
er U
S$/o
z
Silver 4.1% WoW $18.34/oz Gold 2.7% WoW $1,622/oz
0.00
1.00
2.00
3.00
4.00
5.00
6.00
7.00
8.00
9.00
20-Feb-19 20-Jun-19 20-Oct-19 20-Feb-20
0.00
0.50
1.00
1.50
2.00
2.50
3.00
3.50
Co
pp
er &
Zin
c U
S$/l
b
Nic
kel U
S$/l
b
Zinc -3.0% WoW $.95/lb
Copper -1.1% WoW $2.59/lb
Nickel -4.7% WoW $5.71/lb
0
1,000
2,000
3,000
4,000
5,000
6,000
7,000
20-Feb-19 20-Jun-19 20-Oct-19 20-Feb-20
0
50
100
150
200
250
300
S&P
/TSX
Glo
ba
l Go
ld
S&P
/TSX
Div
ersi
fied
Met
als
& M
inin
g
S&P/TSX Global Gold Index 6.4% WoW
S&P/TSX Diversified Metals & Mining Index -6.2% WoW
Gold Passes US$1,600 and Coronavirus Fears Linger
Precious Metals Gold breached above the US$1,600 mark Thursday morning as the increased number of coronavirus cases in South Korea fuel further concerns over the potential wider economic impact of the outbreak. Meanwhile, the U.S. dollar strengthened with the U.S. Dollar Index climbing almost one point to 99.87 since last Thursday, while the yuan, a safe-haven competitor to the dollar and gold, took a steep slide. The price of gold rose 2.7% since last Thursday, finishing at US$1,619 per ounce for the week. Some of the better performing gold producers in our coverage universe this week include Alamos Gold Inc. (AGI-T, BUY rating, $10.25 target) which was up 12.5%, while Barrick Gold (ABX-T, BUY rating, $28.00 target) and B2Gold Corp. (BTO-T, BUY rating, $7.50 target) were up 9.6% and 8.7% respectively. In the junior gold space, Minera Alamos Inc. (MAI-V, BUY rating, $0.50 target) led the way, up 16.7% this week, while Bluestone Resources Inc. (BSR-V, BUY rating, $3.00 target) and Nighthawk Gold Corp. (NHK-T, BUY rating, $4.50 target) were up 14.3% and 11.4% respectively. While gold was up this week, silver also followed suit (up 3.9%) to US$18.37 per ounce, and both platinum (up 1.0%) and palladium (up 10.0%) finished higher.
Base Metals Base metals prices continued to drift as investor worries over the spread of the coronavirus outside China dampened benefits from policy easing in the country. The global death toll is now in excess of 2,200, and there are over 76,000 confirmed cases. China’s banks lowered benchmark borrowing costs after the central government slashed a range of policy rates to help battle the impact of the virus. China is expected to lower lending rates and the reserve requirement further to support the economy. The government is also stepping up fiscal support, which could help shore up demand for credit. In the meantime, the yuan fell to the weakest this year versus the dollar. Among the base metals, copper and zinc trended slightly lower WoW, to $2.60/lb and $0.96/lb, respectively, while nickel suffered the largest drop, falling $0.18 to $5.80/lb, after reports that Tesla is shifting some production of its most popular model away from batteries that contain nickel and cobalt. Most other automakers favour nickel-cobalt-manganese cathode chemistries. Most base metals producers in our universe retrenched over the last week, down by an average of 2.4%, led by Teck (approaching 52-week lows)and Taseko, which were off 6.7%. First Quantum was the top performer, up 3.6% over the last 5 days
Weekly Performance
February 21, 2020
THE WEEKLY DIG

Mick Carew, PhD, 604-697-6006, [email protected]
Emma Boggio, MSA, CPA, CA, 604-697-6166, [email protected]
The Weekly Dig
2
February 21, 2020
Contents
Haywood Research: The Week in Review ................................................................................................................ 3
Weekly Commodities ............................................................................................................................................... 6
Commodities Prices and Inventories ....................................................................................................................... 7
Commodities and ETFs .......................................................................................................................................... 10
Upcoming Macroeconomic News .......................................................................................................................... 12
Weekly Indices ........................................................................................................................................................ 13
Weekly Equities ....................................................................................................................................................... 14
Precious Metals Companies .................................................................................................................................. 15
Base Metals Companies ......................................................................................................................................... 16
Major International Miners ................................................................................................................................... 18
Tables
Comparables Tables: Consensus and Haywood Forecasts/Multiples, Plus Market Valuations for In Situ Resources
................................................................................................................................................................................. 19
Precious Metals Companies ................................................................................................................................... 19
Base Metals Companies .......................................................................................................................................... 29
Other Companies (Uranium, Diamond, Cobalt, Coal, Iron) ................................................................................... 33
Junior Exploration Companies Review: Performance of Companies Included in Junior X .................................... 36
Haywood Metals and Currencies Forecasts .......................................................................................................... 37

Mick Carew, PhD, 604-697-6006, [email protected]
Emma Boggio, MSA, CPA, CA, 604-697-6166, [email protected]
The Weekly Dig
3 February 21, 2020
Haywood Research: The Week in Review – Covered Companies Publications from the Haywood Research team for the week included the following market analysis:
Weekly Technical Analysis: Key takeaways and charts of the week
Publications from the Haywood Research team for the week included the following for covered companies:
Asanko Gold Inc. (AKG-T, $1.20): Q4/19 financials, 2020 ops. guidance
Metalla Royalty & Streaming Ltd. (MTA-V, $7.92): NuevaUnión Project royalty
Copper Mountain Mining Corp. (CMMC-T, $0.62): 4Q19 and 2019 financial results, 2020 outlook
Nighthawk Gold Corp. (NHK-T, $2.44): Drilling results
Alamos Gold Inc. (AGI-T, $8.44): Resource update
Calibre Mining Corp. (CXB-T, $0.89): Q4/19 and 2019 results
Denison Mines Corp. (DML-T, $0.485): Core leach test results
Capstone Mining Corp. (CS-T, $0.71): PEA update
Filo Mining Corp. (FIL-V, $1.93): Drilling results
OceanaGold Corporation (OGC-T, $2.57): Q4/19 and FY19 results
Publications from the Haywood Research team for the week included the following for uncovered companies:
IsoEnergy Ltd. (ISO-V, $0.39): Drilling results
Osino Resources Corp. (OSI-V, $0.82): Drilling results
TECHNICAL ANALYSIS
Weekly Technical Analysis
Equities: The breadth and momentum divergences that we discussed last week, have not yet been resolved despite the strong action in the broad indices. Underlying the bullish price action is increasingly defensive sector rotation: Financials, Industrials, Materials, Energy, Staples, and Health Care are each seeing deteriorating relative strength against the S&P 500 while sector leadership moves in favor of Technology, Communication Services, Utilities, Real Estate, and Discretionary (only on a cap-weighted basis due to AMZN). The CBOE put/call ratio has also been hovering in overly optimistic/complacent territory, making current conditions unattractive for adding high-beta equity exposure, although it certainly does not warrant getting short or bearish yet. We continue to recommend waiting for better conditions to add exposure.
Technical Analysis – February 18, 2020
COVERED NAMES
Asanko Gold Inc. (AKG-T, $1.20) | Rating » Hold | Target » $1.15
Our Take: Gold production of 66.1 koz and gold sales of ~66.1 koz were reported previously as were preliminary cost (TCC: US$863/oz and AISC: US$969/oz) and sales data (revenues of US$96.8 million on a 100% basis). Full-year production of 251 koz, exceeded the upper-end of corporate guidance of 225-245 koz Au, and our earlier forecast of 249 koz. Adjusted Q4/19 financials for AKG were slightly softer than expected, as adjusted EPS of US$0.00/sh and adjusted EBITDA of US$14.3 million compared to our forecasts of US$0.02/sh and US$17.3 million, respectively. However, more importantly, details pertaining to 2020 production guidance, and initial commentary regarding the AGM LOM plan were provided with the release.
2020 Production Guidance Outlines Static Profile; Key Long-Term Focus Remains on LOM Plan Update – February 14, 2020
Metalla Royalty & Streaming Ltd. (MTA-V, $7.92) | Rating » Hold | Target » $7.50
Our Take: This is a small transaction for Metalla that could return multiples to the NSR purchase price over the projected mine life. Production from the NuevaUnión project is several years away but the project has decent scale and a very long mine life. Metalla has acquired a 2.0% NSR on future gold production from a portion of the La Fortuna deposit (formerly called the El Morro project which was owned by Goldcorp), and prospective exploration land that is part of the NuevaUnión project located in the Atacama region of Chile, jointly owned by Newmont (NEM-US; Not Rated) and Teck Resources (TECK.B-T, Not Rated). NuevaUnión is one of the largest undeveloped copper-gold-molybdenum projects in the world. Metalla has partnered with BatteryOne Royalty Corp. (PrivateCo.) to jointly purchase this NSR, owned by a private Chilean company, for a total acquisition price of US$8 million in cash and shares, with Metalla funding 25% of the purchase price (US$2 million).
Acquires Royalty on NuevaUnión Project – February 18, 2020

Mick Carew, PhD, 604-697-6006, [email protected]
Emma Boggio, MSA, CPA, CA, 604-697-6166, [email protected]
The Weekly Dig
4 February 21, 2020
Copper Mountain Mining Corp. (CMMC-T, $0.62) | Rating » Buy | Target » $1.20 (from $1.40)
Our Take: CMMC is positioning for growth at Copper Mountain and in Australia, but in this copper environment, expansion and optimization plans will limit potential for free cash flow in 2020. CMMC reported 4Q19 EPS of ($0.14), adjusted EPS of $0.01, and CFPS of $0.02, compared to Haywood estimates of $0.00 for EPS, and $0.05 for CFPS. Earnings were impacted by a non-cash write-down of $48.8M on the carrying value of the low-grade stockpile, offset by a positive mark-to-market adjustment on concentrate sales and a non-cash unrealized foreign exchange gain of $5.4M. Revenues (+18% QoQ to $73M) benefited from marginally higher copper and gold prices and slightly higher copper sales (+3% QoQ to 17.6Mlbs), resulting in positive cash flow of $4.3M, in line with 2Q19. CMMC ended the year with $32.1M in cash (-11% QoQ), and total debt of $248.4M (+7% QoQ), for net debt of $216.3M v. $196M in 3Q19. The Mitsubishi related short term notes were extended to long term debt, maturing in June 2023, thereby improving working capital by $101M
4Q19 and 2019 Financial Results; Outlook Overshadowed by Weaker Copper Price – Lowering Target – February 19, 2020
Nighthawk Gold Corp. (NHK-T, $2.44) | Rating » Buy | Target » $4.50
Our Take: Nighthawk released assay results from its flagship Colomac project in Northwest Territories. Today’s results consist of 7 holes over 2,190 metres targeting the Company’s Goldcrest sill, which runs parallel and 400 metres west of the Company’s Colomac main sill. Several intersections of high-grade gold mineralization were reported, including 15.50 metres grading 5.47 g/t gold from 70.5 metres downhole (hole G19-05). These results are encouraging, although we note the width of the Goldcrest sill is markedly less compared to the high-grade zones at Colomac. There is potential for the Goldcrest sill to widen with further drilling along strike, as illustrated by the variable widths reported along strike of the Colomac sill. The recent drilling both followed-up on previous drill campaign results (last drilled in 2017), as well as targeted new resource expansion within the Goldcrest’s southern section. All 7 holes intersected mineralization over a strike length of 400 metres within the Goldcrest South zone.
Goldcrest Continues to Show Promise – February 19, 2020
Alamos Gold Inc. (AGI-T, $8.44) | Rating » Buy | Target » $10.25
Our Take: Alamos continues to grow reserves at Island while maintaining the asset’s high grade, and since acquisition in November 2017, Alamos has grown reserves by 67% (+591,000 ounces, before mining depletion over the last two years of 263,000 ounces) with grades also increasing by 13%. Total resources and reserves over the same period at Island have grown by 94% (+1.8 Moz) at a cost of ~US$35 million over two years, or a discovery cost of ~US$20 per ounce. This growth will be incorporated in a Phase III expansion study that is expected to be completed in H1/20.
Island Continues to Grow – February 19, 2020
Calibre Mining Corp. (CXB-T, $0.89) | Rating » Buy | Target » $1.80
Our Take: Calibre reported full Q4/19 operations and financial data, which represented a partial quarter of operations following the acquisition of its Nicaraguan assets (La Libertad and El Limon) on October 15th, 2019. Throughout the Oct 15th – Dec 31st operations period, Calibre previously reported consolidated production of 33.5 koz gold (15.4 koz and 18.1 koz at El Limon and La Libertad respectively), with more recent data highlighting total Q4/19 gold sales of 38.9 koz gold, which represented sales from inventory acquired at the time of acquisition. Along with production of 33.5 koz meeting the Company’s guidance of 32-35 koz for the respective operations period, TCC of US$866/oz came in-line with our estimates, meanwhile, AISC of US$959/oz slightly bettered our estimate of US$1,033/oz, and met Corporate guidance of US$950-$980/oz. Overall, we are encouraged by the Company’s ability to meet production and cost guidance within a short timeframe post transition of asset ownership.
A Solid Transition: Operational and Exploration Momentum Expected to Continue in 2020 – February 19, 2020
Denison Mines Corp. (DML-T, $0.485) | Rating » Buy | Target » $1.60
Our Take: The core leach tests performed on drill core recovered from the Phoenix deposit returned uranium concentrations ranging from 13.5 – 39.8 g/litre. These results compare very favourably to the 10 g/litre assumption in the September 2019 Pre-Feasibility Study on Phoenix, achieving almost 4 times the uranium concentration in leach solution. Higher uranium concentration in recovery fluids has the potential to lead to CAPEX and OPEX savings in future economic studies as Denison continues to refine its process model for Phoenix. Denison’s 2020 metallurgical program at Phoenix is scheduled to continue throughout H1/2020, seeking to further de-risk the project while providing additional news flow.
Phoenix Deposit Pump Test Results; Core Leach Tests Suggest Higher Uranium Concentrations Achievable – February 19, 2020
Capstone Mining Corp. (CS-T, $0.71) | Rating » Buy | Target » $1.00
Our Take: Capstone’s updated PEA, which provides for a cobalt plant in addition to the existing plan to produce copper, gold and iron ore, enhances the economics of Santo Domingo. We wait for the Company to secure a joint venture for at least 50% of the project for validation of the new plan. Capstone released an update on its 2019 PEA for the 70%-owned Santo Domingo project in Chile which

Mick Carew, PhD, 604-697-6006, [email protected]
Emma Boggio, MSA, CPA, CA, 604-697-6166, [email protected]
The Weekly Dig
5 February 21, 2020
provides more cost certainty, and the development of a cobalt circuit. The 2020 PEA considers a plan to mine and process copper, iron ore and gold initially, followed by a phase to initiate cobalt recovery after two years of permitting and engineering.
Cobalt Plan Provides Additional Optionality– February 20, 2020
Filo Mining Corp. (FIL-V, $1.93) | Rating » Buy | Target » $4.60
Our Take: The depth, grade and size potential of the outcropping high-sulphidation and the ‘source’ porphyry system to depth at Filo continues to be unbounded with additional results from diamond drill holes (FSDH032 and FSDH033) of the 2019/2020 drill program highlighting notable results. Results show the discovery of higher-grade copper-gold mineralization (presumably porphyry related) at depth that is open to the northeast and being tested in drill hole FSDH036, and likely in other holes thereafter. FSDH032 is likely the most important post-discovery hole thus far, and highlights the potential for the Company to add higher grade tonnes with future drilling that would seem to be augmentative to the presiding PFS.
Deeper Drilling at Filo Unearths Higher Grade Cu-Au Mineralization Open to the North – February 20, 2020
OceanaGold Corporation (OGC-T, $2.57) | Rating » Hold | Target » $2.75
Our Take: Operating data was reported previously, meanwhile, financials performance was weaker than anticipated, primarily on higher expense items (SG&A, DD&A, and Cash Taxes). Of note, Q4/19 financials were impacted by the absence of sales from Didipio, and associated non-production costs of US$10.1 million (US$17.7 million for FY19) related to maintaining operational readiness at the mine-site.
Q4/19 Financials Miss Tethered to Didipio as Overhang Impinges Bottom Line Performance – February 20, 2020
UNCOVERED NAMES
IsoEnergy Ltd. (ISO-V, $0.39) | Not Rated
Our Take: ISO released assays from its first hole drilled this winter (LE20-30) at its 100%-owned Larocque East project. Initial scintillometer results were reported February 4th for this hole. Results of LE20-30 represent the best intercept to-date on the project confirmed by assays, but we expect successive holes, where we have already seen scint results (assays pending), will likely outstrip LE20-30’s assays. This means more positive news flow coming from ISO. Last Thursday in the Q1/2020 Haywood Junior Exploration Report we highlighted the very positive (and freshly reported) initial scintillometer results for two newer drill holes of the winter program (LE20-34 and LE20-32A). Both holes have the potential to put up better assays than the positive results from LE20-30.
First Assays from Winter Drilling Reveal Best Intercept yet at Hurricane – February 19, 2020
Osino Resources Corp. (OSI-V, $0.82) | Not Rated
Our Take: Osino released all outstanding drill assay results from its 45-hole 2019 drill campaign and has completed its initial logging and interpretation of its Phase 2 drilling at the Twin Hills Central discovery at its Karibib Gold Project in Namibia. The recent release comprised results from the two pending drill holes (RC and a diamond drill hole) targeting Twin Hills Central, as well as 8 diamond drill holes targeting Twin Hills West, 2 diamond drill holes targeting Clouds, and 5 RC holes plus 2 diamond holes at its Barking Dog target. Compared to the broad intersections of gold mineralization at Twin Hills Central, the results from these exploration holes are disappointing, although we note that the holes were drilled at significant step-outs from Twin Hills Central. At Twin Hills West, 4 of the 8 newly released holes intersected significant gold mineralization with grades appearing to increase to the south and west. Several narrow intercepts of gold mineralization were reported from 1 of 2 holes at Clouds, while only 1 hole from 7 drilled at Barking Dog intersected significant gold mineralization.
Final Results from 2019 Drilling Campaign – February 19, 2020

Mick Carew, PhD, 604-697-6006, [email protected]
Emma Boggio, MSA, CPA, CA, 604-697-6166, [email protected]
The Weekly Dig
6 February 21, 2020
Weekly Commodities
Source: Haywood Securities and Bloomberg
.
Name Close 1Wk Δ 1 week % 1 Month % 3 Month % 6 Month % 12 Month % 5 Day Trend 52W H/L 1W H/L
Gold Spot $ 1,619 $ 43.44 2.7% 3.8% 10.0% 7.4% 21.0% $ 1,624 $ 1,619
US$/oz $ 1,266 $ 1,576
Silver Spot $ 18.37 $ 0.72 3.9% 1.6% 7.1% 7.0% 14.4% $ 19.65 $ 18.43
US$/oz $ 14.29 $ 17.65
Platinum Spot $ 980 $ 10.14 1.0% (3.9)% 6.9% 15.4% 18.5% $ 1,042 $ 1,008
US$/oz $ 789 $ 966
Palladium Spot $ 2,703 $ 269.05 10.0% 6.2% 53.0% 81.4% 81.5% $ 2,850 $ 2,717
US$/oz $ 1,268 $ 2,434
Name Close 1Wk Δ 1 week % 1 Month % 3 Month % 6 Month % 12 Month % 5 Day Trend 52W H/L 1W H/L
Copper Future $ 2.59 $ (0.03) (1.1%) (8.4)% (2.5)% 0.4% (11.2)% $ 2.98 $ 2.63
US$/lb $ 2.51 $ 2.59
Nickel Spot $ 5.71 $ (0.28) (4.9%) (9.8)% (12.1)% (20.8)% (1.9)% $ 8.45 $ 5.99
US$/lb $ 5.25 $ 5.71
Lead Spot $ 0.88 $ 0.01 1.5% (1.0)% (2.2)% (6.0)% (4.6)% $ 1.03 $ 0.89
US$/lb $ 0.80 $ 0.86
Zinc Spot $ 0.95 $ (0.03) (3.0%) (14.9)% (10.2)% (5.3)% (22.9)% $ 1.37 $ 0.98
US$/lb $ 0.95 $ 0.95
Aluminum Spot $ 0.76 $ (0.02) (2.1%) (6.6)% (3.7)% (3.7)% (8.8)% $ 0.87 $ 0.78
US$/lb $ 0.76 $ 0.76
Iron Ore Spot $ 87.19 $ 1.40 1.6% (8.3)% 3.8% (5.7)% (1.2)% $ 140.00 $ 78.80
US$/t $ 77.70 $ 77.70
Name Close 1Wk Δ 1 week % 1 Month % 3 Month % 6 Month % 12 Month % 5 Day Trend 52W H/L 1W H/L
Newcastle Coal $ 67.60 $ (2.90) (4.3%) (5.5)% (6.0)% 0.9% (28.2)% $ 90.80 $ 70.55
US$/t $ 64.50 $ 67.60
Uranium Spot $ 24.60 $ 0.10 0.4% - (5.4)% (4.7)% (18.7)% $ 26.50 $ 24.60
US$/lb $ 24.85 $ 24.50
WTI $ 53.88 $ 2.22 4.1% (7.9)% (4.2)% 0.1% (8.2)% $ 64.99 $ 53.88
US$/bbl $ 49.50 $ 51.66
Brent $ 59.24 $ 2.90 4.9% (7.9)% (1.7)% 1.9% (9.8)% $ 70.99 $ 59.24
US$/bbl $ 53.11 $ 56.34
Henry Hub $ 1.92 $ 0.09 4.7% (3.5)% (22.1)% (22.1)% (34.0)% $ 3.04 $ 1.98
US$/MMBtu $ 1.75 $ 1.83.
PRECIOUS METALS
BASE METALS
ENERGY

Mick Carew, PhD, 604-697-6006, [email protected]
Emma Boggio, MSA, CPA, CA, 604-697-6166, [email protected]
The Weekly Dig
7 February 21, 2020
Commodities Prices and Inventories
Precious Metals
Source: Haywood Securities and Bloomberg
Commodities LME Spot Price Weekly Δ YTD Δ 1 Year Δ
Gold US$ 1,619 /oz 2.8% -1.1% -1.1%
Silver US$ 18.37 /oz 4.1% 2.9% 14.4%
Platinum US$ 980 /oz 1.0% 1.4% 18.5%
Spot Price
(5.0%)
(4.0%)
(3.0%)
(2.0%)
(1.0%)
-
1.0%
2.0%
3.0%
4.0%
5.0%
Precious Metals Weekly Change (12 weeks)
Gold Spot Silver Spot Platinum Spot
Mick Carew, PhD, 604-697-6006, [email protected]
Emma Boggio, MSA, CPA, CA, 604-697-6166, [email protected]
The Weekly Dig
8 February 21, 2020
Base Metals
Source: Haywood Securities and Bloomberg
Spot Price
Commodities LME Spot Price Weekly Δ YTD Δ 1 Year Δ
Copper US$ 2.59 /lb -1.1% -7.2% -11.2%
Zinc US$ 0.95 /lb -3.0% -7.9% -22.9%
Nickel US$ 5.71 /lb -4.7% -9.8% -1.9%
LME Inventory Total Inventory
Commodities LME Inventory Weekly Δ Total (t) YTD Δ 1 Year ΔDays of
Consumption
Copper 164,850 0.2% 453,875 49% 11% 7.0
Zinc 75,475 4.1% 197,279 149% 14% 5.6
Nickel 224,766 7.0% 261,560 39% 23% 42.6
. .
(8.0%)
(6.0%)
(4.0%)
(2.0%)
-
2.0%
4.0%
6.0%
Base Metals Weekly Change (12 weeks)
LME Copper Spot LME Zinc Spot LME Nickel Spot
(8.0%)
(6.0%)
(4.0%)
(2.0%)
-
2.0%
4.0%
6.0%
Base Metals Weekly Change (12 weeks)
LME Copper Spot LME Zinc Spot LME Nickel Spot

Mick Carew, PhD, 604-697-6006, [email protected]
Emma Boggio, MSA, CPA, CA, 604-697-6166, [email protected]
The Weekly Dig
9 February 21, 2020
Source: Haywood Securities and Bloomberg
1
Note: Total Inventories exclude the bonded warehouse inventories
28-Feb-1731-Mar-1730-Apr-1731-May-1730-Jun-1731-Jul-1731-Aug-1730-Sep-1731-Oct-1730-Nov-1731-Dec-1731-Jan-1828-Feb-1831-Mar-1830-Apr-1831-May-1830-Jun-1831-Jul-1831-Aug-1830-Sep-1831-Oct-1830-Nov-1831-Dec-1831-Jan-1928-Feb-1931-Mar-1930-Apr-1931-May-1930-Jun-1931-Jul-1931-Aug-1930-Sep-1931-Oct-1930-Nov-1931-Dec-1931-Jan-20
-
100,000
200,000
300,000
400,000
500,000
600,000
700,000
800,000
900,000
1,000,000
$ -
$ 0.50
$ 1.00
$ 1.50
$ 2.00
$ 2.50
$ 3.00
$ 3.50
Ton
nes
of I
nve
nto
ries
Co
pp
er (U
S $
/lb
)
Copper Price & Inventories
CU Del Stocks LME COPPER TOTAL Comex Copper Stocks LME Copper Price
28-Feb-1731-Mar-1730-Apr-1731-May-1730-Jun-1731-Jul-1731-Aug-1730-Sep-1731-Oct-1730-Nov-1731-Dec-1731-Jan-1828-Feb-1831-Mar-1830-Apr-1831-May-1830-Jun-1831-Jul-1831-Aug-1830-Sep-1831-Oct-1830-Nov-1831-Dec-1831-Jan-1928-Feb-1931-Mar-1930-Apr-1931-May-1930-Jun-1931-Jul-1931-Aug-1930-Sep-1931-Oct-1930-Nov-1931-Dec-1931-Jan-20
-
100,000
200,000
300,000
400,000
500,000
600,000
700,000
$ -
$ 0.20
$ 0.40
$ 0.60
$ 0.80
$ 1.00
$ 1.20
$ 1.40
$ 1.60
$ 1.80
Ton
nes
of I
nve
nto
ries
Zin
c (U
S $
/lb
)
Zinc Price & Inventories
LME ZINC TOTAL SHFE Zinc Weekly Inventory Zi LME Zinc Price
28-Feb-1731-Mar-1730-Apr-1731-May-1730-Jun-1731-Jul-1731-Aug-1730-Sep-1731-Oct-1730-Nov-1731-Dec-1731-Jan-1828-Feb-1831-Mar-1830-Apr-1831-May-1830-Jun-1831-Jul-1831-Aug-1830-Sep-1831-Oct-1830-Nov-1831-Dec-1831-Jan-1928-Feb-1931-Mar-1930-Apr-1931-May-1930-Jun-1931-Jul-1931-Aug-1930-Sep-1931-Oct-1930-Nov-1931-Dec-1931-Jan-20
-
50,000
100,000
150,000
200,000
250,000
300,000
350,000
400,000
450,000
500,000
$ -
$ 1.00
$ 2.00
$ 3.00
$ 4.00
$ 5.00
$ 6.00
$ 7.00
$ 8.00
$ 9.00
Ton
nes
of I
nve
nto
ries
Nic
kel
(US
$/l
b)
Nickel Price & Inventories
LME NICKEL TOTAL Del Stk Total LME Nickel Price
28-Feb-1731-Mar-1730-Apr-1731-May-1730-Jun-1731-Jul-1731-Aug-1730-Sep-1731-Oct-1730-Nov-1731-Dec-1731-Jan-1828-Feb-1831-Mar-1830-Apr-1831-May-1830-Jun-1831-Jul-1831-Aug-1830-Sep-1831-Oct-1830-Nov-1831-Dec-1831-Jan-1928-Feb-1931-Mar-1930-Apr-1931-May-1930-Jun-1931-Jul-1931-Aug-1930-Sep-1931-Oct-1930-Nov-1931-Dec-1931-Jan-20
-
50,000
100,000
150,000
200,000
250,000
300,000
$ -
$ 0.20
$ 0.40
$ 0.60
$ 0.80
$ 1.00
$ 1.20
$ 1.40
Ton
nes
of I
nve
nto
ries
Lead
(U
S $
/lb
)
Lead Price & Inventories
LME LEAD TOTAL Lead Del Stocks/Total LME Lead Price

Mick Carew, PhD, 604-697-6006, [email protected]
Emma Boggio, MSA, CPA, CA, 604-697-6166, [email protected]
The Weekly Dig
10 February 21, 2020
Commodities and ETFs: A Week in Action
Gold – 1-Year US$/oz (left) and Total ETF Holdings (right)
Spot: Gain (+2.8%) for the week
ETF Holdings: 83,867,409 ounces, up 510,133 ounces for the week
Silver – 1-Year US$/oz (left) and Total ETF Holdings (right)
Spot: Gain (+4.0%) for the week
ETF Holdings: 610,444,548 ounces, down 768,550 ounces for the week
Platinum – 1-Year US$/oz (left) and Total ETF Holdings (right)
Spot: Gain (+1.0%) for the week
ETF Holdings: 3,330,777 ounces, down 18,940 ounces for the week
Palladium – 1-Year US$/oz (left) and Total ETF Holdings (right)
Spot: Gain (+11.0%) for the week
ETF Holdings: 559,478 ounces, up 1,794 ounces for the week
Copper – 1-Year US$/lb (left) and LME Inventory (right)
Futures: Loss (-1.1%) for the week
LME Copper: 164,850 tonnes, up 300 tonnes for the week
$1,050
$1,150
$1,250
$1,350
$1,450
$1,550
$1,650
Feb-19 Feb-20Gold ($/oz)
Price
100D MA61
66
71
76
81
86
Feb-19 Feb-20Gold ETF Holdings (Moz)
$13.00
$16.00
$19.00
Feb-19 Feb-20Silver ($/oz)
Price
100D MA
500520540560580600620640
Feb-19 Feb-20Silver ETF Holdings (Moz)
$700
$900
$1,100
Feb-19 Feb-20Platinum ($/oz)
Price
100D MA
2.2
2.7
3.2
3.7
Feb-19 Feb-20Platinum ETF Holdings (Moz)
$460
$1,460
$2,460
$3,460
Feb-19 Feb-20Palladium ($/oz)
Price
100D MA
0.5
0.7
0.9
Feb-19 Feb-20Palladium ETF Holdings (Moz)
$2.00
$3.00
$4.00
Feb-19 Feb-20Copper ($/lb)
Price
100D MA
100,000
200,000
300,000
400,000
Feb-19 Feb-20LME Copper Inventories (t)

Mick Carew, PhD, 604-697-6006, [email protected]
Emma Boggio, MSA, CPA, CA, 604-697-6166, [email protected]
The Weekly Dig
11 February 21, 2020
Nickel – 1-Year US$/lb (left) and LME Inventory (right)
Spot: Loss (-4.7%) for the week
LME Nickel: 224,766 tonnes, up 14,700 tonnes for the week
Lead – 1-Year US$/lb (left) and LME Inventory (right)
Spot: Gain (+1.5%) for the week
LME Lead: 66,725 tonnes, down 25 tonnes for the week
Zinc – 1-Year US$/lb (left) and LME Inventory (right)
Spot: Loss (-3.0%) for the week
LME Zinc: 75,475 tonnes, up 2,975 tonnes for the week
Iron – 1-Year US$/t 62% Fe (left) and 1-Year US$/t Newcastle (right)
Newcastle Thermal Futures: Loss (-0.7%) for the week
62% Fe Iron Ore: Gain (+1.6%) for the week
Uranium – 1-Year US$/lb Short Term (left) and Long-term (right)
Uranium Long: Gain (+0.2%) for the week
Source: Bloomberg, UxC Consulting, and Haywood Securities
$3.70
$5.20
$6.70
$8.20
Feb-19 Feb-20Nickel ($/lb)
Price
100D MA
50,000
100,000
150,000
200,000
250,000
300,000
Feb-19 Feb-20LME Nickel Inventories (t)
$0.75
$0.95
$1.15
Feb-19 Feb-20Lead ($/lb)
Price
100D MA
50,000
70,000
90,000
110,000
130,000
150,000
170,000
Feb-19 Feb-20LME Lead Inventories (t)
$0.90
$1.40
Feb-19 Feb-20Zinc ($/lb)
Price
100D MA
40,000
90,000
140,000
190,000
240,000
290,000
Feb-19 Feb-20LME Zinc Inventories (t)
$50
$90
$130
Feb-19 Feb-2062% Iron Ore ($/t)
Price
100D MA$60
$110
Feb-19 Feb-20Newcastle Therma Coal (USD/t)
Price
100D MA
$18
$23
$28
Feb-19 Uranium Spot ($/lb)
Price
100D MA
$20
$25
$30
$35
Feb-19 Uranium Long-Term ($/lb)
Price
100D MA
Mick Carew, PhD, 604-697-6006, [email protected]
Emma Boggio, MSA, CPA, CA, 604-697-6166, [email protected]
The Weekly Dig
12 February 21, 2020
Upcoming Macroeconomic News and Events
Source: Bloomberg
Date Event Period Survey Prior Relevance
United States02/21/20 Markit US Manufacturing PMI Feb P 51.5 51.9 9002/21/20 Markit US Services PMI Feb P 53.4 53.4 7002/21/20 Markit US Composite PMI Feb P -- 53.3 7002/21/20 Existing Home Sales Jan 5.44m 5.54m 8802/24/20 Chicago Fed Nat Activity Index Jan -- -0.35 6302/24/20 Dallas Fed Manf. Activity Feb 0 -0.2 6402/25/20 FHFA House Price Index MoM Dec 0.40% 0.20% 6902/25/20 Conf. Board Consumer Confidence Feb 132.5 131.6 9402/25/20 Richmond Fed Manufact. Index Feb 10 20 7102/26/20 MBA Mortgage Applications 21-Feb -- -6.40% 9202/26/20 New Home Sales Jan 710k 694k 9102/27/20 GDP Annualized QoQ 4Q S 2.20% 2.10% 9702/27/20 Personal Consumption 4Q S -- 1.80% 6802/27/20 GDP Price Index 4Q S 1.40% 1.40% 7702/27/20 Core PCE QoQ 4Q S -- 1.30% 6802/27/20 Durable Goods Orders Jan P -1.50% 2.40% 9302/27/20 Durables Ex Transportation Jan P 0.30% -0.10% 7402/27/20 Initial Jobless Claims 22-Feb -- 210k 9802/27/20 Continuing Claims 15-Feb -- 1726k 6902/27/20 Bloomberg Consumer Comfort 23-Feb -- 65.6 6702/27/20 Pending Home Sales MoM Jan 2.00% -4.90% 7702/28/20 Wholesale Inventories MoM Jan P -- -0.20% 8102/28/20 Personal Income Jan 0.30% 0.20% 8502/28/20 Personal Spending Jan 0.30% 0.30% 8502/28/20 MNI Chicago PMI Feb 46.3 42.9 8202/28/20 U. of Mich. Sentiment Feb F 100.7 100.9 94
Date Event Period Survey Prior Relevance
Canada02/21/20 Retail Sales MoM Dec 0.10% 0.90% 7902/21/20 Retail Sales Ex Auto MoM Dec 0.30% 0.20% 7702/24/20 Wholesale Trade Sales MoM Dec 0.50% -1.20% 6002/28/20 Quarterly GDP Annualized 4Q 0.20% 1.30% 9302/28/20 GDP MoM Dec 0.10% 0.10% 8402/28/20 Industrial Product Price MoM Jan -- 0.10% 65
Date Event Period Survey Prior Relevance
China02/28/20 Manufacturing PMI Feb 46 50 9002/28/20 Non-manufacturing PMI Feb -- 54.1 68

Mick Carew, PhD, 604-697-6006, [email protected]
Emma Boggio, MSA, CPA, CA, 604-697-6166, [email protected]
The Weekly Dig
13 February 21, 2020
Weekly Indices
Source: Bloomberg and Haywood Securities
.
.
250
255
260
265
270
275
280
17,750
17,800
17,850
17,900
17,950
18,000
Go
ld I
nd
ex
Co
mp
osi
te I
nd
ex
S&P/TSX Composite Index 0.6% WoW
S&P/TSX Global Gold Index 6.4% WoW
97
98
98
99
99
100
100
101
101
102
17,750
17,800
17,850
17,900
17,950
18,000
Ba
se M
eta
ls I
nd
ex
Co
mp
osi
te I
nd
ex
S&P/TSX Composite Index 0.6% WoW
S&P/TSX Global Base Metals Index -2.5% WoW
566
568
570
572
574
576
578
580
582
584
1,660
1,665
1,670
1,675
1,680
1,685
1,690
1,695
1,700
1,705
S&P
/TSX
Ven
ture
Co
mp
In
dex
Ru
ssel
l 20
00
Ind
ex
Russell 2000 Index 0.4% WoW
S&P/TSX Venture Comp Index 1.6% WoW
3,330
3,340
3,350
3,360
3,370
3,380
3,390
3,400
S&P
50
0 In
dex
S&P 500 Index -0.2% WoW
215
220
225
230
235
240
245
250
NYS
E A
RC
A E
xch
an
ge G
old
BU
GS
Ind
ex
NYSE ARCA Exchange Gold BUGS Index 6.5% WoW
760
770
780
790
800
810
820
830
840
850
NYS
E A
rca
Go
ld M
iner
s In
dex
NYSE Arca Gold Miners Index 5.6% WoW

Mick Carew, PhD, 604-697-6006, [email protected]
Emma Boggio, MSA, CPA, CA, 604-697-6166, [email protected]
The Weekly Dig
14 February 21, 2020
Weekly Equities
Equity Weekly Performance – Precious Metals Companies (S&P/TSX Global Mining Index and Haywood Covered Companies)
Source: Capital IQ and Haywood Securities
20%
17%
16%
15%
14%
12%
12%
12%
11%
11%
Harmony Gold Mining…
Sibanye Gold Limited
Torex Gold Resources Inc.
Minera Alamos Inc.
Bluestone Resources Inc.
Alamos Gold Inc.
Wheaton Precious Metals…
Gold Fields Limited
Nighthawk Gold Corp.
Pan American Silver Corp.
Top Companies
-35%-13%
-13%
-8%
-5%
-4%
-3%
-3%
-2%
Aurion Resources Ltd.
Harte Gold Corp.
Agnico Eagle Mines Limited
Treasury Metals Inc.
Kirkland Lake Gold Ltd.
TMAC Resources Inc.
Pure Gold Mining Inc.
IAMGOLD Corporation
Compañía de Minas…
Bottom Companies
1Wk 52Wk 1Wk 52Wk
$∆ High $∆ High
TSX:AEM Agnico Eagle Mines Limited 68.15 (10.14) (13)% 86.39 53.16 TSX:LUG Lundin Gold Inc. 11.11 1.04 10% 11.75 5.02
TSX:ASR Alacer Gold Corp. 6.53 0.34 5% 7.66 3.19 TSX:MAG MAG Silver Corp. 14.13 0.48 4% 18.60 11.94
TSX:AGI Alamos Gold Inc. 9.01 1.00 12% 10.12 5.63 TSX:MOZ Marathon Gold Corporation 1.54 0.05 3% 1.76 0.78
NYSE:AU AngloGold Ashanti Limited 26.81 0.96 4% 31.63 14.97 NYSE:MUX McEwen Mining Inc. 1.68 0.15 10% 2.84 1.35
TSX:AR Argonaut Gold Inc. 1.56 0.00 0% 2.87 1.46 TSXV:MTA Metalla Royalty & Streaming Ltd. 7.85 0.06 1% 8.69 3.68
TSX:AKG Asanko Gold Inc. 1.21 - - 1.45 0.68 TSX:MAX Midas Gold Corp. 0.56 0.02 4% 0.96 0.51
TSXV:AU Aurion Resources Ltd. 1.10 (0.60) (35)% 2.35 0.90 TSXV:MAI Minera Alamos Inc. 0.31 0.04 15% 0.32 0.10
TSX:BTO B2Gold Corp. 6.02 0.48 9% 6.01 3.24 TSX:NGD New Gold Inc. 1.07 0.06 6% 2.03 0.82
TSX:ABX Barrick Gold Corporation 27.54 2.42 10% 27.84 15.72 NYSE:NEM Newmont Corporation 63.79 5.43 9% 61.56 39.48
TSXV:BSR Bluestone Resources Inc. 1.92 0.24 14% 2.00 0.85 TSX:NHK Nighthawk Gold Corp. 2.44 0.25 11% 3.65 1.55
TSX:CG Centerra Gold Inc. 10.11 0.32 3% 13.00 6.36 TSX:NG NovaGold Resources Inc. 12.32 0.20 2% 12.59 4.87
TSX:CGG China Gold International Resources Corp. Ltd.1.01 (0.01) (1)% 1.93 0.88 TSX:OGC OceanaGold Corporation 2.44 (0.04) (2)% 4.59 2.12
NYSE:CDE Coeur Mining, Inc. 8.35 0.25 3% 10.99 3.69 TSX:OR Osisko Gold Royalties Ltd 13.91 0.49 4% 17.47 11.00
NYSE:BVN Compañía de Minas Buenaventura S.A.A.16.52 (0.22) (1)% 23.67 15.60 TSX:OSK Osisko Mining Inc. 3.89 0.33 9% 4.19 2.58
TSX:CNL Continental Gold Inc. 5.45 (0.01) (0)% 5.48 2.20 TSX:PAAS Pan American Silver Corp. 33.03 3.17 11% 32.90 13.83
TSX:ELD Eldorado Gold Corporation 10.00 0.76 8% 13.34 4.10 TSX:PG Premier Gold Mines Limited 1.54 - - 2.55 1.41
TSX:EDV Endeavour Mining Corporation 26.46 1.61 6% 28.98 17.24 TSX:PVG Pretium Resources Inc. 9.74 (0.09) (1)% 18.30 9.49
TSX:EDR Endeavour Silver Corp. 2.63 (0.02) (1)% 4.26 2.21 TSXV:PGM Pure Gold Mining Inc. 0.76 (0.02) (3)% 0.88 0.49
TSX:EQX Equinox Gold Corp. 12.59 1.13 10% 12.75 4.90 TSX:ROXG Roxgold Inc. 0.98 0.08 8% 1.42 0.79
TSXV:FPC Falco Resources Ltd. 0.30 0.02 5% 0.37 0.19 TSX:RNx Royal Nickel Corporation 0.45 0.01 1% 0.73 0.33
TSXV:FIL Filo Mining Corp. 1.96 0.07 4% 3.25 1.80 NasdaqGS:RGLD Royal Gold, Inc. 142.39 4.20 3% 184.04 106.95
TSX:FR First Majestic Silver Corp. 12.89 0.12 1% 16.50 7.38 TSX:SBB Sabina Gold & Silver Corp. 1.70 - - 2.28 0.99
TSX:FVI Fortuna Silver Mines Inc. 4.95 0.10 2% 6.12 3.22 TSX:SSL Sandstorm Gold Ltd. 9.53 0.39 4% 9.89 6.70
TSX:FNV Franco-Nevada Corporation 154.08 2.12 1% 155.73 93.24 NYSE:SA Seabridge Gold Inc. 17.86 0.40 2% 21.95 14.52
NYSE:GFI Gold Fields Limited 9.24 0.97 12% 9.56 4.73 TSX:SMF SEMAFO Inc. 3.17 0.01 0% 5.75 2.36
TSX:GSC Golden Star Resources Ltd. 3.99 0.06 2% 6.48 3.36 NYSE:SBGL Sibanye Gold Limited 16.75 2.38 17% 17.60 4.19
TSXV:GQC Goldquest Mining Corp. 0.14 0.01 8% 0.23 0.08 TSX:SVM Silvercorp Metals Inc. 5.37 (0.06) (1)% 7.69 2.71
TSX:GUY Guyana Goldfields Inc. 0.74 0.03 4% 1.66 0.46 TSX:SSRM SSR Mining Inc. 24.79 0.76 3% 25.33 14.23
NYSE:HMY Harmony Gold Mining Company Limited 4.87 0.80 20% 5.21 2.08 TSX:STGO Steppe Gold Ltd. 0.90 (0.01) (1)% 1.14 0.59
TSX:HRT Harte Gold Corp. 0.13 (0.02) (13)% 0.40 0.09 TSXV:SGI Superior Gold Inc. 0.76 0.04 6% 1.14 0.38
NYSE:HL Hecla Mining Company 4.31 0.39 10% 4.65 1.60 TSX:TMR TMAC Resources Inc. 2.26 (0.09) (4)% 6.95 2.25
TSX:IMG IAMGOLD Corporation 3.88 (0.10) (3)% 5.55 3.08 TSX:TXG Torex Gold Resources Inc. 21.06 2.87 16% 21.91 11.41
TSX:IVN Ivanhoe Mines Ltd. 3.68 0.09 3% 4.54 3.02 TSX:TML Treasury Metals Inc. 0.24 (0.02) (8)% 0.42 0.21
TSXV:KNT K92 Mining Inc. 4.40 0.35 9% 4.45 1.07 TSX:TLG Troilus Gold Corp. 0.77 0.03 4% 1.16 0.52
TSX:K Kinross Gold Corporation 7.42 0.61 9% 7.37 4.04 TSX:WDO Wesdome Gold Mines Ltd. 10.36 0.90 10% 10.47 3.96
TSX:KL Kirkland Lake Gold Ltd. 46.22 (2.46) (5)% 67.87 38.80 TSX:WPM Wheaton Precious Metals Corp. 43.03 4.54 12% 42.58 26.50
TSX:LGD Liberty Gold Corp. 1.34 0.10 8% 1.44 0.33 TSX:YRI Yamana Gold Inc. 5.89 0.56 11% 5.85 2.41
TSXV:LUM Lumina Gold Corp. 0.75 0.03 4% 0.78 0.50
%∆ LowCompany CloseTicker Low%∆CompanyTicker Close

Mick Carew, PhD, 604-697-6006, [email protected]
Emma Boggio, MSA, CPA, CA, 604-697-6166, [email protected]
The Weekly Dig
15 February 21, 2020
Weekly Performance – Precious Metals Companies (Covered Large Cap)
Source: Bloomberg and Haywood Securities
.
.
12.5%
9.6%
8.7%
8.2%
6.5%
3.7%
0.3%
(1.6%)
ALAMOS GOLD INC-CLASS A
BARRICK GOLD CORP
B2GOLD CORP
ELDORADO GOLD CORP
ENDEAVOUR MINING CORP
OSISKO GOLD ROYALTIES LTD
SEMAFO INC
OCEANAGOLD CORP
Weekly Price Change
21.0%
18.7%
15.8%
12.0%
10.3%
5.1%
2.2%
(0.4%)
SEMAFO INC
ALAMOS GOLD INC-CLASS A
BARRICK GOLD CORP
OSISKO GOLD ROYALTIES LTD
B2GOLD CORP
ENDEAVOUR MINING CORP
ELDORADO GOLD CORP
OCEANAGOLD CORP
1-Month Price Change
23.4%
21.7%
20.8%
17.5%
11.6%
8.9%
(3.6%)
(5.7%)
B2GOLD CORP
BARRICK GOLD CORP
ALAMOS GOLD INC-CLASS A
OSISKO GOLD ROYALTIES LTD
SEMAFO INC
ENDEAVOUR MINING CORP
OCEANAGOLD CORP
ELDORADO GOLD CORP
3-Month Price Change
24.6%
10.7%
(0.5%)
(5.8%)
(14.4%)
(16.2%)
(18.7%)
(36.6%)
B2GOLD CORP
BARRICK GOLD CORP
ENDEAVOUR MINING CORP
ALAMOS GOLD INC-CLASS A
ELDORADO GOLD CORP
OSISKO GOLD ROYALTIES LTD
OCEANAGOLD CORP
SEMAFO INC
6-Month Price Change
73.9%
51.8%
43.7%
39.5%
21.3%
0.6%
(11.7%)
(46.5%)
ELDORADO GOLD CORP
BARRICK GOLD CORP
B2GOLD CORP
ALAMOS GOLD INC-CLASS A
ENDEAVOUR MINING CORP
OSISKO GOLD ROYALTIES LTD
SEMAFO INC
OCEANAGOLD CORP
1-Year Price Change

Mick Carew, PhD, 604-697-6006, [email protected]
Emma Boggio, MSA, CPA, CA, 604-697-6166, [email protected]
The Weekly Dig
16 February 21, 2020
Weekly Performance – Precious Metals Companies (Covered Small Cap)
Source: Bloomberg and Haywood Securities
.
.
16.7%
14.3%
11.4%
10.3%
9.9%
9.3%
9.2%
8.9%
8.1%
7.7%
5.7%
5.6%
5.4%
4.5%
4.2%
4.1%
3.7%
3.4%
2.3%
0.8%
0.0%
0.0%
(3.8%)
(5.6%)
(7.7%)
(13.3%)
(35.9%)
MINERA ALAMOS INC
BLUESTONE RESOURCES INC
NIGHTHAWK GOLD CORP
LUNDIN GOLD INC
EQUINOX GOLD CORP
OSISKO MINING INC
K92 MINING
ROXGOLD INC
LIBERTY GOLD CORP
GOLDQUEST MINING CORP
MIDAS GOLD CORP
SUPERIOR GOLD INC
FALCO RESOURCES LTD
STEPPE GOLD LTD
LUMINA GOLD CORP
TROILUS GOLD CORP
FILO MINING CORP
MARATHON GOLD CORP
ROYAL NICKEL CORP
METALLA ROYALTY & STREAMING
ASANKO GOLD INC
SABINA GOLD & SILVER CORP
PURE GOLD MINING INC
CALIBRE MINING CORP
TREASURY METALS INC
HARTE GOLD CORP
AURION RESOURCES LTD
Weekly Price Change
33.7%
28.0%
24.2%
20.4%
15.6%
15.4%
10.9%
10.1%
9.5%
8.6%
7.1%
6.5%
4.7%
3.7%
2.0%
1.6%
0.0%
(1.5%)
(1.7%)
(2.0%)
(2.2%)
(2.3%)
(6.7%)
(8.6%)
(9.4%)
(16.1%)
(41.7%)
K92 MINING
BLUESTONE RESOURCES INC
TROILUS GOLD CORP
LUNDIN GOLD INC
EQUINOX GOLD CORP
LUMINA GOLD CORP
NIGHTHAWK GOLD CORP
SUPERIOR GOLD INC
STEPPE GOLD LTD
MINERA ALAMOS INC
ASANKO GOLD INC
ROXGOLD INC
LIBERTY GOLD CORP
GOLDQUEST MINING CORP
MARATHON GOLD CORP
OSISKO MINING INC
PURE GOLD MINING INC
METALLA ROYALTY & STREAMING
FALCO RESOURCES LTD
FILO MINING CORP
ROYAL NICKEL CORP
SABINA GOLD & SILVER CORP
MIDAS GOLD CORP
CALIBRE MINING CORP
TREASURY METALS INC
HARTE GOLD CORP
AURION RESOURCES LTD
1-Month Price Change
117.8%
94.9%
67.0%
56.4%
48.9%
47.7%
46.5%
45.2%
43.9%
37.5%
36.8%
29.3%
25.1%
20.6%
18.5%
16.7%
12.6%
8.5%
5.2%
4.9%
4.3%
2.0%
1.8%
0.0%
(8.0%)
(10.9%)
(31.9%)
K92 MINING
SUPERIOR GOLD INC
BLUESTONE RESOURCES INC
EQUINOX GOLD CORP
LIBERTY GOLD CORP
METALLA ROYALTY & STREAMING
MINERA ALAMOS INC
LUNDIN GOLD INC
FALCO RESOURCES LTD
OSISKO MINING INC
HARTE GOLD CORP
LUMINA GOLD CORP
NIGHTHAWK GOLD CORP
PURE GOLD MINING INC
TROILUS GOLD CORP
GOLDQUEST MINING CORP
ROXGOLD INC
ROYAL NICKEL CORP
ASANKO GOLD INC
CALIBRE MINING CORP
SABINA GOLD & SILVER CORP
MARATHON GOLD CORP
MIDAS GOLD CORP
TREASURY METALS INC
STEPPE GOLD LTD
FILO MINING CORP
AURION RESOURCES LTD
3-Month Price Change
119.7%
110.0%
93.8%
69.2%
63.8%
57.4%
46.6%
42.8%
22.9%
22.6%
14.1%
13.6%
12.1%
2.5%
1.3%
1.1%
(0.6%)
(2.1%)
(10.6%)
(17.6%)
(20.3%)
(27.2%)
(27.9%)
(29.1%)
(35.1%)
(37.4%)
(51.9%)
LIBERTY GOLD CORP
MINERA ALAMOS INC
K92 MINING
BLUESTONE RESOURCES INC
METALLA ROYALTY & STREAMING
EQUINOX GOLD CORP
CALIBRE MINING CORP
LUNDIN GOLD INC
FALCO RESOURCES LTD
PURE GOLD MINING INC
MARATHON GOLD CORP
LUMINA GOLD CORP
OSISKO MINING INC
ASANKO GOLD INC
TROILUS GOLD CORP
ROYAL NICKEL CORP
SABINA GOLD & SILVER CORP
STEPPE GOLD LTD
SUPERIOR GOLD INC
GOLDQUEST MINING CORP
ROXGOLD INC
NIGHTHAWK GOLD CORP
FILO MINING CORP
MIDAS GOLD CORP
TREASURY METALS INC
AURION RESOURCES LTD
HARTE GOLD CORP
6-Month Price Change
276.1%
243.6%
173.9%
122.8%
96.3%
81.9%
54.5%
53.6%
51.0%
31.4%
24.7%
23.5%
18.2%
18.1%
15.4%
10.1%
5.5%
5.4%
2.7%
(6.7%)
(10.6%)
(10.9%)
(14.2%)
(35.1%)
(38.2%)
K92 MINING
LIBERTY GOLD CORP
MINERA ALAMOS INC
EQUINOX GOLD CORP
LUNDIN GOLD INC
METALLA ROYALTY & STREAMING
CALIBRE MINING CORP
BLUESTONE RESOURCES INC
MARATHON GOLD CORP
STEPPE GOLD LTD
ASANKO GOLD INC
NIGHTHAWK GOLD CORP
OSISKO MINING INC
SABINA GOLD & SILVER CORP
LUMINA GOLD CORP
PURE GOLD MINING INC
TROILUS GOLD CORP
ROXGOLD INC
SUPERIOR GOLD INC
GOLDQUEST MINING CORP
FALCO RESOURCES LTD
FILO MINING CORP
AURION RESOURCES LTD
TREASURY METALS INC
ROYAL NICKEL CORP
1-Year Price Change

Mick Carew, PhD, 604-697-6006, [email protected]
Emma Boggio, MSA, CPA, CA, 604-697-6166, [email protected]
The Weekly Dig
17 February 21, 2020
Equity Weekly Performance – Base Metals Companies
Source: Bloomberg and Haywood Securities
.
.
6.4%
5.6%
1.9%
1.4%
0.7%
0.0%
0.0%
0.0%
(1.1%)
(1.6%)
(1.6%)
(2.7%)
(3.0%)
(3.1%)
(3.7%)
(4.4%)
(4.7%)
(5.4%)
(5.8%)
(7.9%)
(8.0%)
Osisko Metals Inc.
TREVALI MINING CORP
HUDBAY MINERALS INC
FIRST QUANTUM MINERALS LTD
S&P/TSX COMPOSITE INDEX
SHERRITT INTERNATIONAL CORP
XANADU MINES LTD
ATALAYA MINING PLC
LME COPPER SPOT ($)
COPPER MOUNTAIN MINING CORP
FIREWEED ZINC LTD
LUNDIN MINING CORP
LME ZINC SPOT ($)
NEVADA COPPER CORP
IMPERIAL METALS CORP
ADVENTUS MINING CORP
LME NICKEL SPOT ($)
S&P/TSX DIV MTLS&MIN IDX
TASEKO MINES LTD
TECK RESOURCES LTD-CLS B
CAPSTONE MINING CORP
Weekly Price Change
2.0%
0.0%
0.0%
(2.0%)
(7.5%)
(8.0%)
(8.2%)
(8.4%)
(9.8%)
(11.1%)
(12.6%)
(12.8%)
(13.9%)
(14.9%)
(15.6%)
(17.6%)
(20.0%)
(23.3%)
(24.4%)
(26.9%)
(28.5%)
S&P/TSX COMPOSITE INDEX
XANADU MINES LTD
FIREWEED ZINC LTD
Osisko Metals Inc.
ADVENTUS MINING CORP
FIRST QUANTUM MINERALS LTD
LUNDIN MINING CORP
LME COPPER SPOT ($)
LME NICKEL SPOT ($)
ATALAYA MINING PLC
HUDBAY MINERALS INC
SHERRITT INTERNATIONAL CORP
NEVADA COPPER CORP
LME ZINC SPOT ($)
IMPERIAL METALS CORP
S&P/TSX DIV MTLS&MIN IDX
TECK RESOURCES LTD-CLS B
CAPSTONE MINING CORP
COPPER MOUNTAIN MINING CORP
TREVALI MINING CORP
TASEKO MINES LTD
1-Month Price Change
40.0%
16.9%
14.8%
11.8%
10.9%
10.8%
10.7%
7.5%
5.5%
4.6%
4.1%
2.0%
(2.2%)
(2.5%)
(4.4%)
(6.5%)
(10.2%)
(10.5%)
(12.1%)
(13.9%)
(19.1%)
XANADU MINES LTD
CAPSTONE MINING CORP
NEVADA COPPER CORP
TREVALI MINING CORP
FIREWEED ZINC LTD
IMPERIAL METALS CORP
COPPER MOUNTAIN MINING CORP
Osisko Metals Inc.
S&P/TSX COMPOSITE INDEX
TASEKO MINES LTD
ATALAYA MINING PLC
FIRST QUANTUM MINERALS LTD
LUNDIN MINING CORP
LME COPPER SPOT ($)
ADVENTUS MINING CORP
HUDBAY MINERALS INC
LME ZINC SPOT ($)
SHERRITT INTERNATIONAL CORP
LME NICKEL SPOT ($)
S&P/TSX DIV MTLS&MIN IDX
TECK RESOURCES LTD-CLS B
3-Month Price Change
34.4%
32.7%
19.3%
17.3%
10.7%
2.9%
2.7%
2.7%
0.4%
0.0%
(3.5%)
(5.3%)
(7.4%)
(10.1%)
(15.3%)
(15.7%)
(20.8%)
(22.3%)
(30.8%)
(34.6%)
(36.4%)
FIRST QUANTUM MINERALS LTD
CAPSTONE MINING CORP
LUNDIN MINING CORP
FIREWEED ZINC LTD
S&P/TSX COMPOSITE INDEX
HUDBAY MINERALS INC
TASEKO MINES LTD
TREVALI MINING CORP
LME COPPER SPOT ($)
NEVADA COPPER CORP
ATALAYA MINING PLC
LME ZINC SPOT ($)
Osisko Metals Inc.
COPPER MOUNTAIN MINING CORP
S&P/TSX DIV MTLS&MIN IDX
ADVENTUS MINING CORP
LME NICKEL SPOT ($)
TECK RESOURCES LTD-CLS B
IMPERIAL METALS CORP
SHERRITT INTERNATIONAL CORP
XANADU MINES LTD
6-Month Price Change
11.9%
6.5%
6.2%
(1.1%)
(1.9%)
(5.6%)
(5.7%)
(11.2%)
(17.8%)
(19.8%)
(22.9%)
(23.9%)
(29.5%)
(32.7%)
(33.0%)
(43.2%)
(43.3%)
(50.4%)
(51.9%)
(66.0%)
S&P/TSX COMPOSITE INDEX
LUNDIN MINING CORP
CAPSTONE MINING CORP
ADVENTUS MINING CORP
LME NICKEL SPOT ($)
IMPERIAL METALS CORP
Osisko Metals Inc.
LME COPPER SPOT ($)
FIRST QUANTUM MINERALS LTD
ATALAYA MINING PLC
LME ZINC SPOT ($)
COPPER MOUNTAIN MINING CORP
NEVADA COPPER CORP
TASEKO MINES LTD
FIREWEED ZINC LTD
TECK RESOURCES LTD-CLS B
S&P/TSX DIV MTLS&MIN IDX
HUDBAY MINERALS INC
TREVALI MINING CORP
SHERRITT INTERNATIONAL CORP
1-Year Price Change

Mick Carew, PhD, 604-697-6006, [email protected]
Emma Boggio, MSA, CPA, CA, 604-697-6166, [email protected]
The Weekly Dig
18 February 21, 2020
Equity Weekly Performance – Major International Miners
Source: Bloomberg and Haywood Securities
.
.
2.2%
(0.4%)
(0.7%)
(1.2%)
(2.6%)
(2.9%)
(4.2%)
(4.5%)
(7.9%)
ALCOA CORP
ALUMINUM CORP OF CHINA-ADR
VALE SA-SP ADR
RIO TINTO PLC-SPON ADR
BHP GROUP LTD-SPON ADR
SOUTHERN COPPER CORP
FREEPORT-MCMORAN INC
GLENCORE PLC -UNSP ADR
TECK RESOURCES LTD-CLS B
Weekly Price Change
(6.1%)
(6.7%)
(9.0%)
(10.3%)
(10.7%)
(12.8%)
(13.1%)
(13.9%)
(20.0%)
FREEPORT-MCMORAN INC
GLENCORE PLC -UNSP ADR
ALCOA CORP
BHP GROUP LTD-SPON ADR
RIO TINTO PLC-SPON ADR
SOUTHERN COPPER CORP
VALE SA-SP ADR
ALUMINUM CORP OF CHINA-ADR
TECK RESOURCES LTD-CLS B
1-Month Price Change
9.5%
5.2%
3.6%
2.0%
0.8%
(4.8%)
(5.4%)
(19.1%)
(21.0%)
FREEPORT-MCMORAN INC
VALE SA-SP ADR
SOUTHERN COPPER CORP
RIO TINTO PLC-SPON ADR
BHP GROUP LTD-SPON ADR
ALUMINUM CORP OF CHINA-ADR
GLENCORE PLC -UNSP ADR
TECK RESOURCES LTD-CLS B
ALCOA CORP
3-Month Price Change
31.4%
27.0%
11.2%
10.0%
9.8%
4.6%
(1.5%)
(12.1%)
(22.3%)
FREEPORT-MCMORAN INC
SOUTHERN COPPER CORP
RIO TINTO PLC-SPON ADR
GLENCORE PLC -UNSP ADR
VALE SA-SP ADR
BHP GROUP LTD-SPON ADR
ALUMINUM CORP OF CHINA-ADR
ALCOA CORP
TECK RESOURCES LTD-CLS B
6-Month Price Change
6.9%
(2.0%)
(3.1%)
(6.5%)
(9.5%)
(22.6%)
(24.4%)
(43.2%)
(44.9%)
SOUTHERN COPPER CORP
RIO TINTO PLC-SPON ADR
VALE SA-SP ADR
BHP GROUP LTD-SPON ADR
FREEPORT-MCMORAN INC
GLENCORE PLC -UNSP ADR
ALUMINUM CORP OF CHINA-ADR
TECK RESOURCES LTD-CLS B
ALCOA CORP
1-Year Price Change

The Weekly Dig
Mick Carew, PhD, 604-697-6006, [email protected]
Emma Boggio, MSA, CPA, CA, 604-697-6166, [email protected]
19
February 21, 2020
Comparables Tables – Precious Metals
Large Cap Precious Metals Companies – Market and Valuation Statistics (Haywood Estimates)
Source: Bloomberg and Haywood Securities
Small Cap Precious Metals Companies – Market and Valuation Statistics (Haywood Estimates)
Source: Bloomberg and Haywood Securities
Last Shares MC Target Return NAVPS Primary Target / CFPS
Price (C$) O/S (M) (C$M) (C$) (%) (US$) 2019E 2020E Commodity 2019E 2020E 2019E 2020E 2019E 2020E 2019E 2020 2019E 2020E
Alamos Gold Inc. TSX:AGI AGI-T KS $9.01 391 $3,524 $10.25 14% BUY $11.22 $0.75 $0.80 Gold 490 450 $720 $785 $950 $1,040 0.6x 0.7x 8.4x 7.8x 10.3x 9.7x
B2Gold Corp. TSX:BTO BTO-T GM $6.02 1,030 $6,203 $7.50 25% BUY $3.51 $0.54 $0.66 Gold 969 1,002 $595 $530 $832 $802 1.3x 1.6x 8.9x 7.2x 10.5x 8.5x
Barrick Gold Corp TSX:ABX ABX-T KS $27.54 1,778 $48,960 $28.00 2% BUY $10.71 $1.85 $2.50 Gold 5,465 5,225 $675 $705 $870 $855 1.9x 2.0x 14.4x 10.6x 11.4x 8.4x
Eldorado Gold Corp. TSX:ELD ELD-T KS $10.00 165 $1,646 $18.00 80% BUY $11.91 $1.05 $2.40 Gold 985 805 $565 $575 $600 $595 0.6x 1.1x 9.7x 4.2x 12.9x 5.7x
Endeavour Mining Corp. TSX:EDV EDV-T GM $26.46 110 $2,909 $32.00 21% BUY $19.18 $2.79 $3.82 Gold 651 748 $646 $633 $818 $844 1.0x 1.3x 9.5x 6.9x 8.6x 6.3x
OceanaGold Corporation TSX:OGC OGC-T GM $2.44 622 $1,518 $2.75 13% HOLD $1.63 $0.33 $0.42 Gold 517 366 $789 $775 $1,062 $1,127 1.1x 1.3x 6.4x 5.0x 6.2x 4.9x
Osisko Gold Royalties Ltd. TSX:OR OR-T KS $13.91 157 $2,190 $19.50 40% BUY $12.42 $0.47 $0.63 Gold 78 88 0.8x 1.2x 24.6x 18.2x 31.4x 23.2x
SEMAFO Inc. TSX:SMF SMF-T KS $3.17 334 $1,060 $2.75 (13%) HOLD $2.83 $0.72 $0.62 Gold 330 312 $545 $730 $780 $1,070 0.8x 0.7x 3.7x 4.2x 2.9x 3.3x
Group Average 1.0x 1.2x 10.7x 8.0x 11.8x 8.8x
C$/US$ = 1.3x 1.326
Company Ticker Analyst RatingTCC, US$/oz AISC, US$/ozCFPS (US$) Production, ounces 000's EV / CFPS Price /
NAV
Target /
NAV
Last Shares MC Target Return NAVPS Primary Target / CFPS
Price (C$) O/S (M) (C$M) (C$) (%) (US$) 2019E 2020E Commodity 2019E 2020E 2019E 2020E 2019E 2020E 2019E 2020 2019E 2020E
Asanko Gold Inc. TSX:AKG AKG-T GM $1.21 224 $272 $1.15 (5%) HOLD $1.40 ($0.02) $0.24 Gold 251 244 $850 $904 $1,110 $1,044 0.7x 0.6x - 3.2x - 3.5x
Aurion Resources Ltd. TSXV:AU AU-V MC $1.10 83 $92 $3.50 218% BUY $2.62 ($0.00) ($0.02) Gold 0.3x 1.0x - - - -
Bluestone Resources Inc. TSXV:BSR BSR-V KS $1.92 77 $147 $3.00 56% BUY $2.46 ($0.18) ($0.07) Gold 0.6x 0.9x - - - -
Calibre Mining Corp. TSX:CXB CXB-T GM $0.85 328 $279 $1.80 112% BUY $1.25 $0.02 $0.21 Gold 34 161 $866 $883 $959 $1,100 0.5x 1.1x 26.8x 2.6x 66.9x 6.4x
Equinox Gold Corp. TSX:EQX EQX-T KS $12.59 113 $1,428 $14.50 15% BUY $10.90 $0.83 $1.53 Gold 201 270 $760 $785 $975 $1,005 0.9x 1.0x 13.7x 7.5x 13.2x 7.1x
Falco Resources Ltd. TSXV:FPC FPC-V PV $0.30 208 $61 $0.40 36% HOLD $1.26 ($0.01) ($0.05) Gold - - - - - - 0.2x 0.2x - - - -
Filo Mining Corp. TSXV:FIL FIL-V GM $1.96 88 $173 $4.60 135% BUY $3.90 ($0.20) ($0.27) Gold - - - - - - 0.4x 0.9x - - - -
Gold Road Resources Limited ASX:GOR GOR-AU GM $1.49 879 $1,310 $0.85 (43%) HOLD $0.72 ($0.02) $0.09 Gold 2 216 $3,285 $731 $5,222 $754 1.6x 0.9x - 14.2x - 7.5x
Goldquest Mining Corp. TSXV:GQC GQC-V PV $0.14 257 $36 $0.08 (43%) Sell $0.06 ($0.01) ($0.01) Gold - - - - - - 1.8x 1.0x - - - -
Harte Gold Corp. TSX:HRT HRT-T PV $0.13 677 $88 $0.25 92% Restricted $0.25 ($0.01) $0.03 Gold 27 45 $1,316 $995 $1,834 $1,320 0.4x 0.8x - 6.9x - 6.4x
K92 Mining Inc. TSXV:KNT KNT-V MC $4.40 213 $937 $4.75 8% BUY $3.60 $0.14 $0.30 Gold 81 113 $535 $652 $844 $795 0.9x 1.0x 23.9x 10.9x 25.8x 11.8x
Liberty Gold Corp. TSX:LGD LGD-T MC $1.34 239 $321 $1.60 19% BUY $1.28 ($0.04) ($0.06) Gold 0.8x 0.9x - - - -
Lumina Gold Corp. TSXV:LUM LUM-V GM $0.75 331 $248 $1.50 100% BUY $1.60 ($0.07) ($0.07) Gold - - - - - - 0.4x 0.7x - - - -
Lundin Gold Inc. TSX:LUG LUG-T KS $11.11 224 $2,491 $10.00 (10%) BUY $7.60 ($0.15) C$0.86 Gold - 290 - $450 - $565 1.1x 1.0x - 13.1x - 8.8x
Marathon Gold Corporation TSX:MOZ MOZ-T MC $1.54 179 $276 $2.50 62% BUY $1.91 $0.00 ($0.01) Gold 0.6x 1.0x 3,019.4x - 5,589.1x -
Metalla Royalty & Streaming Ltd. TSXV:MTA MTA-V KS $7.85 34 $268 $7.50 (4%) HOLD $3.77 C$0.00 C$0.01 Silver - - 1.6x 1.5x - 1,049.8x - 1,014.2x
Midas Gold Corp. TSX:MAX MAX-T GM $0.56 271 $152 $1.80 221% BUY $1.49 ($0.08) ($0.03) Gold - - - - - -
Minera Alamos Inc. TSXV:MAI MAI-V KS $0.31 406 $126 $0.50 61% BUY $0.49 $0.00 $0.03 Gold - 17 - 825 - 940 0.5x 0.8x - 7.1x - 11.5x
Nighthawk Gold Corp. TSX:NHK NHK-T MC $2.44 45 $110 $4.50 84% BUY $3.42 ($0.02) ($0.35) Gold 0.5x 1.0x - - - -
Osisko Mining Inc. TSX:OSK OSK-T MC $3.89 291 $1,132 $4.50 16% BUY $3.42 ($0.09) ($0.01) Gold 0.9x 1.0x - - - -
Pure Gold Mining Inc. TSXV:PGM PGM-V MC $0.76 359 $273 $1.30 71% BUY $0.97 ($0.04) ($0.04) Gold 0.6x 1.0x - - - -
Royal Nickel Corporation TSX:RNX RNX-T PV $0.45 608 $270 $0.70 57% BUY $0.43 $0.02 $0.07 Gold 64 100 $983 $963 $1,076 $1,023 0.8x 1.2x 21.6x 4.7x 32.7x 7.1x
Roxgold Inc. TSX:ROXG ROXG-T GM $0.98 372 $362 $1.70 74% BUY $1.10 $0.21 $0.24 Gold 142 127 $575 $593 $826 $950 0.7x 1.2x 3.8x 3.2x 6.2x 5.2x
Sabina Gold & Silver Corp. TSX:SBB SBB-T GM $1.70 297 $504 $2.00 18% HOLD $1.65 ($0.01) ($0.01) Gold - - - - - - 0.8x 0.9x - - - -
Steppe Gold Ltd. TSX:STGO STGO-T PV $0.90 48 $43 $1.75 94% BUY $1.28 ($0.12) $0.71 Gold - 60 - $579 - $696 0.5x 1.0x - 1.9x - 1.9x
Superior Gold Inc. TSXV:SGI SGI-V PV $0.76 97 $74 $1.15 51% BUY $1.23 $0.02 $0.42 Gold 83 100 $1 $990 $1 $1,095 0.5x 0.7x 20.0x 1.2x 34.9x 2.1x
Treasury Metals Inc. TSX:TML TML-T GM $0.24 170 $41 $1.00 317% BUY $1.16 ($0.02) ($0.01) Gold - - - - - -
Troilus Gold Corp. TSX:TLG TLG-T PV $0.77 71 $55 $2.00 160% BUY $2.27 ($0.28) ($0.16) Gold - - - - - - 0.3x 0.7x - - - -
Group Average 0.7x 0.9x 447.0x 86.6x 824.1x 84.1x
* Production & cost figures presented on a gold-equivalent basis C$/US$ = 1.33x 1.326
Ticker Analyst Company RatingTCC, US$/ozCFPS (US$) Production, ounces 000's AISC, US$/oz EV / CFPS Target /
NAV
Price /
NAV

The Weekly Dig
Mick Carew, PhD, 604-697-6006, [email protected]
Emma Boggio, MSA, CPA, CA, 604-697-6166, [email protected]
20
February 21, 2020
Precious Metals Companies – Market and Valuation Statistics (Consensus Estimates)
Source: Capital IQ and Haywood Securities
Shares Market Working Enterprise P/NAV
Company O/S Capitalization Capital Value
(millions) (millions) (millions) (millions) (millions) (millions) CFPS CFPS 2019E 2020E 2019E 2020E 2019E 2020E 2019E %
Senior Precious Metals Producers*
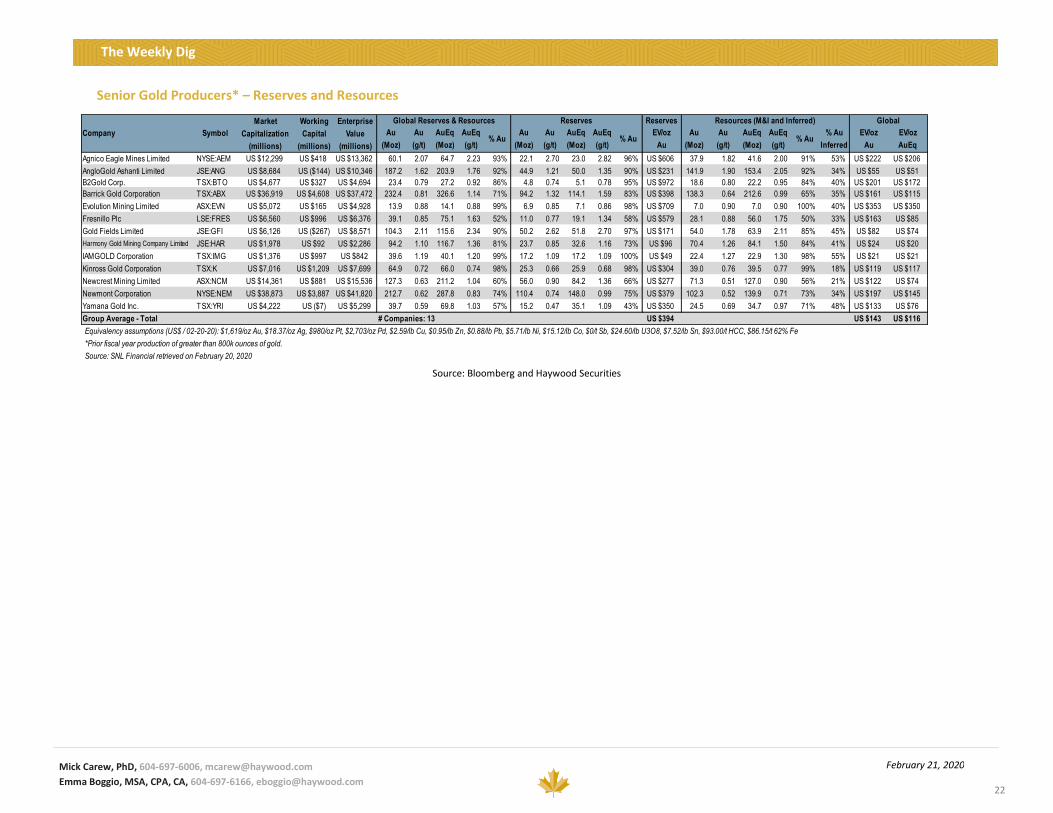
Agnico Eagle Mines Limited NYSE:AEM C$ 68.15 239.3 US$ 12,299 US$ 414 US$ 418 US$ 1,364 US$ 13,725 US$ 3.67 US$ 4.34 13 14.0x 11.9x 15.6x 13.2x 12.9x 10.9x 1.6x 1.61
AngloGold Ashanti Limited JSE:ANG C$ 27.75 415.0 US$ 8,684 US$ 349 (US$ 144) US$ 1,324 US$ 10,485 US$ 2.93 US$ 3.63 3 7.1x 5.8x 8.6x 7.0x 6.9x 4.7x 1.4x 0.33
B2Gold Corp. TSX:BTO C$ 6.02 1030.4 US$ 4,677 US$ 146 US$ 327 US$ 333 US$ 4,954 US$ 0.49 US$ 0.67 11 9.4x 6.8x 9.9x 7.2x 7.6x 5.4x 1.5x 0.67
Barrick Gold Corporation TSX:ABX C$ 27.54 1777.8 US$ 36,919 US$ 3,314 US$ 4,608 US$ 5,161 US$ 47,303 US$ 1.73 US$ 2.39 11 12.0x 8.7x 15.4x 11.2x 11.3x 9.3x 1.6x 0.95
Compañía de Minas Buenaventura S.A.A.NYSE:BVN C$ 16.52 254.0 US$ 3,165 US$ 280 US$ 274 US$ 453 US$ 3,707 US$ 0.97 US$ 0.73 2 12.8x 17.0x 15.0x 19.9x 18.8x 14.3x 0.9x 0.97
Evolution Mining Limited ASX:EVN C$ 3.95 1704.4 US$ 5,072 US$ 120 US$ 175 - US$ 4,979 US$ 0.27 US$ 0.32 6 11.1x 9.4x 10.9x 9.2x 10.3x 8.1x 1.5x 2.88
Fresnillo Plc LSE:FRES C$ 11.81 736.9 US$ 6,560 US$ 362 US$ 996 US$ 801 US$ 7,112 US$ 0.84 US$ 0.95 5 10.6x 9.4x 11.5x 10.1x 9.6x 7.8x 1.3x 3.02
Gold Fields Limited JSE:GFI C$ 9.34 870.1 US$ 6,126 US$ 515 (US$ 267) US$ 1,161 US$ 7,783 US$ 1.14 US$ 1.33 3 6.2x 5.3x 7.8x 6.7x 6.6x 4.4x 1.3x 1.89
IAMGOLD Corporation TSX:IMG C$ 3.88 470.3 US$ 1,376 US$ 837 US$ 997 US$ 404 US$ 1,086 US$ 0.52 US$ 0.81 12 5.6x 3.6x 4.4x 2.8x 4.4x 2.5x 0.6x -
Kinross Gold Corporation TSX:K C$ 7.42 1253.9 US$ 7,016 US$ 586 US$ 1,209 US$ 1,837 US$ 8,307 US$ 0.89 US$ 1.07 14 6.3x 5.2x 7.5x 6.2x 6.2x 5.3x 1.1x -
Newcrest Mining Limited ASX:NCM C$ 24.83 767.2 US$ 14,361 US$ 666 US$ 881 US$ 1,995 US$ 15,696 US$ 1.67 US$ 1.62 5 11.2x 11.6x 12.2x 12.6x 9.3x 8.6x 1.2x 1.17
Newmont Corporation NYSE:NEM C$ 48.10 808.2 US$ 29,312 US$ 2,480 US$ 3,887 US$ 6,138 US$ 44,224 US$ 3.88 US$ 4.66 12 12.4x 10.3x 14.1x 11.7x 12.3x 9.1x 1.4x 2.17
Northern Star Resources Limited ASX:NST C$ 12.70 740.0 US$ 7,086 US$ 959 US$ 895 US$ 330 US$ 6,582 US$ 0.47 US$ 0.65 5 20.2x 14.8x 18.7x 13.8x 20.0x 11.0x 1.6x 1.05
Yamana Gold Inc. TSX:YRI C$ 5.89 950.6 US$ 4,222 US$ 167 (US$ 7) US$ 992 US$ 5,194 US$ 0.53 US$ 0.66 14 8.4x 6.7x 10.3x 8.3x 7.3x 6.8x 1.5x 1.13
Group Average - Senior Producers 10.5x 9.0x 11.6x 10.0x 10.2x 7.7x 1.3x 1.49
Group Average - Senior Producers (excluding high/low) 10.1x 8.8x 11.6x 9.8x 9.9x 7.6x 1.4x 1.45
Intermediate Precious Metals Producers **
Alamos Gold Inc. TSX:AGI C$ 9.01 391.1 US$ 2,657 US$ 206 US$ 267 - US$ 2,456 US$ 0.72 US$ 0.72 11 9.5x 9.5x 8.8x 8.7x 8.5x 8.0x 0.8x 0.61
Centerra Gold Inc. TSX:CG C$ 10.11 293.7 US$ 2,239 US$ 80 US$ 671 US$ 69 US$ 2,283 US$ 1.48 US$ 2.04 10 5.2x 3.7x 5.3x 3.8x 4.0x 3.6x 0.8x -
Dundee Precious Metals Inc. TSX:DPM C$ 5.76 180.6 US$ 784 US$ 23 (US$ 5) US$ 10 US$ 795 US$ 0.74 US$ 1.03 7 5.9x 4.2x 6.0x 4.3x 5.3x 3.4x 0.7x 1.87
Eldorado Gold Corporation TSX:ELD C$ 10.00 164.6 US$ 1,241 US$ 138 US$ 212 US$ 450 US$ 1,671 US$ 0.99 US$ 2.17 12 7.7x 3.5x 10.3x 4.7x 7.3x 3.9x 0.6x -
Endeavour Mining Corporation TSX:EDV C$ 26.46 109.9 US$ 2,193 US$ 122 US$ 133 US$ 637 US$ 2,901 US$ 2.85 US$ 3.69 9 7.0x 5.4x 9.3x 7.1x 7.7x 5.9x 1.1x -
Golden Star Resources Ltd. TSX:GSC C$ 3.99 109.6 US$ 330 US$ 53 (US$ 17) US$ 91 US$ 301 US$ 0.35 US$ 0.57 3 8.5x 5.3x 7.8x 4.8x 5.2x 3.4x 0.7x -
Hecla Mining Company NYSE:HL C$ 4.31 522.9 US$ 1,699 US$ 62 US$ 62 US$ 505 US$ 2,171 US$ 0.24 US$ 0.33 7 13.8x 9.7x 17.6x 12.4x 12.5x 11.8x 1.4x 0.30
Highland Gold Mining Limited AIM:HGM C$ 3.72 363.9 US$ 1,019 US$ 8 (US$ 26) US$ 114 US$ 1,242 US$ 0.44 US$ 0.49 2 6.4x 5.7x 7.8x 7.0x 6.1x 5.8x 1.0x 5.83
Kirkland Lake Gold Ltd. TSX:KL C$ 46.22 286.6 US$ 9,990 US$ 616 US$ 359 - US$ 9,405 US$ 4.41 US$ 4.36 9 7.9x 8.0x 7.4x 7.5x 9.6x 6.8x 1.3x 1.33
Leagold Mining Corporation TSX:LMC C$ 4.16 285.0 US$ 894 US$ 56 US$ 128 US$ 290 US$ 1,140 US$ 0.46 US$ 0.63 5 6.8x 5.0x 8.6x 6.3x 7.5x 5.1x 0.8x -
New Gold Inc. TSX:NGD C$ 1.07 676.0 US$ 545 US$ 83 US$ 57 US$ 715 US$ 1,195 US$ 0.36 US$ 0.38 11 2.2x 2.1x 4.9x 4.7x 4.8x 4.1x 0.8x -
OceanaGold Corporation TSX:OGC C$ 2.44 622.3 US$ 1,145 US$ 49 US$ 14 US$ 150 US$ 1,320 US$ 0.33 US$ 0.39 12 5.6x 4.8x 6.4x 5.5x 6.2x 4.4x 0.7x -Perseus Mining Limited ASX:PRU C$ 1.11 1168.0 US$ 977 US$ 47 US$ 89 US$ 50 US$ 987 US$ 0.09 US$ 0.09 1 9.2x 9.0x 9.3x 9.1x 10.7x 6.0x 1.1x -
Pretium Resources Inc. TSX:PVG C$ 9.74 185.4 US$ 1,362 US$ 23 (US$ 67) US$ 397 US$ 1,806 US$ 1.16 US$ 1.10 7 6.3x 6.7x 8.4x 8.9x 8.8x 7.8x 0.8x -Regis Resources Limited ASX:RRL C$ 4.03 508.2 US$ 1,546 US$ 112 US$ 91 - US$ 1,464 US$ 0.35 US$ 0.40 4 8.7x 7.6x 8.2x 7.2x 7.1x 5.8x 1.0x 3.65
Resolute Mining Limited ASX:RSG C$ 1.05 1035.9 US$ 819 US$ 24 US$ 34 US$ 123 US$ 957 US$ 0.10 US$ 0.18 6 7.8x 4.5x 9.2x 5.2x 10.5x 4.1x 0.9x 1.76
Saracen Mineral Holdings Limited ASX:SAR C$ 3.69 1102.9 US$ 3,070 US$ 183 US$ 184 US$ 212 US$ 3,203 US$ 0.20 US$ 0.23 6 14.3x 12.4x 14.9x 12.9x 20.7x 9.6x 1.3x -
SEMAFO Inc. TSX:SMF C$ 3.17 334.5 US$ 800 US$ 78 US$ 109 US$ 14 US$ 881 US$ 0.72 US$ 0.64 5 3.3x 3.7x 3.7x 4.1x 3.3x 3.7x 0.8x -
St Barbara Limited ASX:SBM C$ 2.60 699.2 US$ 1,368 US$ 56 US$ 75 US$ 75 US$ 1,407 US$ 0.26 US$ 0.22 2 7.5x 8.7x 7.8x 9.0x 7.2x 6.0x 1.0x 2.90
Teranga Gold Corporation TSX:TGZ C$ 8.48 107.7 US$ 689 US$ 28 (US$ 54) US$ 140 US$ 863 US$ 0.74 US$ 1.17 3 8.7x 5.5x 10.9x 6.9x 6.2x 3.7x 0.7x -
Torex Gold Resources Inc. TSX:TXG C$ 21.06 85.4 US$ 1,356 US$ 162 US$ 97 US$ 92 US$ 1,369 US$ 3.25 US$ 3.02 7 4.9x 5.3x 4.9x 5.3x 4.1x 3.8x 0.9x -
Group Average - Intermediate Producers 7.5x 6.2x 8.4x 6.9x 7.8x 5.6x 0.9x 2.28
Group Average - Intermediate Producers (excluding high/low) 7.4x 6.1x 8.2x 6.8x 7.3x 5.4x 0.9x 2.02
Junior Precious Metals Producers ***
Alacer Gold Corp. TSX:ASR C$ 6.53 294.8 US$ 1,452 US$ 195 US$ 202 US$ 205 US$ 1,856 US$ 0.73 US$ 0.85 8 6.7x 5.8x 8.6x 7.4x 7.9x 6.3x 1.1x -Alio Gold Inc. TSX:ALO C$ 1.04 86.1 US$ 67 US$ 13 US$ 45 US$ 4 US$ 62 (US$ 0.02) US$ 0.17 3 - 4.6x - 4.2x - 2.7x 0.5x -
Argonaut Gold Inc. TSX:AR C$ 1.56 179.5 US$ 210 US$ 36 US$ 90 US$ 14 US$ 189 US$ 0.40 US$ 0.55 7 3.0x 2.1x 2.7x 1.9x 2.4x 1.4x 0.4x -Asanko Gold Inc. TSX:AKG C$ 1.21 224.4 US$ 205 US$ 31 US$ 33 - US$ 175 US$ 0.09 US$ 0.21 2 10.1x 4.5x 8.7x 3.8x 4.5x 2.8x 0.5x -
Calibre Mining Corp. TSX:CXB C$ 0.85 328.0 US$ 210 US$ 33 US$ 31 - US$ 178 US$ 0.12 US$ 0.21 1 5.2x 3.1x 4.4x 2.6x 8.7x 1.8x 0.4x -Equinox Gold Corp. TSX:EQX C$ 12.59 113.5 US$ 1,077 US$ 47 US$ 65 US$ 242 US$ 1,293 US$ 0.79 US$ 1.24 6 12.1x 7.7x 14.5x 9.2x 13.3x 9.4x 1.0x -
Guyana Goldfields Inc. TSX:GUY C$ 0.74 174.6 US$ 97 US$ 25 US$ 37 - US$ 76 US$ 0.09 US$ 0.37 3 6.4x 1.5x 5.0x 1.2x 2.9x 1.2x 0.2x -Jaguar Mining Inc. TSX:JAG C$ 0.22 723.9 US$ 120 US$ 12 US$ 6 - US$ 119 US$ 0.05 US$ 0.08 3 3.1x 2.2x 3.1x 2.2x 4.2x 3.4x 0.7x -
K92 Mining Inc. TSXV:KNT C$ 4.40 213.0 US$ 707 US$ 18 US$ 18 US$ 7 US$ 705 US$ 0.23 US$ 0.31 6 14.6x 10.7x 14.6x 10.7x 14.1x 7.1x 0.8x -Premier Gold Mines Limited TSX:PG C$ 1.54 212.0 US$ 246 US$ 33 US$ 27 US$ 19 US$ 241 (US$ 0.05) US$ 0.01 3 - 115.5x - 113.0x - 20.0x 0.5x -
Roxgold Inc. TSX:ROXG C$ 0.98 371.6 US$ 273 US$ 29 (US$ 3) US$ 14 US$ 294 US$ 0.21 US$ 0.19 4 3.5x 3.9x 3.8x 4.2x 3.3x 3.4x 0.6x -Royal Nickel Corporation TSX:RNX C$ 0.45 607.8 US$ 204 US$ 19 US$ 9 US$ 18 US$ 212 US$ 0.00 US$ 0.09 3 130.6x 3.9x 135.6x 4.1x 14.4x 3.5x 0.4x -
Superior Gold Inc. TSXV:SGI C$ 0.76 97.0 US$ 56 US$ 14 (US$ 2) - US$ 48 US$ 0.01 US$ 0.22 5 47.8x 2.5x 41.5x 2.2x 13.1x 1.5x 0.5x -TMAC Resources Inc. TSX:TMR C$ 2.26 115.3 US$ 196 US$ 36 US$ 77 US$ 107 US$ 275 US$ 0.64 US$ 0.88 7 2.7x 1.9x 3.7x 2.7x 3.6x 2.5x 0.3x -
Wesdome Gold Mines Ltd. TSX:WDO C$ 10.36 138.0 US$ 1,078 US$ 29 US$ 21 - US$ 1,058 US$ 0.45 US$ 0.47 10 17.2x 16.7x 16.9x 16.4x 16.7x 15.3x 1.3x -Westgold Resources Limited ASX:WGX C$ 1.96 399.7 US$ 592 US$ 47 US$ 9 - US$ 572 US$ 0.14 US$ 0.24 1 10.6x 6.2x 10.2x 6.0x 8.2x 4.9x 0.8x -
Group Average - Junior Producers 19.5x 12.1x 19.5x 12.0x 8.4x 5.5x 0.6x -
Group Average - Junior Producers (excluding high/low) 8.6x 5.4x 8.3x 5.5x 7.1x 4.7x 0.6x -
All data sourced from Capital IQ*Prior fiscal year production of greater than 800k ounces of gold.
**Prior fiscal year production of between 200k and 800k ounces of gold.
***Prior fiscal year production of less than 200k ounces of gold.
P/CF Ratio EV/CF Ratio EV/EBITDA Ratio Yield
Symbol PriceNumber of
Estimates
2020E2019EDebtCash

The Weekly Dig
Mick Carew, PhD, 604-697-6006, [email protected]
Emma Boggio, MSA, CPA, CA, 604-697-6166, [email protected]
21
February 21, 2020
Other Precious Metals Companies – Market and Valuation Statistics (Consensus Estimates)
Source: Capital IQ and Haywood Securities
Shares Market Working Enterprise
Company Symbol Price O/S Capitalization Capital Value
(millions) (millions) (millions) (millions) (millions) (millions) CFPS CFPS 2019E 2020E 2019E 2020E 2019E 2020E 2019E %
PGM Producers
Anglo American Platinum Limited JSE:AMS C$ 118.99 262.5 US$ 23,557 US$ 1,325 US$ 1,309 US$ 20 US$ 22,405 US$ 6.18 US$ 9.70 3 14.5x 9.3x 13.8x 8.8x 10.6x 6.0x 1.9x 2.38Impala Platinum Holdings Limited JSE:IMP C$ 14.44 782.8 US$ 8,522 US$ 600 US$ 989 US$ 390 US$ 8,656 US$ 0.63 US$ 1.43 2 17.3x 7.6x 17.6x 7.7x 13.0x 5.4x 2.5x -Northam Platinum Limited JSE:NHM C$ 12.83 349.9 US$ 3,385 US$ 68 US$ 193 US$ 1,034 US$ 4,304 US$ 0.48 US$ 1.58 2 20.2x 6.1x 25.7x 7.8x 21.3x 8.9x 1.5x -
Group Average - PGM Producers 17.4x 7.7x 19.0x 8.1x 15.0x 6.8x 2.0x 2.38
Silver Producers
Americas Gold and Silver CorporationTSX:USA C$ 4.01 86.6 US$ 262 US$ 6 US$ 4 US$ 11 US$ 279 US$ 0.03 US$ 0.46 2 118.9x 6.6x 126.5x 7.0x - 8.5x 0.6x -Coeur Mining, Inc. NYSE:CDE C$ 8.35 243.1 US$ 1,531 US$ 56 US$ 20 US$ 227 US$ 1,825 US$ 0.48 US$ 0.86 5 13.2x 7.3x 15.8x 8.7x 11.6x 6.7x 1.1x -Endeavour Silver Corp. TSX:EDR C$ 2.63 139.9 US$ 277 US$ 22 US$ 49 US$ 5 US$ 264 (US$ 0.02) US$ 0.18 6 - 10.8x - 10.3x - 10.1x 1.0x -Excellon Resources Inc. TSX:EXN C$ 0.84 112.5 US$ 71 US$ 9 US$ 9 - US$ 64 (US$ 0.02) US$ 0.06 2 - 9.9x - 8.9x - - 0.7x -First Majestic Silver Corp. TSX:FR C$ 12.89 209.8 US$ 2,039 US$ 176 US$ 171 US$ 155 US$ 2,041 US$ 0.54 US$ 0.49 5 18.0x 19.8x 18.0x 19.8x 19.6x 17.7x 2.5x -Fortuna Silver Mines Inc. TSX:FVI C$ 4.95 160.3 US$ 598 US$ 72 US$ 46 US$ 109 US$ 662 US$ 0.37 US$ 0.83 4 10.2x 4.5x 11.2x 5.0x 7.1x 4.0x 1.0x -Fresnillo Plc LSE:FRES C$ 11.81 736.9 US$ 6,560 US$ 362 US$ 996 US$ 801 US$ 7,112 US$ 0.84 US$ 0.95 5 10.6x 9.4x 11.5x 10.1x 9.6x 7.8x 1.3x 3.02Hecla Mining Company NYSE:HL C$ 4.31 522.9 US$ 1,699 US$ 62 US$ 62 US$ 505 US$ 2,171 US$ 0.24 US$ 0.33 7 13.8x 9.7x 17.6x 12.4x 12.5x 11.8x 1.4x 0.30Mandalay Resources Corporation TSX:MND C$ 1.06 91.1 US$ 73 US$ 23 (US$ 32) US$ 0 US$ 118 US$ 0.22 US$ 0.66 1 3.6x 1.2x 5.9x 2.0x 11.8x 1.7x 0.3x -Pan American Silver Corp. TSX:PAAS C$ 33.03 209.6 US$ 5,221 US$ 238 US$ 517 US$ 275 US$ 5,425 US$ 1.51 US$ 2.36 9 16.4x 10.5x 17.1x 11.0x 12.8x 9.0x 1.6x 0.81SSR Mining Inc. TSX:SSRM C$ 24.79 123.1 US$ 2,301 US$ 526 US$ 636 US$ 168 US$ 2,059 US$ 1.66 US$ 2.02 7 11.3x 9.3x 10.1x 8.3x 8.9x 7.2x 1.2x -Silvercorp Metals Inc. TSX:SVM C$ 5.37 173.2 US$ 701 US$ 155 US$ 134 - US$ 621 US$ 0.43 US$ 0.48 3 9.4x 8.5x 8.3x 7.6x 8.0x 8.4x 1.0x 0.59
Group Average - Silver Producers 22.5x 9.0x 24.2x 9.2x 11.3x 8.4x 1.2x 1.18
Group Average - Silver Producers (excluding high/low) 7.7x 8.6x 8.9x 8.9x 3.6x 7.5x 1.1x 0.70
Diamond Producers
Lucara Diamond Corp. TSX:LUC C$ 0.85 396.9 US$ 254 US$ 5 US$ 52 - US$ 250 US$ 0.13 US$ 0.16 4 4.9x 3.9x 4.8x 3.8x 3.5x 3.3x 0.5x -Mountain Province Diamonds Inc. TSX:MPVD C$ 1.14 210.4 US$ 181 US$ 21 US$ 70 US$ 292 US$ 452 US$ 0.32 US$ 0.43 3 2.7x 2.0x 6.8x 5.0x 6.4x 4.3x 0.7x 3.54Petra Diamonds Limited LSE:PDL C$ 0.11 865.4 US$ 71 US$ 40 US$ 97 US$ 733 US$ 810 US$ 0.11 US$ 0.09 4 0.8x 0.9x 8.7x 10.4x 4.9x 6.1x 0.3x -
Group Average - Diamond Producers 2.8x 2.3x 6.8x 6.4x 4.9x 4.6x 0.5x 3.54
Royalty Companies
Anglo Pacific Group plc LSE:APF C$ 2.65 180.9 US$ 361 US$ 18 US$ 17 - US$ 342 US$ 0.30 US$ 0.28 4 6.6x 7.0x 6.2x 6.7x 5.1x 5.3x 0.7x 5.16Altius Minerals Corporation TSX:ALS C$ 10.79 42.1 US$ 342 US$ 24 US$ 15 US$ 71 US$ 458 US$ 0.70 US$ 0.72 5 11.7x 11.4x 15.6x 15.2x 9.7x 10.3x 0.9x 1.85Franco-Nevada Corporation TSX:FNV C$ 154.08 189.4 US$ 22,003 US$ 92 US$ 220 US$ 242 US$ 22,156 US$ 3.24 US$ 3.90 14 35.8x 29.8x 36.1x 30.0x 33.8x 27.3x 2.4x 0.85Osisko Gold Royalties Ltd TSX:OR C$ 13.91 157.5 US$ 1,652 US$ 99 US$ 87 US$ 269 US$ 1,818 US$ 0.50 US$ 0.60 14 20.9x 17.6x 23.0x 19.3x 22.7x 21.6x 1.1x 1.42Royal Gold, Inc. US:RGLD C$ 142.39 65.6 US$ 7,041 US$ 81 US$ 92 US$ 130 US$ 7,128 US$ 4.30 US$ 5.01 11 25.0x 21.4x 25.3x 21.7x 22.9x 18.7x 2.0x 1.06Sandstorm Gold Ltd. TSX:SSL C$ 9.53 178.8 US$ 1,285 US$ 18 US$ 24 US$ 45 US$ 1,315 US$ 0.32 US$ 0.37 9 22.3x 19.5x 22.8x 20.0x 21.8x 17.9x 1.4x -Wheaton Precious Metals Corp. TSX:WPM C$ 43.03 447.2 US$ 14,511 US$ 152 US$ 124 US$ 1,014 US$ 15,375 US$ 1.19 US$ 1.50 15 27.4x 21.6x 29.0x 22.9x 28.0x 20.8x 1.8x 1.12
Group Average - Royalty Companies 21.4x 18.3x 22.6x 19.4x 20.6x 17.4x 1.5x 1.91
Group Average - Royalty Companies (excluding high/low) 21.4x 18.3x 23.1x 19.8x 21.0x 17.9x 1.5x 1.36
All data sourced from Capital IQ
EV/CF RatioCash Debt P/CF Ratio EV/EBITDA Ratio P/NAV2019E 2020E Number of
Estmates
Yield
The Weekly Dig
Mick Carew, PhD, 604-697-6006, [email protected]
Emma Boggio, MSA, CPA, CA, 604-697-6166, [email protected]
22
February 21, 2020
Senior Gold Producers* – Reserves and Resources
Source: Bloomberg and Haywood Securities
Reserves
Agnico Eagle Mines Limited NYSE:AEM US $12,299 US $418 US $13,362 60.1 2.07 64.7 2.23 93% 22.1 2.70 23.0 2.82 96% US $606 37.9 1.82 41.6 2.00 91% 53% US $222 US $206
AngloGold Ashanti Limited JSE:ANG US $8,684 US ($144) US $10,346 187.2 1.62 203.9 1.76 92% 44.9 1.21 50.0 1.35 90% US $231 141.9 1.90 153.4 2.05 92% 34% US $55 US $51
B2Gold Corp. TSX:BTO US $4,677 US $327 US $4,694 23.4 0.79 27.2 0.92 86% 4.8 0.74 5.1 0.78 95% US $972 18.6 0.80 22.2 0.95 84% 40% US $201 US $172
Barrick Gold Corporation TSX:ABX US $36,919 US $4,608 US $37,472 232.4 0.81 326.6 1.14 71% 94.2 1.32 114.1 1.59 83% US $398 138.3 0.64 212.6 0.99 65% 35% US $161 US $115
Evolution Mining Limited ASX:EVN US $5,072 US $165 US $4,928 13.9 0.88 14.1 0.88 99% 6.9 0.85 7.1 0.86 98% US $709 7.0 0.90 7.0 0.90 100% 40% US $353 US $350
Fresnillo Plc LSE:FRES US $6,560 US $996 US $6,376 39.1 0.85 75.1 1.63 52% 11.0 0.77 19.1 1.34 58% US $579 28.1 0.88 56.0 1.75 50% 33% US $163 US $85
Gold Fields Limited JSE:GFI US $6,126 US ($267) US $8,571 104.3 2.11 115.6 2.34 90% 50.2 2.62 51.8 2.70 97% US $171 54.0 1.78 63.9 2.11 85% 45% US $82 US $74
Harmony Gold Mining Company Limited JSE:HAR US $1,978 US $92 US $2,286 94.2 1.10 116.7 1.36 81% 23.7 0.85 32.6 1.16 73% US $96 70.4 1.26 84.1 1.50 84% 41% US $24 US $20
IAMGOLD Corporation TSX:IMG US $1,376 US $997 US $842 39.6 1.19 40.1 1.20 99% 17.2 1.09 17.2 1.09 100% US $49 22.4 1.27 22.9 1.30 98% 55% US $21 US $21
Kinross Gold Corporation TSX:K US $7,016 US $1,209 US $7,699 64.9 0.72 66.0 0.74 98% 25.3 0.66 25.9 0.68 98% US $304 39.0 0.76 39.5 0.77 99% 18% US $119 US $117
Newcrest Mining Limited ASX:NCM US $14,361 US $881 US $15,536 127.3 0.63 211.2 1.04 60% 56.0 0.90 84.2 1.36 66% US $277 71.3 0.51 127.0 0.90 56% 21% US $122 US $74
Newmont Corporation NYSE:NEM US $38,873 US $3,887 US $41,820 212.7 0.62 287.8 0.83 74% 110.4 0.74 148.0 0.99 75% US $379 102.3 0.52 139.9 0.71 73% 34% US $197 US $145
Yamana Gold Inc. TSX:YRI US $4,222 US ($7) US $5,299 39.7 0.59 69.8 1.03 57% 15.2 0.47 35.1 1.09 43% US $350 24.5 0.69 34.7 0.97 71% 48% US $133 US $76
Group Average - Total # Companies: 13 US $394 US $143 US $116
Equivalency assumptions (US$ / 02-20-20): $1,619/oz Au, $18.37/oz Ag, $980/oz Pt, $2,703/oz Pd, $2.59/lb Cu, $0.95/lb Zn, $0.88/lb Pb, $5.71/lb Ni, $15.12/lb Co, $0/t Sb, $24.60/lb U3O8, $7.52/lb Sn, $93.00/t HCC, $86.15/t 62% Fe
*Prior fiscal year production of greater than 800k ounces of gold.
Source: SNL Financial retrieved on February 20, 2020
Company EV/oz
Au
Global
EV/oz
AuEq
AuEq
(Moz)
Resources (M&I and Inferred)
AuEq
(g/t)% Au
% Au
Inferred
Reserves
Au
(Moz)
Au
(g/t)
Au
(Moz)
Au
(g/t)
AuEq
(Moz)
AuEq
(g/t)% Au
EV/oz
Au
Symbol
Market
Capitalization
(millions)
Working
Capital
(millions)
Enterprise
Value
(millions)
Global Reserves & Resources
AuEq
(g/t)% Au
Au
(Moz)
Au
(g/t)
AuEq
(Moz)

The Weekly Dig
Mick Carew, PhD, 604-697-6006, [email protected]
Emma Boggio, MSA, CPA, CA, 604-697-6166, [email protected]
23
February 21, 2020
Intermediate Gold Producers* – Reserves and Resources
Source: Bloomberg and Haywood Securities
Reserves
Alamos Gold Inc. TSX:AGI US $2,657 US $254 US $2,404 23.7 1.34 24.4 1.38 97% 10.5 1.55 10.9 1.61 97% US $229 13.2 1.20 13.5 1.23 98% 43% US $102 US $99
Centerra Gold Inc. TSX:CG US $2,239 US $671 US $1,666 32.6 0.42 47.8 0.62 68% 14.4 0.62 18.6 0.79 78% US $115 18.2 0.34 29.2 0.55 62% 36% US $51 US $35
China Gold International Resources Corp. Ltd. TSX:CGG US $302 US ($390) US $1,338 10.2 0.15 41.7 0.62 24% 4.0 0.25 15.8 0.99 25% US $336 6.2 0.12 25.7 0.50 24% 41% US $131 US $32
Dundee Precious Metals Inc. TSX:DPM US $784 US ($5) US $817 9.9 0.39 15.6 0.62 63% 2.6 3.32 3.2 4.11 81% US $317 7.3 0.30 12.4 0.51 59% 54% US $82 US $52
Eldorado Gold Corporation TSX:ELD US $1,241 US $212 US $1,506 45.8 0.83 59.2 1.07 77% 15.6 1.30 20.5 1.71 76% US $97 30.3 0.70 38.8 0.89 78% 61% US $33 US $25
Endeavour Mining Corporation TSX:EDV US $2,193 US $133 US $2,796 15.2 1.82 15.2 1.82 100% 7.4 1.75 7.4 1.75 100% US $376 7.6 1.85 7.6 1.85 100% 31% US $184 US $184
Golden Star Resources Ltd. TSX:GSC US $330 US ($17) US $437 11.9 3.28 11.9 3.28 100% 1.6 2.86 1.6 2.86 100% US $271 10.3 3.35 10.3 3.35 100% 63% US $37 US $37
Highland Gold Mining Limited AIM:HGM US $1,019 US ($26) US $1,164 19.6 2.88 19.6 2.88 100% 5.8 3.08 5.8 3.08 100% US $201 13.8 3.04 13.8 3.04 100% 25% US $59 US $59
Kirkland Lake Gold Ltd. TSX:KL US $9,990 US $0 US $10,008 19.7 4.59 19.7 4.59 100% 5.9 15.34 5.9 15.34 100% US $1,692 13.8 3.53 13.8 3.53 100% 46% US $508 US $508
Leagold Mining Corporation TSX:LMC US $894 US $128 US $1,069 20.9 1.14 22.0 1.20 95% 7.0 1.29 7.0 1.29 100% US $152 13.8 1.07 15.0 1.16 92% 44% US $51 US $49
New Gold Inc. TSX:NGD US $545 US $57 US $1,236 19.7 0.76 24.4 0.95 81% 13.4 0.80 15.7 0.94 85% US $92 6.2 0.70 8.7 0.97 72% 21% US $63 US $51
OceanaGold Corporation TSX:OGC US $1,145 US $14 US $1,360 13.0 1.58 13.7 1.66 95% 5.5 1.37 6.0 1.49 92% US $249 7.6 1.78 7.8 1.83 97% 56% US $104 US $99
Perseus Mining Limited ASX:PRU US $977 US $83 US $945 6.5 0.79 6.5 0.79 100% 2.9 0.99 2.9 0.99 100% US $322 3.5 0.68 3.5 0.68 100% 48% US $146 US $146
Pretium Resources Inc. TSX:PVG US $1,362 US ($67) US $1,840 46.4 0.65 55.1 0.77 84% 6.4 12.44 6.7 13.11 95% US $287 40.0 0.56 48.4 0.68 83% 30% US $40 US $33
Regis Resources Limited ASX:RRL US $1,546 US $86 US $1,484 11.0 1.03 11.0 1.03 100% 5.0 1.19 5.0 1.19 100% US $300 6.1 0.93 6.1 0.93 100% 27% US $134 US $134
SEMAFO Inc. TSX:SMF US $800 US $109 US $742 7.4 2.75 7.4 2.75 100% 2.7 3.43 2.7 3.43 100% US $275 4.7 2.47 4.7 2.47 100% 40% US $101 US $101
Torex Gold Resources Inc. TSX:TXG US $1,356 US $97 US $1,355 8.2 2.69 10.4 3.39 79% 2.6 3.07 2.6 3.13 98% US $528 5.7 2.54 7.8 3.49 73% 59% US $165 US $130
Group Average - Total # Companies: 17 US $343 US $117 US $104
Equivalency assumptions (US$ / 02-20-20): $1,619/oz Au, $18.37/oz Ag, $980/oz Pt, $2,703/oz Pd, $2.59/lb Cu, $0.95/lb Zn, $0.88/lb Pb, $5.71/lb Ni, $15.12/lb Co, $0/t Sb, $24.60/lb U3O8, $7.52/lb Sn, $93.00/t HCC, $86.15/t 62% Fe
*Prior fiscal year production of between 200k and 800k ounces of gold.
Source: SNL Financial retrieved on February 20, 2020
% AuAu
(Moz)
Au
(g/t)
AuEq
(Moz)
AuEq
(g/t)
EV/oz
Au
EV/oz
AuEq
Au
(Moz)
Au
(g/t)
AuEq
(Moz)
AuEq
(g/t)% Au
% Au
Inferred
Global Reserves & Resources Reserves Resources (M&I and Inferred)
Au
(Moz)
Au
(g/t)
AuEq
(Moz)
AuEq
(g/t)% Au
Global
EV/oz
Au
Enterprise
Value
(millions)
Company Symbol
Market
Capitalization
(millions)
Working
Capital
(millions)

The Weekly Dig
Mick Carew, PhD, 604-697-6006, [email protected]
Emma Boggio, MSA, CPA, CA, 604-697-6166, [email protected]
24
February 21, 2020
Junior Gold Producers* – Reserves and Resources
Source: Bloomberg and Haywood Securities
Reserves
Alacer Gold Corp. TSX:ASR US $1,452 US $202 US $1,558 6.7 1.68 7.1 1.76 95% 2.9 1.92 3.0 1.98 97% US $531 3.8 1.65 4.0 1.76 94% 42% US $231 US $220
Alio Gold Inc. TSX:ALO US $67 US $45 US $27 5.3 0.59 5.4 0.60 98% 2.9 0.58 2.9 0.59 99% US $9 2.4 0.60 2.5 0.62 97% 8% US $5 US $5
Argonaut Gold Inc. TSX:AR US $210 US $90 US $135 11.9 0.58 13.9 0.68 86% 5.1 0.82 6.1 0.99 83% US $27 6.8 0.47 7.8 0.54 88% 16% US $11 US $10
Asanko Gold Inc. TSX:AKG US $205 US $33 US $172 3.1 1.46 3.1 1.46 100% 2.3 1.57 2.3 1.57 100% US $74 0.8 1.22 0.8 1.22 100% 15% US $55 US $55
Calibre Mining Corp. TSX:CXB US $210 US $31 US $180 4.7 2.60 5.3 2.90 89% 0.3 - 0.3 - 100% US $581 4.4 2.43 5.0 2.73 89% 79% US $38 US $34
Continental Gold Inc. TSX:CNL US $880 US $32 US $1,225 11.7 9.40 12.3 9.83 96% 3.7 8.41 3.8 8.69 97% US $330 8.0 9.94 8.5 10.46 95% 75% US $104 US $100
Equinox Gold Corp. TSX:EQX US $1,077 US $65 US $1,254 12.3 0.50 14.8 0.60 83% 5.5 0.63 5.5 0.63 100% US $226 6.8 0.43 9.3 0.58 74% 51% US $102 US $85
Fiore Gold Ltd. TSXV:F US $44 US $23 US $24 3.2 0.98 3.2 0.98 100% 0.3 0.51 0.3 0.51 100% US $86 2.9 1.07 2.9 1.07 100% 20% US $7 US $7
Gold Road Resources Limited ASX:GOR US $988 US $25 US $1,094 3.6 1.19 3.7 1.23 98% 2.0 1.26 2.0 1.26 100% US $557 1.6 1.13 1.7 1.19 95% 64% US $304 US $296
Goldgroup Mining Inc. TSX:GGA US $3 US ($3) US $7 0.6 1.44 0.9 2.19 66% - - - - - - 0.6 1.44 0.9 2.19 66% 47% US $13 US $8
Guyana Goldfields Inc. TSX:GUY US $97 US $37 US $64 6.6 2.48 6.6 2.48 100% 2.3 2.63 2.3 2.63 100% US $28 4.3 2.41 4.3 2.41 100% 53% US $10 US $10
Hummingbird Resources PLC AIM:HUM US $123 US ($58) US $245 4.3 1.32 4.3 1.32 100% 0.5 2.99 0.5 2.99 100% US $454 3.8 1.22 3.8 1.22 100% 52% US $56 US $56
K92 Mining Inc. TSXV:KNT US $707 US $18 US $697 2.5 9.28 2.9 11.16 83% - - - - - - 2.5 9.28 2.9 11.16 83% 76% US $284 US $236
Lundin Gold Inc. TSX:LUG US $1,878 US $125 US $2,526 9.5 8.33 9.6 8.47 98% 5.0 8.77 5.1 8.91 98% US $503 4.5 7.88 4.5 8.02 98% 48% US $266 US $262
McEwen Mining Inc. NYSE:MUX US $508 US $16 US $545 13.6 0.11 63.8 0.52 21% 0.7 1.32 0.8 1.51 88% US $736 12.9 0.11 63.0 0.52 20% 47% US $40 US $9
Medusa Mining Limited ASX:MML US $100 US $15 US $85 1.4 3.89 1.4 3.89 100% 0.4 6.87 0.4 6.87 100% US $243 1.1 3.41 1.1 3.41 100% 42% US $60 US $60
Metals Exploration plc AIM:MTL US $33 US ($94) US $149 1.7 1.62 1.7 1.62 100% 0.9 1.86 0.9 1.86 100% US $167 0.8 1.43 0.8 1.43 100% 82% US $86 US $86
Minera IRL Limited BVL:MIRL US $28 US ($97) US $133 2.5 2.17 2.5 2.17 100% 1.1 1.87 1.1 1.87 100% US $124 1.4 2.43 1.4 2.43 100% 76% US $53 US $53
Orosur Mining Inc. TSX:OMI US $6 US ($17) US $23 0.6 0.67 1.3 1.50 45% 0.1 1.42 0.1 1.42 100% US $244 0.5 0.61 1.2 1.51 40% 17% US $39 US $18
Orvana Minerals Corp. TSX:ORV US $21 US ($14) US $44 2.0 3.72 2.5 4.59 81% 0.4 2.37 0.6 3.79 63% US $120 1.7 4.31 1.9 4.95 87% 50% US $22 US $18
Premier Gold Mines Limited TSX:PG US $246 US $27 US $238 11.2 1.60 11.4 1.62 99% 3.0 1.21 3.0 1.22 99% US $80 8.2 1.81 8.3 1.83 99% 53% US $21 US $21
Roxgold Inc. TSX:ROXG US $273 US ($3) US $299 1.4 5.16 1.4 5.16 100% 0.6 - 0.6 - 100% US $505 0.9 3.75 0.9 3.75 100% 24% US $207 US $207
Shanta Gold Limited AIM:SHG US $125 US $9 US $124 2.7 2.34 2.7 2.34 100% 0.4 4.79 0.4 4.79 100% US $338 2.3 2.16 2.3 2.17 100% 55% US $46 US $46
TMAC Resources Inc. TSX:TMR US $196 US $77 US $227 6.4 7.88 6.4 7.88 100% 3.6 6.77 3.6 6.77 100% US $63 2.8 9.95 2.8 9.95 100% 57% US $35 US $35
Vast Resources plc AIM:VAST US $38 US ($3) US $43 1.0 0.96 1.7 1.60 60% 0.2 1.08 0.5 2.78 39% US $222 0.8 0.94 1.2 1.36 69% 44% US $43 US $26
Group Average - Total # Companies: 25 US $272 US $86 US $79
Equivalency assumptions (US$ / 02-20-20): $1,619/oz Au, $18.37/oz Ag, $980/oz Pt, $2,703/oz Pd, $2.59/lb Cu, $0.95/lb Zn, $0.88/lb Pb, $5.71/lb Ni, $15.12/lb Co, $0/t Sb, $24.60/lb U3O8, $7.52/lb Sn, $93.00/t HCC, $86.15/t 62% Fe
*Prior fiscal year production of less than 200k ounces of gold.
Source: SNL Financial retrieved on February 20, 2020
% AuAu
(Moz)
Au
(g/t)
AuEq
(Moz)
AuEq
(g/t)
EV/oz
Au
EV/oz
AuEq
Au
(Moz)
Au
(g/t)
AuEq
(Moz)
AuEq
(g/t)% Au
% Au
Inferred
EV/oz
Au
Global Reserves & Resources Reserves Resources (M&I and Inferred)
Au
(Moz)
Au
(g/t)
AuEq
(Moz)
AuEq
(g/t)% Au
GlobalEnterprise
Value
(millions)
Company Symbol
Market
Capitalization
(millions)
Working
Capital
(millions)

Mick Carew, PhD, 604-697-6006, [email protected]
Emma Boggio, MSA, CPA, CA, 604-697-6166, [email protected]
The Weekly Dig
25
February 21, 2020
Gold Development-Stage Companies (Engineering Study Complete) – Enterprise Value per Ounce
Source: Bloomberg and Haywood Securities
Reserves
% AuEq
Almaden Minerals Ltd. TSX:AMM US $48 US $2 US $48 2.4 0.44 4.3 0.79 56% 1.4 0.59 2.4 1.00 59% US $35 1.0 0.33 1.9 0.63 53% 40% 54% US $20 US $11
Amarillo Gold Corporation TSXV:AGC US $30 US $6 US $23 1.8 1.10 1.8 1.10 100% 1.1 - 1.1 - 100% US $22 0.7 0.42 0.7 0.42 100% 51% 51% US $13 US $13
ATAC Resources Ltd. TSXV:ATC US $25 US $8 US $17 2.4 3.45 2.4 3.46 100% - - - - - - 2.4 3.45 2.4 3.46 100% 79% 79% US $7 US $7
Belo Sun Mining Corp TSX:BSX US $170 US $27 US $143 6.8 1.04 6.8 1.04 100% 3.8 1.02 3.8 1.02 100% US $38 3.0 1.07 3.0 1.07 100% 52% 52% US $21 US $21
Bluestone Resources Inc. TSXV:BSR US $119 US $6 US $113 5.1 1.88 5.3 1.97 95% - - - - - - 5.1 1.96 5.3 2.06 95% 14% 14% US $22 US $21
Cardinal Resources Limited ASX:CDV US $126 US $13 US $139 7.0 1.12 7.0 1.12 100% 5.1 1.14 5.1 1.14 100% US $27 1.9 1.06 1.9 1.06 100% 24% 24% US $20 US $20
Chaarat Gold Holdings Limited AIM:CGH US $215 US ($32) US $279 9.4 2.20 10.5 2.47 89% 0.8 1.00 1.0 1.22 82% US $340 8.6 2.48 9.5 2.77 90% 18% 22% US $30 US $26
Columbus Gold Corp. TSX:CGT US $25 US $2 US $23 2.2 1.42 2.2 1.42 100% 1.2 1.58 1.2 1.58 100% US $18 0.9 1.25 0.9 1.25 100% 47% 47% US $10 US $10
Corvus Gold Inc. TSX:KOR US $217 US $17 US $200 3.6 0.38 3.7 0.39 97% - - - - - - 3.6 0.38 3.7 0.39 97% 19% 18% US $56 US $54
Eastmain Resources Inc. TSX:ER US $20 US $1 US $19 1.4 5.16 1.4 5.16 100% - - - - - - 1.4 5.16 1.4 5.16 100% 37% 37% US $14 US $14
Falco Resources Ltd. TSXV:FPC US $46 US ($9) US $63 5.9 1.60 8.6 2.33 68% 3.7 1.44 5.5 2.10 69% US $17 2.1 1.97 3.2 2.90 68% 47% 50% US $11 US $7
First Mining Gold Corp. TSX:FF US $107 US $6 US $101 11.0 1.46 11.3 1.50 97% - - - - - - 11.0 1.46 11.3 1.50 97% 34% 33% US $9 US $9
Gabriel Resources Ltd. TSXV:GBU US $225 US $25 US $259 16.4 1.05 17.3 1.11 95% 8.1 1.46 8.6 1.54 95% US $32 8.3 0.83 8.7 0.87 96% 27% 26% US $16 US $15
Gold Standard Ventures Corp TSX:GSV US $203 US $9 US $195 2.8 0.62 2.8 0.63 98% 1.2 - 1.3 - 98% US $156 1.5 0.34 1.5 0.34 98% 80% 79% US $71 US $69
Goldquest Mining Corp. TSXV:GQC US $27 US $13 US $14 2.2 2.60 3.0 3.55 73% 0.8 3.72 1.1 4.73 79% US $17 1.4 2.19 1.8 2.97 74% 16% 19% US $6 US $5
Integra Resources Corp. TSXV:ITR US $113 US $4 US $109 2.7 0.42 4.2 0.65 65% - - - - - - 2.7 0.42 4.2 0.65 65% 13% 12% US $40 US $26
International Tower Hill Mines Ltd. TSX:ITH US $99 US $7 US $92 12.6 0.68 12.6 0.68 100% 9.0 0.71 9.0 0.71 100% US $10 3.6 0.60 3.6 0.60 100% 31% 31% US $7 US $7
INV Metals Inc. TSX:INV US $34 US ($1) US $35 3.0 3.37 3.7 4.05 83% 2.2 4.92 2.5 5.57 88% US $16 0.8 1.84 1.2 2.55 72% 39% 49% US $12 US $10
KEFI Minerals Plc AIM:KEFI US $28 US ($5) US $35 1.6 1.86 1.6 1.86 100% 0.8 2.12 0.8 2.12 100% US $44 0.8 1.65 0.8 1.65 100% 21% 21% US $22 US $22
Liberty Gold Corp. TSX:LGD US $242 US $12 US $231 2.8 0.35 4.4 0.55 64% - - - - - - 2.8 0.35 4.4 0.54 63% 32% 37% US $82 US $52
Lumina Gold Corp. TSXV:LUM US $187 US $3 US $185 16.6 1.27 20.4 1.55 82% - - - - - - 16.6 1.27 20.4 1.55 82% 37% 37% US $11 US $9
Marathon Gold Corporation TSX:MOZ US $208 US $23 US $185 4.1 1.77 4.1 1.77 100% - - - - - - 4.1 1.77 4.1 1.77 100% 23% 23% US $45 US $45
Midas Gold Corp. TSX:MAX US $114 US $22 US $119 6.6 1.60 6.7 1.62 98% - - - - - - 6.6 1.60 6.7 1.62 98% 15% 15% US $18 US $18
Moneta Porcupine Mines Inc. TSX:ME US $26 US $3 US $23 1.7 5.88 1.8 6.09 97% - - - - - - 1.7 5.88 1.8 6.09 97% 68% 66% US $13 US $13
NovaGold Resources Inc. TSX:NG US $3,049 US $147 US $3,005 22.7 2.23 23.0 2.26 99% 16.9 2.09 16.9 2.09 100% US $178 5.8 2.81 6.1 2.96 95% 56% 58% US $132 US $130
Orca Gold Inc. TSXV:ORG US $53 US $11 US $42 3.4 1.02 3.4 1.03 99% 2.0 1.11 2.0 1.11 100% US $21 1.4 0.91 1.4 0.94 97% 75% 74% US $12 US $12
Orezone Gold Corporation TSXV:ORE US $87 US $16 US $71 5.5 0.68 5.5 0.68 100% 1.7 0.81 1.7 0.81 100% US $43 3.9 0.63 3.9 0.63 100% 26% 26% US $13 US $13
Orla Mining Ltd. TSX:OLA US $333 US $2 US $339 12.1 0.83 14.8 1.03 81% 1.5 0.74 1.8 0.87 86% US $223 10.6 0.85 13.1 1.05 81% 18% 17% US $28 US $23
Osisko Mining Inc. TSX:OSK US $854 US $79 US $778 4.2 1.09 4.2 1.09 100% - - - - - - 4.2 1.09 4.2 1.09 100% 78% 78% US $184 US $184
Pure Gold Mining Inc. TSXV:PGM US $206 US $64 US $150 2.5 8.67 2.5 8.67 100% 1.0 8.97 1.0 8.97 100% US $148 1.5 8.48 1.5 8.48 100% 31% 31% US $59 US $59
RTG Mining Inc. TSX:RTG US $30 US $10 US $20 0.8 3.55 1.4 5.93 60% 0.2 2.04 0.4 4.28 48% US $99 0.6 4.73 0.9 7.22 66% 96% 94% US $25 US $15
Rubicon Minerals Corporation TSX:RMX US $73 US $3 US $80 1.3 7.21 1.3 7.21 100% - - - - - - 1.3 7.21 1.3 7.21 100% 36% 36% US $63 US $63
Sabina Gold & Silver Corp. TSX:SBB US $380 US $15 US $365 7.2 6.21 7.2 6.21 100% 2.5 6.30 2.5 6.30 100% US $146 4.7 6.16 4.7 6.16 100% 40% 40% US $51 US $51
Gold X Mining Corp. TSXV:GLDX US $51 US $5 US $45 10.5 0.86 11.5 0.93 92% - - - - - - 10.5 0.86 11.5 0.93 92% 30% 29% US $4 US $4
Sihayo Gold Limited ASX:SIH US $25 US ($3) US $31 1.2 2.11 1.2 2.11 100% 0.6 2.08 0.6 2.08 100% US $54 0.6 2.13 0.6 2.13 100% 60% 60% US $26 US $26
Spanish Mountain Gold Ltd. TSXV:SPA US $19 US $1 US $18 4.7 0.32 4.8 0.33 98% - - - - - - 4.7 0.32 4.8 0.33 98% 13% 13% US $4 US $4
Treasury Metals Inc. TSX:TML US $31 US ($2) US $36 1.5 2.37 1.7 2.71 88% - - - - - - 1.5 2.37 1.7 2.71 88% 17% 18% US $24 US $21
West Kirkland Mining Inc. TSXV:WKM US $16 US $0 US $16 0.8 0.46 0.9 0.54 85% 0.6 0.58 0.7 0.67 86% US $28 0.2 0.30 0.3 0.37 82% 45% 44% US $20 US $17
Victoria Gold Corp. TSX:VGCX US $363 US ($13) US $567 5.4 0.73 5.4 0.73 99% 3.3 0.82 3.3 0.82 100% US $174 2.1 0.61 2.2 0.63 98% 30% 30% US $105 US $104
Group Average - Total # Companies: 39 US $82 US $34 US $32
Group Average - 0 - 20 million ounces # Companies: 38 US $31 US $30
Group Average - 20 - 50 million ounces # Companies: 1 US $132 US $70
Equivalency assumptions (US$ / 02-20-20): $1,619/oz Au, $18.37/oz Ag, $980/oz Pt, $2,703/oz Pd, $2.59/lb Cu, $0.95/lb Zn, $0.88/lb Pb, $5.71/lb Ni, $15.12/lb Co, $0/t Sb, $24.60/lb U3O8, $7.52/lb Sn, $93.00/t HCC, $86.15/t 62% Fe
Source: SNL Financial retrieved on February 20, 2020
*Includes only Liberty's Goldstrike and Kinsley Mountain Projects
Global Reserves & Resources
AuEq
(g/t)
Au
(Moz)
% Au
Inferred
Company EV/oz
Au
Reserves
Au
(Moz)
Au
(g/t)
AuEq
(Moz)% Au
AuEq
(g/t)
Symbol
Market
Capitalization
(millions)
Working
Capital
(millions)
Enterprise
Value
(millions)
AuEq
(g/t)% Au% Au
Au
(g/t)
AuEq
(Moz)
Global
EV/oz
Au
EV/oz
AuEq
Resources (M&I and Inferred)
Au
(Moz)
Au
(g/t)
AuEq
(Moz)

Mick Carew, PhD, 604-697-6006, [email protected]
Emma Boggio, MSA, CPA, CA, 604-697-6166, [email protected]
The Weekly Dig
26
February 21, 2020
Gold Exploration-Stage Companies (Resource Only) – Enterprise Value per Ounce of Gold
Source: Bloomberg and Haywood Securities
Auryn Resources Inc. TSX:AUG US $140 US ($0) US $140 2.3 5.56 2.6 6.24 89% - - - - - 2.3 5.56 2.6 6.24 89% 72% US $61 US $54
Balmoral Resources Ltd TSX:BAR US $63 US $2 US $62 1.2 1.20 1.7 1.67 72% - - - - - 1.2 1.20 1.7 1.67 72% 36% US $52 US $37
Condor Gold Plc AIM:CNR US $27 US $5 US $22 2.4 3.87 2.4 3.93 98% 0.7 3.04 0.7 3.10 98% 1.7 4.32 1.8 4.39 98% 73% US $9 US $9
Granada Gold Mine Inc. TSXV:GGM US $9 US ($5) US $10 2.8 2.05 2.8 2.08 98% - - - - - 2.8 2.05 2.8 2.08 98% 71% US $4 US $4
Kasbah Resources Limited ASX:KAS US $1 US ($3) US $4 0.2 0.55 1.2 2.91 19% - - 0.4 2.64 - 0.2 0.93 0.8 3.10 30% - US $15 US $3
Lincoln Gold Mining Inc. TSXV:LMG US $1 US ($2) US $2 0.1 3.14 0.1 3.14 100% - - - - - 0.1 3.14 0.1 3.14 100% 1% US $14 US $14
Nighthawk Gold Corp. TSX:NHK US $83 US $9 US $74 2.9 1.70 2.9 1.70 100% - - - - - 2.9 1.70 2.9 1.70 100% 90% US $25 US $25
Orex Minerals Inc. TSXV:REX US $8 US $0 US $8 0.1 0.21 0.6 1.94 11% - - - - - 0.1 0.21 0.6 1.94 11% 47% US $127 US $14
Osprey Gold Development Ltd. TSXV:OS US $3 US $1 US $3 0.4 3.25 0.4 3.25 100% - - - - - 0.4 3.25 0.4 3.25 100% 100% US $8 US $8
Puma Exploration Inc. TSXV:PUMA US $2 US ($1) US $2 0.1 0.30 1.3 3.25 9% - - - - - 0.1 0.30 1.3 3.25 9% 4% US $17 US $2
Red Pine Exploration Inc. TSXV:RPX US $13 US ($0) US $13 0.5 5.76 0.5 5.76 100% - - - - - 0.5 5.76 0.5 5.76 100% 63% US $26 US $26
Redstar Gold Corp. TSXV:RGC US $7 US $1 US $5 0.5 2.89 0.7 3.56 81% - - - - - 0.1 2.94 0.2 5.88 50% 409% US $10 US $8
Reunion Gold Corporation TSXV:RGD US $41 US $3 US $36 1.2 1.07 1.2 1.07 100% - - - - - 1.2 1.07 1.2 1.07 100% 57% US $31 US $31
Revival Gold Inc. TSXV:RVG US $32 US $1 US $31 2.0 0.62 2.0 0.62 100% - - - - - 2.0 0.62 2.0 0.62 100% 39% US $15 US $15
Rupert Resources Ltd. TSXV:RUP US $110 US $3 US $106 1.0 2.19 1.0 2.19 100% - - - - - 1.0 2.19 1.0 2.19 100% 85% US $108 US $108
Sarama Resources Ltd TSXV:SWA US $11 US $3 US $8 2.7 1.59 2.7 1.59 100% - - - - - 2.7 1.59 2.7 1.59 100% 90% US $3 US $3
SolGold plc TSX:SOLG US $483 US $27 US $462 20.0 0.25 52.7 0.65 38% - - - - - 20.0 0.25 52.7 0.65 38% 17% US $23 US $9
Teras Resources Inc. TSXV:TRA US $7 US ($0) US $7 1.1 0.48 1.3 0.55 89% - - - - - 1.1 0.48 1.3 0.55 89% 10% US $6 US $5
Gold Springs Resource Corp. TSX:GRC US $24 US $5 US $8 0.8 0.03 0.9 0.04 84% - - - - - 0.8 0.03 0.9 0.04 84% 20% US $11 US $9
Group Average - Total # Companies: 19 US $30 US $20
Equivalency assumptions (US$ / 02-20-20): $1,619/oz Au, $18.37/oz Ag, $980/oz Pt, $2,703/oz Pd, $2.59/lb Cu, $0.95/lb Zn, $0.88/lb Pb, $5.71/lb Ni, $15.12/lb Co, $0/t Sb, $24.60/lb U3O8, $7.52/lb Sn, $93.00/t HCC, $86.15/t 62% Fe
Source: SNL Financial retrieved on February 20, 2020
Company Symbol
Market
Capitalization
(millions)
Working
Capital
(millions)
Enterprise
Value
(millions)
Au
(g/t)
AuEq
(Moz)
Global Reserves & Resources Reserves Resources (M&I and Inferred)
Au
(Moz)
Au
(g/t)
AuEq
(Moz)
AuEq
(g/t)
AuEq
(g/t)
% Au
Inferred
EV/oz
Au
EV/oz
AuEq
Au
(Moz)
Au
(g/t)
AuEq
(Moz)
AuEq
(g/t)% Au
Global
% Au% AuAu
(Moz)

The Weekly Dig
Mick Carew, PhD, 604-697-6006, [email protected]
Emma Boggio, MSA, CPA, CA, 604-697-6166, [email protected]
27
February 21, 2020
Silver – Enterprise Value per Ounce of Silver
Source: Bloomberg and Haywood Securities
Reserves
Alexco Resource Corp. TSX:AXU US $243 US $10 US $235 108 418 159 617 68% 30 805 41 1,079 75% US $7.72 77 351 118 537 65% 31% US $2.18 US $1.48
Americas Gold and Silver Corporation TSX:USA US $262 US $4 US $269 117 58 310 154 38% 32 29 109 98 30% US $8.37 85 95 201 224 42% 43% US $2.30 US $0.87
Athena Silver Corporation OTCPK:AHNR US $1 US ($3) US $4 43 67 43 67 100% - - - - - - 43 67 43 67 100% - US $0.08 US $0.08
Bear Creek Mining Corporation TSXV:BCM US $177 US $25 US $153 360 41 695 78 52% 225 50 450 101 50% US $0.68 135 31 245 56 55% 36% US $0.43 US $0.22
Coeur Mining, Inc. NYSE:CDE US $1,531 US $20 US $1,861 686 23 1,636 55 42% 171 20 444 53 39% US $10.86 514 24 1,192 57 43% 34% US $2.71 US $1.14
Defiance Silver Corp. TSXV:DEF US $20 US $0 US $21 28 4 336 46 8% - - - - - - 28 4 336 46 8% 67% US $0.75 US $0.06
Dolly Varden Silver Corporation TSXV:DV US $18 US $3 US $14 44 294 44 294 100% - - - - - - 44 294 44 294 100% 26% US $0.33 US $0.33
Endeavour Silver Corp. TSX:EDR US $277 US $49 US $234 176 214 324 395 54% 47 209 89 396 53% US $5.00 129 217 235 395 55% 70% US $1.33 US $0.72
Excellon Resources Inc. TSX:EXN US $71 US $9 US $63 24 226 45 424 53% 9 137 19 303 45% US $7.36 15 354 26 598 59% 45% US $2.63 US $1.40
First Majestic Silver Corp. TSX:FR US $2,039 US $171 US $2,044 356 155 629 274 57% 108 185 197 334 55% US $18.85 239 144 415 250 58% 70% US $5.73 US $3.25
Fortuna Silver Mines Inc. TSX:FVI US $598 US $46 US $687 85 14 489 81 17% 46 15 266 90 17% US $15.09 39 13 222 72 18% 84% US $8.12 US $1.41
Golden Minerals Company AMEX:AUMN US $32 US $0 US $32 65 345 93 495 70% - - - - - - 65 345 93 495 70% 6% US $0.50 US $0.35
Hecla Mining Company NYSE:HL US $1,699 US $62 US $2,171 866 56 3,013 193 29% 191 168 613 539 31% US $11.36 675 47 2,401 166 28% 69% US $2.51 US $0.72
Investigator Resources Limited ASX:IVR US $12 US $1 US $12 42 140 48 160 88% - - - - - - 42 140 48 160 88% 45% US $0.28 US $0.24
Kootenay Silver Inc TSXV:KTN US $65 US $7 US $58 116 43 239 89 48% - - - - - - 116 43 239 89 48% 21% US $0.50 US $0.24
MAG Silver Corp. TSX:MAG US $922 US $95 US $828 171 74 498 216 34% - - - - - - 171 74 498 216 34% 56% US $4.85 US $1.66
Mandalay Resources Corporation TSX:MND US $73 US ($32) US $110 51 27 326 172 16% - - 67 175 - - 51 39 259 197 20% 16% US $2.16 US $0.34
Minco Silver Corporation TSX:MSV US $31 US $34 US ($3) 162 158 256 250 63% 50 189 60 228 83% - 112 148 196 258 57% 52% - -
Mineworx Technologies Ltd. TSXV:MWX US $29 US $2 US $28 22 9 401 159 6% - - - - - - 22 9 401 159 6% - US $1.26 US $0.07
Pan American Silver Corp. TSX:PAAS US $5,221 US $517 US $5,020 1,852 31 6,104 103 30% 557 59 1,229 129 45% US $9.01 1,297 26 4,879 98 27% 30% US $2.71 US $0.82
Silver Bear Resources Plc TSX:SBR US $61 US $18 US $170 60 704 61 710 99% 22 809 22 809 100% US $7.61 38 655 39 663 99% 63% US $2.81 US $2.79
Silver Bull Resources, Inc. OTCPK:SVBL US $13 US $1 US $11 26 39 119 175 22% - - - - - - 26 39 119 175 22% 0% US $0.44 US $0.10
SilverCrest Metals Inc. TSX:SIL US $824 US $28 US $797 67 361 122 657 55% - - - - - - 67 361 122 657 55% 60% US $11.93 US $6.56
Silvercorp Metals Inc. TSX:SVM US $701 US $134 US $570 213 130 488 298 44% 85 204 157 378 54% US $6.73 128 105 331 271 39% 62% US $2.68 US $1.17
Group Average - Total # Companies: 24 US $9.05 US $2.57 US $1.13
Equivalency assumptions (US$ / 02-20-20): $1,619/oz Au, $18.37/oz Ag, $980/oz Pt, $2,703/oz Pd, $2.59/lb Cu, $0.95/lb Zn, $0.88/lb Pb, $5.71/lb Ni, $15.12/lb Co, $0/t Sb, $24.60/lb U3O8, $7.52/lb Sn, $93.00/t HCC, $86.15/t 62% Fe
Source: SNL Financial retrieved on February 20, 2020
Company Symbol
Market
Capitalization
(millions)
Working
Capital
(millions)
Enterprise
Value
(millions)
Ag
(g/t)
AgEq
(Moz)
Global Reserves & Resources Reserves Resources (M&I and Inferred)
Ag
(Moz)
Ag
(g/t)
AgEq
(Moz)
AgEq
(g/t)
AgEq
(g/t)
% Ag
Inferred
EV/oz
Ag
EV/oz
Ag
EV/oz
AgEq
Ag
(Moz)
Ag
(g/t)
AgEq
(Moz)
AgEq
(g/t)% Ag
Global
% Ag% AgAg
(Moz)

Mick Carew, PhD, 604-697-6006, [email protected]
Emma Boggio, MSA, CPA, CA, 604-697-6166, [email protected]
The Weekly Dig
28
February 21, 2020
Precious Metals Sensitivity
-30% -20% -10% -5% 0% 5% 10% 20% 30%
PRODUCERS
Alamos Gold Inc. $10.25 NAVPS Gold $14.89 $10.58 $12.35 $13.52 $14.14 $14.89 $15.31 $15.64 $16.02 $16.47
Asanko Gold Inc. $1.15 NAVPS Gold $1.67 $0.48 $0.92 $1.30 $1.48 $1.67 $1.84 $2.02 $2.42 $2.84
B2Gold Corp. $7.50 NAVPS Gold $4.66 $2.94 $3.54 $4.11 $4.38 $4.66 $4.94 $5.24 $5.82 $6.41
Barrick Gold Corporation $28.00 NAVPS Gold $14.20 $9.98 $11.39 $12.79 $13.49 $14.20 $14.91 $15.62 $17.01 $18.49
Calibre Mining Corp. $1.80 NAVPS Gold $1.73 $0.55 $0.94 $1.34 $1.53 $1.73 $1.92 $2.12 $2.51 $2.91
Eldorado Gold Corporation $18.00 NAVPS Gold $15.80 ($1.75) $3.10 $7.94 $10.41 $12.87 $15.33 $17.80 $22.72 $27.64
Endeavour Mining Corporation $32.00 NAVPS Gold $25.43 $13.71 $17.59 $21.35 $23.23 $25.43 $27.78 $30.12 $34.86 $39.64
K92 Mining Inc. $4.75 NAVPS Gold $4.78 $1.91 $2.76 $4.23 $4.23 $4.78 $5.33 $5.88 $6.97 $8.07
Metalla Royalty & Streaming $7.50 NAVPS Gold $5.00 $3.75 $4.16 $4.58 $4.79 $5.00 $5.21 $5.42 $5.83 $6.25
OceanaGold Corporation $2.75 NAVPS Gold $2.28 ($0.19) $0.72 $1.51 $1.90 $2.28 $2.66 $3.04 $3.78 $4.53
Osisko Gold Royalties Ltd $19.50 NAVPS Gold $16.60 $13.85 $14.73 $15.60 $16.04 $16.47 $16.91 $17.35 $18.22 $19.09
RNC Minerals $0.70 NAVPS Gold $0.57 ($0.15) $0.11 $0.35 $0.46 $0.57 $0.69 $0.79 $0.99 $1.17
Roxgold Inc. $1.70 NAVPS Gold $1.46 $0.41 $0.78 $1.12 $1.29 $1.46 $1.63 $1.80 $2.14 $2.48
SEMAFO Inc. $2.75 NAVPS Gold $3.75 $0.72 $2.13 $3.03 $3.40 $3.75 $4.04 $4.28 $4.78 $5.20
Superior Gold Inc. $1.15 NAVPS Gold $1.62 $0.40 $0.81 $1.21 $1.42 $1.62 $1.82 $2.03 $2.43 $2.84
DEVELOPERS / EXPLORERS
Aurion Resources Ltd. $3.50 NAVPS Gold $3.48 $1.53 $2.18 $2.83 $3.16 $3.48 $3.80 $4.13 $4.78 $5.42
Bluestone Resources Inc. $3.00 NAVPS Gold $2.95 $1.30 $1.85 $2.40 $2.70 $2.95 $3.25 $3.50 $4.05 $4.60
Equinox Gold Corp. $14.50 NAVPS Gold $14.46 $2.58 $6.56 $10.49 $12.48 $14.46 $16.44 $18.42 $22.38 $26.34
Falco Resources Ltd. $0.40 NAVPS Gold $1.68 $0.01 $0.58 $1.14 $1.41 $1.68 $1.95 $2.22 $2.76 $3.30
Filo Mining Corp. $4.60 NAVPS Gold $4.49 $3.35 $3.73 $4.11 $4.30 $4.49 $4.68 $4.87 $5.25 $5.63
Gold Road Resources Limited $0.85 NAVPS Gold $0.79 $0.28 $0.45 $0.62 $0.70 $0.79 $0.87 $0.95 $1.12 $1.28
Goldquest Mining Corp. $0.08 NAVPS Gold $0.08 $0.08 $0.08 $0.08 $0.08 $0.08 $0.08 $0.08 $0.08 $0.08
Harte Gold Corp. $0.25 NAVPS Restricted $0.35 ($0.15) ($0.07) $0.27 $0.31 $0.35 $0.40 $0.44 $0.52 $0.60
Liberty Gold Corp. $1.60 NAVPS Gold $1.59 $0.48 $0.83 $1.20 $1.39 $1.59 $1.78 $1.98 $2.38 $2.77
Lumina Gold Corp. $1.50 NAVPS Gold $2.13 $0.69 $1.18 $1.65 $1.89 $2.13 $2.36 $2.60 $3.08 $3.55
Lundin Gold Inc. $10.00 NAVPS Gold $10.10 $3.20 $5.25 $7.20 $8.10 $9.05 $9.95 $10.85 $12.70 $14.55
Marathon Gold Corporation $2.50 NAVPS Gold $2.08 $0.87 $1.26 $1.66 $1.87 $2.08 $2.29 $2.51 $2.94 $3.38
Midas Gold Corp. $1.80 NAVPS Gold $1.97 $1.00 $1.35 $1.67 $1.82 $1.97 $2.12 $2.27 $2.57 $2.86
Minera Alamos Inc. $0.50 NAVPS Gold $0.65 $0.20 $0.30 $0.45 $0.50 $0.60 $0.65 $0.70 $0.85 $0.95
Nighthawk Gold Corp. $4.50 NAVPS Gold $4.53 ($0.84) $0.56 $2.41 $3.43 $4.53 $5.73 $7.04 $9.72 $12.27
Osisko Mining Inc. $4.50 NAVPS Gold $4.53 $2.88 $3.40 $3.95 $4.23 $4.53 $4.83 $5.14 $5.75 $6.37
Pure Gold Mining Inc. $1.30 NAVPS Gold $1.28 $0.62 $0.83 $1.06 $1.17 $1.28 $1.39 $1.51 $1.73 $1.96
Sabina Gold & Silver Corp. $2.00 NAVPS Gold $2.24 $1.11 $1.49 $1.87 $2.05 $2.24 $2.43 $2.62 $3.00 $3.38
Steppe Gold Ltd. $1.75 NAVPS Gold $1.71 $0.75 $1.07 $1.39 $1.55 $1.71 $1.87 $2.02 $2.34 $2.66
Treasury Metals Corp. $1.00 NAVPS Gold $1.54 $0.63 $0.93 $1.24 $1.39 $1.54 $1.69 $1.85 $2.15 $2.46
-30% -20% -10% -5% 0% 5% 10% 20% 30%
PRODUCERS
Alamos Gold Inc. $10.25 2019 CFPS Gold $0.75 $0.75 $0.75 $0.75 $0.75 $0.75 $0.75 $0.75 $0.75 $0.75
Asanko Gold Inc. $1.15 2019 CFPS Gold ($0.02) ($0.02) ($0.02) ($0.02) ($0.02) ($0.02) ($0.02) ($0.02) ($0.02) ($0.02)
B2Gold Corp. $7.50 2019 CFPS Gold $0.54 $0.57 $0.56 $0.55 $0.55 $0.54 $0.52 $0.52 $0.51 $0.50
Barrick Gold Corporation $28.00 2019 CFPS Gold $1.85 $1.85 $1.85 $1.85 $1.85 $1.85 $1.85 $1.85 $1.85 $1.85
Calibre Mining Corp. $1.80 2019 CFPS Gold - - - - - - - - - -
Eldorado Gold Corporation $18.00 2019 CFPS Gold $1.05 $1.05 $1.05 $1.05 $1.05 $1.05 $1.05 $1.05 $1.05 $1.05
Endeavour Mining Corporation $32.00 2019 CFPS Gold $2.79 $2.35 $2.50 $2.64 $2.72 $2.79 $2.86 $2.93 $3.06 $3.20
K92 Mining Inc. $4.75 2019 CFPS Gold $0.18 $0.14 $0.15 $0.17 $0.18 $0.18 $0.19 $0.20 $0.21 $0.23
OceanaGold Corporation $2.75 2019 CFPS Gold $0.43 $0.13 $0.22 $0.33 $0.38 $0.43 $0.48 $0.53 $0.63 $0.73
Osisko Gold Royalties Ltd $19.50 2019 CFPS Gold $0.39 $0.45 $0.52 $0.57 $0.61 $0.66 $0.71 $0.82 $0.94 $0.86
RNC Minerals $0.70 2019 CFPS Gold $0.02 $0.00 $0.01 $0.01 $0.02 $0.02 $0.02 $0.03 $0.03 $0.04
Roxgold Inc. $1.70 2019 CFPS Gold $0.24 $0.16 $0.19 $0.22 $0.23 $0.24 $0.26 $0.27 $0.30 $0.33
SEMAFO Inc. $2.75 2019 CFPS Gold $0.72 $0.50 $0.57 $0.65 $0.68 $0.72 $0.77 $0.79 $0.82 $0.86
Superior Gold Inc. $1.15 2019 CFPS Gold $0.03 ($0.08) ($0.04) ($0.00) $0.01 $0.03 $0.05 $0.07 $0.11 $0.15
Note: For price forecast estimates, please refer to the "Haywood Metals and Currencies Forecast" Table later in this report
-30% -20% -10% -5% 0% 5% 10% 20% 30%
PRODUCERS
Alamos Gold Inc. $10.25 2020 CFPS Gold $1.07 $0.62 $0.77 $0.92 $0.99 $1.07 $1.14 $1.21 $1.36 $1.51
Asanko Gold Inc. $1.15 2020 CFPS Gold $0.24 $0.05 $0.12 $0.18 $0.21 $0.24 $0.28 $0.28 $0.31 $0.35
B2Gold Corp. $7.50 2020 CFPS Gold $0.66 $0.38 $0.48 $0.59 $0.63 $0.66 $0.71 $0.76 $0.85 $0.94
Barrick Gold Corporation $28.00 2020 CFPS Gold $2.50 $1.25 $1.65 $2.05 $2.30 $2.50 $2.70 $2.90 $3.35 $3.75
Calibre Mining Corp. $1.80 2020 CFPS Gold $0.21 $0.06 $0.11 $0.16 $0.19 $0.21 $0.24 $0.26 $0.31 $0.36
Eldorado Gold Corporation $18.00 2020 CFPS Gold $2.40 $1.00 $1.35 $1.65 $1.85 $2.00 $2.20 $2.35 $2.70 $3.05
Endeavour Mining Corporation $32.00 2020 CFPS Gold $3.82 $1.92 $2.57 $3.21 $3.52 $3.82 $4.10 $4.39 $5.01 $5.63
K92 Mining Inc. $4.75 2020 CFPS Gold $0.40 $0.19 $0.26 $0.33 $0.36 $0.40 $0.43 $0.46 $0.53 $0.60
OceanaGold Corporation $2.75 2020 CFPS Gold $0.43 $0.13 $0.22 $0.33 $0.38 $0.43 $0.48 $0.53 $0.63 $0.73
Osisko Gold Royalties Ltd $19.50 2020 CFPS Gold $0.86 $0.61 $0.69 $0.77 $0.82 $0.86 $0.90 $0.94 $1.03 $1.11
RNC Minerals $0.70 2020 CFPS Gold $0.10 $0.03 $0.05 $0.07 $0.09 $0.10 $0.11 $0.12 $0.14 $0.16
Roxgold Inc. $1.70 2020 CFPS Gold $0.24 $0.16 $0.19 $0.22 $0.23 $0.24 $0.26 $0.27 $0.30 $0.33
SEMAFO Inc. $2.75 2020 CFPS Gold $0.62 $0.30 $0.41 $0.52 $0.57 $0.62 $0.67 $0.73 $0.83 $0.94
Superior Gold Inc. $1.15 2020 CFPS Gold $0.55 ($0.03) $0.16 $0.35 $0.45 $0.55 $0.64 $0.74 $0.93 $1.12
Note: For price forecast estimates, please refer to the "Haywood Metals and Currencies Forecast" Table later in this report
Company Target MetricPrimary
Commodity
Base
Case
Percentage Change Relative to Haywood Forecasted Commodity Prices
Percentage Change Relative to Haywood Forecasted Commodity Prices
Company Target MetricPercentage Change Relative to Haywood Forecasted Commodity PricesBase
Case
Primary
Commodity
Company Target MetricPrimary
Commodity
Base
Case
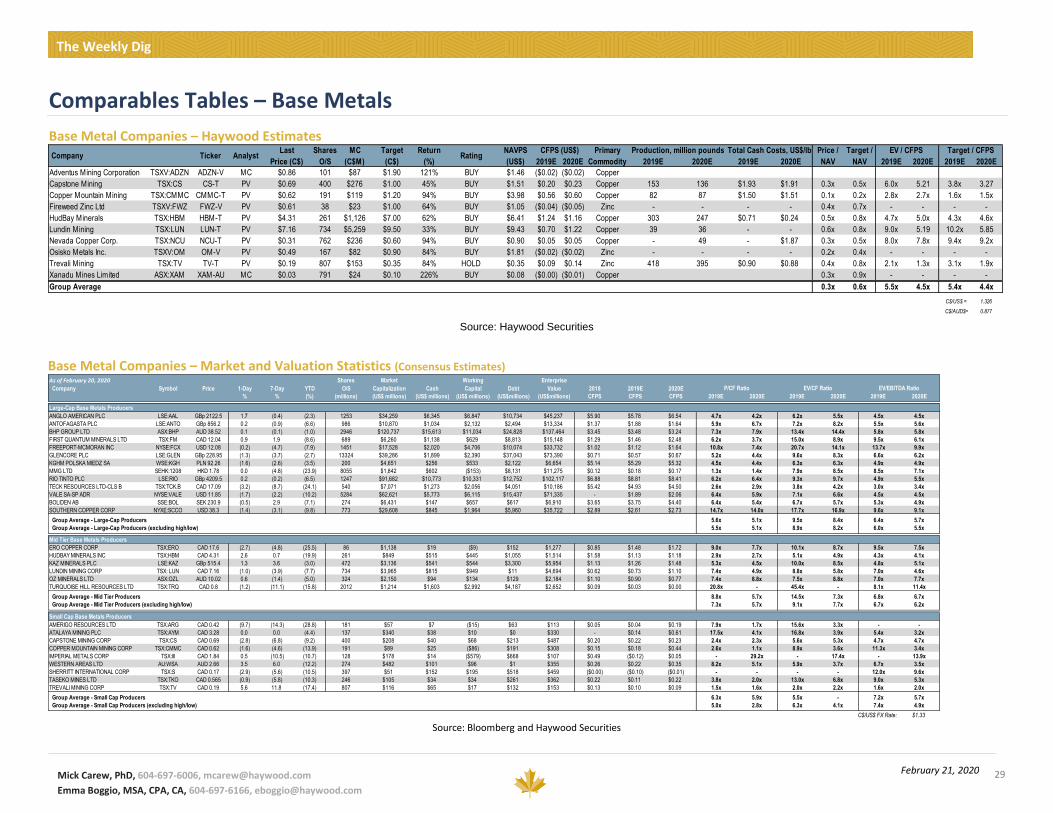
Mick Carew, PhD, 604-697-6006, [email protected]
Emma Boggio, MSA, CPA, CA, 604-697-6166, [email protected]
The Weekly Dig
29 February 21, 2020
Comparables Tables – Base Metals
Base Metal Companies – Haywood Estimates
Source: Haywood Securities
Base Metal Companies – Market and Valuation Statistics (Consensus Estimates)
Source: Bloomberg and Haywood Securities
Last Shares MC Target Return NAVPS Primary
Price (C$) O/S (C$M) (C$) (%) (US$) 2019E 2020E Commodity 2019E 2020E 2019E 2020E 2019E 2020E 2019E 2020E
Adventus Mining Corporation TSXV:ADZN ADZN-V MC $0.86 101 $87 $1.90 121% BUY $1.46 ($0.02) ($0.02) Copper
Capstone Mining TSX:CS CS-T PV $0.69 400 $276 $1.00 45% BUY $1.51 $0.20 $0.23 Copper 153 136 $1.93 $1.91 0.3x 0.5x 6.0x 5.21 3.8x 3.27
Copper Mountain Mining TSX:CMMC CMMC-T PV $0.62 191 $119 $1.20 94% BUY $3.98 $0.56 $0.60 Copper 82 87 $1.50 $1.51 0.1x 0.2x 2.8x 2.7x 1.6x 1.5x
Fireweed Zinc Ltd TSXV:FWZ FWZ-V PV $0.61 38 $23 $1.00 64% BUY $1.05 ($0.04) ($0.05) Zinc - - - - 0.4x 0.7x - - - -
HudBay Minerals TSX:HBM HBM-T PV $4.31 261 $1,126 $7.00 62% BUY $6.41 $1.24 $1.16 Copper 303 247 $0.71 $0.24 0.5x 0.8x 4.7x 5.0x 4.3x 4.6x
Lundin Mining TSX:LUN LUN-T PV $7.16 734 $5,259 $9.50 33% BUY $9.43 $0.70 $1.22 Copper 39 36 - - 0.6x 0.8x 9.0x 5.19 10.2x 5.85
Nevada Copper Corp. TSX:NCU NCU-T PV $0.31 762 $236 $0.60 94% BUY $0.90 $0.05 $0.05 Copper - 49 - $1.87 0.3x 0.5x 8.0x 7.8x 9.4x 9.2x
Osisko Metals Inc. TSXV:OM OM-V PV $0.49 167 $82 $0.90 84% BUY $1.81 ($0.02) ($0.02) Zinc - - - - 0.2x 0.4x - - - -
Trevali Mining TSX:TV TV-T PV $0.19 807 $153 $0.35 84% HOLD $0.35 $0.09 $0.14 Zinc 418 395 $0.90 $0.88 0.4x 0.8x 2.1x 1.3x 3.1x 1.9x
Xanadu Mines Limited ASX:XAM XAM-AU MC $0.03 791 $24 $0.10 226% BUY $0.08 ($0.00) ($0.01) Copper 0.3x 0.9x - - - -
Group Average 0.3x 0.6x 5.5x 4.5x 5.4x 4.4x
C$/US$ = 1.326
C$/AUD$= 0.877
Price /
NAV
Target /
NAV
Total Cash Costs, US$/lb EV / CFPS Target / CFPSProduction, million pounds Company Ticker Analyst Rating
CFPS (US$)
As of February 20, 2020 Shares Market Working Enterprise
Company Symbol Price 1-Day 7-Day YTD O/S Capitalization Cash Capital Debt Value 2018 2019E 2020E
% % (%) (millions) (US$ millions) (US$ millions) (US$ millions) (US$millions) (US$millions) CFPS CFPS CFPS 2019E 2020E 2019E 2020E 2019E 2020E
Large-Cap Base Metals Producers
ANGLO AMERICAN PLC LSE:AAL GBp 2122.5 1.7 (0.4) (2.3) 1253 $34,259 $6,345 $6,847 $10,734 $45,237 $5.90 $5.78 $6.54 4.7x 4.2x 6.2x 5.5x 4.5x 4.5x
ANTOFAGASTA PLC LSE:ANTO GBp 856.2 0.2 (0.9) (6.6) 986 $10,870 $1,034 $2,132 $2,494 $13,334 $1.37 $1.88 $1.64 5.9x 6.7x 7.2x 8.2x 5.5x 5.6x
BHP GROUP LTD ASX:BHP AUD 38.52 0.1 (0.1) (1.0) 2946 $120,737 $15,613 $11,034 $24,828 $137,464 $3.45 $3.48 $3.24 7.3x 7.9x 13.4x 14.4x 5.8x 5.8x
FIRST QUANTUM MINERALS LTD TSX:FM CAD 12.04 0.9 1.9 (8.6) 689 $6,260 $1,138 $629 $8,813 $15,148 $1.29 $1.46 $2.48 6.2x 3.7x 15.0x 8.9x 9.5x 6.1x
FREEPORT-MCMORAN INC NYSE:FCX USD 12.08 (0.2) (4.7) (7.9) 1451 $17,528 $2,020 $4,706 $10,074 $33,732 $1.02 $1.12 $1.64 10.8x 7.4x 20.7x 14.1x 13.7x 9.9x
GLENCORE PLC LSE:GLEN GBp 228.95 (1.3) (3.7) (2.7) 13324 $39,286 $1,899 $2,390 $37,043 $73,390 $0.71 $0.57 $0.67 5.2x 4.4x 9.6x 8.3x 6.6x 6.2x
KGHM POLSKA MIEDZ SA WSE:KGH PLN 92.26 (1.6) (2.6) (3.5) 200 $4,651 $256 $533 $2,122 $6,654 $5.14 $5.29 $5.32 4.5x 4.4x 6.3x 6.3x 4.9x 4.9x
MMG LTD SEHK:1208 HKD 1.78 0.0 (4.8) (23.9) 8055 $1,842 $602 ($153) $8,131 $11,275 $0.12 $0.18 $0.17 1.3x 1.4x 7.9x 8.5x 8.5x 7.1x
RIO TINTO PLC LSE:RIO GBp 4209.5 0.2 (0.2) (6.5) 1247 $91,682 $10,773 $10,331 $12,752 $102,117 $6.88 $8.81 $8.41 6.2x 6.4x 9.3x 9.7x 4.9x 5.5x
TECK RESOURCES LTD-CLS B TSX:TCK.B CAD 17.09 (3.2) (8.7) (24.1) 540 $7,071 $1,273 $2,056 $4,051 $10,186 $5.42 $4.93 $4.50 2.6x 2.9x 3.8x 4.2x 3.0x 3.4x
VALE SA-SP ADR NYSE:VALE USD 11.85 (1.7) (2.2) (10.2) 5284 $62,621 $5,773 $6,115 $15,437 $71,335 - $1.89 $2.06 6.4x 5.9x 7.1x 6.6x 4.5x 4.5x
BOLIDEN AB SSE:BOL SEK 230.9 (0.5) 2.9 (7.1) 274 $6,431 $147 $657 $617 $6,910 $3.65 $3.75 $4.40 6.4x 5.4x 6.7x 5.7x 5.3x 4.9x
SOUTHERN COPPER CORP NYXE:SCCO USD 38.3 (1.4) (3.1) (9.8) 773 $29,608 $845 $1,964 $5,960 $35,722 $2.89 $2.61 $2.73 14.7x 14.0x 17.7x 16.9x 9.6x 9.1x
Group Average - Large-Cap Producers 5.6x 5.1x 9.5x 8.4x 6.4x 5.7x
Group Average - Large-Cap Producers (excluding high/low) 5.5x 5.1x 8.9x 8.2x 6.0x 5.5x
Mid Tier Base Metals Producers
ERO COPPER CORP TSX:ERO CAD 17.6 (2.7) (4.8) (25.5) 86 $1,138 $19 ($9) $152 $1,277 $0.85 $1.48 $1.72 9.0x 7.7x 10.1x 8.7x 9.5x 7.5x
HUDBAY MINERALS INC TSX:HBM CAD 4.31 2.6 0.7 (19.9) 261 $849 $515 $445 $1,055 $1,514 $1.58 $1.13 $1.18 2.9x 2.7x 5.1x 4.9x 4.3x 4.1x
KAZ MINERALS PLC LSE:KAZ GBp 515.4 1.3 3.6 (3.0) 472 $3,136 $541 $544 $3,300 $5,954 $1.13 $1.26 $1.48 5.3x 4.5x 10.0x 8.5x 4.8x 5.1x
LUNDIN MINING CORP TSX: LUN CAD 7.16 (1.0) (3.9) (7.7) 734 $3,965 $815 $949 $11 $4,694 $0.62 $0.73 $1.10 7.4x 4.9x 8.8x 5.8x 7.0x 4.6x
OZ MINERALS LTD ASX:OZL AUD 10.02 0.6 (1.4) (5.0) 324 $2,150 $94 $134 $129 $2,184 $1.10 $0.90 $0.77 7.4x 8.8x 7.5x 8.8x 7.0x 7.7x
TURQUOISE HILL RESOURCES LTD TSX:TRQ CAD 0.8 (1.2) (11.1) (15.8) 2012 $1,214 $1,603 $2,992 $4,187 $2,652 $0.09 $0.03 $0.00 20.8x - 45.4x - 8.1x 11.4x
Group Average - Mid Tier Producers 8.8x 5.7x 14.5x 7.3x 6.8x 6.7x
Group Average - Mid Tier Producers (excluding high/low) 7.3x 5.7x 9.1x 7.7x 6.7x 6.2x
Small Cap Base Metals Producers
AMERIGO RESOURCES LTD TSX:ARG CAD 0.42 (9.7) (14.3) (28.8) 181 $57 $7 ($15) $63 $113 $0.05 $0.04 $0.19 7.9x 1.7x 15.6x 3.3x - -
ATALAYA MINING PLC TSX:AYM CAD 3.28 0.0 0.0 (4.4) 137 $340 $38 $10 $0 $330 - $0.14 $0.61 17.5x 4.1x 16.8x 3.9x 5.4x 3.2x
CAPSTONE MINING CORP TSX:CS CAD 0.69 (2.8) (6.8) (9.2) 400 $208 $40 $68 $213 $487 $0.20 $0.22 $0.23 2.4x 2.3x 5.6x 5.3x 4.7x 4.7x
COPPER MOUNTAIN MINING CORP TSX:CMMC CAD 0.62 (1.6) (4.6) (13.9) 191 $89 $25 ($86) $191 $308 $0.15 $0.18 $0.44 2.6x 1.1x 8.9x 3.6x 11.3x 3.4x
IMPERIAL METALS CORP TSX:III CAD 1.84 0.5 (10.5) (10.7) 128 $178 $14 ($579) $668 $107 $0.49 ($0.12) $0.05 - 29.2x - 17.4x - 13.9x
WESTERN AREAS LTD AU:WSA AUD 2.66 3.5 6.0 (12.2) 274 $482 $101 $96 $1 $355 $0.26 $0.22 $0.35 8.2x 5.1x 5.9x 3.7x 6.7x 3.5x
SHERRITT INTERNATIONAL CORP TSX:S CAD 0.17 (2.9) (5.6) (10.5) 397 $51 $152 $195 $518 $459 ($0.00) ($0.10) ($0.01) - - - - 12.0x 9.6x
TASEKO MINES LTD TSX:TKO CAD 0.565 (0.9) (5.8) (10.3) 246 $105 $34 $34 $261 $362 $0.22 $0.11 $0.22 3.8x 2.0x 13.0x 6.8x 9.0x 5.3x
TREVALI MINING CORP TSX:TV CAD 0.19 5.6 11.8 (17.4) 807 $116 $65 $17 $132 $153 $0.13 $0.10 $0.09 1.5x 1.6x 2.0x 2.2x 1.6x 2.0x
Group Average - Small Cap Producers 6.3x 5.9x 5.5x - 7.2x 5.7x
Group Average - Small Cap Producers (excluding high/low) 5.0x 2.8x 6.3x 4.1x 7.4x 4.9x
. C$/US$ FX Rate: $1.33
P/CF Ratio EV/CF Ratio EV/EBITDA Ratio
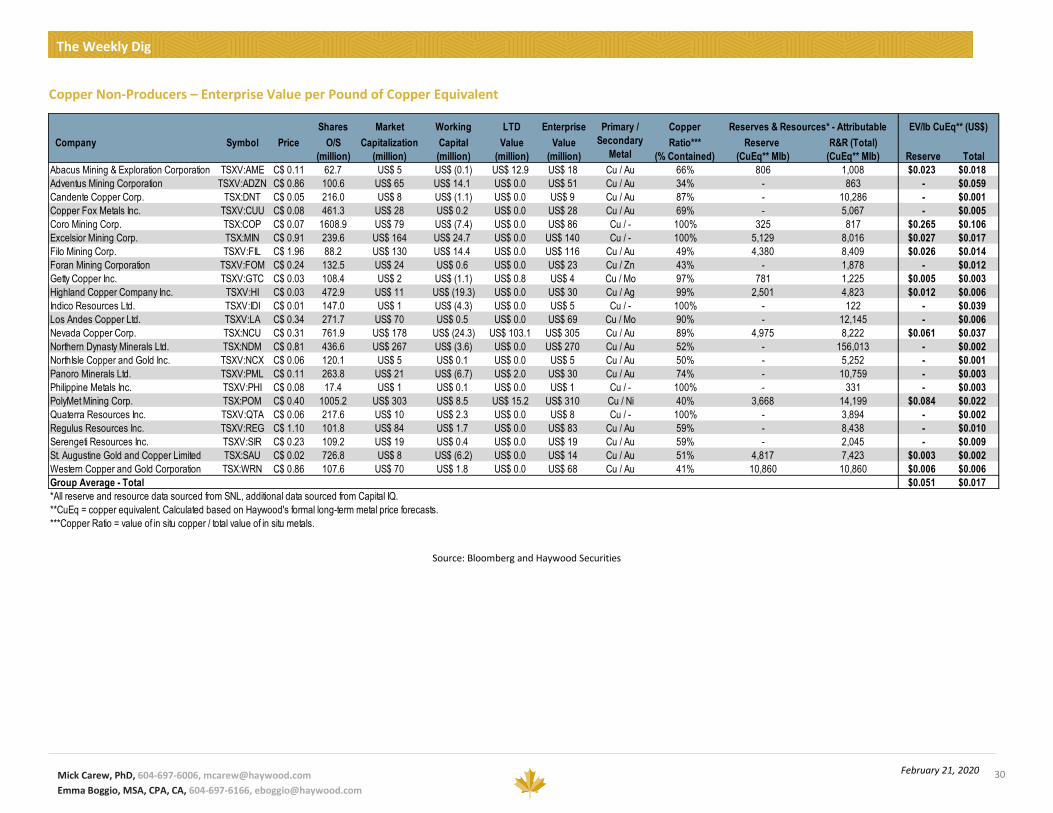
Mick Carew, PhD, 604-697-6006, [email protected]
Emma Boggio, MSA, CPA, CA, 604-697-6166, [email protected]
The Weekly Dig
30 February 21, 2020
Copper Non-Producers – Enterprise Value per Pound of Copper Equivalent
Source: Bloomberg and Haywood Securities
Shares Market Working LTD Enterprise Copper
Company Symbol Price O/S Capitalization Capital Value Value Ratio*** Reserve R&R (Total)
(million) (million) (million) (million) (million) (% Contained) (CuEq** Mlb) (CuEq** Mlb) Reserve Total
Abacus Mining & Exploration Corporation TSXV:AME C$ 0.11 62.7 US$ 5 US$ (0.1) US$ 12.9 US$ 18 Cu / Au 66% 806 1,008 $0.023 $0.018
Adventus Mining Corporation TSXV:ADZN C$ 0.86 100.6 US$ 65 US$ 14.1 US$ 0.0 US$ 51 Cu / Au 34% - 863 - $0.059
Candente Copper Corp. TSX:DNT C$ 0.05 216.0 US$ 8 US$ (1.1) US$ 0.0 US$ 9 Cu / Au 87% - 10,286 - $0.001
Copper Fox Metals Inc. TSXV:CUU C$ 0.08 461.3 US$ 28 US$ 0.2 US$ 0.0 US$ 28 Cu / Au 69% - 5,067 - $0.005
Coro Mining Corp. TSX:COP C$ 0.07 1608.9 US$ 79 US$ (7.4) US$ 0.0 US$ 86 Cu / - 100% 325 817 $0.265 $0.106
Excelsior Mining Corp. TSX:MIN C$ 0.91 239.6 US$ 164 US$ 24.7 US$ 0.0 US$ 140 Cu / - 100% 5,129 8,016 $0.027 $0.017
Filo Mining Corp. TSXV:FIL C$ 1.96 88.2 US$ 130 US$ 14.4 US$ 0.0 US$ 116 Cu / Au 49% 4,380 8,409 $0.026 $0.014
Foran Mining Corporation TSXV:FOM C$ 0.24 132.5 US$ 24 US$ 0.6 US$ 0.0 US$ 23 Cu / Zn 43% - 1,878 - $0.012
Getty Copper Inc. TSXV:GTC C$ 0.03 108.4 US$ 2 US$ (1.1) US$ 0.8 US$ 4 Cu / Mo 97% 781 1,225 $0.005 $0.003
Highland Copper Company Inc. TSXV:HI C$ 0.03 472.9 US$ 11 US$ (19.3) US$ 0.0 US$ 30 Cu / Ag 99% 2,501 4,823 $0.012 $0.006
Indico Resources Ltd. TSXV:IDI C$ 0.01 147.0 US$ 1 US$ (4.3) US$ 0.0 US$ 5 Cu / - 100% - 122 - $0.039
Los Andes Copper Ltd. TSXV:LA C$ 0.34 271.7 US$ 70 US$ 0.5 US$ 0.0 US$ 69 Cu / Mo 90% - 12,145 - $0.006
Nevada Copper Corp. TSX:NCU C$ 0.31 761.9 US$ 178 US$ (24.3) US$ 103.1 US$ 305 Cu / Au 89% 4,975 8,222 $0.061 $0.037
Northern Dynasty Minerals Ltd. TSX:NDM C$ 0.81 436.6 US$ 267 US$ (3.6) US$ 0.0 US$ 270 Cu / Au 52% - 156,013 - $0.002
NorthIsle Copper and Gold Inc. TSXV:NCX C$ 0.06 120.1 US$ 5 US$ 0.1 US$ 0.0 US$ 5 Cu / Au 50% - 5,252 - $0.001
Panoro Minerals Ltd. TSXV:PML C$ 0.11 263.8 US$ 21 US$ (6.7) US$ 2.0 US$ 30 Cu / Au 74% - 10,759 - $0.003
Philippine Metals Inc. TSXV:PHI C$ 0.08 17.4 US$ 1 US$ 0.1 US$ 0.0 US$ 1 Cu / - 100% - 331 - $0.003
PolyMet Mining Corp. TSX:POM C$ 0.40 1005.2 US$ 303 US$ 8.5 US$ 15.2 US$ 310 Cu / Ni 40% 3,668 14,199 $0.084 $0.022
Quaterra Resources Inc. TSXV:QTA C$ 0.06 217.6 US$ 10 US$ 2.3 US$ 0.0 US$ 8 Cu / - 100% - 3,894 - $0.002
Regulus Resources Inc. TSXV:REG C$ 1.10 101.8 US$ 84 US$ 1.7 US$ 0.0 US$ 83 Cu / Au 59% - 8,438 - $0.010
Serengeti Resources Inc. TSXV:SIR C$ 0.23 109.2 US$ 19 US$ 0.4 US$ 0.0 US$ 19 Cu / Au 59% - 2,045 - $0.009
St. Augustine Gold and Copper Limited TSX:SAU C$ 0.02 726.8 US$ 8 US$ (6.2) US$ 0.0 US$ 14 Cu / Au 51% 4,817 7,423 $0.003 $0.002
Western Copper and Gold Corporation TSX:WRN C$ 0.86 107.6 US$ 70 US$ 1.8 US$ 0.0 US$ 68 Cu / Au 41% 10,860 10,860 $0.006 $0.006
Group Average - Total $0.051 $0.017
*All reserve and resource data sourced from SNL, additional data sourced from Capital IQ.
**CuEq = copper equivalent. Calculated based on Haywood's formal long-term metal price forecasts.
***Copper Ratio = value of in situ copper / total value of in situ metals.
Primary /
Secondary
Metal
EV/lb CuEq** (US$)Reserves & Resources* - Attributable

Mick Carew, PhD, 604-697-6006, [email protected]
Emma Boggio, MSA, CPA, CA, 604-697-6166, [email protected]
The Weekly Dig
31 February 21, 2020
Nickel Non-Producers – Enterprise Value per Pound of Nickel Equivalent
Zinc Non-Producers – Enterprise Value per Pound of Zinc Equivalent
Shares Market Working LTD Enterprise Nickel
Company Symbol Price O/S Capitalization Capital Value Value Ratio*** Reserve R&R (Total)
(million) (million) (million) (million) (million) (% Contained) (NiEq** Mlb) (NiEq** Mlb) Reserve Total
CaNickel Mining Limited TSXV:CML C$ 0.07 37.5 US$ 2 US$ (71.7) US$ 0.0 US$ 74 Ni / - 100% 83 397 $0.893 $0.185
FPX Nickel Corp. TSXV:FPX C$ 0.20 154.7 US$ 23 US$ 1.4 US$ 5.9 US$ 28 Ni / - 100% - 5,995 - $0.005
Giga Metals Corporation TSXV:GIGA C$ 0.28 55.5 US$ 12 US$ 2.5 US$ 0.0 US$ 9 Ni / Co 73% - 8,039 - $0.001
Gossan Resources Limited TSXV:GSS C$ 0.06 33.8 US$ 1 US$ (0.1) US$ 0.0 US$ 1 Ni / Cu 52% - 76 - $0.019
Hannan Metals Ltd. TSXV:HAN C$ 0.23 74.1 US$ 13 US$ 0.0 US$ 0.3 US$ 13 Ni / Cu 80% - 2,456 - $0.005
New Era Minerals Inc. TSXV:NEM C$ 0.04 106.9 US$ 3 US$ (1.1) US$ 0.2 US$ 5 Ni / - 100% - 454 - $0.010
Royal Nickel Corporation TSX:RNX C$ 0.45 607.8 US$ 204 US$ 9.2 US$ 18.2 US$ 213 Ni / Co 69% 2,550 5,161 $0.084 $0.041
Sama Resources Inc. TSXV:SME C$ 0.20 216.5 US$ 33 US$ 3.2 US$ 0.0 US$ 29 Ni / Co 48% - 1,051 - $0.028
Strongbow Exploration Inc. TSXV:SBW C$ 0.05 133.8 US$ 5 US$ 1.0 US$ 3.8 US$ 8 Ni / Sn 50% - 723 - $0.011
Talon Metals Corp. TSX:TLO C$ 0.13 494.3 US$ 47 US$ 6.0 US$ 0.0 US$ 41 Ni / Cu 63% - 287 - $0.142
Group Average - Total $0.488 $0.034
*All reserve and resource data sourced from SNL, additional data sourced from Capital IQ.
**NiEq = nickel equivalent. Calculated based on Haywood's formal long-term metal price forecasts.
***Nickel Ratio = value of in situ nickel / total value of in situ metals.
Primary /
Secondary
Metal
Reserves & Resources* - AttributableEV/lb NiEq** (US$)
Shares Market Working LTD Enterprise Zinc
Company Symbol Price O/S Capitalization Capital Value Value Ratio*** Reserve R&R (Total)
(million) (million) (million) (million) (million) (% Contained) (ZnEq** Mlb) (ZnEq** Mlb) Reserve Total
Ascendant Resources Inc. TSX:ASND C$ 0.32 77.7 US$ 18 US$ (17.4) US$ 0.0 US$ 36 Zn / Pb 72% 848 1,883 $0.042 $0.019
Commander Resources Ltd. TSXV:CMD C$ 0.07 35.7 US$ 2 US$ 1.6 US$ 0.0 US$ 0 Zn / Cu 56% - 25 - $0.012
El Nino Ventures Inc. TSXV:ELN C$ 0.05 61.6 US$ 2 US$ 0.9 US$ 0.0 US$ 1 Zn / Cu 59% - 532 - $0.002
Firestone Ventures Inc. TSXV:FV C$ 0.05 53.7 US$ 2 US$ (0.3) US$ 0.0 US$ 2 Zn / Pb 77% - 429 - $0.005
Fireweed Zinc Ltd. TSXV:FWZ C$ 0.61 37.8 US$ 17 US$ 1.0 US$ 0.0 US$ 16 Zn / Pb 67% - 9,981 - $0.002
InZinc Mining Ltd. TSXV:IZN C$ 0.03 114.7 US$ 2 US$ 0.2 US$ 0.0 US$ 2 Zn / Cu 75% - 3,884 - $0.000
Karmin Exploration Inc. TSXV:KAR C$ 1.01 89.9 US$ 69 US$ (1.4) US$ 1.0 US$ 71 Zn / Pb 53% 1,109 2,507 $0.064 $0.028
Osisko Metals Incorporated TSXV:OM C$ 0.49 167.1 US$ 62 US$ 5.3 US$ 0.0 US$ 56 Zn / Pb 74% - 6,538 - $0.009
Rathdowney Resources Ltd. TSXV:RTH C$ 0.07 161.7 US$ 9 US$ (5.3) US$ 1.5 US$ 15 Zn / Pb 83% - 3,590 - $0.004
ScoZinc Mining Ltd. TSXV:SZM C$ 0.55 10.1 US$ 4 US$ 0.6 US$ 0.0 US$ 4 Zn / Pb 68% - 1,485 - $0.002
Titan Mining Corporation TSX:TI C$ 0.24 123.0 US$ 22 US$ 0.8 US$ 30.5 US$ 52 Zn / - 100% - 1,930 - $0.027
Trevali Mining Corporation TSX:TV C$ 0.19 806.8 US$ 116 US$ 62.9 US$ 66.4 US$ 119 Zn / Pb 71% 3,169 17,446 $0.038 $0.007
Wolfden Resources Corporation TSXV:WLF C$ 0.15 129.5 US$ 14 US$ 1.2 US$ 0.0 US$ 13 Zn / Au 41% - 5,175 - $0.003
Group Average - Total $0.048 $0.009
*All reserve and resource data sourced from SNL, additional data sourced from Capital IQ.
**ZnEq = Zinc equivalent. Calculated based on Haywood's formal long-term metal price forecasts.
***Zinc Ratio = value of in situ zinc / total value of in situ metals.
Primary /
Secondary
Metal
Reserves & Resources* - AttributableEV/lb ZnEq** (US$)

Mick Carew, PhD, 604-697-6006, [email protected]
Emma Boggio, MSA, CPA, CA, 604-697-6166, [email protected]
The Weekly Dig
32
February 21, 2020
Base Metals Sensitivity
Company
-30% -20% -10% -5% 0% 5% 10% 20% 30%
PRODUCERS
Capstone Mining Corp. $1.00 NAVPS Copper $1.98 ($2.43) ($0.90) $0.48 $1.25 $1.98 $2.71 $3.37 $4.76 $5.58
Copper Mountain Mining Corp. $1.20 NAVPS Copper $6.28 $0.58 $2.58 $4.51 $5.40 $6.28 $7.16 $8.04 $9.79 $11.55
Hudbay Minerals Inc. $7.00 NAVPS Copper $10.03 ($1.50) $2.44 $6.26 $8.15 $10.03 $11.91 $13.79 $17.54 $21.30
Lundin Mining Corporation $9.50 NAVPS Copper $12.32 $9.90 $10.76 $11.55 $11.95 $12.34 $12.71 $13.09 $13.85 $14.57
Trevali Mining Corporation $0.35 NAVPS Zinc $0.47 ($0.44) ($0.11) $0.19 $0.34 $0.47 $0.61 $0.76 $1.00 $1.25
DEVELOPERS / EXPLORERS
Adventus Mining Corporation $1.90 NAVPS Copper $1.93 $1.26 $1.49 $1.71 $1.81 $1.93 $2.03 $2.15 $2.37 $2.58
Fireweed Zinc Ltd $1.00 NAVPS Zinc $1.33 ($0.56) $0.07 $0.70 $1.02 $1.33 $1.65 $1.96 $2.59 $3.22
Nevada Copper Corp. $0.60 NAVPS Copper $1.17 ($0.27) $0.05 $0.52 $0.83 $1.17 $1.58 $2.05 $3.19 $4.58
Osisko Metals Inc. $0.90 NAVPS Zinc $2.32 ($0.51) $0.64 $1.51 $1.90 $2.32 $2.70 $3.08 $3.84 $4.64
Xanadu Mines Limited $0.10 NAVPS Copper $0.11 ($0.02) $0.02 $0.06 $0.08 $0.11 $0.13 $0.15 $0.20 $0.24
Company
-30% -20% -10% -5% 0% 5% 10% 20% 30%
PRODUCERS
Capstone Mining Corp. $1.00 2019 CFPS Copper $0.34 $0.23 $0.27 $0.30 $0.32 $0.34 $0.36 $0.38 $0.41 $0.45
Copper Mountain Mining Corp. $1.20 2019 CFPS Copper $0.21 $0.08 $0.12 $0.17 $0.19 $0.21 $0.23 $0.25 $0.29 $0.33
Hudbay Minerals Inc. $7.00 2019 CFPS Copper $1.58 $1.17 $1.31 $1.44 $1.51 $1.58 $1.65 $1.72 $1.85 $1.99
Lundin Mining Corporation $9.50 2019 CFPS Copper $0.93 $0.67 $0.76 $0.85 $0.89 $0.93 $0.97 $1.01 $1.09 $1.17
Trevali Mining Corporation $0.35 2019 CFPS Zinc $0.14 $0.06 $0.09 $0.11 $0.13 $0.14 $0.16 $0.17 $0.21 $0.25
Note: For price forecast estimates, please refer to the "Haywood Metals and Currencies Forecast" Table later in this report
Company
-30% -20% -10% -5% 0% 5% 10% 20% 30%
PRODUCERS
Capstone Mining Corp. $1.00 2020 CFPS Copper $0.29 ($0.08) $0.05 $0.17 $0.23 $0.29 $0.35 $0.42 $0.54 $0.66
Copper Mountain Mining Corp. $1.20 2020 CFPS Copper $0.82 $0.24 $0.45 $0.66 $0.75 $0.82 $0.89 $0.96 $1.10 $1.24
Hudbay Minerals Inc. $7.00 2020 CFPS Copper $1.45 ($0.20) $0.35 $0.90 $1.18 $1.45 $1.73 $2.00 $2.56 $3.11
Lundin Mining Corporation $9.50 2020 CFPS Copper $1.56 $0.58 $0.93 $1.25 $1.41 $1.56 $1.71 $1.86 $2.15 $2.45
Trevali Mining Corporation $0.35 2020 CFPS Zinc $0.17 ($0.03) $0.03 $0.09 $0.13 $0.17 $0.21 $0.26 $0.36 $0.47
Note: For price forecast estimates, please refer to the "Haywood Metals and Currencies Forecast" Table later in this report
Percentage Change Relative to Haywood Forecasted Commodity Prices
Base
Case
Percentage Change Relative to Haywood Forecasted Commodity Prices
Primary
Commodity
Base
Case
Percentage Change Relative to Haywood Forecasted Commodity Prices
Primary
Commodity
Base
Case
Target MetricPrimary
Commodity
MetricTarget
Target Metric

The Weekly Dig
Mick Carew, PhD, 604-697-6006, [email protected]
Emma Boggio, MSA, CPA, CA, 604-697-6166, [email protected]
33
February 21, 2020
Comparables Tables – Other (Uranium, Lithium, Diamond, Cobalt, Coal, Iron)
Uranium/Lithium Companies – Haywood Estimates
Source: Bloomberg and Haywood Securities
Diamond Companies – Haywood Estimates
Source: Bloomberg and Haywood Securities
Last Shares MC Target Return NAVPS Primary
Price O/S (C$M) (C$) (%) (US$) 2020E 2021E Commodity 2020E 2021E 2020E 2021E 2020E 2021E 2020E 2021E
Denison Mines DML-T CH $0.51 597 $305 $1.60 214% BUY C$1.62 ($0.03) ($0.02) Uranium - - -
Energy Fuels UUUU-US CH $1.39 115 US$159 US$3.50 152% BUY $3.50 ($0.22) ($0.10) Uranium 0.3 2.9 0.4x 1.0x - - - -
NexGen Energy NXE-T CH $1.45 360 $522 $6.00 314% BUY C$5.97 ($0.05) ($0.05) Uranium - - - 0.2x 1.0x - - - -
Uranium Energy UEC-US CH $0.87 184 US$160 US$2.60 199% BUY $2.62 ($0.04) $0.07 Uranium 0.2 1.6 0.3x 1.0x - 13.0x - 37.1x
Uranium Participation U-T CH $3.92 138 $541 $5.90 51% BUY C$5.88 Uranium - - - 0.7x 1.0x - - - -
Plateau Energy PLU-V CH $0.27 86 $23 N/A Under Review Uranium - - -
Azarga Uranium AZZ-T CH $0.17 186 $32 $0.50 194% BUY C$0.50 Uranium 0.3x 1.0x
Group Average 0.4x 1.0x - 13.0x - 37.1x
C$/US$ = 1.33
A$/US$ = 1.51
₤/US$ = 0.78
Target / CFPSPrice /
NAV
Target /
NAV Company
EV / CFPS RatingTicker Analyst
CFPS (US$) Production, million pounds Total Cash Costs, US$/lb
Last Shares MC Target Return NAVPS Primary Target / CFPS
Price (C$) O/S (M) (C$M) (C$) (%) (US$) 2019E 2020E Commodity 2019E 2020E 2019E 2020E 2019E 2020E 2019E 2020 2019E 2020E
Mountain Province Diamonds Inc. TSX:MPVD MPVD-T GM $1.14 210 $240 $3.50 207% BUY $3.23 $0.32 $0.36 Diamonds 6,821 7,159 $87 $82 $99 $91 0.3x 0.8x 6.8x 6.1x 8.4x 7.4x
Lucara Diamond Corp. TSX:LUC LUC-T GM $0.85 397 $337 $2.10 147% BUY $1.85 $0.15 $0.25 Diamonds 446 390 $209 $291 $432 $589 0.3x 0.9x 4.3x 2.5x 7.6x 6.2x
Group Average 0.3x 0.8x 5.6x 4.3x 8.0x 6.8x
C$/US$ = 1.3x 1.326
EV / CFPS Target /
NAV Company Ticker Analyst Rating
Price /
NAV
AISC, US$/ctTCC, US$/ctProduction, 000's caratsCFPS (US$)

Mick Carew, PhD, 604-697-6006, [email protected]
Emma Boggio, MSA, CPA, CA, 604-697-6166, [email protected]
The Weekly Dig
34
February 21, 2020
Uranium Comparables – Consensus Estimates
IBES Shares Market Enterprise Total Reserves IBES
Company (T icker)
Haywood Covered Names bold Share Price
Consensus
Target
Implied
Return
Outst.
(millions)
Capitalization
(millions)
Value (USD)
(millions)
& Resources
(M lb)
USD EV/lb
Resource
Consensus
NAV
Price /
Nav 2018 2019 2020 2018 2019 2020
Cameco Corporation (CCO-T) $12.03 $15.03 25% 396 $4,761 $3,551 $13.68 0.88x $1.19 $0.86 $0.76 10.1x 14.0x 15.9x
Uranium Energy (UEC-US) $0.87 $2.60 199% 184 $159.8 $167.5 $2.65 0.33x ($0.10) ($0.06) ($0.24)
Energy Fuels (UUUU-US) $1.39 $3.25 134% 115 $159.2 $159.6 $2.89 0.48x ($0.16) ($0.20) ($0.22)
Ur-Energy Inc. (URE-T) $0.51 $1.01 97% 160 $82.3 $91.1 $1.20 0.43x ($0.01) $0.04 ($0.04) 12.8x
Peninsula Energy (PEN-AU) $0.11 $0.26 142% 308 $33.6 $42.6 $0.40 0.27x ($0.01) ($0.02)
Energy Resources (ERA-AU) $0.16 518 $82.8 ($176.0) $0.21 0.76x $0.07 $0.17 ($0.03) 2.3x 0.9x
Group Average - Producers 0.53x 6.2x 9.2x 15.9x
NexGen Energy (NXE-T) $1.45 $4.76 228% 360 $522.4 $442.8 $5.28 0.27x ($0.02) ($0.04) ($0.04)
Denison Mines (DML-T) $0.51 $1.30 156% 597 $304.6 $222.5 $1.35 0.38x ($0.04) ($0.04) ($0.02)
Fission Uranium (FCU-T) $0.23 $1.60 611% 486 $109.4 $77.5 $1.54 0.15x ($0.01) ($0.01) ($0.01)
GoviEx Uranium (GXU-V) $0.10 439 $43.0 $54.5
Global Atomic (GLO-T) $0.45 145 $65.4 $45.4 113.2 $0.40
Boss Resources (BOE-AU) $0.06 1,587 $90.5 $55.5 ($0.00)
Deep Yellow (DYL-AU) $0.21 $0.40 95% 245 $50.2 $23.3
Laramide Resources (LAM-T) $0.21 165 $33.9 $32.6
UEX Corporation (UEX-T) $0.12 $0.45 275% 394 $47.3 $32.8 ($0.02)
Azarga Uranium (AZZ-T) $0.13 $0.36 180% 186 $23.8 $23.1 $0.51 0.25x ($0.03) ($0.02)
Toro Energy (TOE-AU) $0.01 2,490 $18.7 $19.5
Bannerman Resources (BMN-AU) $0.03 1,059 $32.8 $17.4
Plateau Energy (PLU-V) $0.27 86 $23.1 $16.5 ($0.06)
Vimy Resources (VMY-AU) $0.04 $0.34 710% 614 $25.8 $16.4 $0.32 0.13x ($0.02) ($0.01) ($0.01)
Western Uranium (WUC-L) $0.60 30 $18.1 $15.8
Forsys Metals (FSY-T) $0.11 167 $18.4 $13.1
A-Cap Energy (ACB-AU) $0.01 872 $9.6 $10.1
Energy Metals (EME-AU) $0.10 210 $21.0 $2.4
U3O8 Corp. (UWE-T) $0.05 23 $1.2 $1.4
Berkeley Energia (BKY-AU) $0.19 $1.09 492% 259 $47.8 ($8.4) ($0.09) ($0.05) ($0.05)
Group Average - Developers $0.40 0.24x
Aurania Resources (ARU-V) $3.23 $4.50 39% 38 $123.9 $94.5
Azimut Exploration (AZM-V) $1.56 61 $94.6 $70.5
IsoEnergy Ltd. (ISO-V) $0.48 91 $43.2 $32.0
ValOre Metals (VO-V) $0.33 90 $29.8 $20.6
Mega Uranium (MGA-T) $0.09 326 $29.4 $19.0
Globex Mining (GMX-T) $0.37 54 $20.1 $13.0
enCore Energy (:EU-V) $0.13 168 $21.0 $13.6
Blue Sky (BSK-V) $0.08 120 $9.6 $7.3
Skyharbour Resources (SYH-V) $0.17 $1.01 512% 75 $12.4 $9.0
Forum Energy (FMC-V) $0.09 109 $9.8 $7.3
Purepoint Uranium (PTU-V) $0.05 223 $11.2 $8.1
CanAlaska Uranium (CVV-V) $0.23 58 $13.2 $8.7
Marenica Energy (MEY-AU) $0.06 117 $7.1 $4.4
Fission 3.0 (FUU-V) $0.05 142 $7.1 $3.9
Anfield Energy (AEC-V) $0.07 $0.30 329% 75 $5.2 $3.7 $0.40 0.18x
X-Terra Resources (XTT-V) $0.10 59 $5.6 $3.6
Cauldron Energy (CXU-AU) $0.02 343 $5.1 $2.2
Eros Resources (ERC-V) $0.12 48 $5.6 $4.0
Avrupa Minerals (AVU-V) $0.03 114 $3.4 $2.6
Zadar Ventures (ZAD-V) $0.20 20 $3.9 $2.8
Uravan Minerals (UVN-V) $0.02 42 $0.6 $0.4
Vanadian Energy (VEC-V) $0.03 42 $1.3 $1.0
Tarku Resources (TKU-V) $0.12 12 $1.4 $1.0
Roughrider Exploration (REL-V) $0.06 14 $0.8 $0.5
Group Average - Explorers
INVENTORY FUNDS
Uranium Participation (U-T) $3.92 $5.49 40% 138 $541.2 $404.5 17.8 $22.70 $5.17 0.76x
Yellow Cake (YCA-LN) £2.55 £3.48 36% 88 £224.9 $215.7 9.6 $22.43
All data sourced from S&P Capital IQ, SNL Financial, Bloomberg, Haywood Securities, Company Reports
Consensus Targets In-Situ Comps - EV/lb U3O8 NAV Comps Cash Flow Comps
DE
VE
LO
PE
RS
EX
PL
OR
ER
S
CFPS (LoC) P/CFPS
PR
OD
UC
ER
S

Mick Carew, PhD, 604-697-6006, [email protected]
Emma Boggio, MSA, CPA, CA, 604-697-6166, [email protected]
The Weekly Dig
35 February 21, 2020
Diamond Sensitivity
Uranium Sensitivity
-30% -20% -10% -5% 0% 5% 10% 20% 30%
DEVELOPER / PRODUCER
Mountain Province Diamonds Inc. $3.50 NAVPS Diamonds $4.28 $2.29 $2.93 $3.59 $3.94 $4.28 $4.64 $4.99 $5.74 $6.51
Lucara Diamond Corp. $2.10 NAVPS Diamonds $2.03 $1.95 $1.98 $2.00 $2.02 $2.03 $2.04 $2.05 $2.08 $2.10
-30% -20% -10% -5% 0% 5% 10% 20% 30%
DEVELOPER / PRODUCER
Mountain Province Diamonds Inc. $3.50 2019 CFPS Diamonds $0.31 $0.37 $0.35 $0.33 $0.32 $0.31 $0.30 $0.29 $0.28 $0.27
Lucara Diamond Corp. $2.10 2019 CFPS Diamonds $0.13 $0.13 $0.13 $0.13 $0.13 $0.13 $0.13 $0.13 $0.13 $0.13
-30% -20% -10% -5% 0% 5% 10% 20% 30%
DEVELOPER / PRODUCER
Mountain Province Diamonds Inc. $3.50 2020 CFPS Diamonds $0.36 $0.23 $0.30 $0.32 $0.34 $0.36 $0.37 $0.38 $0.41 $0.43
Lucara Diamond Corp. $2.10 2020 CFPS Diamonds $0.20 $0.20 $0.20 $0.20 $0.20 $0.20 $0.20 $0.20 $0.20 $0.20
Note: Diamond sensitivities reflect changes in USD/CAD exchange rate
Note: For price forecast estimates, please refer to the "Haywood Metals and Currencies Forecast" Table later in this report
Percentage Change Relative to Haywood Forecasted Exchange RateCompany Target Metric
Primary
Commodity
Base
Case
Percentage Change Relative to Haywood Forecasted Exchange RateCompany Target Metric
Primary
Commodity
Base
Case
Percentage Change Relative to Haywood Forecasted Exchange RateCompany Target Metric
Primary
Commodity
Base
Case
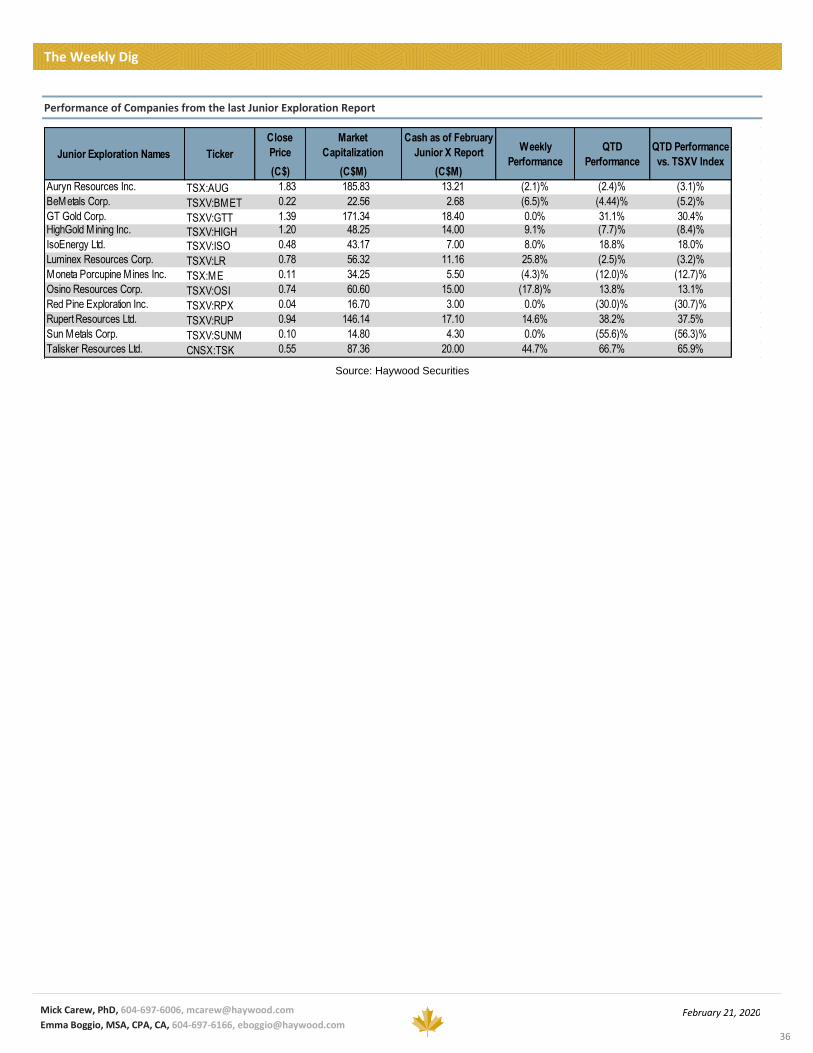
Mick Carew, PhD, 604-697-6006, [email protected]
Emma Boggio, MSA, CPA, CA, 604-697-6166, [email protected]
The Weekly Dig
36
February 21, 2020
Performance of Companies from the last Junior Exploration Report
Source: Haywood Securities
(C$) (C$M) (C$M)
Auryn Resources Inc. TSX:AUG 1.83 185.83 13.21 (2.1)% (2.4)% (3.1)%
BeMetals Corp. TSXV:BMET 0.22 22.56 2.68 (6.5)% (4.44)% (5.2)%
GT Gold Corp. TSXV:GTT 1.39 171.34 18.40 0.0% 31.1% 30.4%HighGold Mining Inc. TSXV:HIGH 1.20 48.25 14.00 9.1% (7.7)% (8.4)%
IsoEnergy Ltd. TSXV:ISO 0.48 43.17 7.00 8.0% 18.8% 18.0%
Luminex Resources Corp. TSXV:LR 0.78 56.32 11.16 25.8% (2.5)% (3.2)%
Moneta Porcupine Mines Inc. TSX:ME 0.11 34.25 5.50 (4.3)% (12.0)% (12.7)%
Osino Resources Corp. TSXV:OSI 0.74 60.60 15.00 (17.8)% 13.8% 13.1%
Red Pine Exploration Inc. TSXV:RPX 0.04 16.70 3.00 0.0% (30.0)% (30.7)%
Rupert Resources Ltd. TSXV:RUP 0.94 146.14 17.10 14.6% 38.2% 37.5%
Sun Metals Corp. TSXV:SUNM 0.10 14.80 4.30 0.0% (55.6)% (56.3)%
Talisker Resources Ltd. CNSX:TSK 0.55 87.36 20.00 44.7% 66.7% 65.9%
QTD Performance
vs. TSXV Index
New
s TickerJunior Exploration Names QTD
Performance
Weekly
Performance
Cash as of February
Junior X Report
Market
Capitalization
Close
Price

Mick Carew, PhD, 604-697-6006, [email protected]
Emma Boggio, MSA, CPA, CA, 604-697-6166, [email protected]
The Weekly Dig
37
February 21, 2020
Haywood Metals and Currencies Performance and Forecasts
Source: Bloomberg, Haywood Securities

Mick Carew, PhD, 604-697-6006, [email protected]
Emma Boggio, MSA, CPA, CA, 604-697-6166, [email protected]
The Weekly Dig
38
February 21, 2020
Important Information and Legal Disclosures
This report may be distributed in the following states: nil. Otherwise, this report may only be distributed into those states with an institutional buyer state securities registration exemption.
Analyst Certification
We, Mick Carew, Geordie Mark, Kerry Smith, Pierre Vaillancourt, Colin Healey, hereby certify that the views expressed in this report (which includes the rating assigned to the issuer’s shares as well as the analytical substance and tone of the report) accurately reflect my/our personal views about the subject securities and the issuer. No part of my/our compensation was, is, or will be directly or indirectly related to the specific recommendations.
Important Disclosures
Of the companies included in the report the following Important Disclosures apply:
Ticker Company 1 2 3 4 5 6 7 8
TSXV:ADZN Adventus Zinc Corp. X X X X
TSX:AGI Alamos Gold Inc. X
TSX:AKG Asanko Gold Inc. X
TSXV:AU Aurion Resources Ltd. X X X X
TSX:AZZ Azarga Uranium Corp. X X X
TSX:BTO B2Gold Corp. X X
TSX:ABX Barrick Gold Corporation X
TSXV:BSR Bluestone Resources Inc. X X
TSX:CXB Calibre Mining Corp. X X X X X
TSX:CS Capstone Mining Corp. X
TSX:CMMC Copper Mountain Mining Corp. X X
TSX:DML Denison Mines Corp. X X
TSX:ELD Eldorado Gold Corporation X X
TSX:EDV Endeavour Mining Corp. X X
TSX:EFR Energy Fuels Inc. X X
TSXV:EQX Equinox Gold Corp. X X X
TSXV:FPC Falco Resources Ltd. X
TSXV:FIL Filo Mining Corp. X X X
TSXV:FWZ Fireweed Zinc Ltd. X X X X
TSXV:GQC GoldQuest Mining Corp. X
ASX:GOR Gold Road Resources Limited X
TSX:HRT Harte Gold Corp. X X X
TSX:HBM Hudbay Minerals, Inc. X
TSXV:ISO IsoEnergy ltd. X X
TSXV:KNT K92 Mining Inc. X X
TSX:LGD Liberty Gold Corp. X X X
TSX:LUC Lucara Diamond Corp. X X
TSXV:LUM Lumina Gold Corp. X X X X
TSX:LUG Lundin Gold Inc. X
TSX:LUN Lundin Mining Corporation X
TSX:MOZ Marathon Gold Corp. X X X
TSXV:MTA Metalla Royalty & Streaming
TSX:MAX Midas Gold Corp. X X X
TSXV:MAI Minera Alamos Inc. X
TSX:MPVD Mountain Province Diamonds Inc. X X
TSX:NXE NexGen Energy Ltd. X

Mick Carew, PhD, 604-697-6006, [email protected]
Emma Boggio, MSA, CPA, CA, 604-697-6166, [email protected]
The Weekly Dig
39
February 21, 2020
TSX:NCU Nevada Copper Corp. X X
TSX:NHK Nighthawk Gold Corp. X X X
TSX:OGC OceanaGold Corporation X
TSX:OR Osisko Gold Royalties Ltd. X
TSXV:OM Osisko Metals Inc. X X X
TSX:OSK Osisko Mining Corp. X X
TSXV:OSI Osino Resources Corp. X X X X
TSXV:PLU Plateau Energy Metals Inc. X X X X
TSXV:PGM Pure Gold Mining Inc. X X X X
TSXV:ROG Roxgold Inc. X X
TSX:RNX RNC Minerals X X X X
TSX:SBB Sabina Gold and Silver Corp. X
TSXV:SGI Superior Gold Inc.
TSX:SMF SEMAFO Inc. X
TSX:STGO Steppe Gold Ltd. X X
TSX:TML Treasury Metals Inc. X X
TSX:TV Trevali Mining Corp. X X
TSXV:TLG Trolius Gold Corp. X X
AMEX:UEC Uranium Energy Corp. X
TSX:U Uranium Participation Corporation X
TSX:XAM Xanadu Mines Ltd. X
1 The Analyst(s) preparing this report (or a member of the Analysts’ households) have a financial interest in this company.
2 As of the end of the month immediately preceding this publication either Haywood Securities, Inc., one of its subsidiaries, its officers or directors beneficially owned 1% or more of this company.
3 Haywood Securities, Inc. has reviewed lead projects of this company and a portion of the expenses for this travel have been reimbursed by the issuer.
4 Haywood Securities Inc. or one of its subsidiaries has managed or co-managed or participated as selling group in a public offering of securities for this company in the past 12 months.
5 Haywood Securities, Inc. or one of its subsidiaries has received compensation for investment banking services from this company in the past 12 months
6 Haywood Securities, Inc. or one of its subsidiaries has received compensation for investment banking services from this company in the past 24 months
7 Haywood Securities, Inc. or one of its subsidiaries is restricted on this company at the time of publication
8 Haywood Securities, Inc. or one of its subsidiaries expects to receive or intends to seek compensation for investment banking services from this company in the next three months
Distribution of Ratings (as of February 21, 2020)
IB Clients
% # (TTM)
Buy 76.2% 80 93.5%
Hold 14.3% 15 3.2%
Sell 1.0% 1 0.0%
Tender 1.0% 1 0.0%
UR (Buy) 1.0% 1 0.0%
UR (Hold) 0.0% 0 0.0%
UR (Sell) 0.0% 0 0.0%
Dropped (TTM) 6.7% 7 3.2%

Mick Carew, PhD, 604-697-6006, [email protected]
Emma Boggio, MSA, CPA, CA, 604-697-6166, [email protected]
The Weekly Dig
40
February 21, 2020
Price Chart, Rating and Target Price History (as of February 21, 2020)
Adventus Mining Corporation (ADZN-V) Date Target(C$) Rating5/3/19 $1.90 Buy2/7/19 $1.80 Buy
Initiated Coverage: 2/7/2019
0
0.5
1
1.5
2
2.5
Feb17
May17
Aug17
Nov17
Feb18
May18
Aug18
Nov18
Feb19
May19
Aug19
Nov19
Price History (C$) Target/Rating/Coverage Change
Alamos Gold Inc. (AGI-T) Date Target(C$) Rating11/1/19 $10.25 Buy
10/15/19 $10.25 Hold7/25/19 $11.00 Buy1/16/19 $9.00 Buy
10/17/17 $10.00 Buy7/19/17 $11.50 Buy
Initiated Coverage 10/03/03
0
2
4
6
8
10
12
14
Jan17
Apr17
Jul17
Oct17
Jan18
Apr18
Jul18
Oct18
Jan19
Apr19
Jul19
Oct19
Price History (C$) Target/Rating/Coverage Change
Asanko Gold Inc. (AKG-T) Date Target(C$) Rating4/4/19 $1.15 Hold
11/9/18 $1.65 Hold8/4/17 $2.00 Hold
7/20/17 $4.50 Buy2/28/17 $5.20 Buy2/22/17 $5.50 Buy1/25/17 $5.50 Hold
Initiated Coverage 12/11/13
0
1
2
3
4
5
6
Jan17
Apr17
Jul17
Oct17
Jan18
Apr18
Jul18
Oct18
Jan19
Apr19
Jul19
Oct19
Price History (C$) Target/Rating/Coverage Change
Aurion Resources Ltd. (AU-V) Date Target(C$) Rating1/23/20 $3.50 Buy
Initiated Coverage: 1/23/2020
0
0.5
1
1.5
2
2.5
3
3.5
4
Jan17
Apr17
Jul17
Oct17
Jan18
Apr18
Jul18
Oct18
Jan19
Apr19
Jul19
Oct19
Price History (C$) Target/Rating/Coverage Change
Azarga Uranium Corp. (AZZ-T) Date Target(C$) Rating6/24/19 $0.50 Buy
Initiated Coverage: 6/24/2019
0
0.1
0.2
0.3
0.4
0.5
0.6
0.7
0.8
0.9
Jan17
Apr17
Jul17
Oct17
Jan18
Apr18
Jul18
Oct18
Jan19
Apr19
Jul19
Oct19
Price History (C$) Target/Rating/Coverage Change
B2Gold Corp. (BTO-T) Date Target(C$) Rating1/22/20 $7.50 Buy7/25/19 $6.50 Buy7/20/17 $5.00 Buy1/25/17 $5.50 Buy
Transferred Coverage 09/12/12; Re-Initiated Coverage 02/05/14
0
1
2
3
4
5
6
7
Jan17
Apr17
Jul17
Oct17
Jan18
Apr18
Jul18
Oct18
Jan19
Apr19
Jul19
Oct19
Price History (C$) Target/Rating/Coverage Change
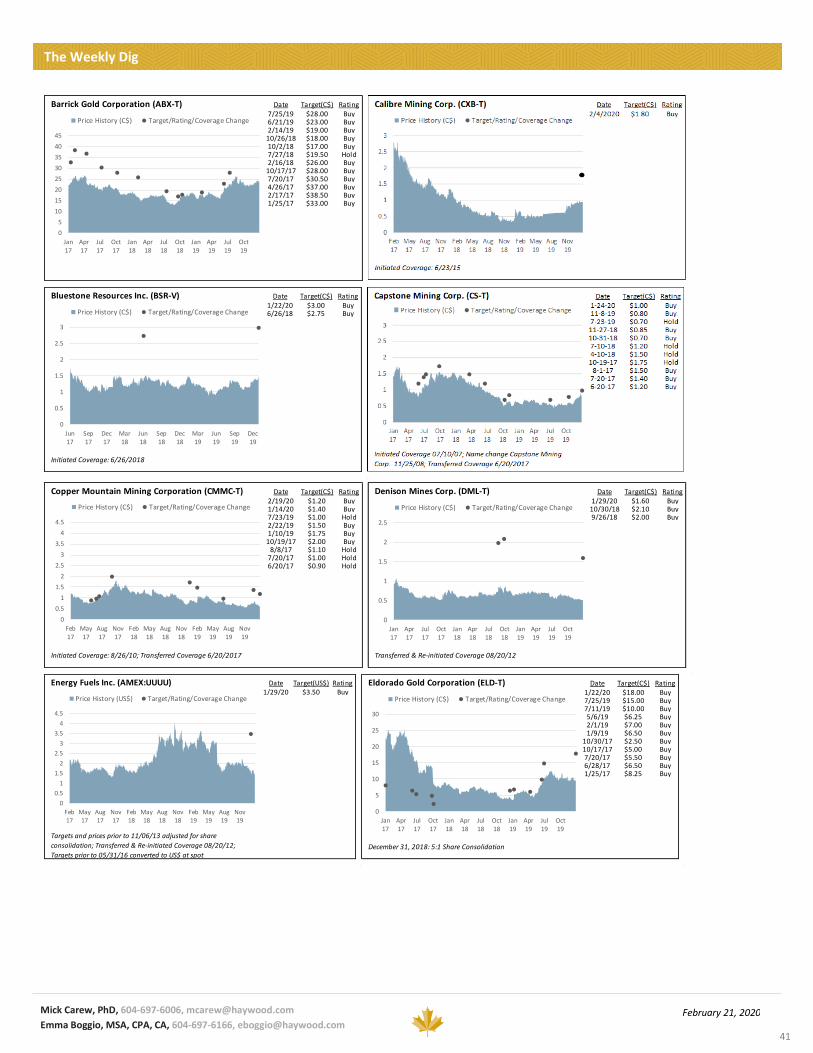
Mick Carew, PhD, 604-697-6006, [email protected]
Emma Boggio, MSA, CPA, CA, 604-697-6166, [email protected]
The Weekly Dig
41
February 21, 2020
Barrick Gold Corporation (ABX-T) Date Target(C$) Rating7/25/19 $28.00 Buy6/21/19 $23.00 Buy2/14/19 $19.00 Buy
10/26/18 $18.00 Buy10/2/18 $17.00 Buy7/27/18 $19.50 Hold2/16/18 $26.00 Buy
10/17/17 $28.00 Buy7/20/17 $30.50 Buy4/26/17 $37.00 Buy2/17/17 $38.50 Buy1/25/17 $33.00 Buy
0
5
10
15
20
25
30
35
40
45
Jan17
Apr17
Jul17
Oct17
Jan18
Apr18
Jul18
Oct18
Jan19
Apr19
Jul19
Oct19
Price History (C$) Target/Rating/Coverage Change
Bluestone Resources Inc. (BSR-V) Date Target(C$) Rating1/22/20 $3.00 Buy6/26/18 $2.75 Buy
Initiated Coverage: 6/26/2018
0
0.5
1
1.5
2
2.5
3
Jun17
Sep17
Dec17
Mar18
Jun18
Sep18
Dec18
Mar19
Jun19
Sep19
Dec19
Price History (C$) Target/Rating/Coverage Change
Copper Mountain Mining Corporation (CMMC-T) Date Target(C$) Rating2/19/20 $1.20 Buy1/14/20 $1.40 Buy7/23/19 $1.00 Hold2/22/19 $1.50 Buy1/10/19 $1.75 Buy
10/19/17 $2.00 Buy8/8/17 $1.10 Hold
7/20/17 $1.00 Hold6/20/17 $0.90 Hold
Initiated Coverage: 8/26/10; Transferred Coverage 6/20/2017
0
0.5
1
1.5
2
2.5
3
3.5
4
4.5
Feb17
May17
Aug17
Nov17
Feb18
May18
Aug18
Nov18
Feb19
May19
Aug19
Nov19
Price History (C$) Target/Rating/Coverage Change
Denison Mines Corp. (DML-T) Date Target(C$) Rating1/29/20 $1.60 Buy
10/30/18 $2.10 Buy9/26/18 $2.00 Buy
Transferred & Re-initiated Coverage 08/20/12
0
0.5
1
1.5
2
2.5
Jan17
Apr17
Jul17
Oct17
Jan18
Apr18
Jul18
Oct18
Jan19
Apr19
Jul19
Oct19
Price History (C$) Target/Rating/Coverage Change
Energy Fuels Inc. (AMEX:UUUU) Date Target(US$) Rating1/29/20 $3.50 Buy
Targets and prices prior to 11/06/13 adjusted for share
consolidation; Transferred & Re-initiated Coverage 08/20/12;
Targets prior to 05/31/16 converted to US$ at spot
0
0.5
1
1.5
2
2.5
3
3.5
4
4.5
Feb17
May17
Aug17
Nov17
Feb18
May18
Aug18
Nov18
Feb19
May19
Aug19
Nov19
Price History (US$) Target/Rating/Coverage Change
Eldorado Gold Corporation (ELD-T) Date Target(C$) Rating1/22/20 $18.00 Buy7/25/19 $15.00 Buy7/11/19 $10.00 Buy5/6/19 $6.25 Buy2/1/19 $7.00 Buy1/9/19 $6.50 Buy
10/30/17 $2.50 Buy10/17/17 $5.00 Buy7/20/17 $5.50 Buy6/28/17 $6.50 Buy1/25/17 $8.25 Buy
December 31, 2018: 5:1 Share Consolidation
0
5
10
15
20
25
30
Jan17
Apr17
Jul17
Oct17
Jan18
Apr18
Jul18
Oct18
Jan19
Apr19
Jul19
Oct19
Price History (C$) Target/Rating/Coverage Change

Mick Carew, PhD, 604-697-6006, [email protected]
Emma Boggio, MSA, CPA, CA, 604-697-6166, [email protected]
The Weekly Dig
42
February 21, 2020
Endeavour Mining Corporation (EDV-T) Date Target(C$) Rating10/17/17 $32.00 Buy7/20/17 $35.00 Buy1/25/17 $31.00 Buy
Initiated Coverage 08/21/14; 10:1 Prices/Targets adjusted to reflect
Stock Consolidation 12/02/15; Transfer of Coverage 10/20/16
0
5
10
15
20
25
30
35
40
Jan17
Apr17
Jul17
Oct17
Jan18
Apr18
Jul18
Oct18
Jan19
Apr19
Jul19
Oct19
Price History (C$) Target/Rating/Coverage Change
Equinox Gold Corp. (EQX-T) Date Target(C$) Rating1/22/20 $14.50 Buy8/20/19 $13.75 Buy7/25/19 $2.75 Buy
10/19/18 $3.00 Buy10/17/17 $2.80 Buy
4/4/17 $3.00 Buy
Initiated Coverage: 4/4/2017; August 2019 - 5:1 Share
Consolidation
0
2
4
6
8
10
12
14
16
Aug18
Nov18
Feb19
May19
Aug19
Nov19
Price History (C$) Target/Rating/Coverage Change
Falco Resources Ltd. (FPC-V) Date Target(C$) Rating1/28/19 $0.40 Hold10/2/18 $0.75 Buy6/22/18 $1.25 Buy5/11/17 $2.00 Buy
Initiated Coverage: 5/11/2017
0
0.5
1
1.5
2
2.5
Jan17
Apr17
Jul17
Oct17
Jan18
Apr18
Jul18
Oct18
Jan19
Apr19
Jul19
Oct19
Price History (C$) Target/Rating/Coverage Change
Filo Mining Corp. (FIL-V) Date Target(C$) Rating4/18/18 $4.60 Buy
Initiated Coverage: 4/18/2018
0
1
2
3
4
5
Jan17
Apr17
Jul17
Oct17
Jan18
Apr18
Jul18
Oct18
Jan19
Apr19
Jul19
Oct19
Price History (C$) Target/Rating/Coverage Change
Fireweed Zinc Ltd. (FWZ-V) Date Target(C$) Rating7/15/19 $1.00 Buy
Initiated Coverage: 7/15/2019
0
0.2
0.4
0.6
0.8
1
1.2
1.4
1.6
1.8
2
Jun17
Sep17
Dec17
Mar18
Jun18
Sep18
Dec18
Mar19
Jun19
Sep19
Dec19
Price History (C$) Target/Rating/Coverage Change
Gold Road Resources Limited (GOR-A) Date Target(C$) Rating1/22/20 $0.85 Hold7/25/19 $0.85 Sell6/21/19 $0.75 Sell8/7/18 $0.75 Hold
10/17/17 $0.90 Buy
Initiated Coverage 9/13/2016; Transfer of Coverage 10/20/16
0
0.5
1
1.5
2
2.5
3
Jan17
Apr17
Jul17
Oct17
Jan18
Apr18
Jul18
Oct18
Jan19
Apr19
Jul19
Oct19
Price History (C$) Target/Rating/Coverage Change
Goldquest Mining Corp. (GQC-V) Date Target(C$) Rating1/25/19 $0.08 Sell3/29/18 $0.20 Hold
10/11/17 $0.60 Buy
Initiated Coverage: 10/11/2017
0
0.1
0.2
0.3
0.4
0.5
0.6
0.7
0.8
0.9
Jan17
Apr17
Jul17
Oct17
Jan18
Apr18
Jul18
Oct18
Jan19
Apr19
Jul19
Oct19
Price History (C$) Target/Rating/Coverage Change
Harte Gold Corp. (HRT-T) Date Target(C$) Rating11/19/19 $0.25 Hold11/4/19 $0.50 Buy5/8/19 $0.70 Buy
6/22/18 $0.80 Buy12/13/17 $0.90 Buy4/12/17 $1.00 Buy
Initiated Coverage: 4/12/2017
0
0.2
0.4
0.6
0.8
1
1.2
Jan17
Apr17
Jul17
Oct17
Jan18
Apr18
Jul18
Oct18
Jan19
Apr19
Jul19
Oct19
Price History (C$) Target/Rating/Coverage Change

Mick Carew, PhD, 604-697-6006, [email protected]
Emma Boggio, MSA, CPA, CA, 604-697-6166, [email protected]
The Weekly Dig
43
February 21, 2020
Hudbay Minerals Inc. (HBM-T) Date Target(C$) Rating11/13/19 $7.00 Buy
8/6/19 $8.00 Buy7/23/19 $9.00 Buy2/25/19 $11.00 Buy
12/20/18 $8.00 Buy8/1/18 $9.00 Buy
7/10/18 $11.50 Buy5/3/18 $12.50 Buy
1/12/18 $13.50 Buy10/19/17 $12.50 Buy
8/4/17 $12.00 Buy7/20/17 $11.00 Buy6/20/17 $9.00 Buy
Initiated Coverage: 12/19/13; Transferred Coverage 6/20/2017
0
2
4
6
8
10
12
14
Jan17
Apr17
Jul17
Oct17
Jan18
Apr18
Jul18
Oct18
Jan19
Apr19
Jul19
Oct19
Price History (C$) Target/Rating/Coverage Change
K92 Mining Inc. (KNT-V) Date Target(C$) Rating11/28/19 $4.75 Buy
Initiated Coverage: 11/28/2019
0
0.5
1
1.5
2
2.5
3
3.5
4
4.5
5
Jan17
Apr17
Jul17
Oct17
Jan18
Apr18
Jul18
Oct18
Jan19
Apr19
Jul19
Oct19
Price History (C$) Target/Rating/Coverage Change
Liberty Gold Corp. (LGD-T) Date Target(C$) Rating10/17/19 $1.60 Buy
Initiated Coverage 10/09/12; Transfer of Coverage 10/20/2016
0
0.2
0.4
0.6
0.8
1
1.2
1.4
1.6
1.8
Jan17
Apr17
Jul17
Oct17
Jan18
Apr18
Jul18
Oct18
Jan19
Apr19
Jul19
Oct19
Price History (C$) Target/Rating/Coverage Change
Lucara Diamond Corp. (LUC-T) Date Target(C$) Rating2/22/19 $2.10 Buy1/8/19 $2.60 Buy
11/3/17 $3.20 Buy1/25/17 $3.50 Buy
Initiated Coverage 04/28/15
0
0.5
1
1.5
2
2.5
3
3.5
4
4.5
5
Jan17
Apr17
Jul17
Oct17
Jan18
Apr18
Jul18
Oct18
Jan19
Apr19
Jul19
Oct19
Price History (C$) Target/Rating/Coverage Change
Lumina Gold Corp. (LUM-V) Date Target(C$) Rating7/3/18 $1.50 Buy
3/15/18 $1.20 Buy
Initiated Coverage: 03/15/2018
0
0.2
0.4
0.6
0.8
1
1.2
1.4
1.6
1.8
2
Jan17
Apr17
Jul17
Oct17
Jan18
Apr18
Jul18
Oct18
Jan19
Apr19
Jul19
Oct19
Price History (C$) Target/Rating/Coverage Change
Lundin Mining Corporation (LUN-T) Date Target(C$) Rating11/27/19 $9.50 Buy
9/9/19 $8.50 Buy7/26/19 $9.50 Buy4/29/19 $10.00 Buy2/19/19 $9.00 Buy
10/25/18 $8.00 Buy9/14/18 $9.00 Buy1/12/18 $9.50 Hold12/1/17 $9.00 Buy
10/19/17 $11.50 Buy7/27/17 $11.00 Buy6/20/17 $10.00 Buy
Transferred Coverage: 11/02/15; Transferred Coverage
6/20/2017
0
2
4
6
8
10
12
Jan17
Apr17
Jul17
Oct17
Jan18
Apr18
Jul18
Oct18
Jan19
Apr19
Jul19
Oct19
Price History (C$) Target/Rating/Coverage Change
Lundin Gold Inc. (LUG-T) Date Target(C$) Rating1/22/20 $10.00 Buy7/25/19 $9.25 Buy3/4/19 $7.50 Buy
10/17/17 $7.75 Buy1/25/17 $8.25 Buy
Initiated Coverage: 12/08/15
0
2
4
6
8
10
12
Jan17
Apr17
Jul17
Oct17
Jan18
Apr18
Jul18
Oct18
Jan19
Apr19
Jul19
Oct19
Price History (C$) Target/Rating/Coverage Change
Marathon Gold Corporation (MOZ-T) Date Target(C$) Rating1/21/20 $2.50 Buy5/15/19 $2.00 Buy2/22/19 $1.90 Buy1/11/18 $1.80 Buy2/27/17 $1.50 Buy
Initiated Coverage: 1/17/2017
0
0.5
1
1.5
2
2.5
3
Jan17
Apr17
Jul17
Oct17
Jan18
Apr18
Jul18
Oct18
Jan19
Apr19
Jul19
Oct19
Price History (C$) Target/Rating/Coverage Change

Mick Carew, PhD, 604-697-6006, [email protected]
Emma Boggio, MSA, CPA, CA, 604-697-6166, [email protected]
The Weekly Dig
44
February 21, 2020
Minera Alamos Inc. (MAI-V) Date Target(C$) Rating7/25/19 $0.50 Buy4/30/19 $0.40 Buy
Initiated Coverage: 4/30/2019
0
0.1
0.2
0.3
0.4
0.5
0.6
0.7
0.8
0.9
Jan17
Apr17
Jul17
Oct17
Jan18
Apr18
Jul18
Oct18
Jan19
Apr19
Jul19
Oct19
Price History (C$) Target/Rating/Coverage Change
Metalla Royalty & Streaming Ltd. (MTA-V) Date Target(C$) Rating1/27/20 $7.50 Hold1/22/20 $8.50 Hold
12/17/19 $8.00 Buy11/27/19 $2.00 Buy
Initiated Coverage: 11/27/2019; 1:4 Consolidation - Dec 17, 2019
0
1
2
3
4
5
6
7
8
9
Jan17
Apr17
Jul17
Oct17
Jan18
Apr18
Jul18
Oct18
Jan19
Apr19
Jul19
Oct19
Price History (C$) Target/Rating/Coverage Change
Midas Gold Corp. (MAX-T) Date Target(C$) Rating7/25/19 $1.80 Buy5/9/18 $1.90 Buy
7/20/17 $1.50 Buy1/25/17 $1.75 Buy
Transferred and Re-initiated Coverage 11/05/13
0
0.2
0.4
0.6
0.8
1
1.2
1.4
1.6
1.8
2
Jan17
Apr17
Jul17
Oct17
Jan18
Apr18
Jul18
Oct18
Jan19
Apr19
Jul19
Oct19
Price History (C$) Target/Rating/Coverage Change
Mountain Province Diamonds Inc. (MPVD-T) Date Target(C$) Rating10/21/19 $3.50 Buy
8/8/19 $3.80 Buy7/18/19 $4.30 Buy4/26/19 $4.80 Buy
11/27/18 $5.20 Buy11/13/18 $5.60 Buy4/26/17 $6.30 Buy3/30/17 $7.00 Buy
Initiated Coverage 02/05/15
0
1
2
3
4
5
6
7
8
Jan17
Apr17
Jul17
Oct17
Jan18
Apr18
Jul18
Oct18
Jan19
Apr19
Jul19
Oct19
Price History (C$) Target/Rating/Coverage Change
NexGen Energy Ltd. (NXE-T) Date Target(C$) Rating2/27/17 $6.00 Buy1/25/17 $4.50 Buy
Initiated Coverage 11/05/15
0
1
2
3
4
5
6
7
Jan17
Apr17
Jul17
Oct17
Jan18
Apr18
Jul18
Oct18
Jan19
Apr19
Jul19
Oct19
Price History (C$) Target/Rating/Coverage Change
Nevada Copper Corp. (NCU-T) Date Target(C$) Rating12/17/19 $0.60 Buy10/10/19 $0.50 Buy8/29/18 $0.90 Buy6/19/18 $1.00 Buy
Initiated Coverage: 6/19/2018
0
0.2
0.4
0.6
0.8
1
1.2
1.4
1.6
1.8
2
Jan17
Apr17
Jul17
Oct17
Jan18
Apr18
Jul18
Oct18
Jan19
Apr19
Jul19
Oct19
Price History (C$) Target/Rating/Coverage Change
Nighthawk Gold Corp. (NHK-T) Date Target(C$) Rating1/21/20 $4.50 Buy9/10/18 $0.90 Buy
10/20/17 $1.30 Buy
Initiated Coverage: 10/20/2017; January 2020 - 1:5 Share
Consolidation
0
1
2
3
4
5
6
Jan17
Apr17
Jul17
Oct17
Jan18
Apr18
Jul18
Oct18
Jan19
Apr19
Jul19
Oct19
Price History (C$) Target/Rating/Coverage Change
Osisko Metals Incorporated (OM-V) Date Target(C$) Rating4/25/19 $0.90 Buy
Initiated Coverage: 4/25/2019
0
0.2
0.4
0.6
0.8
1
1.2
1.4
Jan17
Apr17
Jul17
Oct17
Jan18
Apr18
Jul18
Oct18
Jan19
Apr19
Jul19
Oct19
Price History (C$) Target/Rating/Coverage Change

Mick Carew, PhD, 604-697-6006, [email protected]
Emma Boggio, MSA, CPA, CA, 604-697-6166, [email protected]
The Weekly Dig
45
February 21, 2020
Osisko Mining Inc. (OSK-T) Date Target(C$) Rating2/21/20 $5.50 Buy5/24/18 $4.50 Buy3/19/18 $6.00 Buy4/6/17 $6.50 Buy
3/17/17 $5.00 Buy
Initiated Coverage 12/10/2016; Transfer of Coverage
10/20/2016
0
1
2
3
4
5
6
7
Feb17
May17
Aug17
Nov17
Feb18
May18
Aug18
Nov18
Feb19
May19
Aug19
Nov19
Price History (C$) Target/Rating/Coverage Change
Osisko Gold Royalties Ltd (OR-T) Date Target(C$) Rating9/4/19 $19.50 Buy
7/25/19 $17.00 Buy10/2/18 $16.50 Buy2/21/18 $18.00 Buy
10/17/17 $19.00 Buy7/20/17 $19.50 Buy1/25/17 $18.25 Buy
Initiated Coverage 12/16/2015; Transfer of Coverage
10/20/2016
0
5
10
15
20
25
Jan17
Apr17
Jul17
Oct17
Jan18
Apr18
Jul18
Oct18
Jan19
Apr19
Jul19
Oct19
Price History (C$) Target/Rating/Coverage Change
OceanaGold Corporation (OGC-T) Date Target(C$) Rating2/11/20 $2.75 Hold1/22/20 $3.00 Hold
10/16/19 $3.50 Hold3/15/19 $4.00 Hold2/5/19 $4.00 Sell
10/17/17 $4.20 Hold7/20/17 $4.40 Hold6/28/17 $5.10 Buy
Initiated Coverage 09/22/14
0
1
2
3
4
5
6
Feb17
May17
Aug17
Nov17
Feb18
May18
Aug18
Nov18
Feb19
May19
Aug19
Nov19
Price History (C$) Target/Rating/Coverage Change
Plateau Energy Metals Inc. (PLU-V) Date Target(C$) Rating8/1/19 UR UR9/4/18 $3.00 Buy
Initiated Coverage: 9/4/2018
0
0.5
1
1.5
2
2.5
3
3.5
4
Jan17
Apr17
Jul17
Oct17
Jan18
Apr18
Jul18
Oct18
Jan19
Apr19
Jul19
Oct19
Price History (C$) Target/Rating/Coverage Change
Pure Gold Mining Inc. (PGM-V) Date Target(C$) Rating2/6/19 $1.30 Buy
6/28/17 $1.00 Buy
Initiated Coverage: 6/28/2017
0
0.2
0.4
0.6
0.8
1
1.2
1.4
Jan17
Apr17
Jul17
Oct17
Jan18
Apr18
Jul18
Oct18
Jan19
Apr19
Jul19
Oct19
Price History (C$) Target/Rating/Coverage Change
Roxgold Inc. (ROXG-T) Date Target(C$) Rating1/14/20 $1.70 Buy1/3/18 $1.90 Buy
11/1/17 $1.70 Buy7/20/17 $1.80 Buy1/25/17 $2.00 Buy
Initiated Coverage
0
0.5
1
1.5
2
2.5
Jan17
Apr17
Jul17
Oct17
Jan18
Apr18
Jul18
Oct18
Jan19
Apr19
Jul19
Oct19
Price History (C$) Target/Rating/Coverage Change
0
0.5
1
1.5
2
2.5
Jan17
Apr17
Jul17
Oct17
Jan18
Apr18
Jul18
Oct18
Jan19
Apr19
Jul19
Oct19
Price History (C$) Target/Rating/Coverage Change
RNC Minerals (RNX-T) Date Target(C$) Rating12/20/19 $0.70 Buy10/16/19 $0.60 Buy6/28/19 $0.80 Buy1/23/19 $0.75 Buy9/25/18 $0.75 Hold9/20/18 $0.50 Buy9/12/18 $0.40 Buy7/24/18 $0.15 Hold5/15/18 $0.25 Hold3/23/18 $0.30 Hold9/25/17 $0.25 Hold
Initiated Coverage: 07/05/11; Name Change to RNC Minerals
9/13/2016; Transferred Coverage 9/26/2017
0
0.1
0.2
0.3
0.4
0.5
0.6
0.7
0.8
0.9
1
Jan17
Apr17
Jul17
Oct17
Jan18
Apr18
Jul18
Oct18
Jan19
Apr19
Jul19
Oct19
Price History (C$) Target/Rating/Coverage Change
Sabina Gold & Silver Corp. (SBB-T) Date Target(C$) Rating7/25/19 $2.00 Hold4/19/18 $2.35 Hold
12/20/17 $2.60 Hold10/19/17 $2.50 Hold10/17/17 $2.70 Buy
9/5/17 $2.75 Buy7/19/17 $2.50 Buy1/25/17 $1.70 Buy
Initiated Coverage 12-15-15
0
0.5
1
1.5
2
2.5
3
Jan17
Apr17
Jul17
Oct17
Jan18
Apr18
Jul18
Oct18
Jan19
Apr19
Jul19
Oct19
Price History (C$) Target/Rating/Coverage Change

Mick Carew, PhD, 604-697-6006, [email protected]
Emma Boggio, MSA, CPA, CA, 604-697-6166, [email protected]
The Weekly Dig
46
February 21, 2020
SEMAFO Inc. (SMF-T) Date Target(C$) Rating1/22/20 $2.75 Hold
11/13/19 $3.50 Sell7/25/19 $8.50 Buy10/2/18 $6.00 Buy2/20/18 $5.50 Buy4/25/17 $4.50 Buy3/9/17 $5.50 Buy
1/25/17 $7.00 Buy
Initiated Coverage 11/20/09
0
1
2
3
4
5
6
7
8
9
Jan17
Apr17
Jul17
Oct17
Jan18
Apr18
Jul18
Oct18
Jan19
Apr19
Jul19
Oct19
Price History (C$) Target/Rating/Coverage Change
0
1
2
3
4
5
6
7
8
9
Jan17
Apr17
Jul17
Oct17
Jan18
Apr18
Jul18
Oct18
Jan19
Apr19
Jul19
Oct19
Price History (C$) Target/Rating/Coverage Change
Steppe Gold Ltd. (STGO-T) Date Target(C$) Rating9/5/18 $1.75 Buy
Initiated Coverage: 9/5/2018
0
0.5
1
1.5
2
2.5
3
May18
Jul18
Sep18
Nov18
Jan19
Mar19
May19
Jul19
Sep19
Nov19
Price History (C$) Target/Rating/Coverage Change
Superior Gold Inc. (SGI-V) Date Target(C$) Rating1/16/20 $1.15 Buy
11/20/19 $1.00 Buy10/28/19 $1.15 Buy5/15/19 $1.25 Buy
11/13/18 $1.50 Buy4/3/18 $2.00 Buy
12/12/17 $1.50 Buy
Initiated Coverage: 12/12/2017
0
0.2
0.4
0.6
0.8
1
1.2
1.4
1.6
1.8
2
Feb17
May17
Aug17
Nov17
Feb18
May18
Aug18
Nov18
Feb19
May19
Aug19
Nov19
Price History (C$) Target/Rating/Coverage Change
Treasury Metals Inc. (TML-T) Date Target(C$) Rating6/17/19 $1.00 Buy10/2/18 $1.10 Buy7/20/17 $1.20 Buy2/23/17 $1.10 Buy
Initiated Coverage: 6/23/2017
0
0.2
0.4
0.6
0.8
1
1.2
1.4
Jan17
Apr17
Jul17
Oct17
Jan18
Apr18
Jul18
Oct18
Jan19
Apr19
Jul19
Oct19
Price History (C$) Target/Rating/Coverage Change
Trevali Mining Corporation (TV-T) Date Target(C$) Rating7/23/19 $0.35 Hold1/21/19 $0.80 Buy11/9/18 $1.00 Buy
10/23/18 $1.50 Buy7/10/18 $1.75 Buy
10/19/17 $2.30 Buy7/20/17 $2.00 Buy6/20/17 $1.75 Buy
Initiated Coverage: 02/11/13; Transferred Coverage 6/20/2017
0
0.5
1
1.5
2
2.5
Jan17
Apr17
Jul17
Oct17
Jan18
Apr18
Jul18
Oct18
Jan19
Apr19
Jul19
Oct19
Price History (C$) Target/Rating/Coverage Change
Troilus Gold Corp. (TLG-T) Date Target(C$) Rating11/1/18 $2.00 Buy9/13/18 $2.50 Buy2/20/18 $3.25 Buy
Initiated Coverage: 2/20/2018
0
0.5
1
1.5
2
2.5
3
3.5
4
4.5
5
Jan18
Mar18
May18
Jul18
Sep18
Nov18
Jan19
Mar19
May19
Jul19
Sep19
Nov19
Jan20
Price History (C$) Target/Rating/Coverage Change
Uranium Participation Corporation (U-T) Date Target(C$) Rating10/12/18 $5.90 Buy1/25/17 $5.10 Buy
Transferred & Re-initiated Coverage 08/20/12
0
1
2
3
4
5
6
7
Jan17
Apr17
Jul17
Oct17
Jan18
Apr18
Jul18
Oct18
Jan19
Apr19
Jul19
Oct19
Price History (C$) Target/Rating/Coverage Change
Uranium Energy Corp. (UEC-AMEX) Date Target(US$) Rating1/29/20 $2.60 Buy5/11/17 $2.90 Buy2/3/17 $2.40 Buy
Transferred & Re-initiated Coverage 08/20/12
0
0.5
1
1.5
2
2.5
3
3.5
Jan17
Apr17
Jul17
Oct17
Jan18
Apr18
Jul18
Oct18
Jan19
Apr19
Jul19
Oct19
Price History (US$) Target/Rating/Coverage Change

Mick Carew, PhD, 604-697-6006, [email protected]
Emma Boggio, MSA, CPA, CA, 604-697-6166, [email protected]
The Weekly Dig
47
February 21, 2020
B: Buy; H: Hold; S: Sell; T: Tender; UR: Under Review
Source: Capital IQ and Haywood Securities
Xanadu Mines Limited (XAM-V) Date Target(C$) Rating7/5/19 $0.10 Buy
2/13/19 $0.30 Buy
Initiated Coverage: 2/13/2019
0
0.1
0.2
0.3
0.4
0.5
0.6
0.7
0.8
0.9
Jan17
Apr17
Jul17
Oct17
Jan18
Apr18
Jul18
Oct18
Jan19
Apr19
Jul19
Oct19
Jan20
Price History (C$) Target/Rating/Coverage Change