Embed Size (px)
Citation preview
August, 2010August, 2010 EQUAL Health NetworkEQUAL Health Network 1111
The Truth About Health Reform:The Truth About Health Reform:
Crisis in U.S. Health Care Crisis in U.S. Health Care System: Access, Cost, QualitySystem: Access, Cost, Quality
Ellen R. Shaffer PhD MPHEllen R. Shaffer PhD MPHJoe Brenner MAJoe Brenner MA
EQUAL Health NetworkEQUAL Health Networkwww.equalhealth.infowww.equalhealth.info
415-922-6204 415-922-6204 [email protected]
August, 2010August, 2010
August, 2010August, 2010 EQUAL Health NetworkEQUAL Health Network 2222
What Is EQUAL?What Is EQUAL?
August, 2010August, 2010 EQUAL Health NetworkEQUAL Health Network 33
About This Series
Many in the EQUAL Health Network are helping to spread the word: The Truth About Health Reform.The Series offers several Power Point slides from which presenters can choose.This presentations provides timely, reliable information on problems with access, cost and quality of the U.S. health care systemIf you use these slides please credit the EQUAL Health Network.Our work depends on your support. Donate online at www.equalhealth.info. Thanks!
August, 2010August, 2010 EQUAL Health NetworkEQUAL Health Network 4444
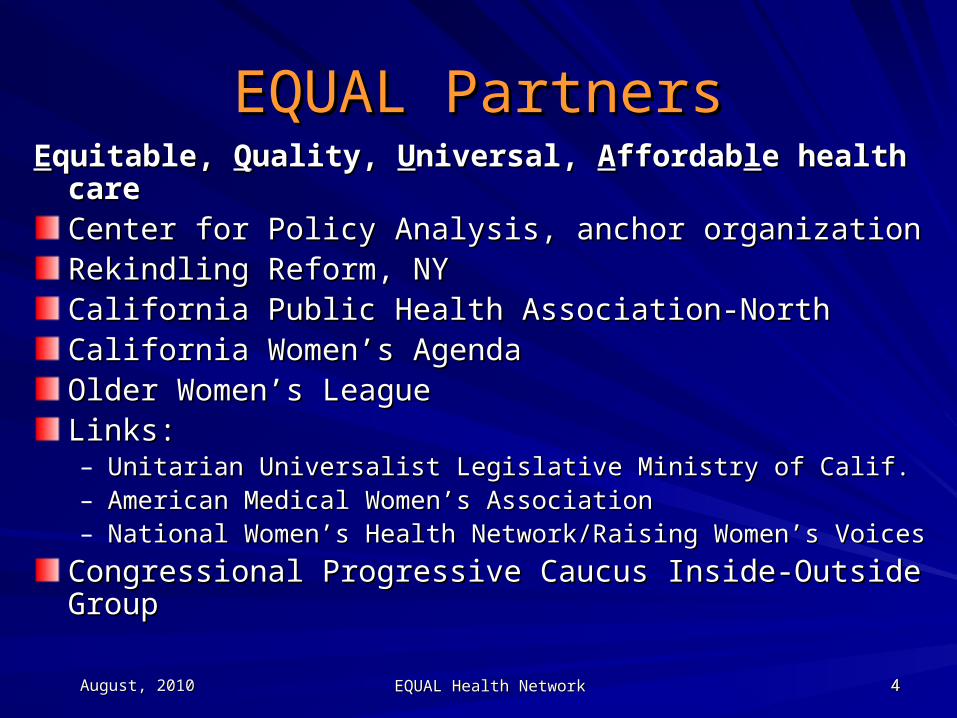
EQUAL PartnersEQUAL PartnersEEquitable, quitable, QQuality, uality, UUniversal, niversal, AAffordabffordablle health caree health care
Center for Policy Analysis, anchor organizationCenter for Policy Analysis, anchor organizationRekindling Reform, NYRekindling Reform, NYCalifornia Public Health Association-NorthCalifornia Public Health Association-NorthCalifornia Women’s AgendaCalifornia Women’s AgendaOlder Women’s LeagueOlder Women’s LeagueLinks:Links:– Unitarian Universalist Legislative Ministry of Calif.Unitarian Universalist Legislative Ministry of Calif.– American Medical Women’s AssociationAmerican Medical Women’s Association– National Women’s Health Network/Raising Women’s VoicesNational Women’s Health Network/Raising Women’s Voices
Congressional Progressive Caucus Inside-Outside GroupCongressional Progressive Caucus Inside-Outside Group
August, 2010August, 2010 EQUAL Health NetworkEQUAL Health Network 5555
The Truth About Health ReformThe Truth About Health ReformCrisis in Access, Cost, QualityCrisis in Access, Cost, Quality
August, 2010August, 2010 EQUAL Health NetworkEQUAL Health Network 6666
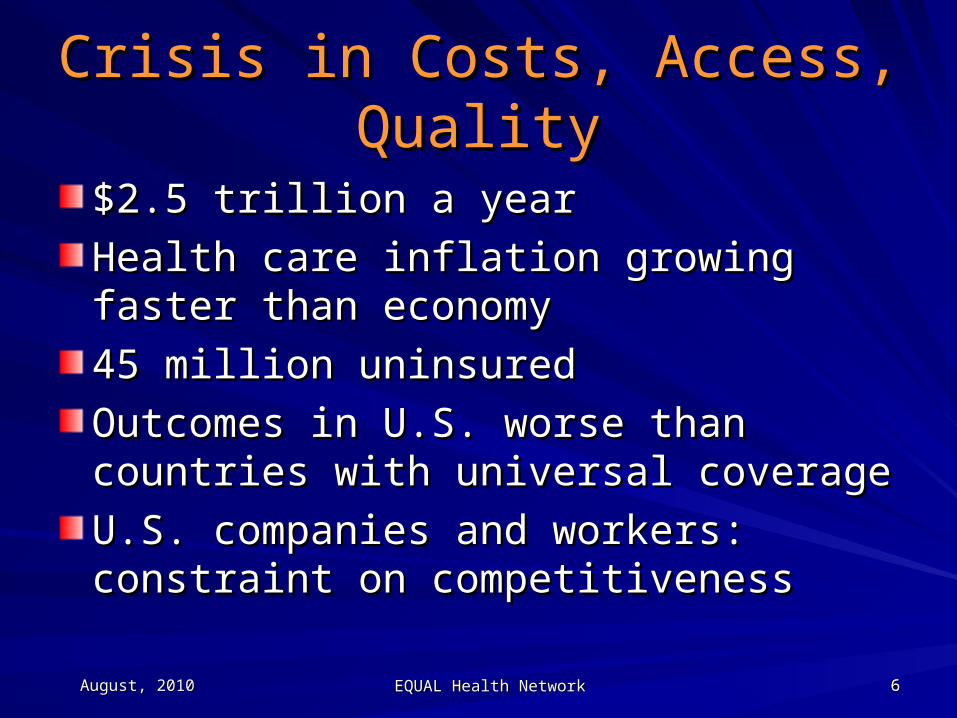
Crisis in Costs, Access, QualityCrisis in Costs, Access, Quality
$2.5 trillion a year$2.5 trillion a year
Health care inflation growing faster than Health care inflation growing faster than economyeconomy
45 million uninsured45 million uninsured
Outcomes in U.S. worse than countries Outcomes in U.S. worse than countries with universal coveragewith universal coverage
U.S. companies and workers: constraint U.S. companies and workers: constraint on competitivenesson competitiveness
August, 2010August, 2010 EQUAL Health NetworkEQUAL Health Network 7777
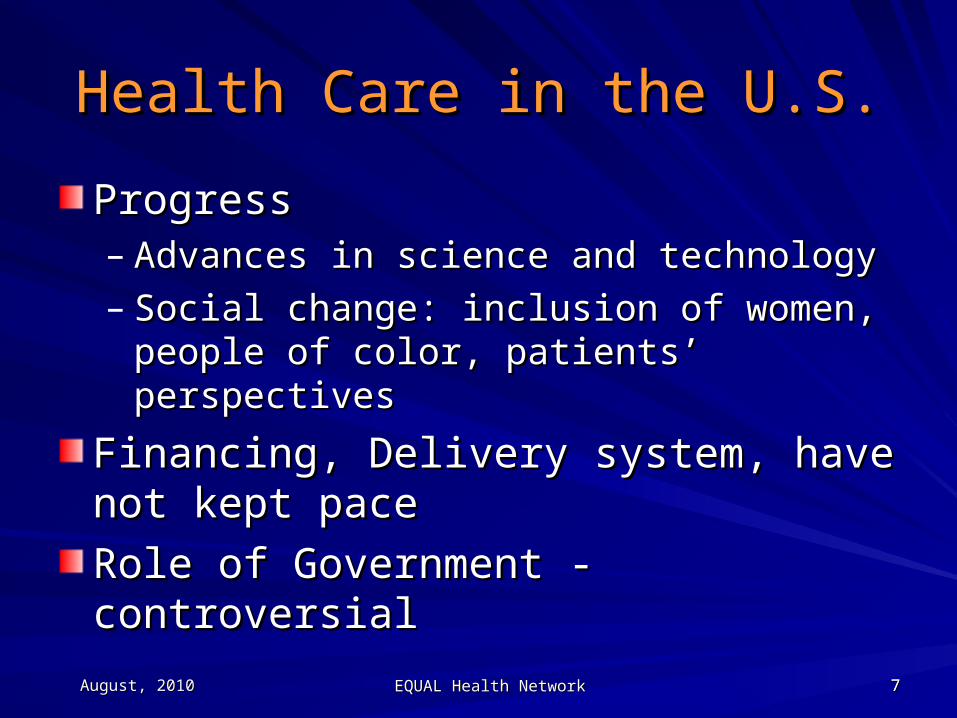
Health Care in the U.S.Health Care in the U.S.
Progress Progress – Advances in science and technologyAdvances in science and technology– Social change: inclusion of women, people of Social change: inclusion of women, people of
color, patients’ perspectivescolor, patients’ perspectives
Financing, Delivery system, have not kept Financing, Delivery system, have not kept pacepace
Role of Government - controversial Role of Government - controversial
August, 2010August, 2010 EQUAL Health NetworkEQUAL Health Network 8888
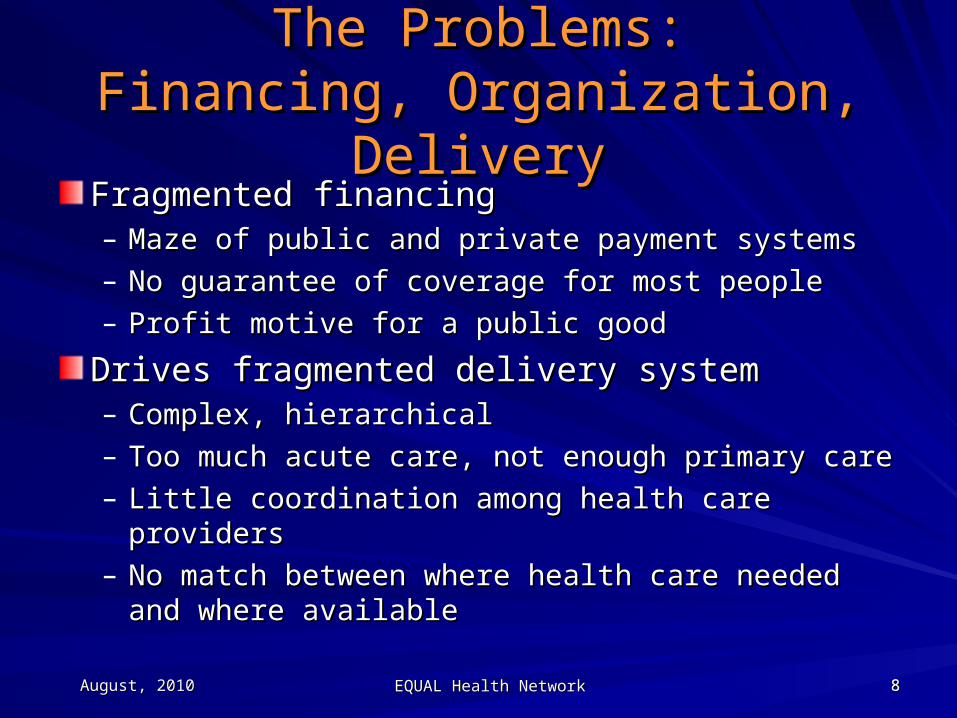
The Problems:The Problems:Financing, Organization, DeliveryFinancing, Organization, DeliveryFragmented financing Fragmented financing – Maze of public and private payment systemsMaze of public and private payment systems– No guarantee of coverage for most peopleNo guarantee of coverage for most people– Profit motive for a public goodProfit motive for a public good
Drives fragmented delivery systemDrives fragmented delivery system– Complex, hierarchicalComplex, hierarchical– Too much acute care, not enough primary careToo much acute care, not enough primary care– Little coordination among health care providers Little coordination among health care providers – No match between where health care needed and No match between where health care needed and
where available where available
August, 2010August, 2010 EQUAL Health NetworkEQUAL Health Network 9999
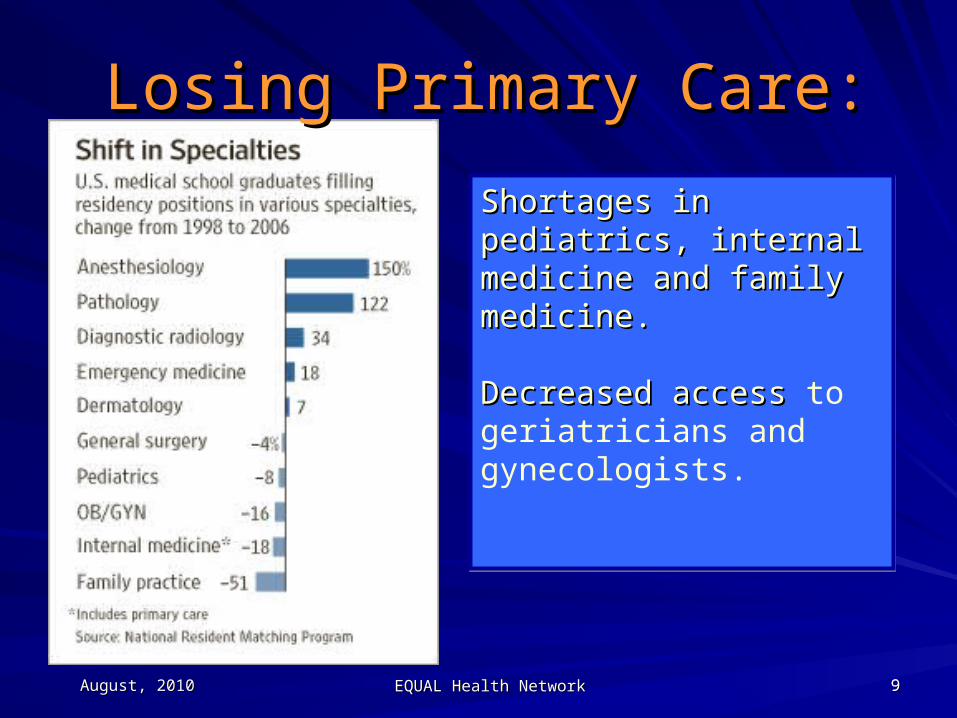
Losing Primary Care:Losing Primary Care:
Shortages in Shortages in pediatrics, internal medicine pediatrics, internal medicine and family medicine.and family medicine.
Decreased access Decreased access to geriatricians and gynecologists.
Shortages in Shortages in pediatrics, internal medicine pediatrics, internal medicine and family medicine.and family medicine.
Decreased access Decreased access to geriatricians and gynecologists.
August, 2010August, 2010 EQUAL Health NetworkEQUAL Health Network 10101010
Focus on Health Care vs. HealthFocus on Health Care vs. Health
Money is concentrated on health care vs. public Money is concentrated on health care vs. public healthhealth
Improvements in health, increased life span in Improvements in health, increased life span in 2020thth Century, related to Century, related to – Environment – clean air, water, housingEnvironment – clean air, water, housing– Social and economic equalitySocial and economic equality– EducationEducation– Economic wellbeingEconomic wellbeing– Democratic participation, control over life Democratic participation, control over life
circumstancescircumstances
August, 2010August, 2010 EQUAL Health NetworkEQUAL Health Network 11111111
Structural Obstacles to HealthStructural Obstacles to HealthSocial and economic inequalities undermine Social and economic inequalities undermine individual/community healthindividual/community health Economic policiesEconomic policies– Low income, unstable economy, multiple Low income, unstable economy, multiple
jobs/unemploymentjobs/unemployment– Suburban sprawl and design discourage exerciseSuburban sprawl and design discourage exercise– Food & agriculture policies encourage poor dietsFood & agriculture policies encourage poor diets– Reduced social spending, educationReduced social spending, education– Reduced democratic participation, communityReduced democratic participation, community
Health ConsequencesHealth Consequences– Stress, incidence and poor management of chronic Stress, incidence and poor management of chronic
diseases, tobacco use, violencediseases, tobacco use, violence
August, 2010August, 2010 EQUAL Health NetworkEQUAL Health Network 12121212
Private Vs. Social InsurancePrivate Vs. Social Insurance
We have to cover everyone to save We have to cover everyone to save money.money.
Private insurance has failed as a Private insurance has failed as a mechanism to assure coverage for health mechanism to assure coverage for health care or to control costs.care or to control costs.
Social insurance programs through the Social insurance programs through the government are much more successful.government are much more successful.
August, 2010August, 2010 EQUAL Health NetworkEQUAL Health Network 13131313
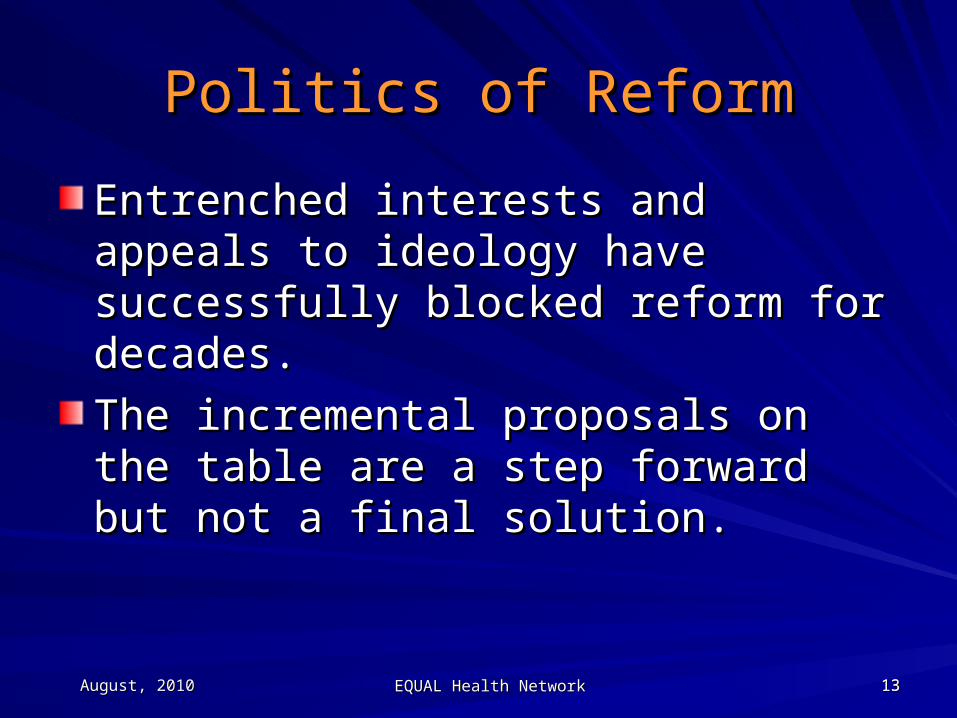
Politics of ReformPolitics of Reform
Entrenched interests and appeals to Entrenched interests and appeals to ideology have successfully blocked reform ideology have successfully blocked reform for decades.for decades.
The incremental proposals on the table The incremental proposals on the table are a step forward but not a final solution.are a step forward but not a final solution.
August, 2010August, 2010 EQUAL Health NetworkEQUAL Health Network 14141414
Health Care Costs Too MuchHealth Care Costs Too Much
August, 2010August, 2010 EQUAL Health NetworkEQUAL Health Network 15151515
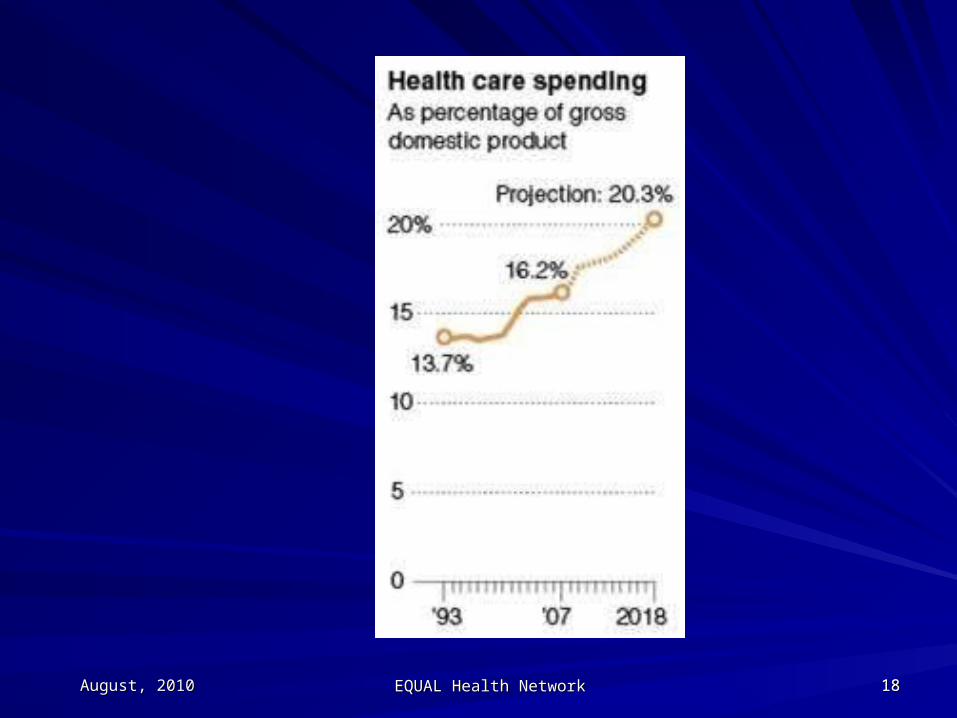
Health Care is Big BusinessHealth Care is Big Business$2.5 Trillion A Year$2.5 Trillion A Year
August, 2010 EQUAL Health Network 1616
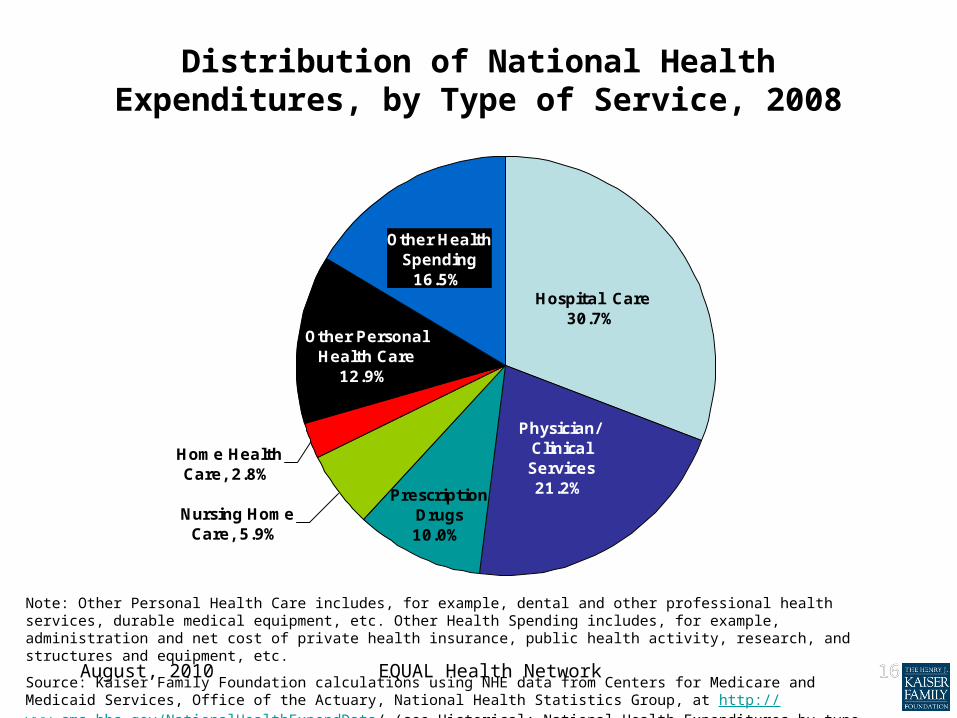
Distribution of National Health Expenditures, by Type of Service, 2008
Note: Other Personal Health Care includes, for example, dental and other professional health services, durable medical equipment, etc. Other Health Spending includes, for example, administration and net cost of private health insurance, public health activity, research, and structures and equipment, etc.
Source: Kaiser Family Foundation calculations using NHE data from Centers for Medicare and Medicaid Services, Office of the Actuary, National Health Statistics Group, at http://www.cms.hhs.gov/NationalHealthExpendData/ (see Historical; National Health Expenditures by type of service and source of funds, CY 1960-2008; file nhe2008.zip).
Physician/ Clinical Services 21.2%
Hospital Care 30.7%
Other Personal Health Care
12.9%
Nursing Home Care, 5.9%
Prescription Drugs10.0%
Home Health Care, 2.8%
Other Health Spending 16.5%
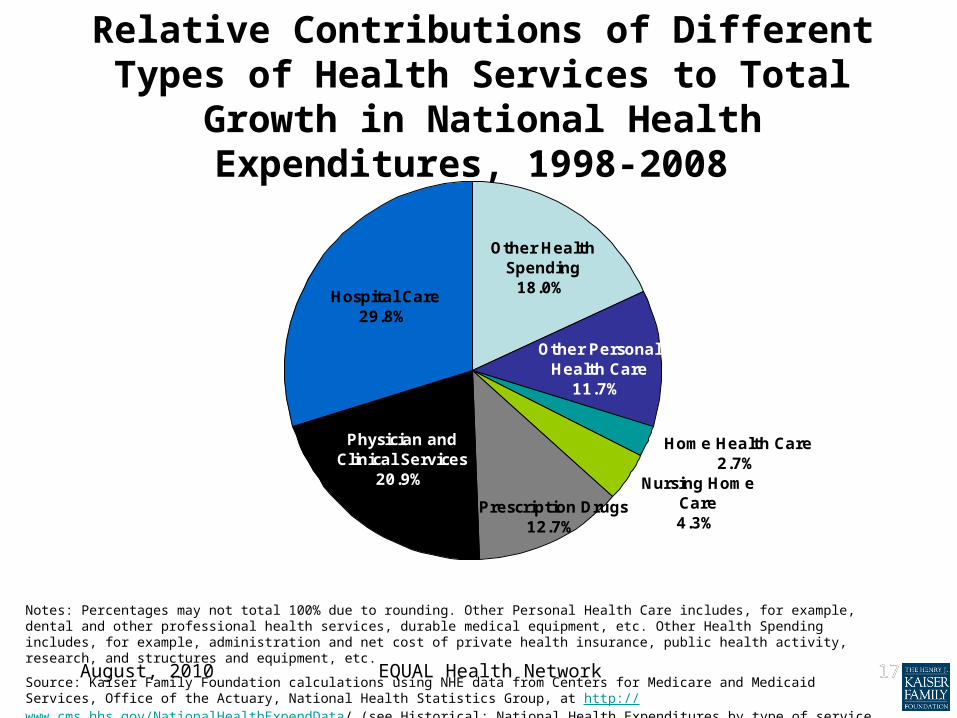
August, 2010 EQUAL Health Network 1717
Relative Contributions of Different Types of Health Services to Total
Growth in National Health Expenditures, 1998-2008
Nursing Home Care4.3%
Home Health Care2.7%
Other Personal Health Care
11.7%
Hospital Care29.8%
Prescription Drugs12.7%
Physician and Clinical Services
20.9%
Other Health Spending18.0%
Notes: Percentages may not total 100% due to rounding. Other Personal Health Care includes, for example, dental and other professional health services, durable medical equipment, etc. Other Health Spending includes, for example, administration and net cost of private health insurance, public health activity, research, and structures and equipment, etc.
Source: Kaiser Family Foundation calculations using NHE data from Centers for Medicare and Medicaid Services, Office of the Actuary, National Health Statistics Group, at http://www.cms.hhs.gov/NationalHealthExpendData/ (see Historical; National Health Expenditures by type of service and source of funds, CY 1960-2008; file nhe2008.zip).
August, 2010August, 2010 EQUAL Health NetworkEQUAL Health Network 18181818
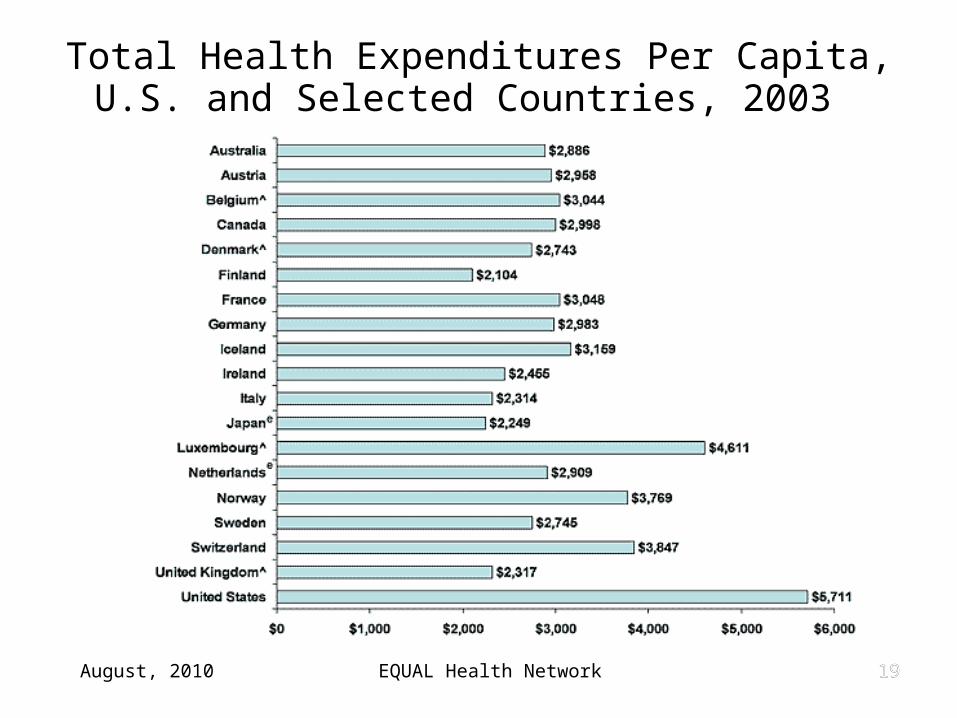
August, 2010 EQUAL Health Network 1919
Total Health Expenditures Per Capita, U.S. and Selected Countries, 2003
August, 2010 EQUAL Health Network 20
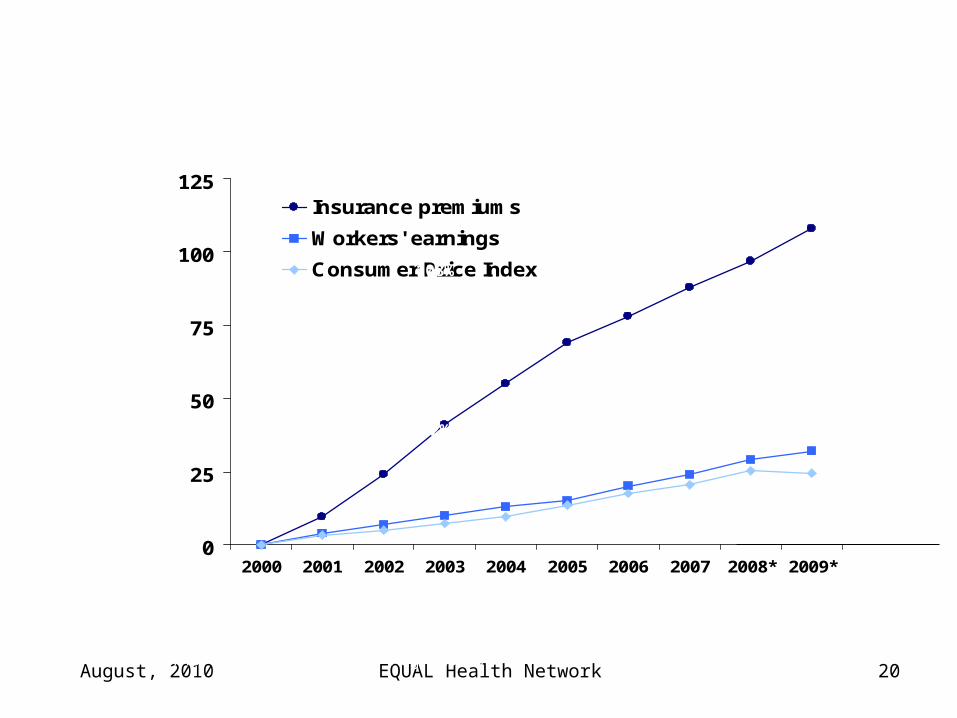
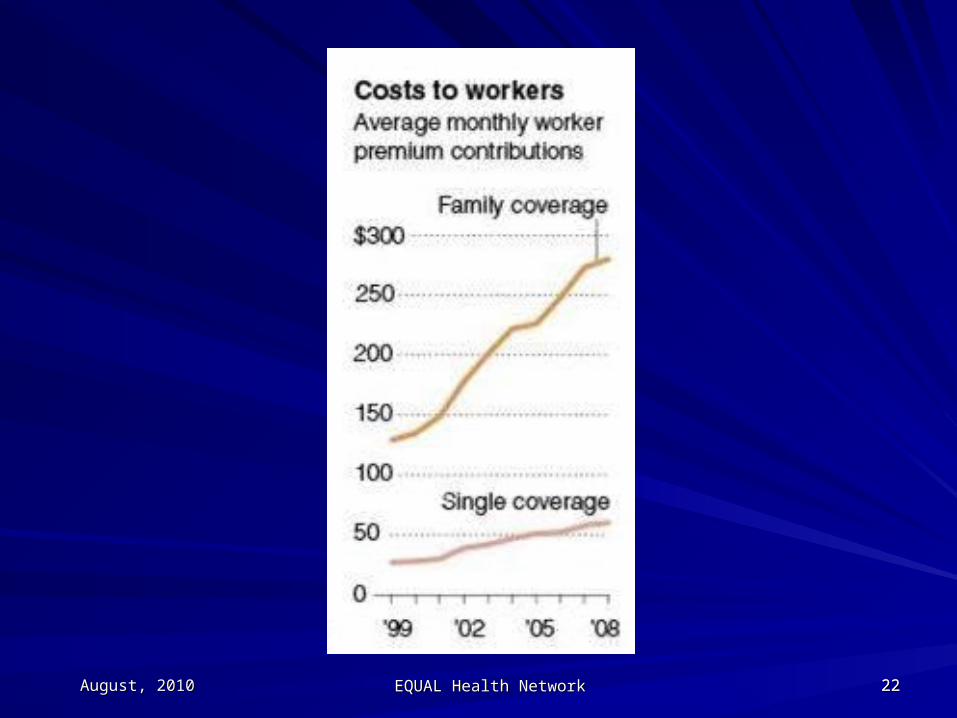
* 2008 and 2009 NHE projections. .Source: K. Davis, Why Health Reform Must Counter the Rising Costs of Health Insurance Premiums, (New York: The Commonwealth Fund, Aug. 2009).
0
25
50
75
100
125
2000 2001 2002 2003 2004 2005 2006 2007 2008* 2009*
Insurance premiums
Workers' earnings
Consumer Price Index
Insurance Premiums Rising Faster Than Workers’ Earnings 2000–2009
Percent
108%
32%
24%
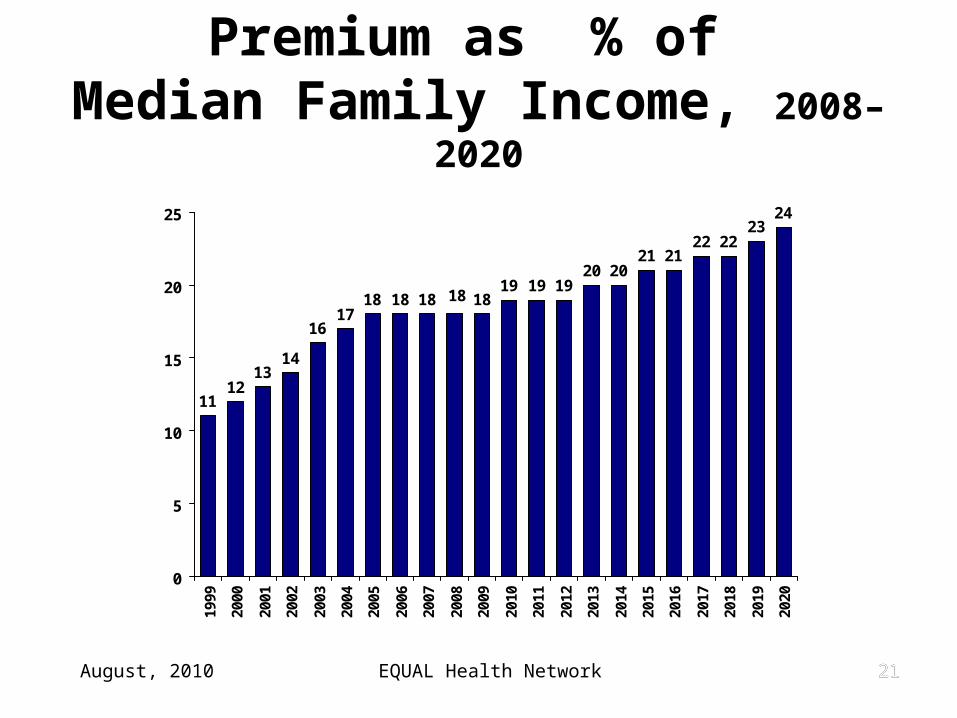
August, 2010 EQUAL Health Network 2121
Premium as % of Median Family Income, 2008–2020
1112
1314
1617
18 18 18 1819 19 19
20 2021 21
22 2223
24
18
0
5
10
15
20
2519
99
2000
2001
2002
2003
2004
2005
2006
2007
2008
2009
2010
2011
2012
2013
2014
2015
2016
2017
2018
2019
2020
Percent
Projected
August, 2010August, 2010 EQUAL Health NetworkEQUAL Health Network 22222222
August, 2010 EQUAL Health Network 2323
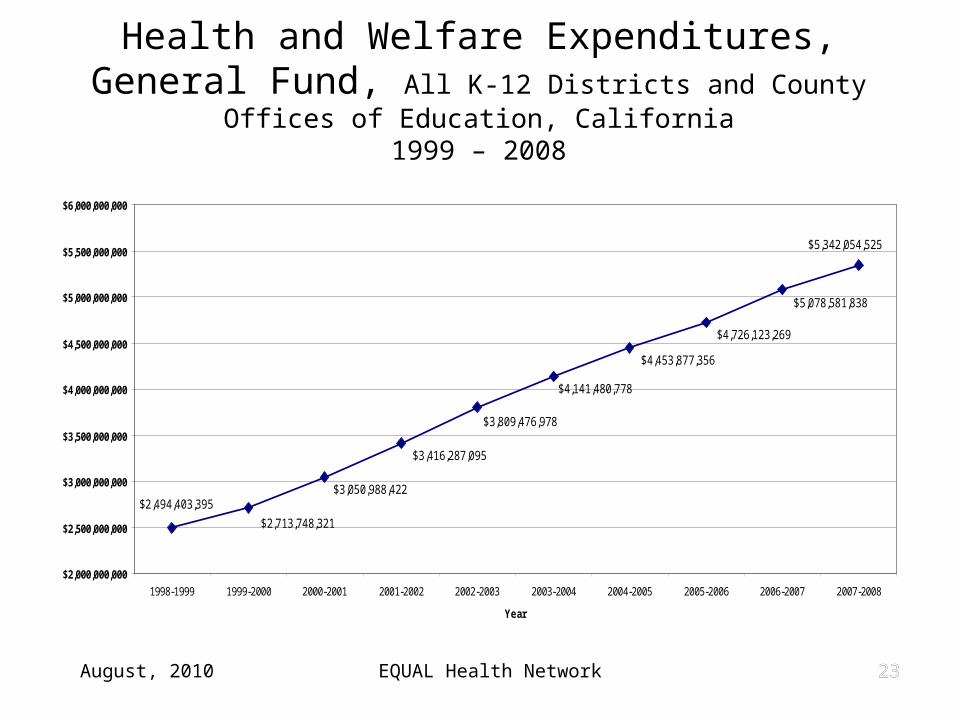
Health and Welfare Expenditures, General Fund, All K-12 Districts and County Offices of Education, California
1999 – 2008
$4,141,480,778
$4,453,877,356
$4,726,123,269
$5,078,581,838
$5,342,054,525
$3,809,476,978
$3,416,287,095
$3,050,988,422
$2,713,748,321
$2,494,403,395
$2,000,000,000
$2,500,000,000
$3,000,000,000
$3,500,000,000
$4,000,000,000
$4,500,000,000
$5,000,000,000
$5,500,000,000
$6,000,000,000
1998-1999 1999-2000 2000-2001 2001-2002 2002-2003 2003-2004 2004-2005 2005-2006 2006-2007 2007-2008
Year
August, 2010 EQUAL Health Network 2424
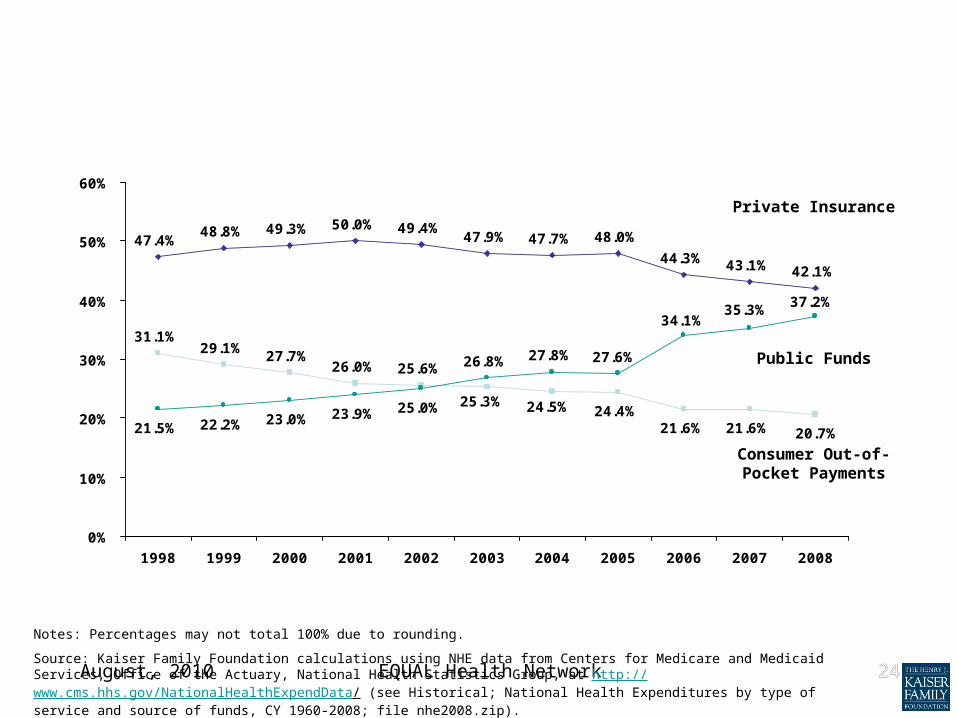
31.1%27.7%
26.0% 25.6%
48.8% 49.3% 50.0% 49.4%47.9% 47.7% 48.0%
44.3% 43.1% 42.1%
21.5% 22.2% 23.0% 23.9% 25.0% 25.3% 24.5%
21.6%24.4%
20.7%21.6%
29.1%
47.4%
26.8% 27.8%
34.1%
27.6%
37.2%35.3%
0%
10%
20%
30%
40%
50%
60%
1998 1999 2000 2001 2002 2003 2004 2005 2006 2007 2008
Notes: Percentages may not total 100% due to rounding.
Source: Kaiser Family Foundation calculations using NHE data from Centers for Medicare and Medicaid Services, Office of the Actuary, National Health Statistics Group, at http://www.cms.hhs.gov/NationalHealthExpendData/ (see Historical; National Health Expenditures by type of service and source of funds, CY 1960-2008; file nhe2008.zip).
Distribution of National Prescription Drug Expenditures by Source of Payment, 1998-2008
Private Insurance
Consumer Out-of-Pocket Payments
Public Funds
August, 2010 EQUAL Health Network 2525
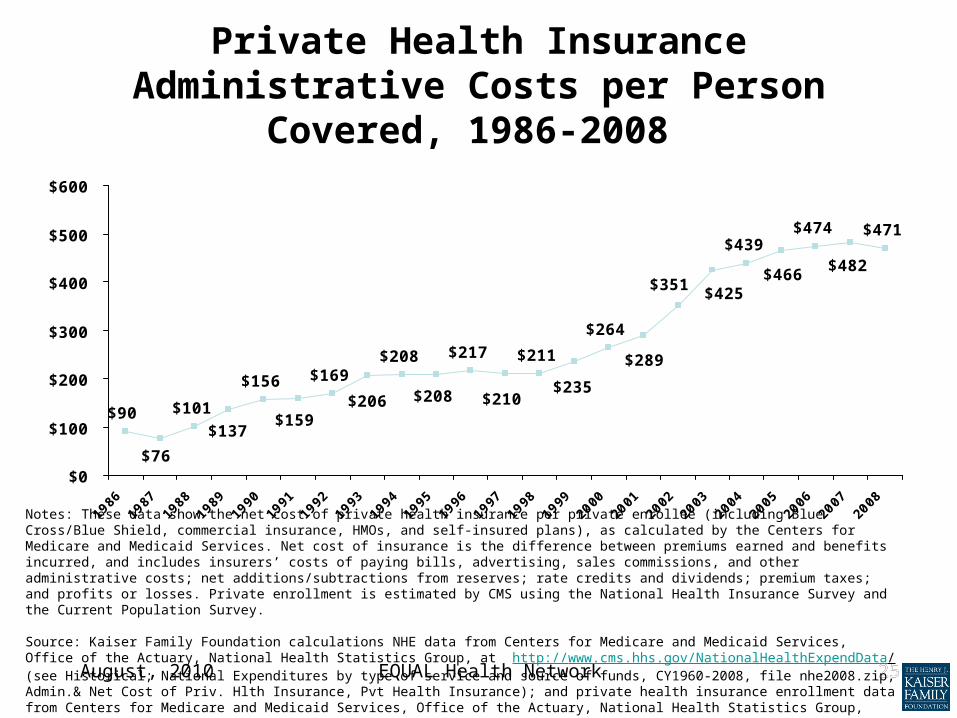
Private Health Insurance Administrative Costs per Person
Covered, 1986-2008
$90 $101
$156 $169$208 $217 $211
$264
$439$474 $471
$482$351
$466$425
$289
$235$210$208$206
$159$137
$76$0
$100
$200
$300
$400
$500
$600
1986
1987
1988
1989
1990
1991
1992
1993
1994
1995
1996
1997
1998
1999
2000
2001
2002
2003
2004
2005
2006
2007
2008
Notes: These data show the net cost of private health insurance per private enrollee (including Blue Cross/Blue Shield, commercial insurance, HMOs, and self-insured plans), as calculated by the Centers for Medicare and Medicaid Services. Net cost of insurance is the difference between premiums earned and benefits incurred, and includes insurers’ costs of paying bills, advertising, sales commissions, and other administrative costs; net additions/subtractions from reserves; rate credits and dividends; premium taxes; and profits or losses. Private enrollment is estimated by CMS using the National Health Insurance Survey and the Current Population Survey.
Source: Kaiser Family Foundation calculations NHE data from Centers for Medicare and Medicaid Services, Office of the Actuary, National Health Statistics Group, at http://www.cms.hhs.gov/NationalHealthExpendData/ (see Historical; National Expenditures by type of service and source of funds, CY1960-2008, file nhe2008.zip, Admin.& Net Cost of Priv. Hlth Insurance, Pvt Health Insurance); and private health insurance enrollment data from Centers for Medicare and Medicaid Services, Office of the Actuary, National Health Statistics Group, Table 4 at http://www.cms.hhs.gov/NationalHealthExpendData/downloads/bhg08.pdf.
August, 2010August, 2010 EQUAL Health NetworkEQUAL Health Network 26262626
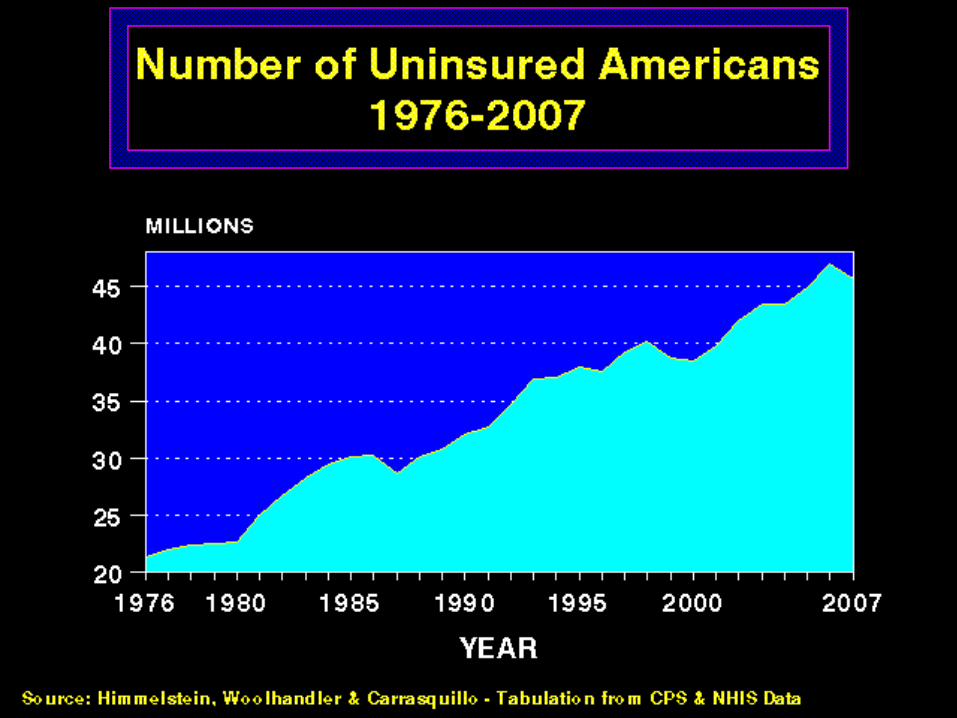
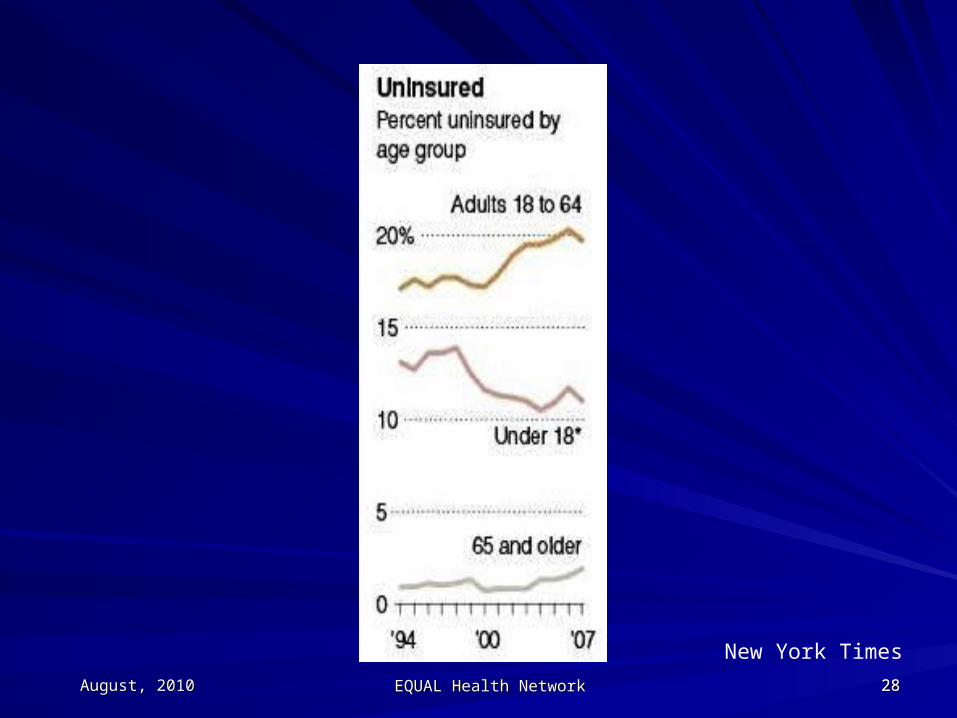
Number of Uninsured GrowingNumber of Uninsured Growing
August, 2010 EQUAL Health Network 2727
August, 2010August, 2010 EQUAL Health NetworkEQUAL Health Network 28282828
New York Times
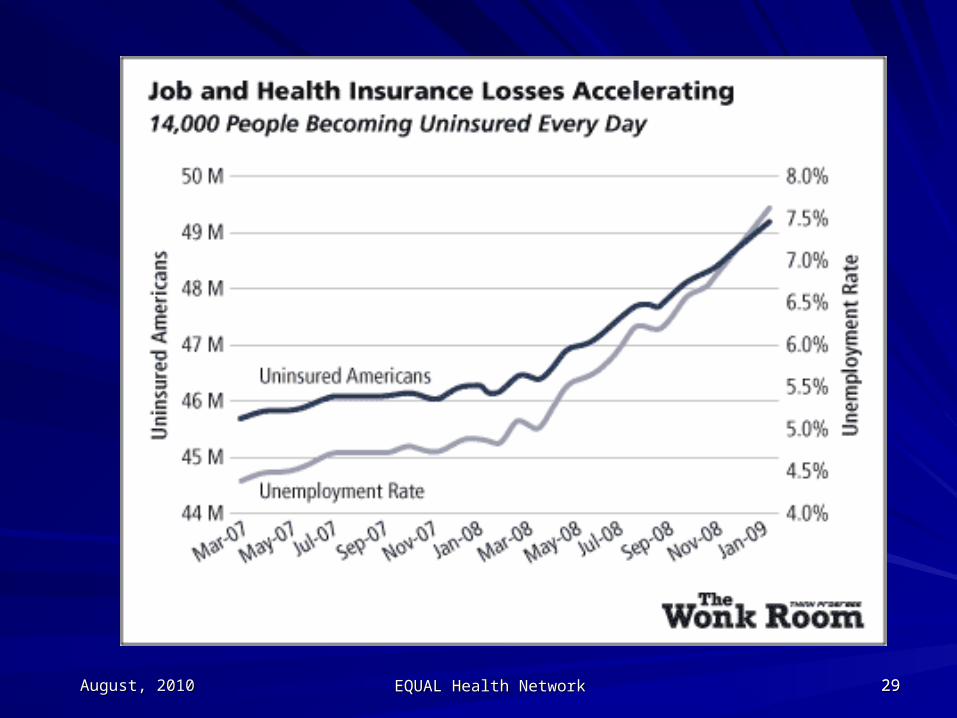
August, 2010August, 2010 EQUAL Health NetworkEQUAL Health Network 29292929
August, 2010August, 2010 EQUAL Health NetworkEQUAL Health Network 30303030
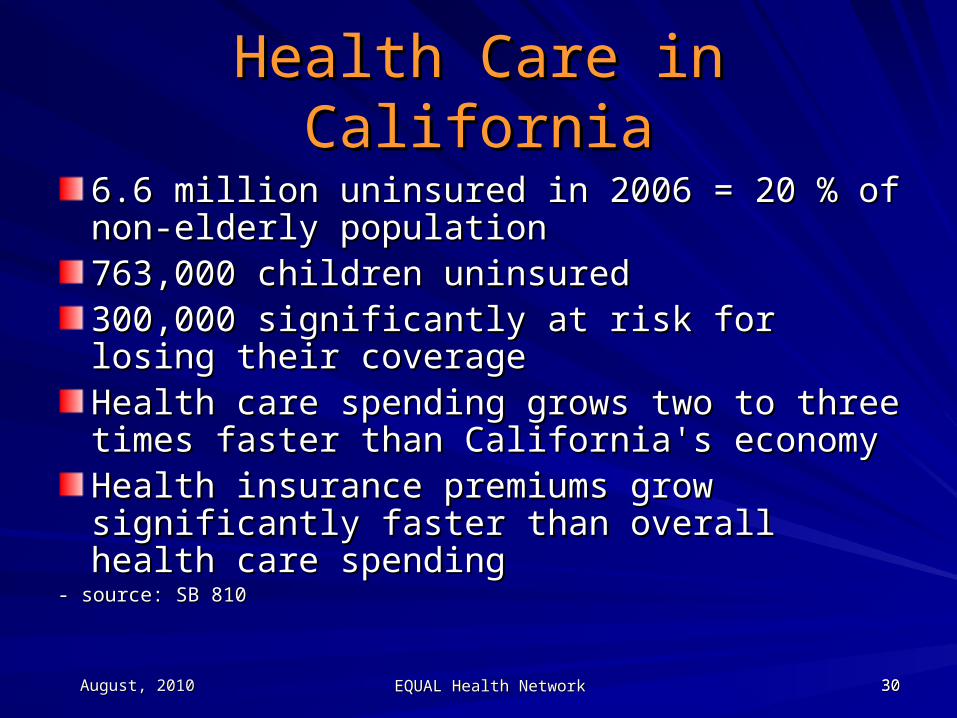
Health Care in CaliforniaHealth Care in California
6.6 million uninsured in 2006 = 20 % of non-6.6 million uninsured in 2006 = 20 % of non-elderly population elderly population 763,000 children uninsured763,000 children uninsured300,000 significantly at risk for losing their 300,000 significantly at risk for losing their coveragecoverageHealth care spending grows two to three times Health care spending grows two to three times faster than California's economyfaster than California's economyHealth insurance premiums grow significantly Health insurance premiums grow significantly faster than overall health care spendingfaster than overall health care spending
- source: SB 810 - source: SB 810
August, 2010August, 2010 EQUAL Health NetworkEQUAL Health Network 31313131
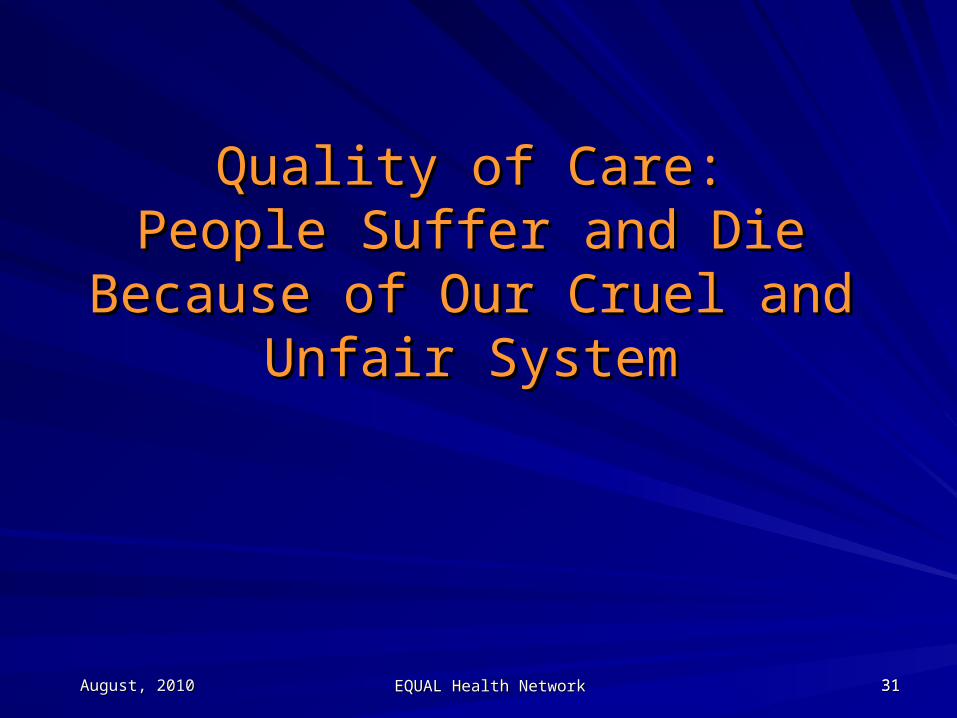
Quality of Care:Quality of Care:People Suffer and Die Because of People Suffer and Die Because of
Our Cruel and Unfair SystemOur Cruel and Unfair System
August, 2010August, 2010 EQUAL Health NetworkEQUAL Health Network 32323232
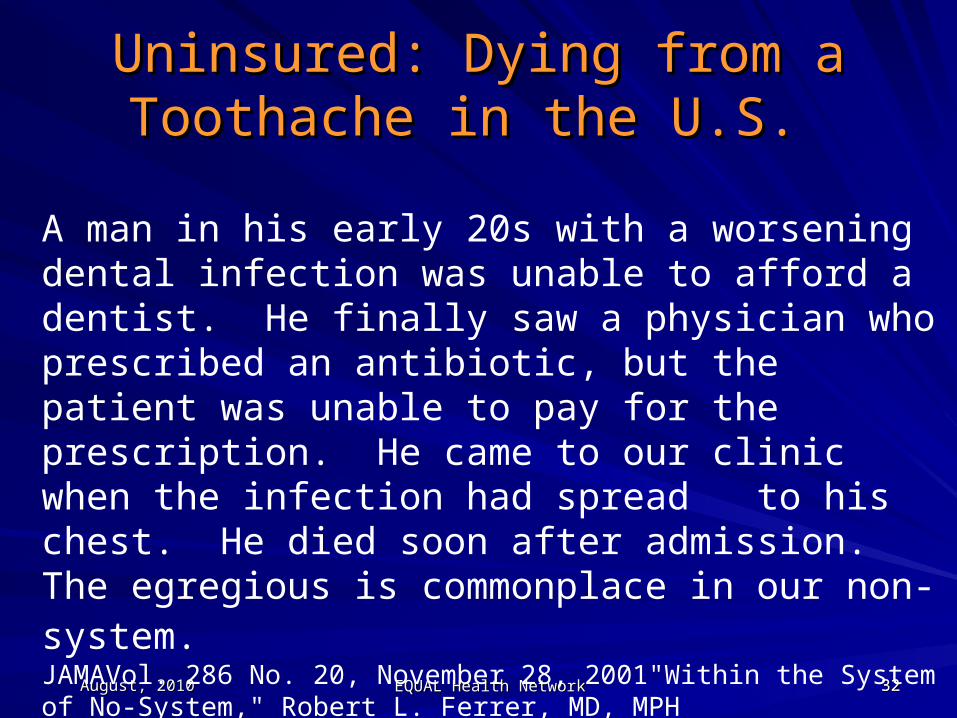
A man in his early 20s with a worsening dental infection was unable to afford a dentist. He finally saw a physician who prescribed an antibiotic, but the patient was unable to pay for the prescription. He came to our clinic when the infection had spread to his chest. He died soon after admission. The egregious is commonplace in our non-system. JAMAVol. 286 No. 20, November 28, 2001"Within the System of No-System," Robert L. Ferrer, MD, MPH
Uninsured: Dying from a Toothache Uninsured: Dying from a Toothache in the U.S. in the U.S.
August, 2010August, 2010 EQUAL Health NetworkEQUAL Health Network 33333333
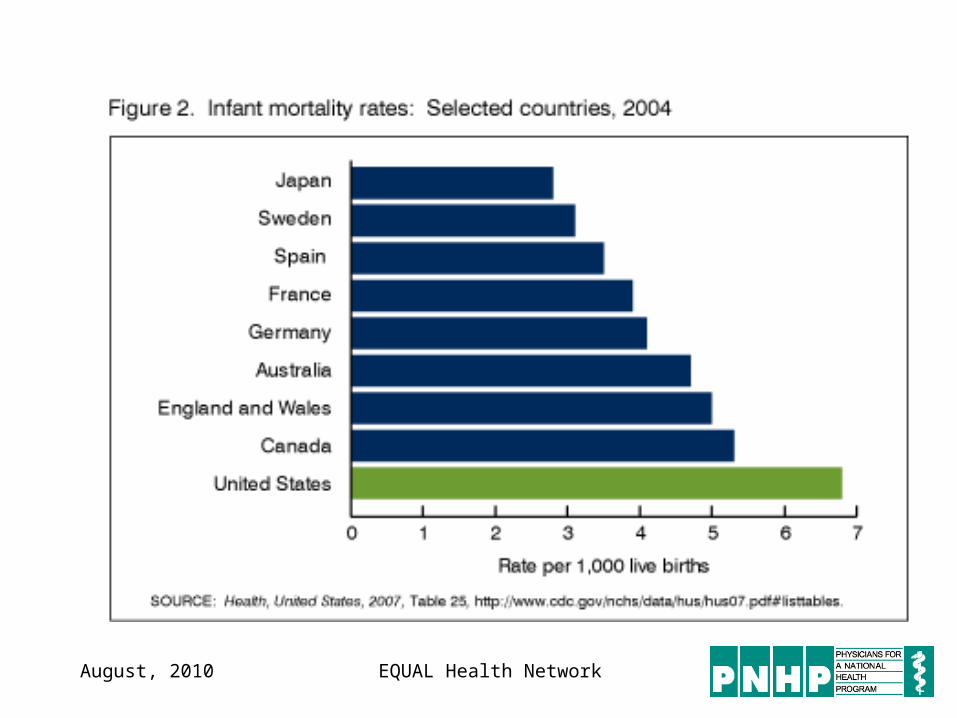
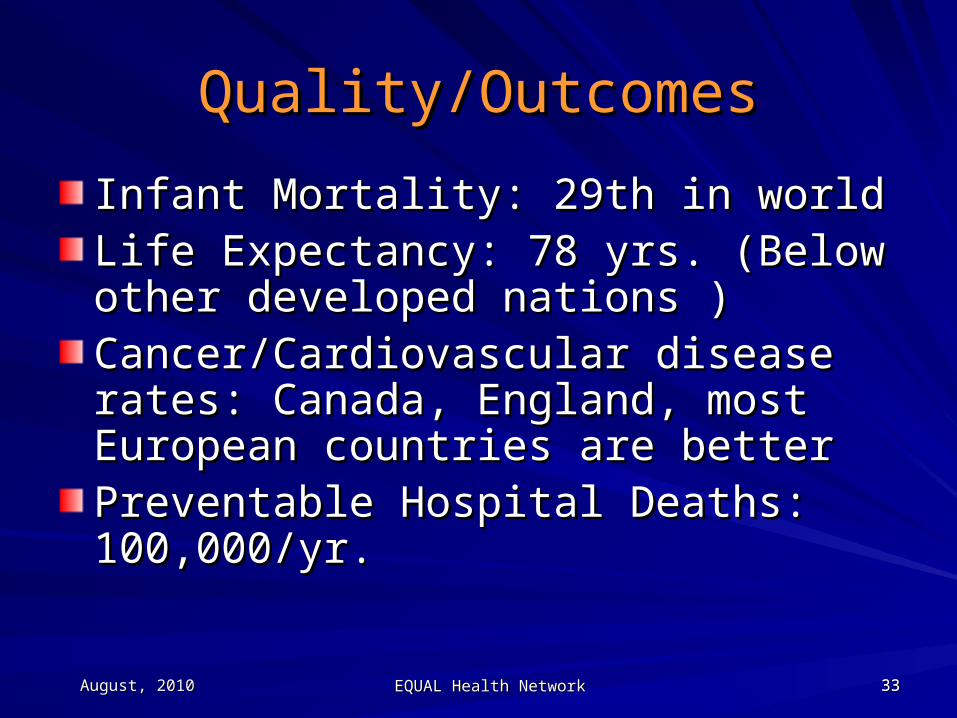
Quality/OutcomesQuality/Outcomes
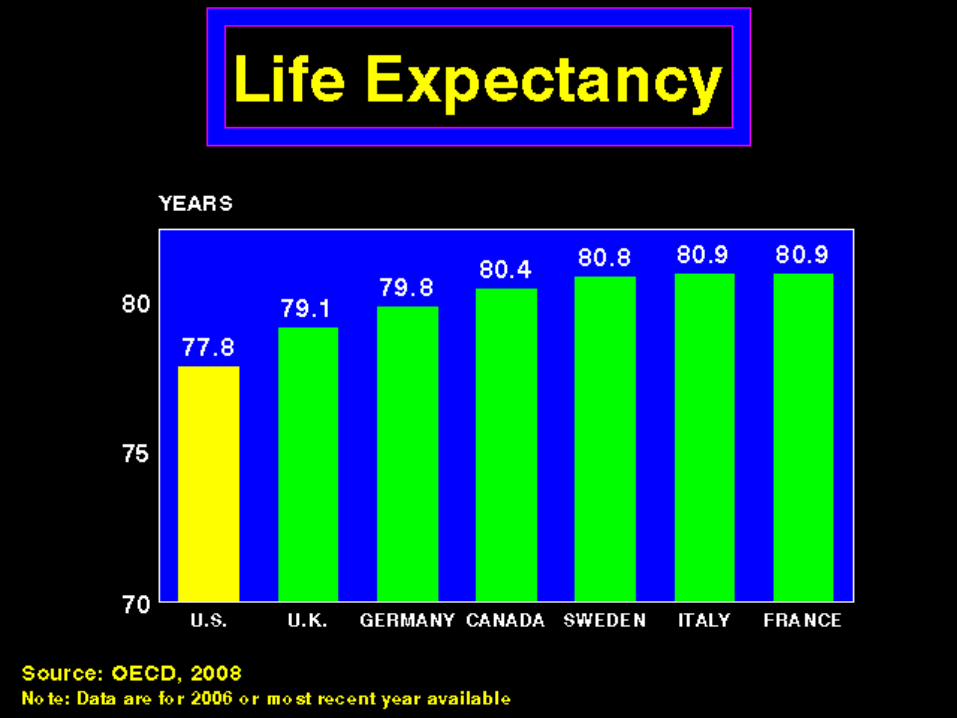
Infant Mortality: 29th in worldInfant Mortality: 29th in worldLife Expectancy: 78 yrs. (Below other Life Expectancy: 78 yrs. (Below other developed nations )developed nations )Cancer/Cardiovascular disease rates: Cancer/Cardiovascular disease rates: Canada, England, most European Canada, England, most European countries are bettercountries are betterPreventable Hospital Deaths: 100,000/yr.Preventable Hospital Deaths: 100,000/yr.
August, 2010August, 2010 EQUAL Health NetworkEQUAL Health Network 34343434
August, 2010August, 2010 EQUAL Health NetworkEQUAL Health Network 36363636
August, 2010 EQUAL Health Network 373737
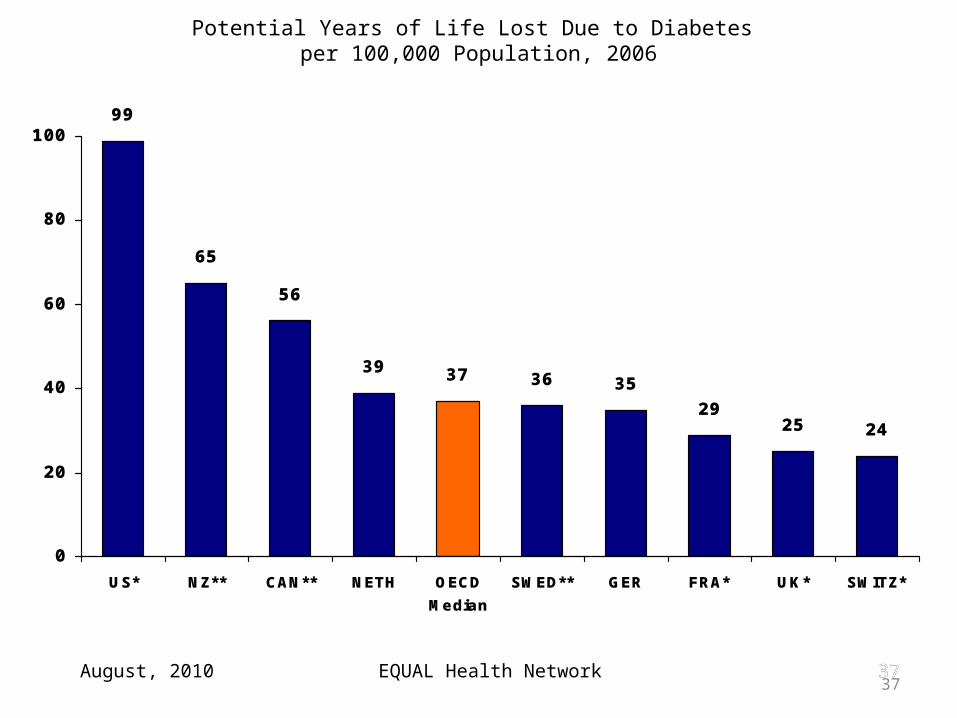
Potential Years of Life Lost Due to Diabetes per 100,000 Population, 2006
242529
35363739
56
65
99
0
20
40
60
80
100
US* NZ** CAN** NETH OECD
Median
SWED** GER FRA* UK* SWITZ*
*2005**2004
Data: OECD Health Data 2008 (June 2008).
August, 2010 EQUAL Health Network 38
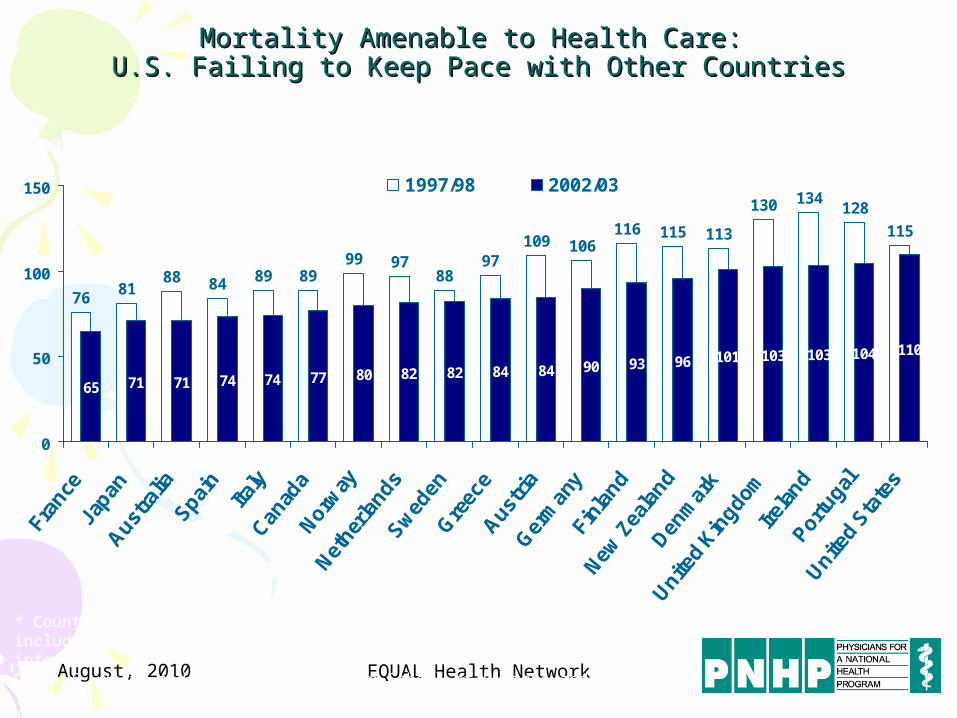
Mortality Amenable to Health Care: Mortality Amenable to Health Care: U.S. Failing to Keep Pace with Other CountriesU.S. Failing to Keep Pace with Other Countries
7681
88 84 89 8999 97
8897
109 106116 115 113
130 134128
115
65 71 71 74 74 77 80 82 82 84 84 90 93 96 101 103 103 104 110
0
50
100
150
Fran
ceJa
pan
Austra
liaSpa
inIta
lyCan
ada
Norw
ayNet
herla
nds
Swed
enG
reec
eAus
tria
Ger
man
yFi
nlan
dNew
Zea
land
Denm
ark
Unite
d Kin
gdom
Irela
ndPor
tuga
l
Unite
d Sta
tes
1997/98 2002/03
Deaths per 100,000 population*
* Countries’ age-standardized death rates before age 75; including ischemic heart disease, diabetes, stroke, and bacterial infections.Data: E. Nolte and C. M. McKee, London School of Hygiene and Tropical Medicine analysis of World Health Organization mortality files (Nolte and McKee, Health Affairs 2008).Source: Commonwealth Fund National Scorecard on U.S. Health System Performance, 2008.
Exhibit 2
August, 2010August, 2010 EQUAL Health NetworkEQUAL Health Network 39393939
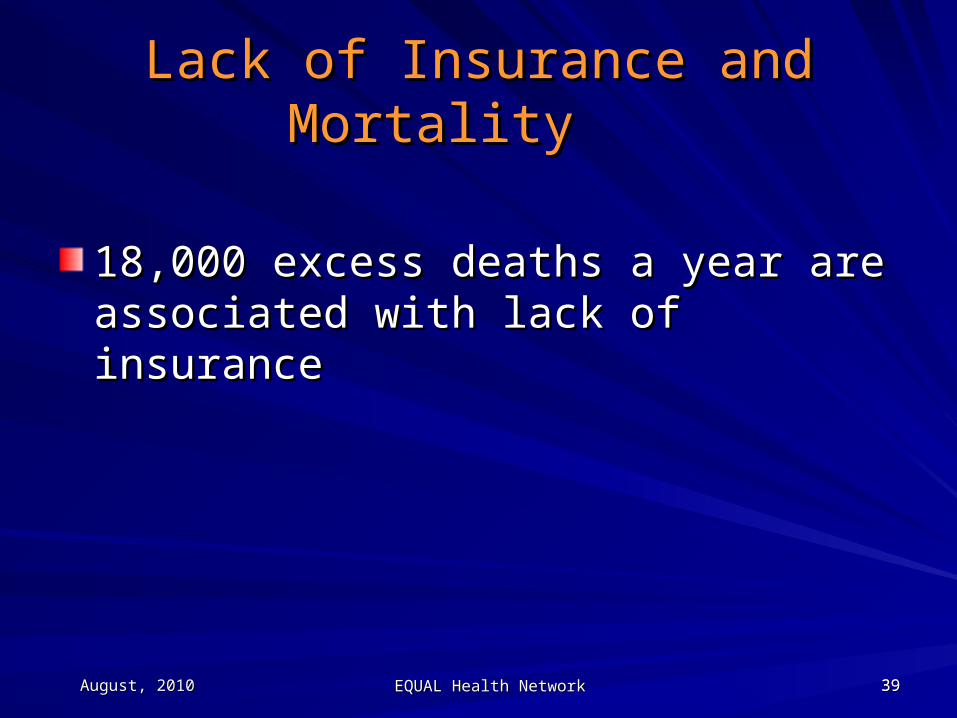
Lack of Insurance and MortalityLack of Insurance and Mortality
18,000 excess deaths a year are 18,000 excess deaths a year are associated with lack of insuranceassociated with lack of insurance
August, 2010August, 2010 EQUAL Health NetworkEQUAL Health Network 40404040
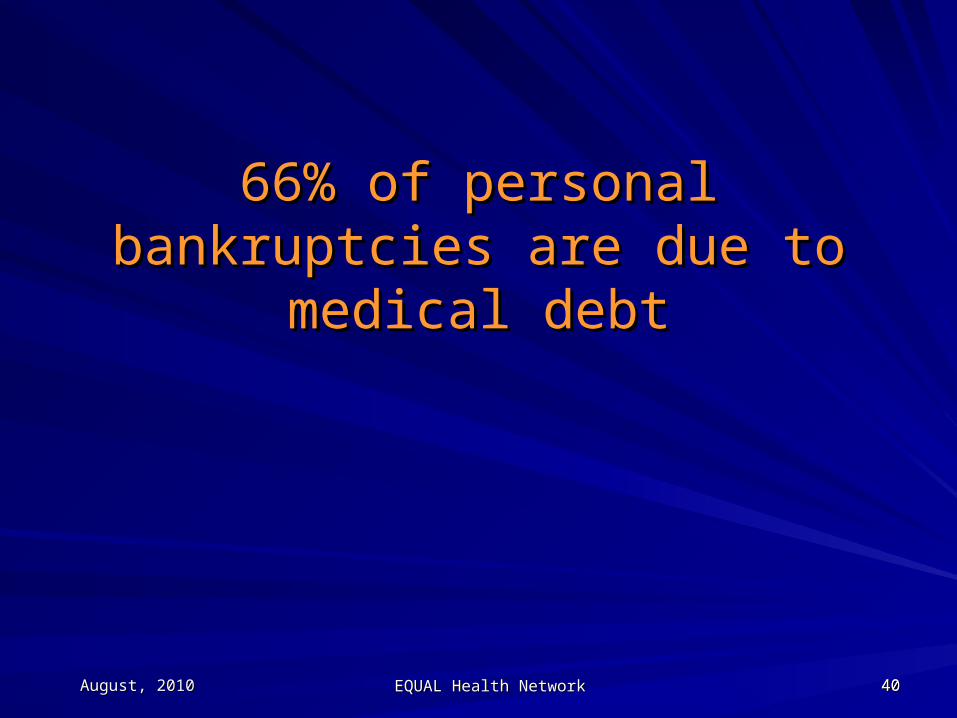
66% of personal bankruptcies are 66% of personal bankruptcies are due to medical debtdue to medical debt
August, 2010 EQUAL Health Network 4141
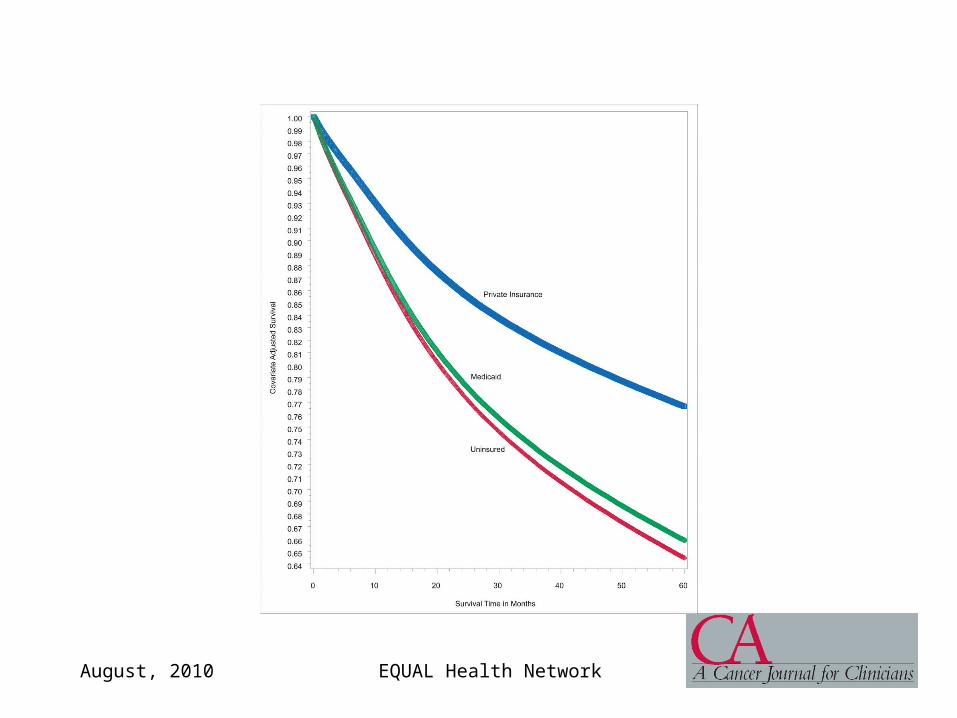
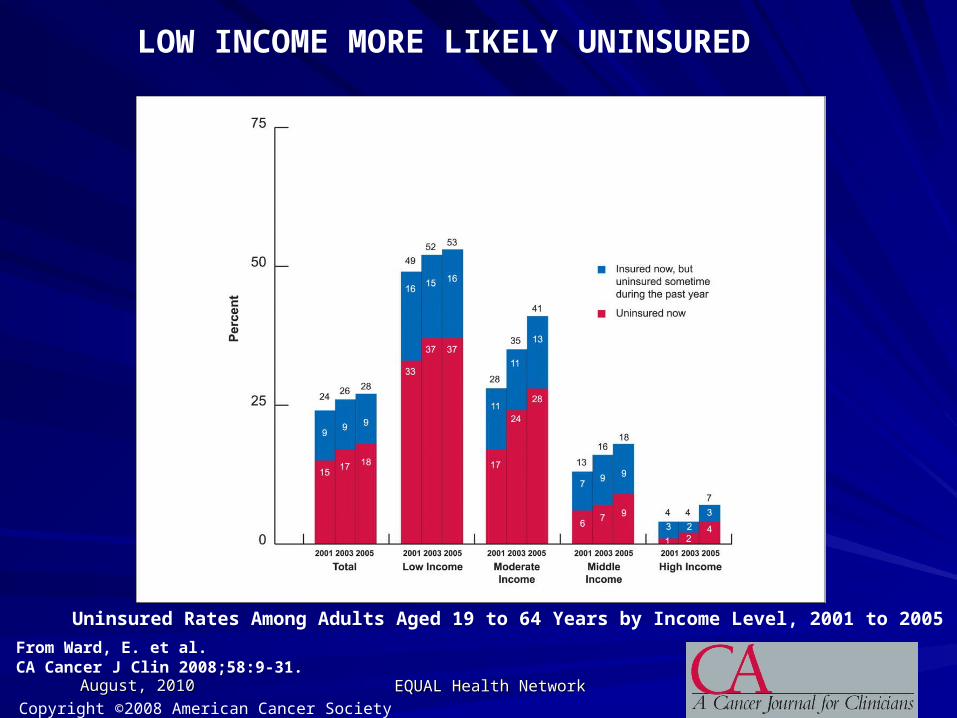
Copyright ©2008 American Cancer Society
From Ward, E. et al. CA Cancer J Clin 2008;58:9-31.
FIGURE 10 Cancer Survival by Insurance Status*
August, 2010August, 2010 EQUAL Health NetworkEQUAL Health Network 42424242Copyright ©2008 American Cancer Society
From Ward, E. et al. CA Cancer J Clin 2008;58:9-31.
Uninsured Rates Among Adults Aged 19 to 64 Years by Income Level, 2001 to 2005
LOW INCOME MORE LIKELY UNINSURED
August, 2010August, 2010 EQUAL Health NetworkEQUAL Health Network 43434343
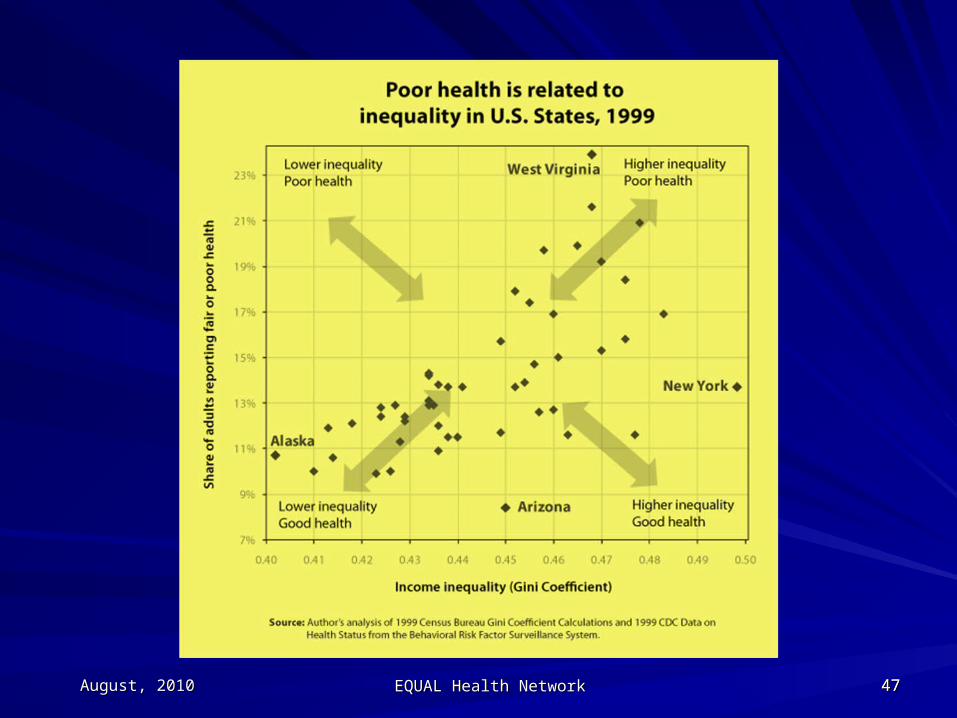
Race, Class, Insurance and HealthRace, Class, Insurance and Health
August, 2010 EQUAL Health Network 4444
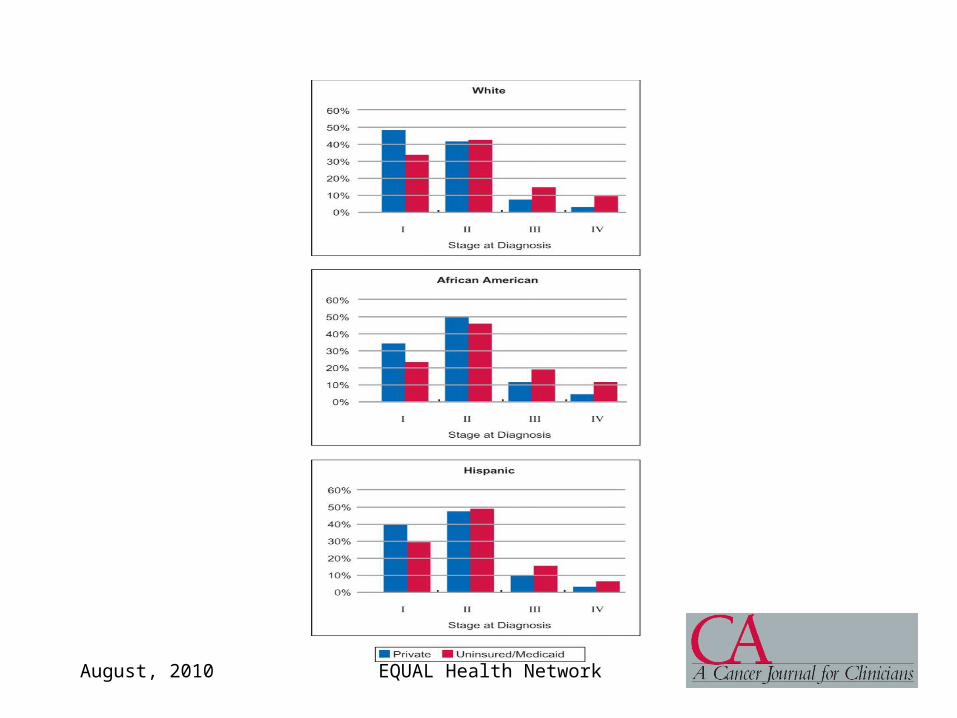
Copyright ©2008 American Cancer Society
From Ward, E. et al. CA Cancer J Clin 2008;58:9-31.
Breast Cancer: Blacks and Hispanics Diagnosed Later, More Likely Uninsured
August, 2010 EQUAL Health Network 4545
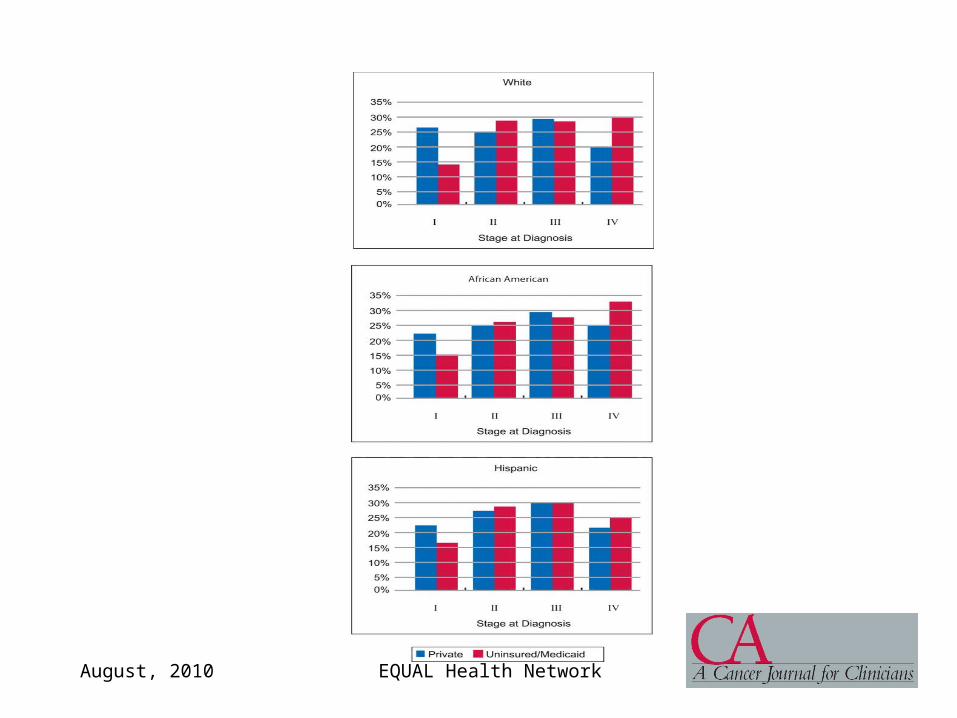
Copyright ©2008 American Cancer Society
From Ward, E. et al. CA Cancer J Clin 2008;58:9-31.
Colorectal Cancer Stage Distribution by Race and Insurance Status
August, 2010 EQUAL Health Network 4646Copyright restrictions may apply.
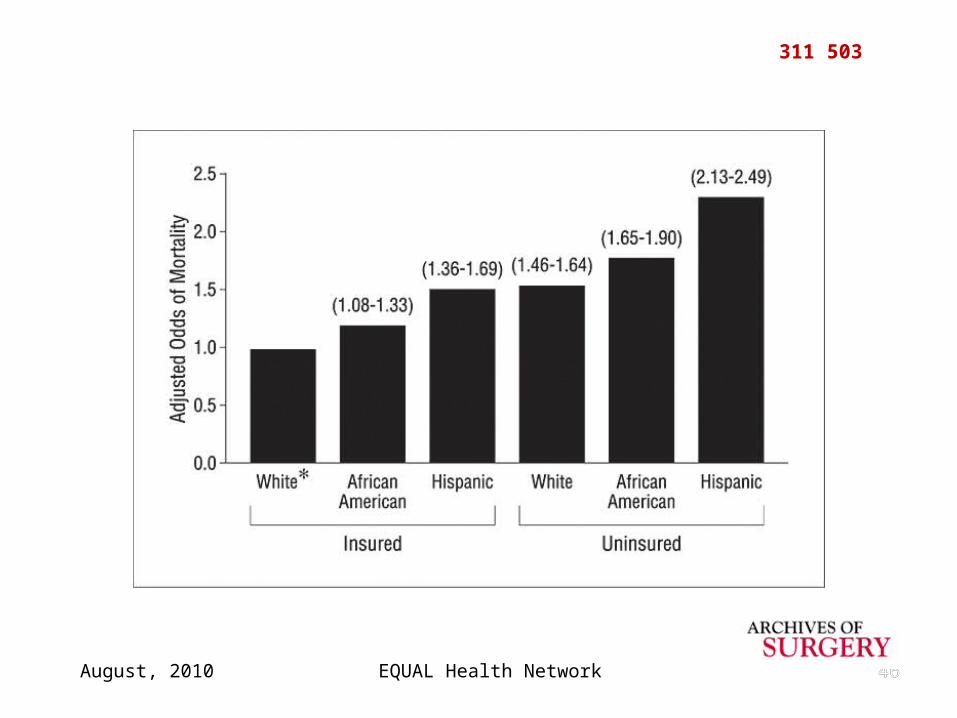
Haider, A. H. et al. Arch Surg 2008;143:945-949.
Adjusted odds of mortality by race and insurance status (n = 311 503)
August, 2010August, 2010 EQUAL Health NetworkEQUAL Health Network 47474747
August, 2010August, 2010 EQUAL Health NetworkEQUAL Health Network 48484848
We Pay More But Don’t Get MoreWe Pay More But Don’t Get More
Higher costs are related to intensity of Higher costs are related to intensity of carecare
Higher costs are Higher costs are notnot related to better related to better outcomesoutcomes
August, 2010August, 2010 EQUAL Health NetworkEQUAL Health Network 49494949
Variations in Cost/QualityVariations in Cost/Quality
Regions experience different per capita costsRegions experience different per capita costs
High-cost areas pay 30% more than low-cost High-cost areas pay 30% more than low-cost areasareas
Costs are unrelated to health, wealth, outcomeCosts are unrelated to health, wealth, outcome
Two determinants of costs: Two determinants of costs: – Supply of providersSupply of providers– Medical decisions/cultureMedical decisions/culture
August, 2010August, 2010 EQUAL Health NetworkEQUAL Health Network 50505050
We Have To Cover Everyone To We Have To Cover Everyone To Control CostsControl Costs
August, 2010August, 2010 EQUAL Health NetworkEQUAL Health Network 51515151
The Costs of Fragmented CoverageThe Costs of Fragmented Coverage
Illnesses and accidents are predictable for Illnesses and accidents are predictable for large groups over time large groups over time
But unpredictable for small groups in any But unpredictable for small groups in any yearyear
Problems for small groups Problems for small groups – A single catastrophic illness can wipe out A single catastrophic illness can wipe out
fundsfunds
August, 2010August, 2010 EQUAL Health NetworkEQUAL Health Network 52525252
Insurance, Access, CostsInsurance, Access, Costs
Private for-profit insurance companies Private for-profit insurance companies face incentives to avoid spending face incentives to avoid spending premiumspremiums– Identify and avoid “risky” patientsIdentify and avoid “risky” patients– Exclude pre-existing conditionsExclude pre-existing conditions
Insurance companies run up Insurance companies run up administrative costs to avoid “expensive” administrative costs to avoid “expensive” enrollees (sick people)enrollees (sick people)
August, 2010August, 2010 EQUAL Health NetworkEQUAL Health Network 53535353
Employment-Based InsuranceEmployment-Based Insurance
The U.S. is the only country where most people The U.S. is the only country where most people get health care coverage through workget health care coverage through workBut there is no requirement for employers to But there is no requirement for employers to offer or pay for coverage!!!offer or pay for coverage!!!Large employers: 96% offerLarge employers: 96% offerSmall employers: 43% offerSmall employers: 43% offer– (fewer than 50 employees)(fewer than 50 employees)
Principles of insurancePrinciples of insurance– Cover everyone at risk = AffordabilityCover everyone at risk = Affordability– If not, assume only those at risk will buy = Not If not, assume only those at risk will buy = Not
affordableaffordable
August, 2010August, 2010 EQUAL Health NetworkEQUAL Health Network 54545454
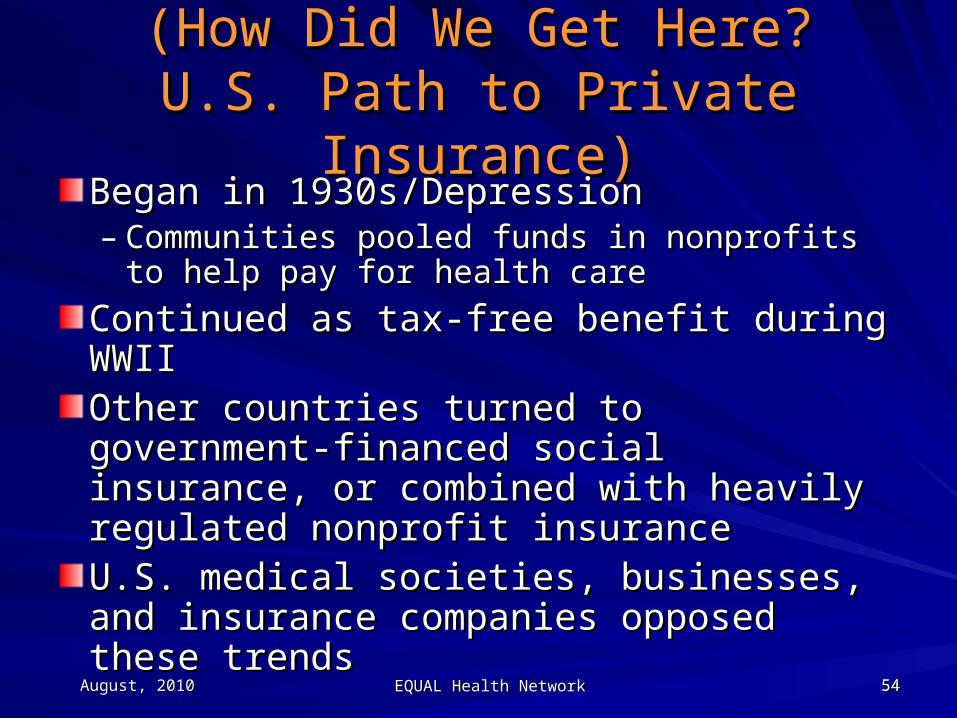
(How Did We Get Here?(How Did We Get Here?U.S. Path to Private Insurance)U.S. Path to Private Insurance)
Began in 1930s/DepressionBegan in 1930s/Depression– Communities pooled funds in nonprofits to Communities pooled funds in nonprofits to
help pay for health carehelp pay for health care
Continued as tax-free benefit during WWIIContinued as tax-free benefit during WWIIOther countries turned to government-Other countries turned to government-financed social insurance, or combined financed social insurance, or combined with heavily regulated nonprofit insurancewith heavily regulated nonprofit insuranceU.S. medical societies, businesses, and U.S. medical societies, businesses, and insurance companies opposed these insurance companies opposed these trendstrends
August, 2010August, 2010 EQUAL Health NetworkEQUAL Health Network 55555555
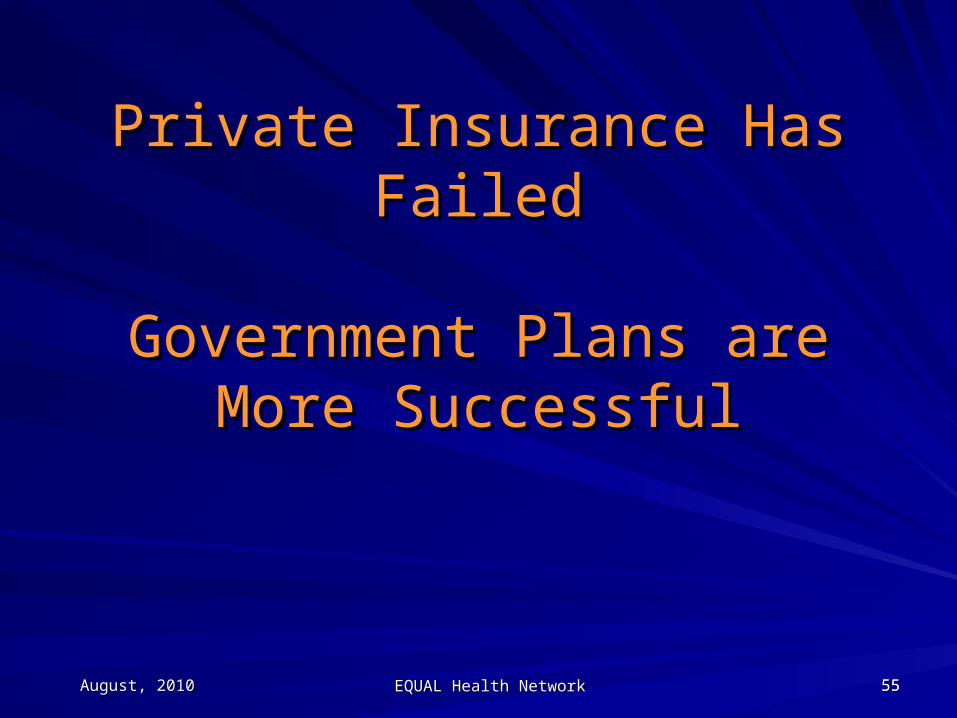
Private Insurance Has FailedPrivate Insurance Has Failed
Government Plans are More Government Plans are More SuccessfulSuccessful
August, 2010August, 2010 EQUAL Health NetworkEQUAL Health Network 56565656
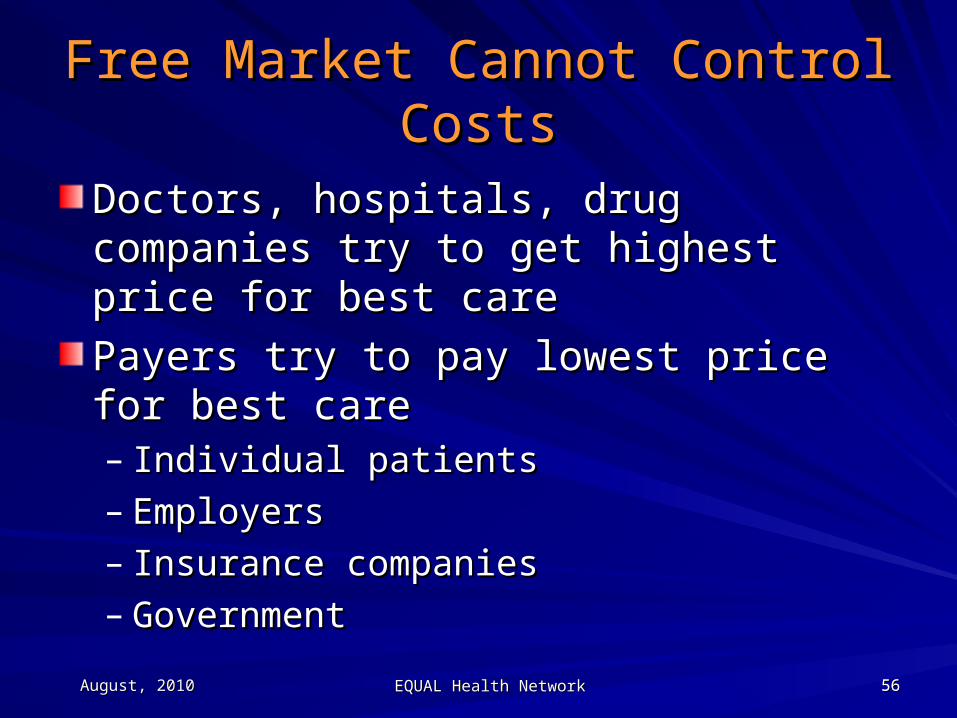
Free Market Cannot Control CostsFree Market Cannot Control Costs
Doctors, hospitals, drug companies try to Doctors, hospitals, drug companies try to get highest price for best careget highest price for best care
Payers try to pay lowest price for best carePayers try to pay lowest price for best care– Individual patientsIndividual patients– EmployersEmployers– Insurance companiesInsurance companies– GovernmentGovernment
August, 2010August, 2010 EQUAL Health NetworkEQUAL Health Network 57575757
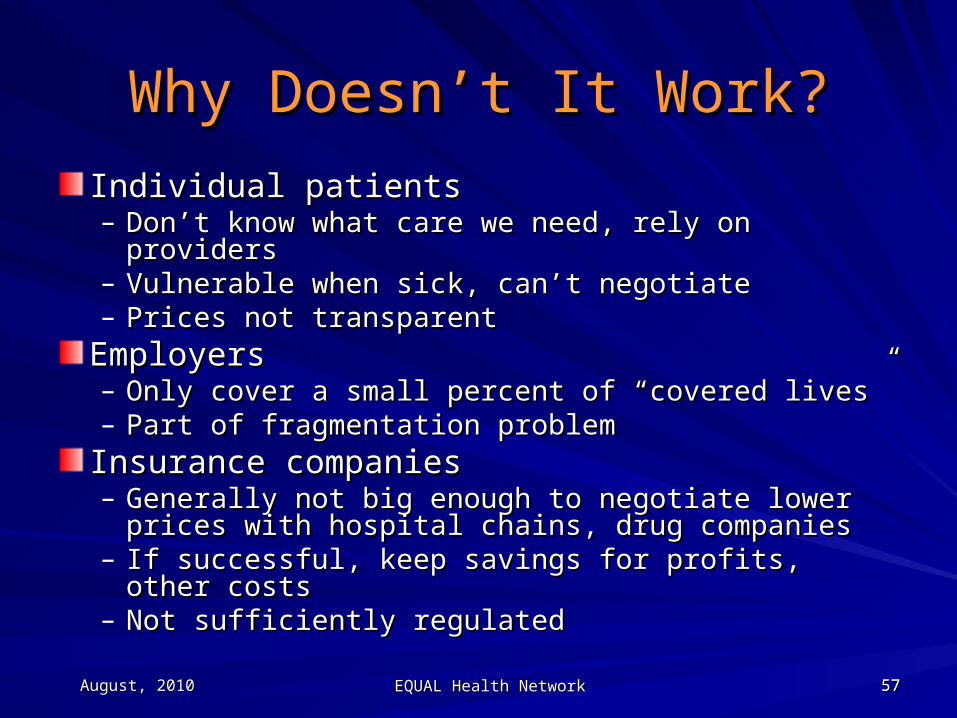
Why Doesn’t It Work?Why Doesn’t It Work?
Individual patientsIndividual patients– Don’t know what care we need, rely on providersDon’t know what care we need, rely on providers– Vulnerable when sick, can’t negotiateVulnerable when sick, can’t negotiate– Prices not transparentPrices not transparent
EmployersEmployers– Only cover a small percent of “covered lives”Only cover a small percent of “covered lives”– Part of fragmentation problemPart of fragmentation problem
Insurance companiesInsurance companies– Generally not big enough to negotiate lower prices Generally not big enough to negotiate lower prices
with hospital chains, drug companieswith hospital chains, drug companies– If successful, keep savings for profits, other costsIf successful, keep savings for profits, other costs– Not sufficiently regulated Not sufficiently regulated
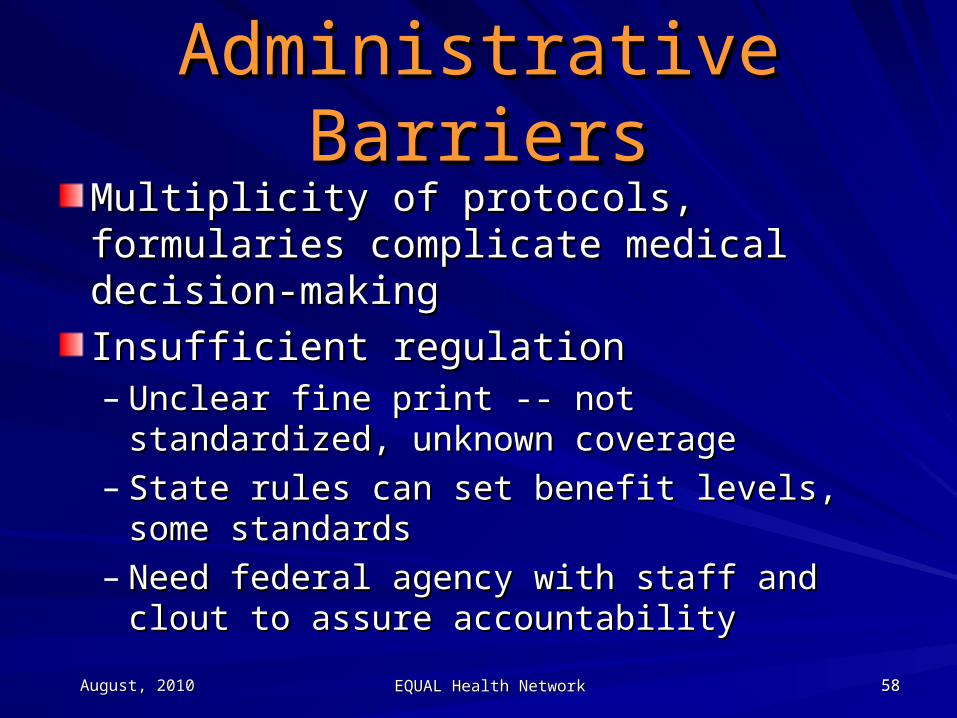
August, 2010August, 2010 EQUAL Health NetworkEQUAL Health Network 58585858
Administrative BarriersAdministrative BarriersMultiplicity of protocols, formularies Multiplicity of protocols, formularies complicate medical decision-makingcomplicate medical decision-making
Insufficient regulationInsufficient regulation– Unclear fine print -- not standardized, Unclear fine print -- not standardized,
unknown coverageunknown coverage– State rules can set benefit levels, some State rules can set benefit levels, some
standardsstandards– Need federal agency with staff and clout to Need federal agency with staff and clout to
assure accountabilityassure accountability
August, 2010August, 2010 EQUAL Health NetworkEQUAL Health Network 59595959
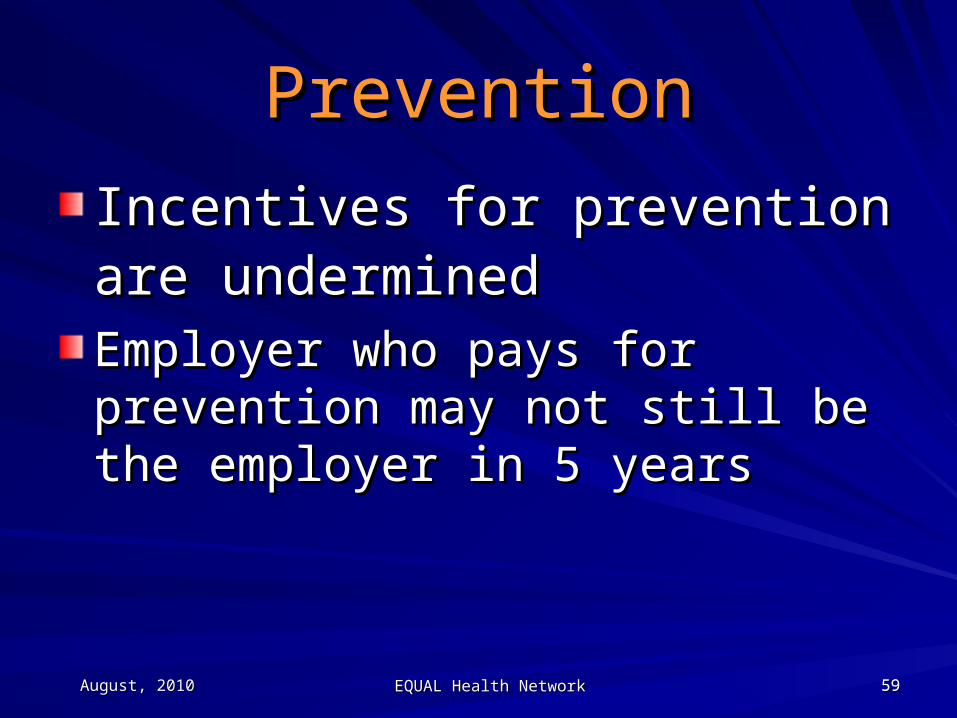
PreventionPrevention
Incentives for prevention are Incentives for prevention are underminedundermined Employer who pays for prevention Employer who pays for prevention may not still be the employer in 5 may not still be the employer in 5 yearsyears
August, 2010August, 2010 EQUAL Health NetworkEQUAL Health Network 60606060
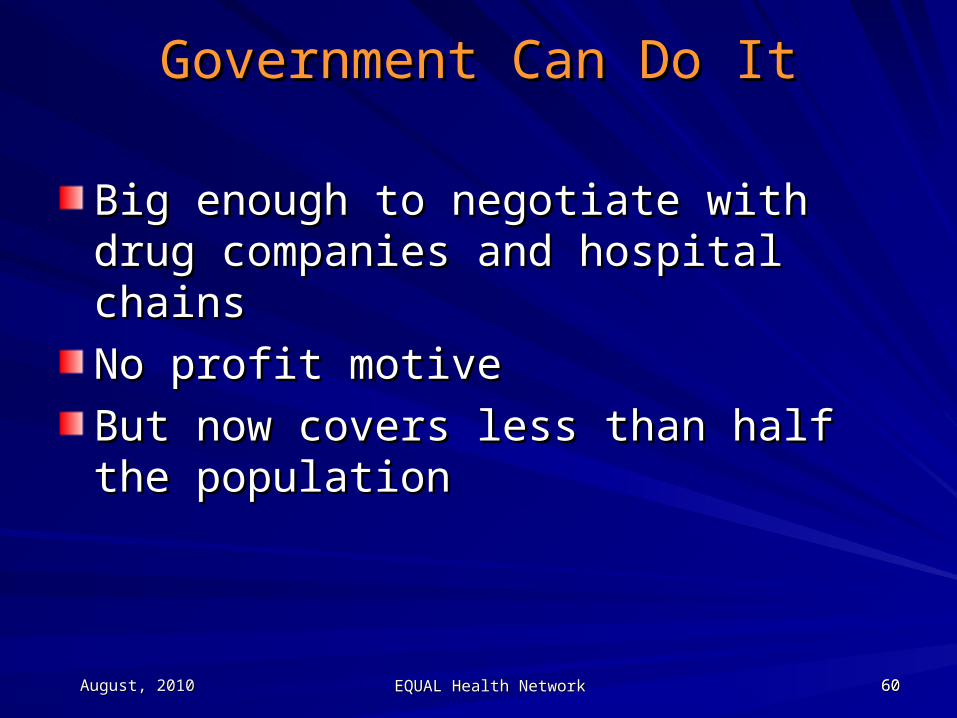
Government Can Do ItGovernment Can Do It
Big enough to negotiate with drug Big enough to negotiate with drug companies and hospital chainscompanies and hospital chains
No profit motiveNo profit motive
But now covers less than half the But now covers less than half the population population
August, 2010August, 2010 EQUAL Health NetworkEQUAL Health Network 61616161
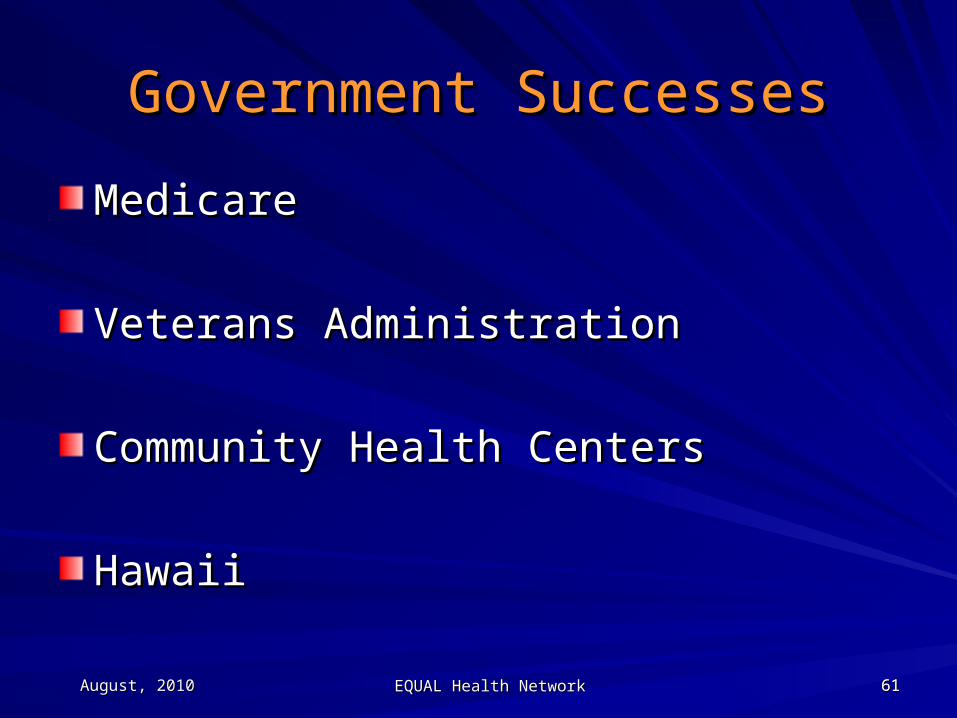
Government SuccessesGovernment Successes
MedicareMedicare
Veterans AdministrationVeterans Administration
Community Health CentersCommunity Health Centers
HawaiiHawaii
August, 2010August, 2010 EQUAL Health NetworkEQUAL Health Network 62626262
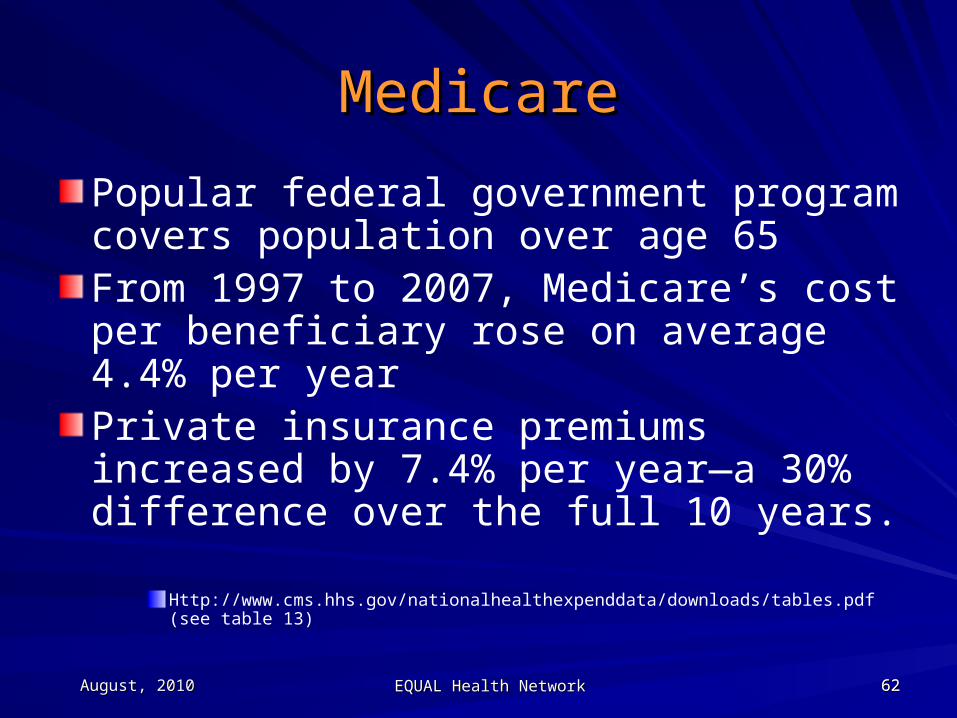
MedicareMedicare
Popular federal government program covers population over age 65From 1997 to 2007, Medicare’s cost per beneficiary rose on average 4.4% per yearPrivate insurance premiums increased by 7.4% per year—a 30% difference over the full 10 years.
Http://www.cms.hhs.gov/nationalhealthexpenddata/downloads/tables.pdf (see table 13)
August, 2010August, 2010 EQUAL Health NetworkEQUAL Health Network 63636363
Hawaiian Health Care SystemHawaiian Health Care System
The Daily Show, Feb. 11, 2010The Daily Show, Feb. 11, 2010““Hawaiians have government-mandated Hawaiians have government-mandated health care and they love it.”health care and they love it.”““We’ve been doing it this way for 40 We’ve been doing it this way for 40 years.”years.”Dog the Bounty-Hunter supports Hawaiian Dog the Bounty-Hunter supports Hawaiian health care.health care.http://www.thedailyshow.com/watch/thu-http://www.thedailyshow.com/watch/thu-february-11-2010/the-apparent-trap/february-11-2010/the-apparent-trap/
August, 2010August, 2010 EQUAL Health NetworkEQUAL Health Network 64646464
Health Reform Is A Political Health Reform Is A Political Challenge Challenge
August, 2010August, 2010 EQUAL Health NetworkEQUAL Health Network 66666666
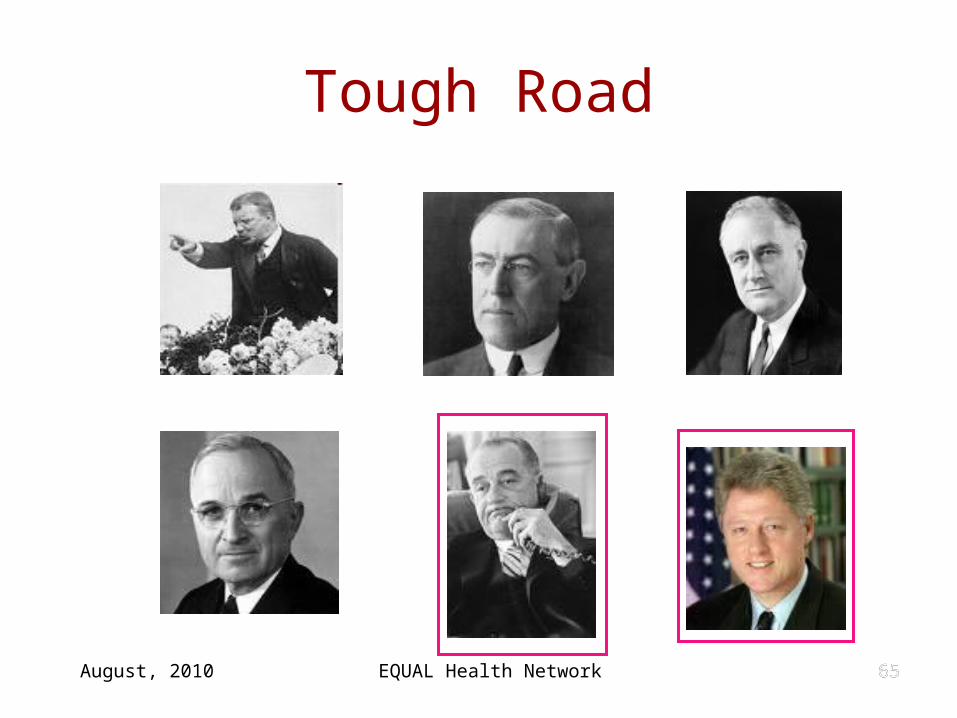
Some VictoriesSome Victories
1965 – Johnson: Medicare, Medicaid1965 – Johnson: Medicare, Medicaid
1994 – Clinton: State Children’s Health 1994 – Clinton: State Children’s Health Insurance Program (SCHIP)Insurance Program (SCHIP)
August, 2010August, 2010 EQUAL Health NetworkEQUAL Health Network 67676767
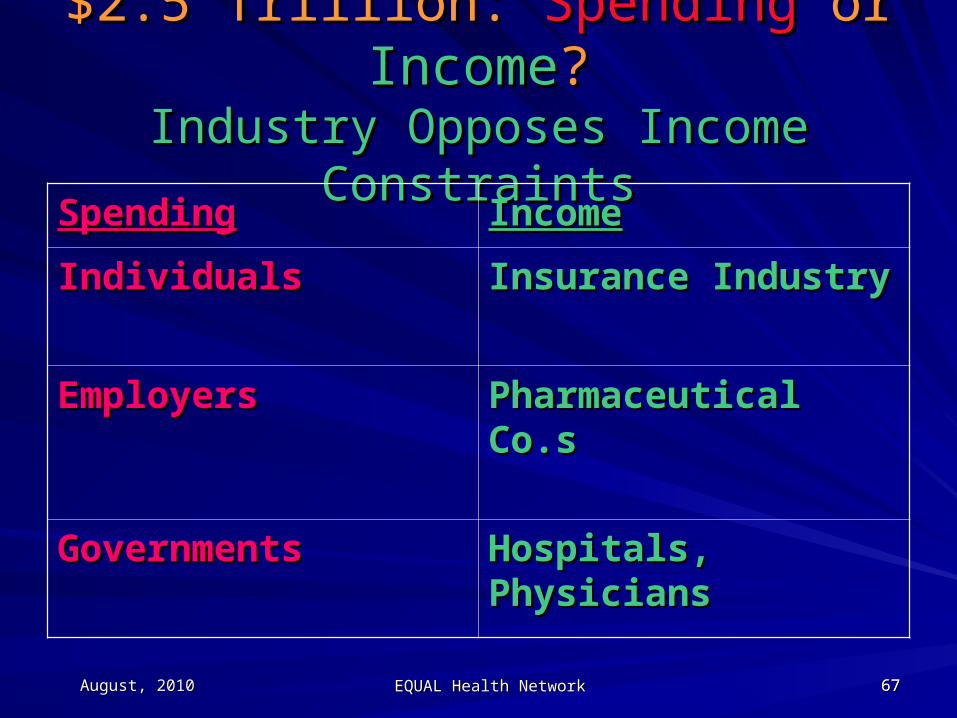
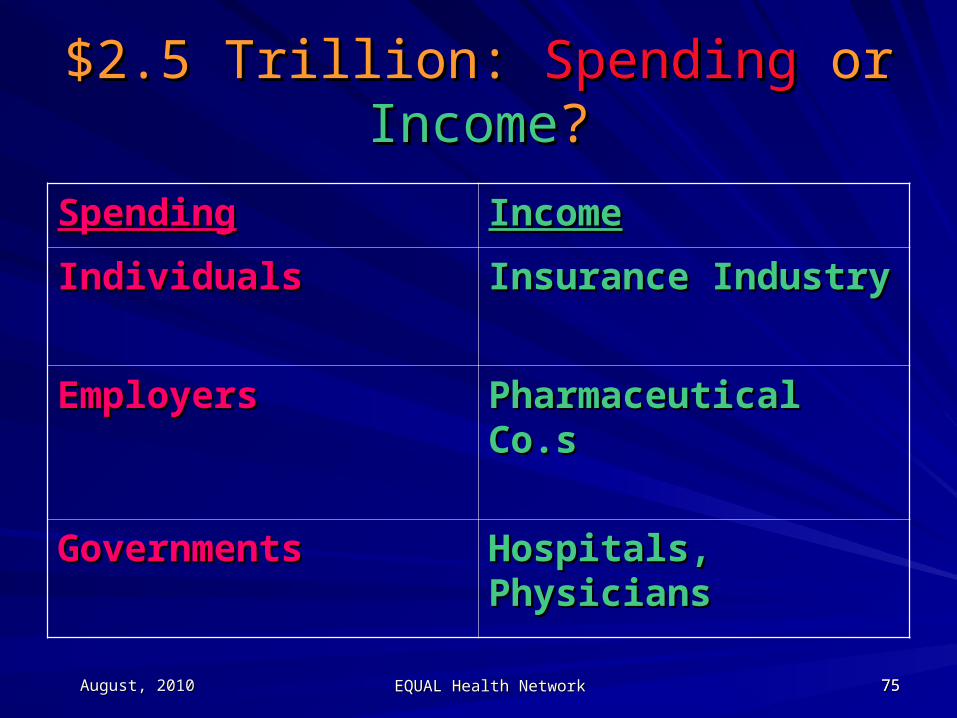
$2.5 Trillion: $2.5 Trillion: SpendingSpending or or IncomeIncome??Industry Opposes Income ConstraintsIndustry Opposes Income Constraints
SpendingSpending IncomeIncome
IndividualsIndividuals Insurance IndustryInsurance Industry
EmployersEmployers Pharmaceutical Co.sPharmaceutical Co.s
GovernmentsGovernments Hospitals, PhysiciansHospitals, Physicians
August, 2010August, 2010 EQUAL Health NetworkEQUAL Health Network 68686868
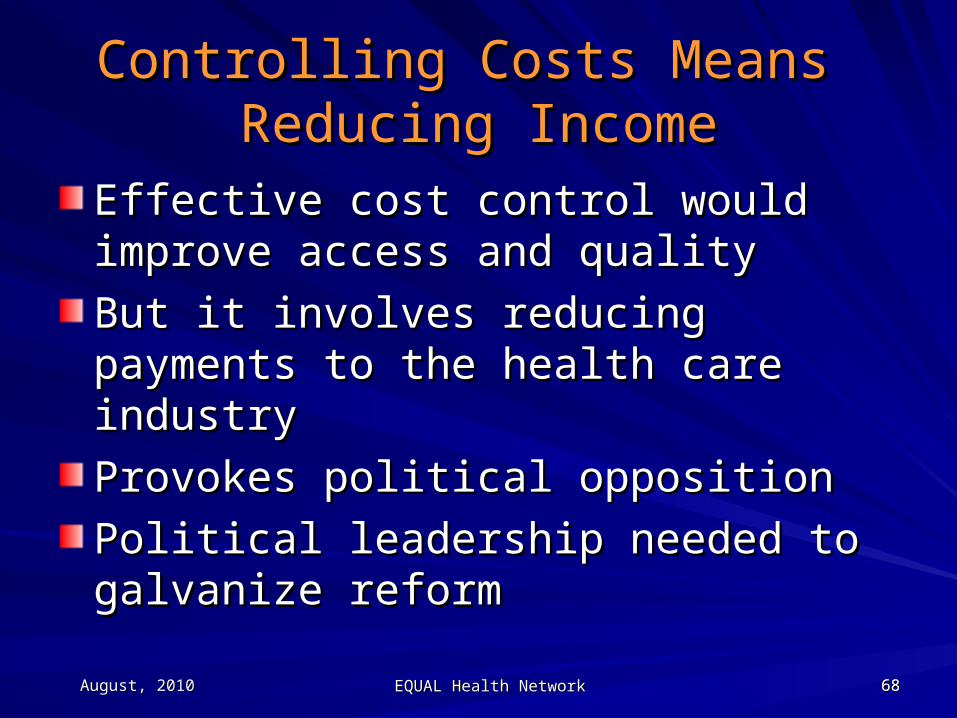
Controlling Costs Means Controlling Costs Means Reducing IncomeReducing Income
Effective cost control would improve Effective cost control would improve access and qualityaccess and quality
But it involves reducing payments to the But it involves reducing payments to the health care industryhealth care industry
Provokes political oppositionProvokes political opposition
Political leadership needed to galvanize Political leadership needed to galvanize reformreform
August, 2010August, 2010 EQUAL Health NetworkEQUAL Health Network 69696969
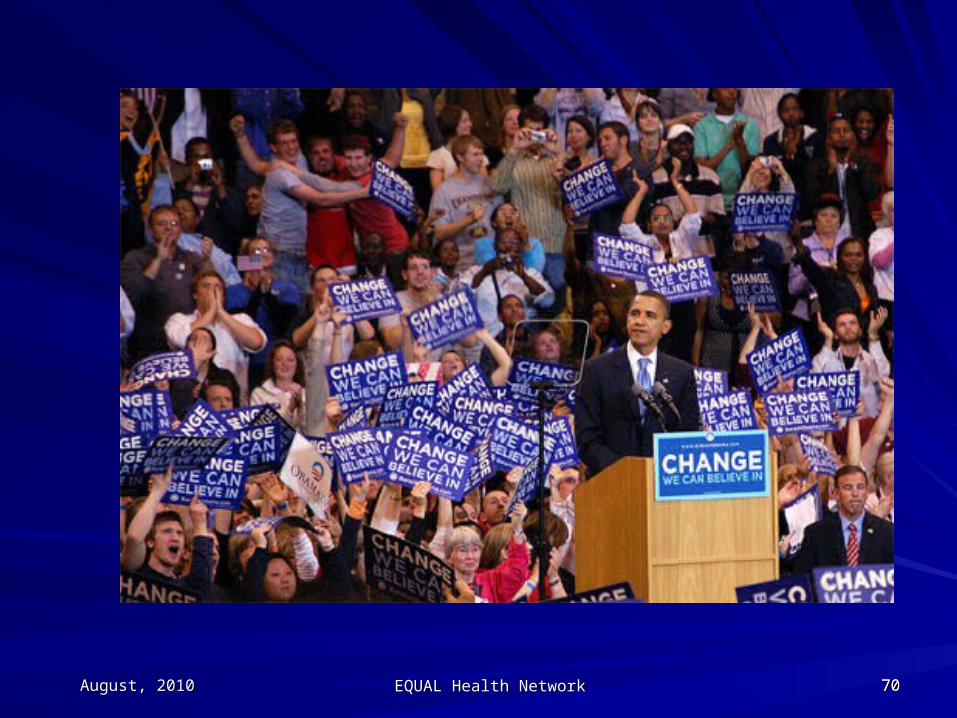
Politics in 2008: Auspicious Politics in 2008: Auspicious
August, 2010August, 2010 EQUAL Health NetworkEQUAL Health Network 70707070
August, 2010August, 2010 EQUAL Health NetworkEQUAL Health Network 71717171
Politics in 2010: ChallengingPolitics in 2010: Challenging
August, 2010August, 2010 EQUAL Health NetworkEQUAL Health Network 72727272
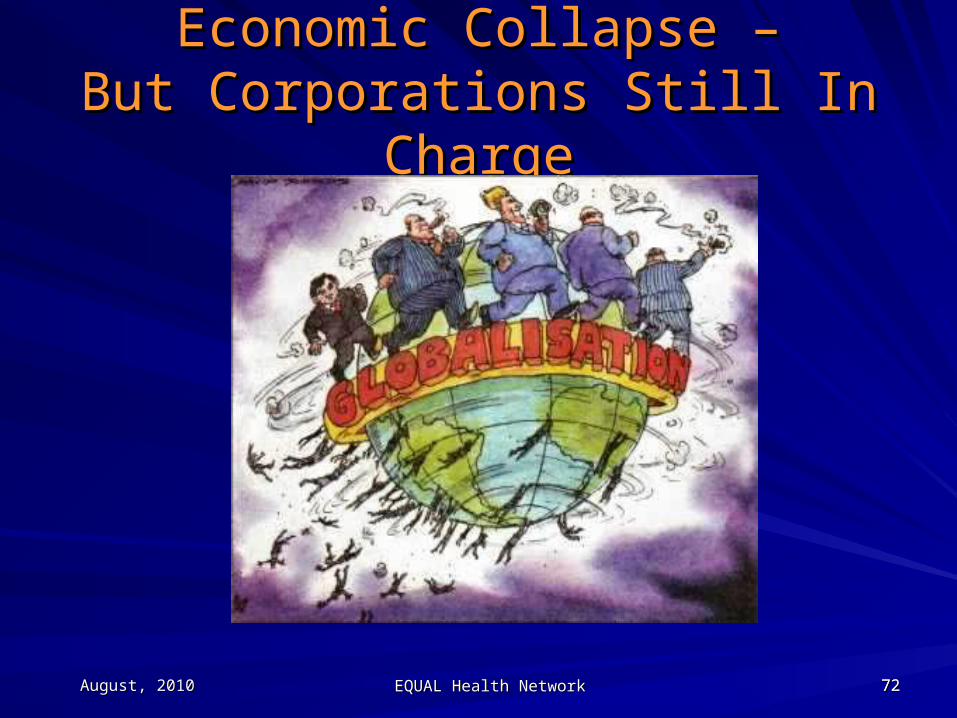
Economic Collapse –Economic Collapse –But Corporations Still In ChargeBut Corporations Still In Charge
August, 2010August, 2010 EQUAL Health NetworkEQUAL Health Network 73737373
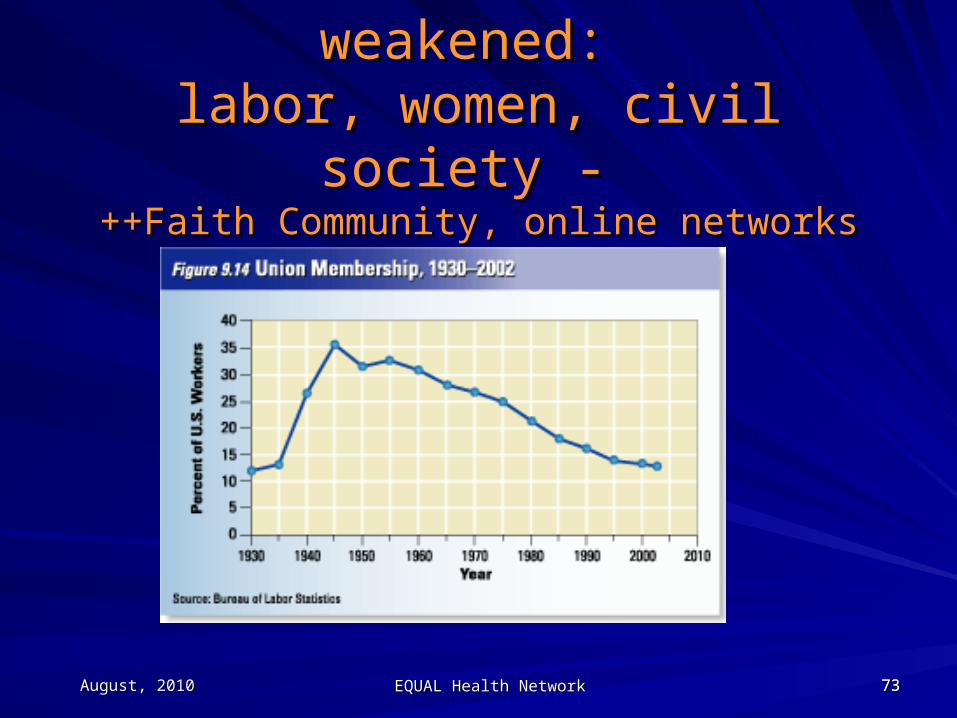
Social institutions weakened: Social institutions weakened: labor, women, civil society - labor, women, civil society -
++Faith Community, online networks growing ++++Faith Community, online networks growing ++
August, 2010August, 2010 EQUAL Health NetworkEQUAL Health Network 74747474
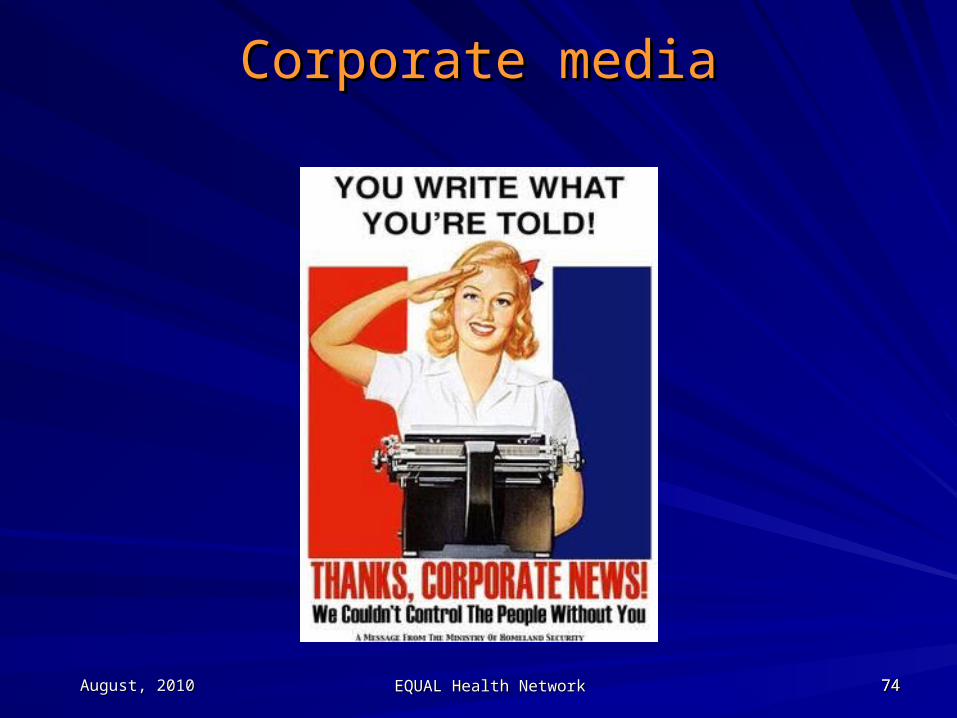
Corporate mediaCorporate media
August, 2010August, 2010 EQUAL Health NetworkEQUAL Health Network 75757575
$2.5 Trillion: $2.5 Trillion: SpendingSpending or or IncomeIncome??
SpendingSpending IncomeIncome
IndividualsIndividuals Insurance IndustryInsurance Industry
EmployersEmployers Pharmaceutical Co.sPharmaceutical Co.s
GovernmentsGovernments Hospitals, PhysiciansHospitals, Physicians
August, 2010August, 2010 EQUAL Health NetworkEQUAL Health Network 7676
Acknowledgements
Thanks to EQUAL Health Partners: Deborah LeVeen, Elinor Blake, Lee Lawrence, Roma Guy, Karl Keener, Kathie Piccagli
Jeoff Gordon, MD
Some slides from Health Access, PNHP