Embed Size (px)
Citation preview
1
The role of big data to inform food policy globally and in
Canada
Mary R. L’Abbé, PhDEarle W. McHenry Professor and
Chair, Department of Nutritional Sciences
Big Data for Health Policy WorkshopUniversity of TorontoNovember 5 & 6, 2014
Why do we care? Why do we need big data?
2
10%
13.8
million
De
ath
s in
20
11
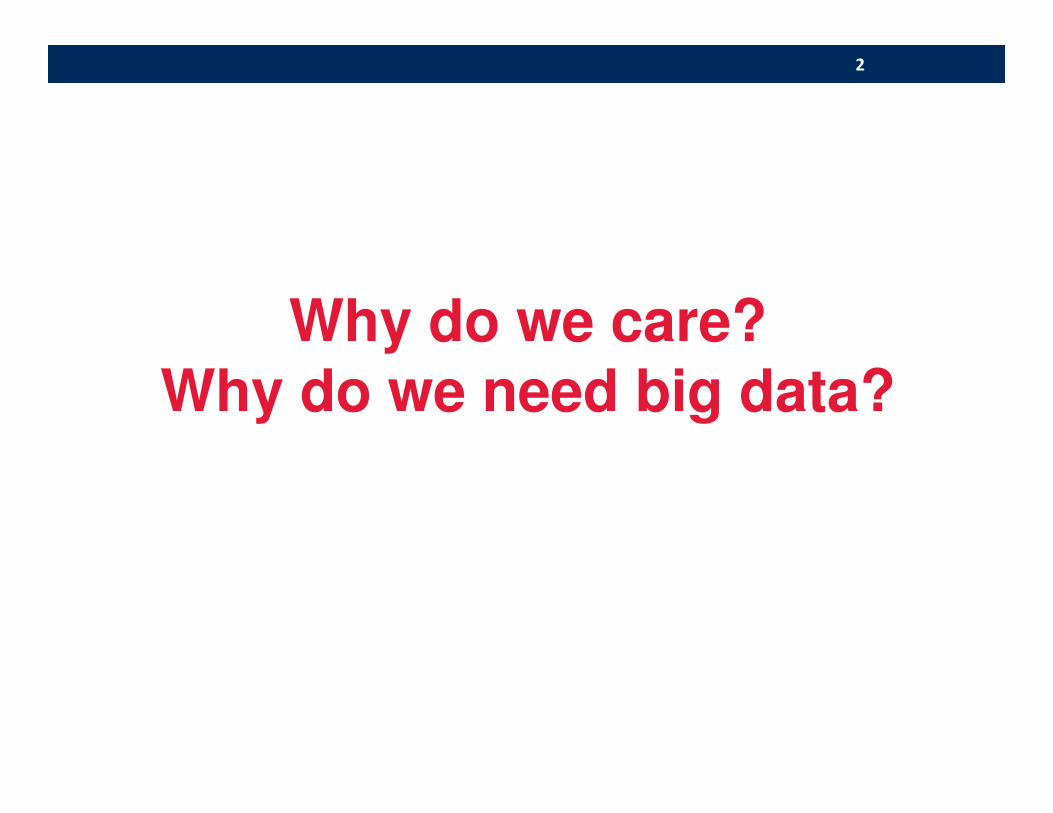
In 2011, 13.8 million people, between age of 30-70, died from NCDs: More than 85% of these deaths occurred in developing countries
Most of these premature deaths from NCDs could have been prevented
Source: WHO, Sept 2014
3
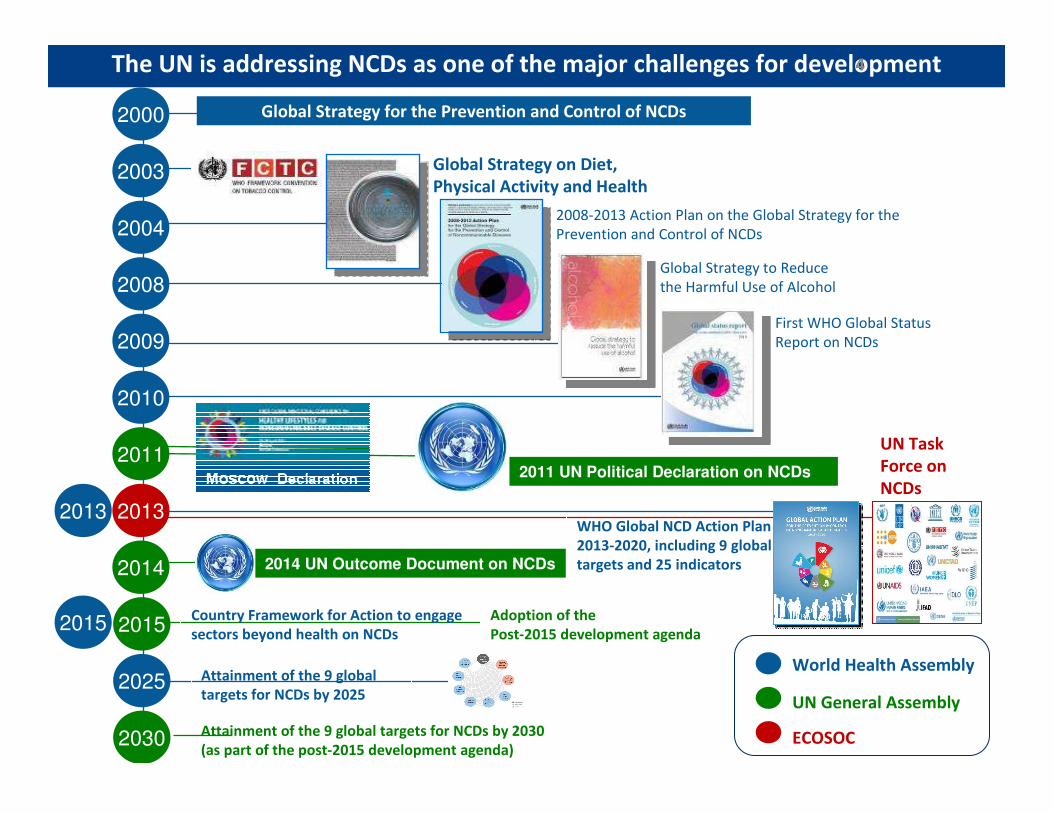
The UN is addressing NCDs as one of the major challenges for development
WHO Global NCD Action Plan
2013-2020, including 9 global
targets and 25 indicators
2000
2003
2004
2008
Global Strategy for the Prevention and Control of NCDs
Global Strategy on Diet,
Physical Activity and Health
2008-2013 Action Plan on the Global Strategy for the
Prevention and Control of NCDs
2010
2009
2011
Global Strategy to Reduce
the Harmful Use of Alcohol
First WHO Global Status
Report on NCDs
2013
2025 Attainment of the 9 global
targets for NCDs by 2025
2014
2030
2015
2011 UN Political Declaration on NCDs
Country Framework for Action to engage
sectors beyond health on NCDs
Attainment of the 9 global targets for NCDs by 2030
(as part of the post-2015 development agenda)
Adoption of the
Post-2015 development agenda
World Health Assembly
UN General Assembly
ECOSOC
UN Task
Force on
NCDs
2013
2015
2014 UN Outcome Document on NCDs
4
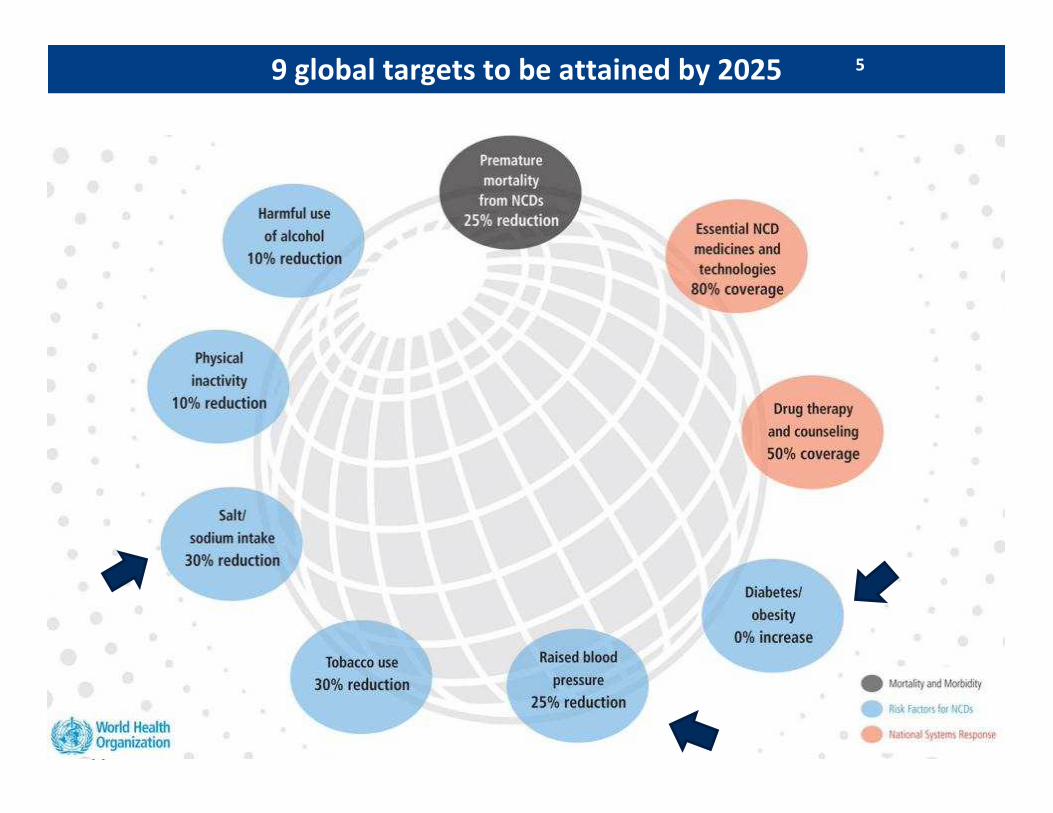
9 global targets to be attained by 2025 5
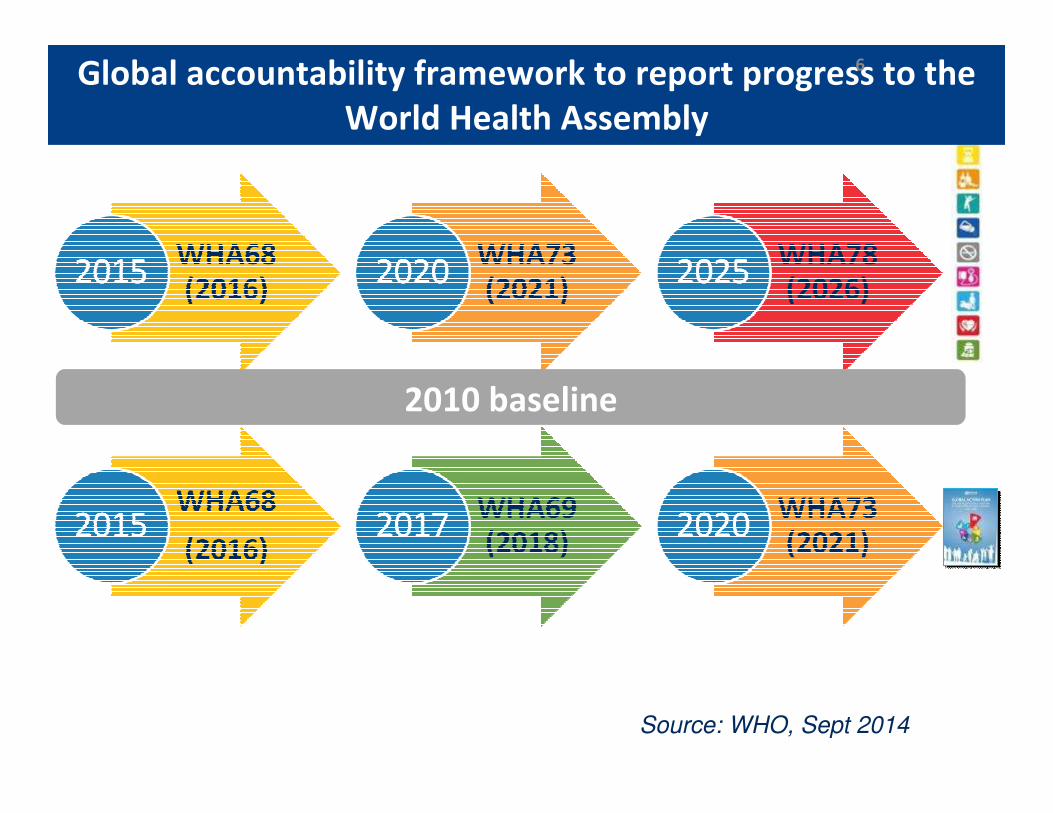
2010 baseline
Global accountability framework to report progress to the
World Health Assembly
Source: WHO, Sept 2014
6
BIG DATA TO INFORM FOOD POLICY IN CANADA
7
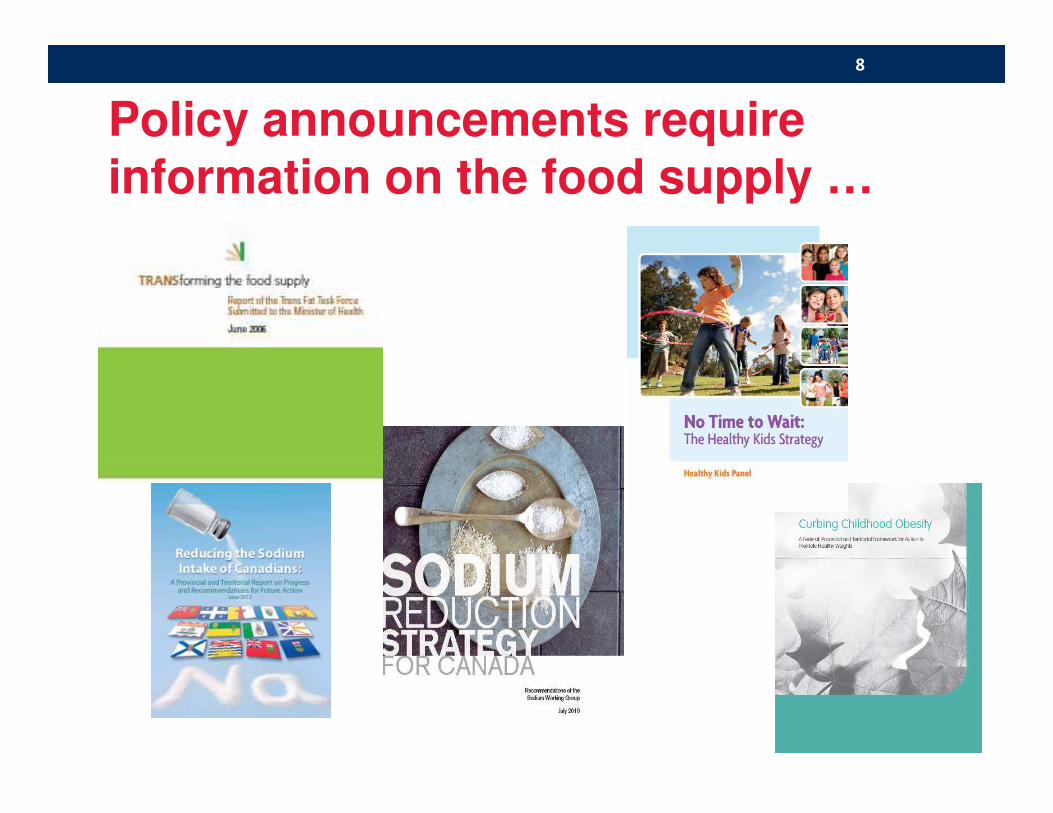
Policy announcements require information on the food supply …
8
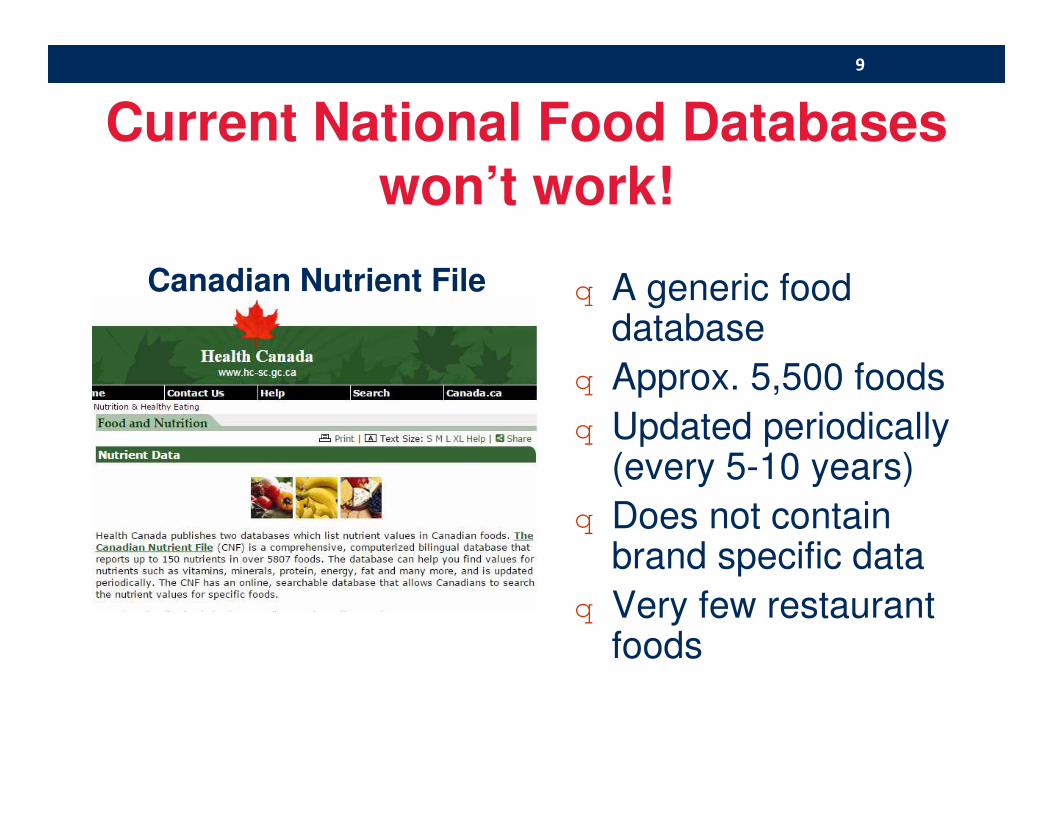
Current National Food Databases won’t work!
q A generic food database
q Approx. 5,500 foods
q Updated periodically (every 5-10 years)
q Does not contain brand specific data
q Very few restaurant foods
9
Canadian Nutrient File
Food Label Information Program -FLIP
Data Collection (2010; 2013) • 4 largest national retailers (Loblaws, Sobey’s, Metro, Safeway);
others have joined since
Inclusion/Exclusion Criteria• Every food with a NFT; All national and private brands• Excluded: (i) seasonal products; (ii) NHPs
(pills/capsules/powders); (iii) baby foods
Custom Data Collection Tools/FLIP Database• Scanned UPC to determine if food in database• If not, use iPhone in store to photo record all sides of pack• Approx. 15,500+ unique products collected/year• Photos uploaded and OCR used to enter NFT and Ingredients • Data input – India and University of Toronto
10
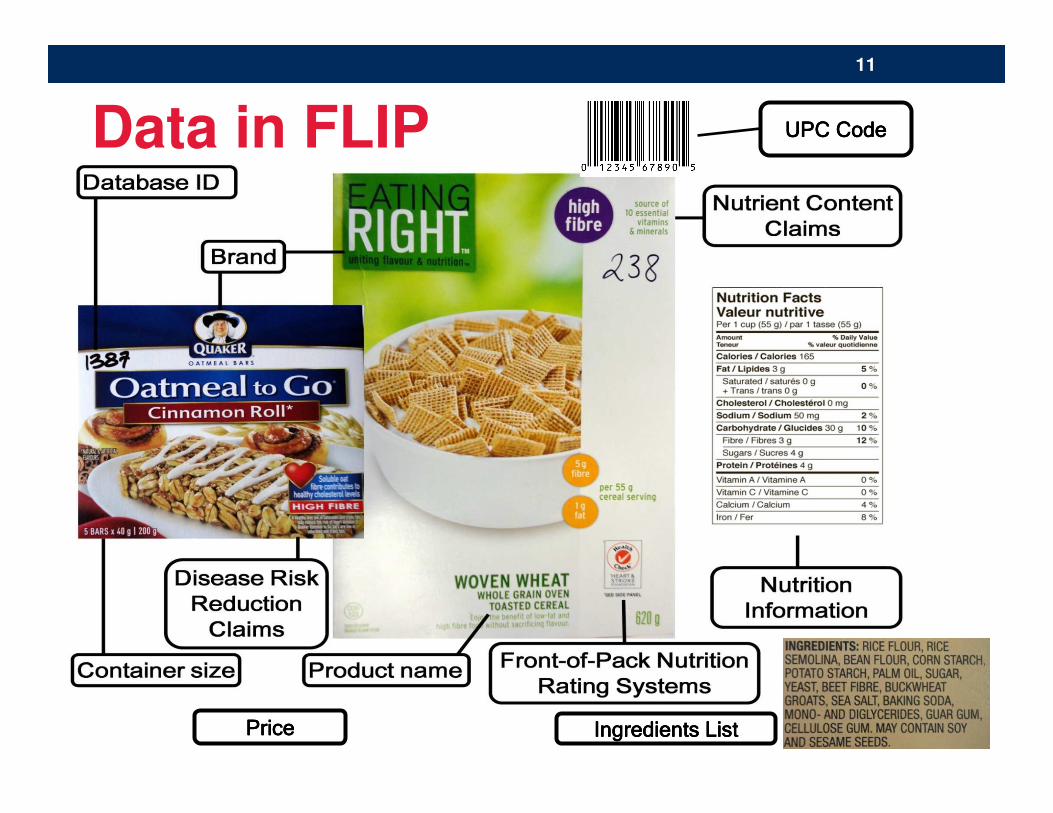
Data in FLIP
11
UPC CodeUPC CodeUPC CodeUPC Code
PricePricePricePrice Ingredients ListIngredients ListIngredients ListIngredients List
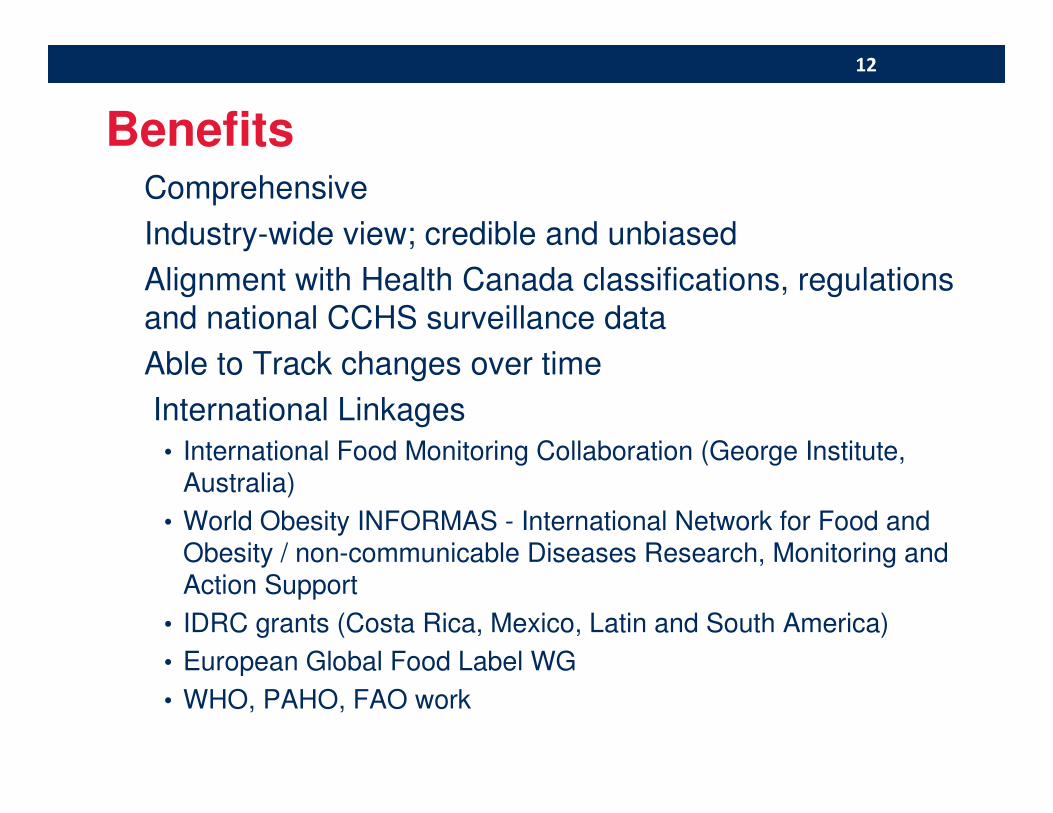
Benefitsü Comprehensive
ü Industry-wide view; credible and unbiased
ü Alignment with Health Canada classifications, regulations
and national CCHS surveillance data
ü Able to Track changes over time
ü International Linkages
• International Food Monitoring Collaboration (George Institute, Australia)
• World Obesity INFORMAS - International Network for Food and Obesity / non-communicable Diseases Research, Monitoring and Action Support
• IDRC grants (Costa Rica, Mexico, Latin and South America)
• European Global Food Label WG
• WHO, PAHO, FAO work
12
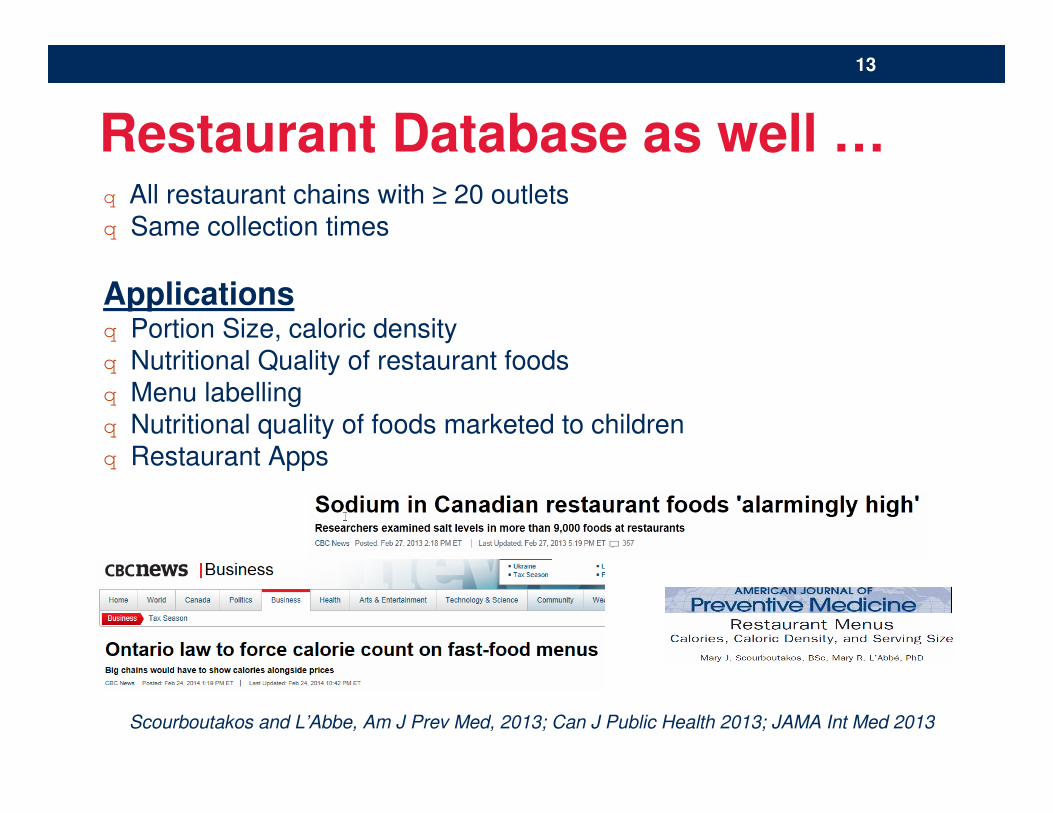
Restaurant Database as well …q All restaurant chains with ≥ 20 outletsq Same collection times
Applicationsq Portion Size, caloric densityq Nutritional Quality of restaurant foodsq Menu labellingq Nutritional quality of foods marketed to childrenq Restaurant Apps
13
Scourboutakos and L’Abbe, Am J Prev Med, 2013; Can J Public Health 2013; JAMA Int Med 2013
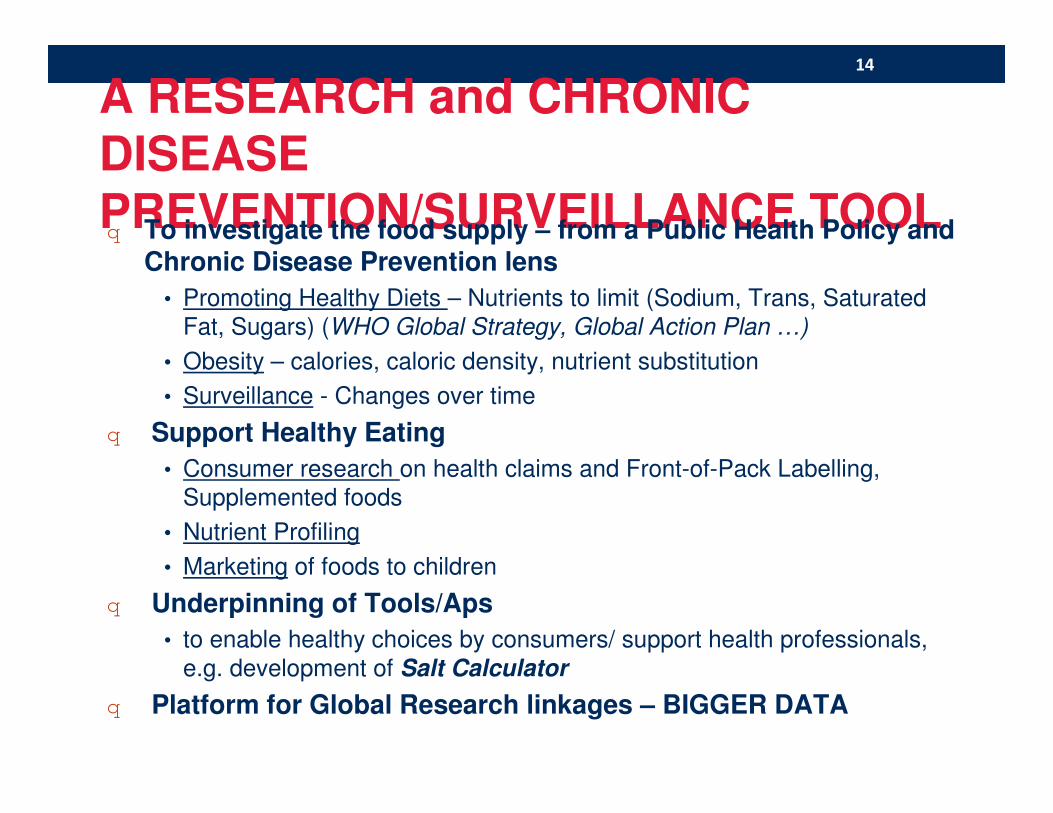
A RESEARCH and CHRONIC DISEASE PREVENTION/SURVEILLANCE TOOLq To investigate the food supply – from a Public Health Policy and
Chronic Disease Prevention lens
• Promoting Healthy Diets – Nutrients to limit (Sodium, Trans, Saturated
Fat, Sugars) (WHO Global Strategy, Global Action Plan …)
• Obesity – calories, caloric density, nutrient substitution
• Surveillance - Changes over time
q Support Healthy Eating
• Consumer research on health claims and Front-of-Pack Labelling,
Supplemented foods
• Nutrient Profiling
• Marketing of foods to children
q Underpinning of Tools/Aps
• to enable healthy choices by consumers/ support health professionals,
e.g. development of Salt Calculator
q Platform for Global Research linkages – BIGGER DATA
14
Monitoring and Surveillance: Sodium and Trans levels in Canadian foods
15
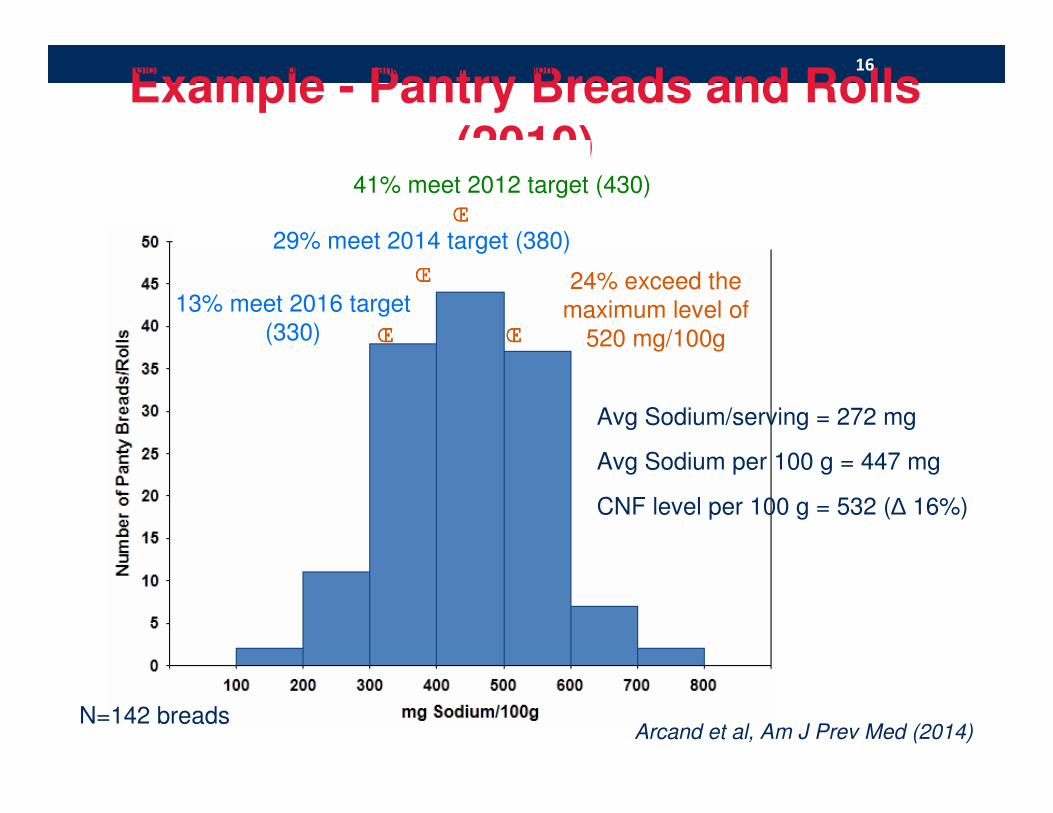
Example - Pantry Breads and Rolls (2010)
Avg Sodium/serving = 272 mg
Avg Sodium per 100 g = 447 mg
CNF level per 100 g = 532 (∆ 16%)
N=142 breads
41% meet 2012 target (430)
29% meet 2014 target (380)
13% meet 2016 target
(330)
24% exceed the
maximum level of
520 mg/100g
WHO (2008) Global Strategy – Framework to monitor and evaluate implementation
Arcand et al, Am J Prev Med (2014)
ŒŒŒŒ ŒŒŒŒ
ŒŒŒŒ
ŒŒŒŒ
16
Data Analysis: Trans Fat
17
Arcand J, Scourboutakos MJ, Au JTC, L’Abbe MR, AJCN 2014
18
0%
20%
40%
60%
80%
100%
Cof
fee
white
nerSho
rten
ing
Bro
wni
esM
arga
rine
Coo
kies
Popco
rn
Cak
esG
arlic
bre
ad
Cra
cker
s
Pies
Gra
nola
bar
s
Inst
ant N
oodles
Potat
o pro
ducts
Snack
Food
s
Bre
ad a
nd b
uns
Cro
issa
nts
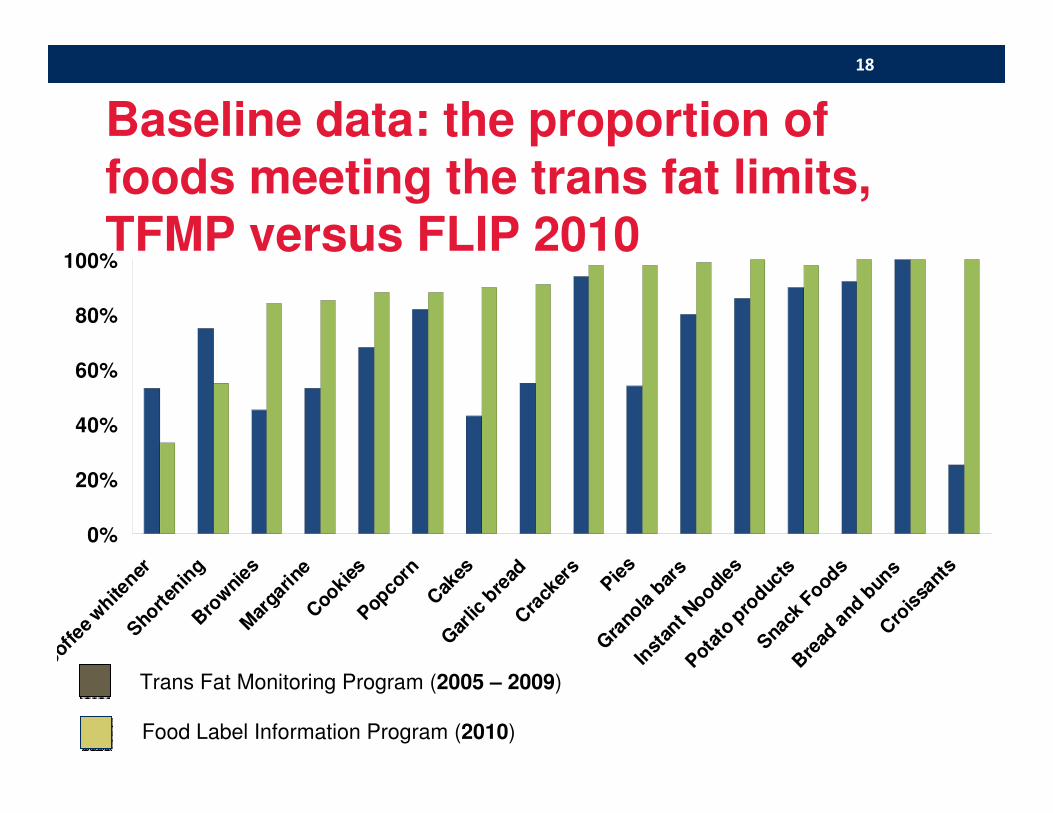
Trans Fat Monitoring Program (2005 – 2009)
Food Label Information Program (2010)
Baseline data: the proportion of foods meeting the trans fat limits, TFMP versus FLIP 2010
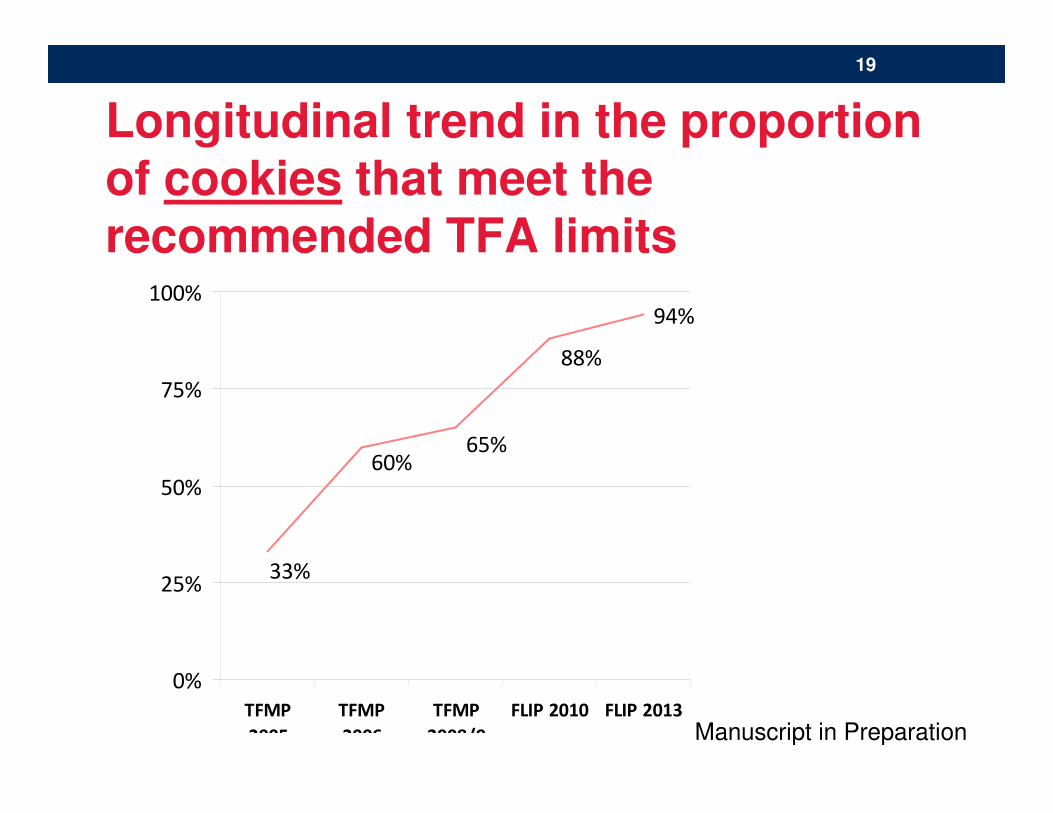
Longitudinal trend in the proportion of cookies that meet the recommended TFA limits
94%
33%
60%65%
88%
0%
25%
50%
75%
100%
TFMP
2005
TFMP
2006
TFMP
2008/9
FLIP 2010 FLIP 2013
19
Manuscript in Preparation
Consumer Tools and Aps
20
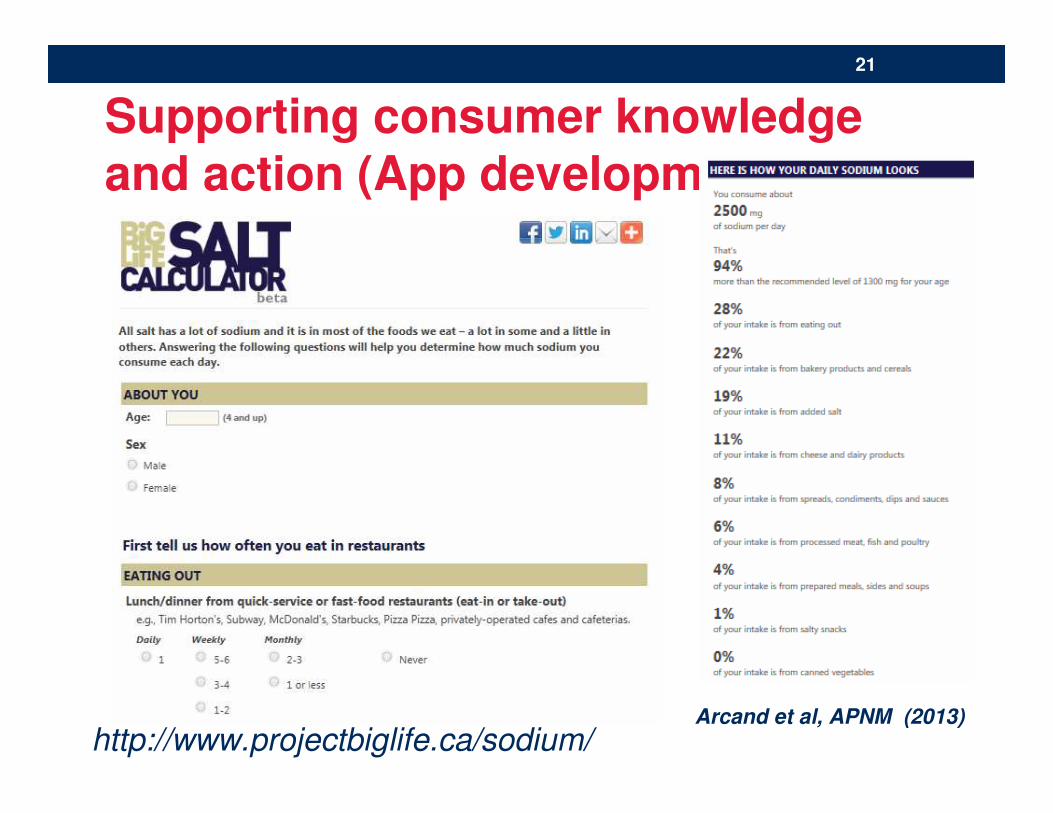
Supporting consumer knowledge and action (App development)
21
http://www.projectbiglife.ca/sodium/Arcand et al, APNM (2013)
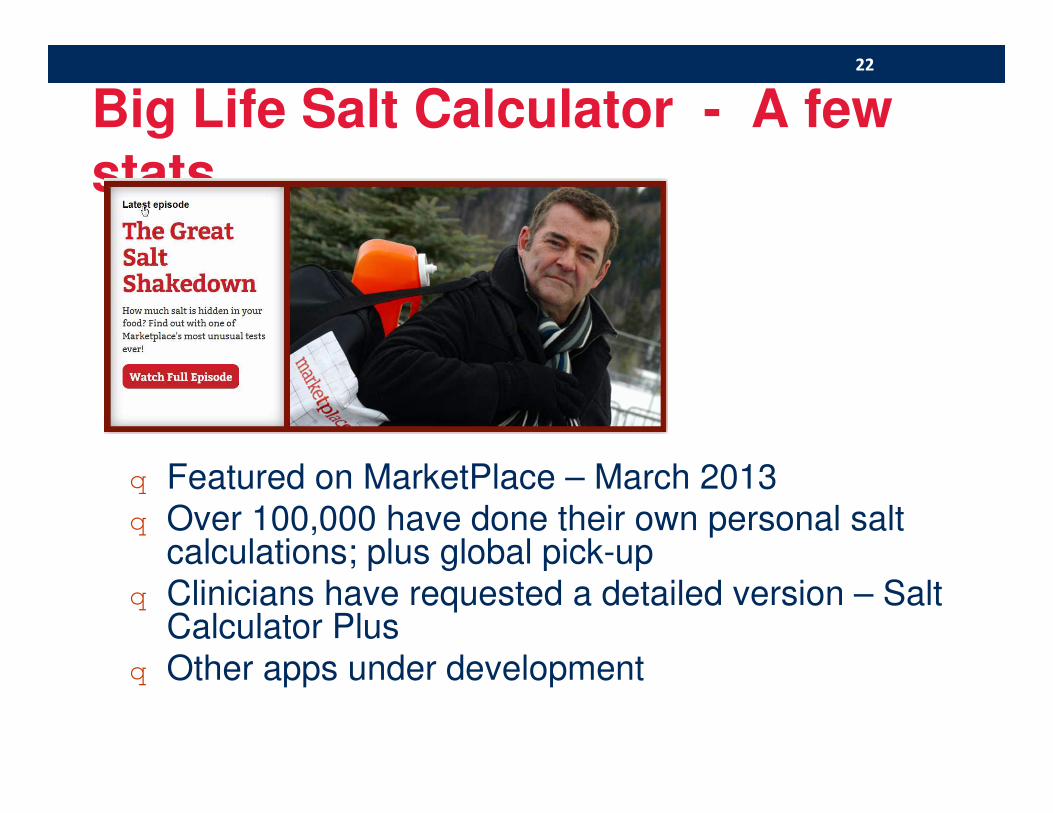
Big Life Salt Calculator - A few stats
q Featured on MarketPlace – March 2013q Over 100,000 have done their own personal salt
calculations; plus global pick-upq Clinicians have requested a detailed version – Salt
Calculator Plus
q Other apps under development
22
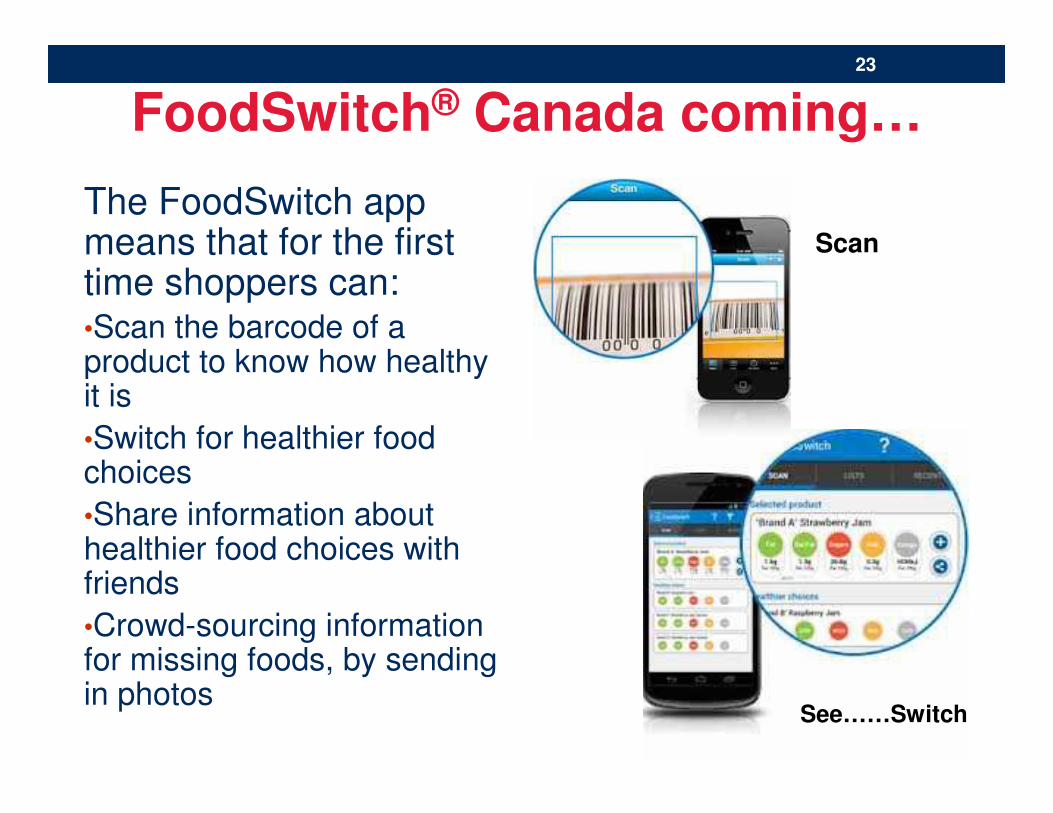
FoodSwitch® Canada coming…
The FoodSwitch app means that for the first time shoppers can:•Scan the barcode of a product to know how healthy it is
•Switch for healthier food choices
•Share information about healthier food choices with friends
•Crowd-sourcing information for missing foods, by sending in photos
23
Scan
See……Switch
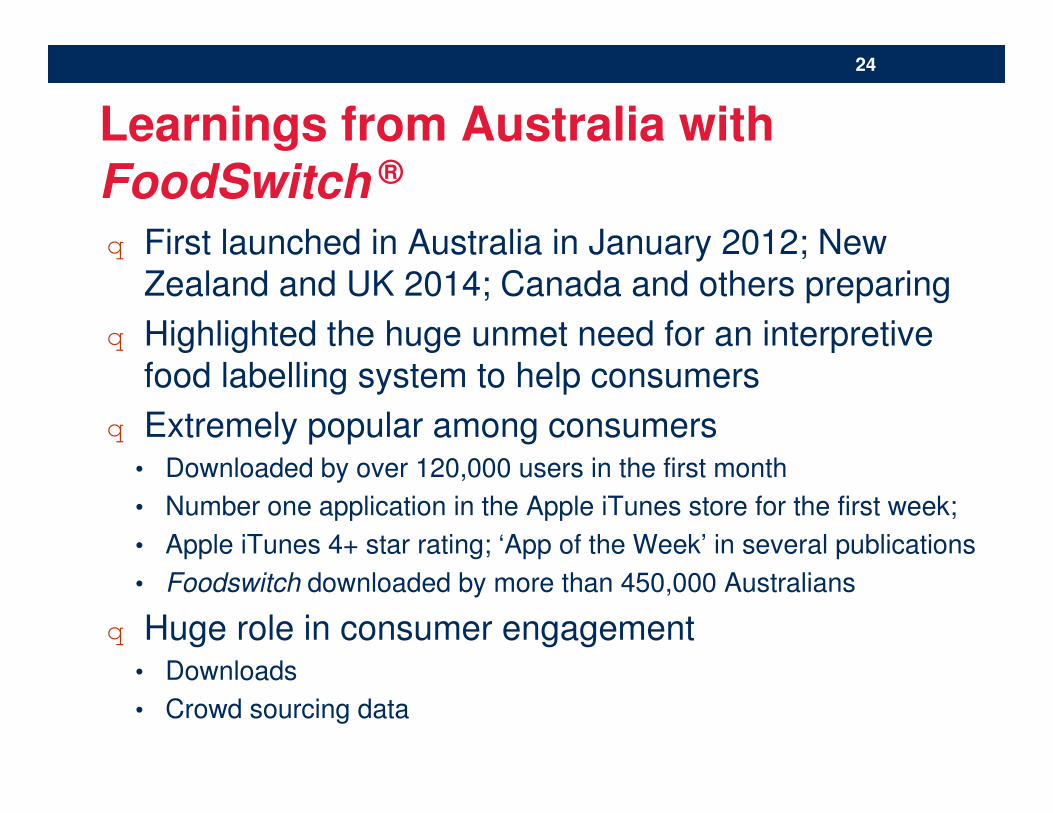
Learnings from Australia with FoodSwitch ®
q First launched in Australia in January 2012; New
Zealand and UK 2014; Canada and others preparing
q Highlighted the huge unmet need for an interpretive
food labelling system to help consumers
q Extremely popular among consumers• Downloaded by over 120,000 users in the first month
• Number one application in the Apple iTunes store for the first week;
• Apple iTunes 4+ star rating; ‘App of the Week’ in several publications
• Foodswitch downloaded by more than 450,000 Australians
q Huge role in consumer engagement• Downloads
• Crowd sourcing data
24
GLOBAL OVERVIEWWHERE TO NEXT?
25
INFORMAS - International Network for Food and Obesity/NCD Research, Monitoring and Action Support
Boyd Swinburn, Univ Auckland (PI)
26
See: Obesity Reviews (September 2013)
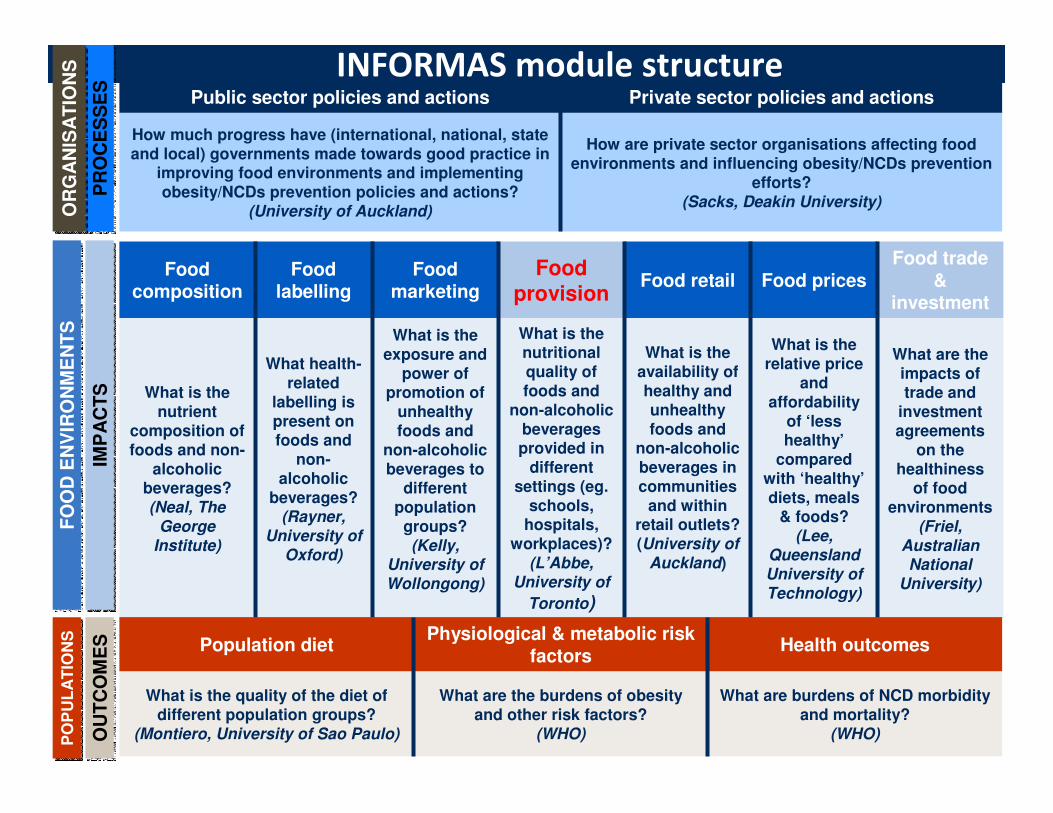
Public sector policies and actions Private sector policies and actions
How much progress have (international, national, state and local) governments made towards good practice in
improving food environments and implementing obesity/NCDs prevention policies and actions?
(University of Auckland)
How are private sector organisations affecting food environments and influencing obesity/NCDs prevention
efforts?(Sacks, Deakin University)
PR
OC
ES
SE
SP
RO
CE
SS
ES
IMP
AC
TS
IMP
AC
TS
OU
TC
OM
ES
OU
TC
OM
ES
Food composition
Foodlabelling
Food marketing
Food provision
Food retail Food pricesFood trade
& investment
What is the nutrient
composition of foods and non-
alcoholic beverages?(Neal, The
George Institute)
What health-related
labelling is present on foods and
non-alcoholic
beverages?(Rayner,
University of Oxford)
What is the exposure and
power of promotion of
unhealthy foods and
non-alcoholic beverages to
different population
groups?(Kelly,
University of Wollongong)
What is the nutritional quality of foods and
non-alcoholic beverages provided in
different settings (eg.
schools, hospitals,
workplaces)?(L’Abbe,
University of
Toronto)
What is the availability of healthy and unhealthy foods and
non-alcoholic beverages in communities
and within retail outlets?(University of
Auckland)
What is the relative price
and affordability
of ‘less healthy’
compared with ‘healthy’diets, meals
& foods?(Lee,
Queensland University of Technology)
What are the impacts of trade and
investment agreements
on the healthiness
of food environments
(Friel, Australian National
University)
Population dietPhysiological & metabolic risk
factorsHealth outcomes
What is the quality of the diet of different population groups?
(Montiero, University of Sao Paulo)
What are the burdens of obesity and other risk factors?
(WHO)
What are burdens of NCD morbidity and mortality?
(WHO)
INFORMAS module structureO
RG
AN
ISA
TIO
NS
OR
GA
NIS
AT
ION
SF
OO
D E
NV
IRO
NM
EN
TS
FO
OD
EN
VIR
ON
ME
NT
SP
OP
UL
AT
ION
SP
OP
UL
AT
ION
S
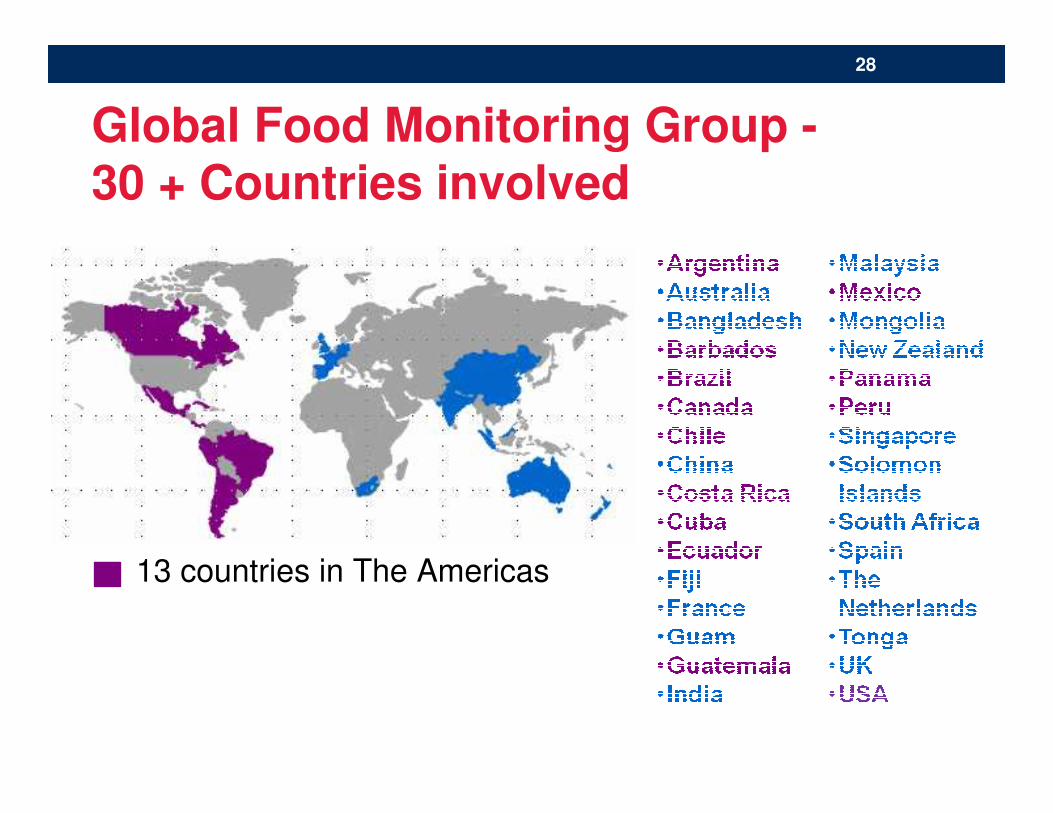
Global Food Monitoring Group -30 + Countries involved
13 countries in The Americas
28
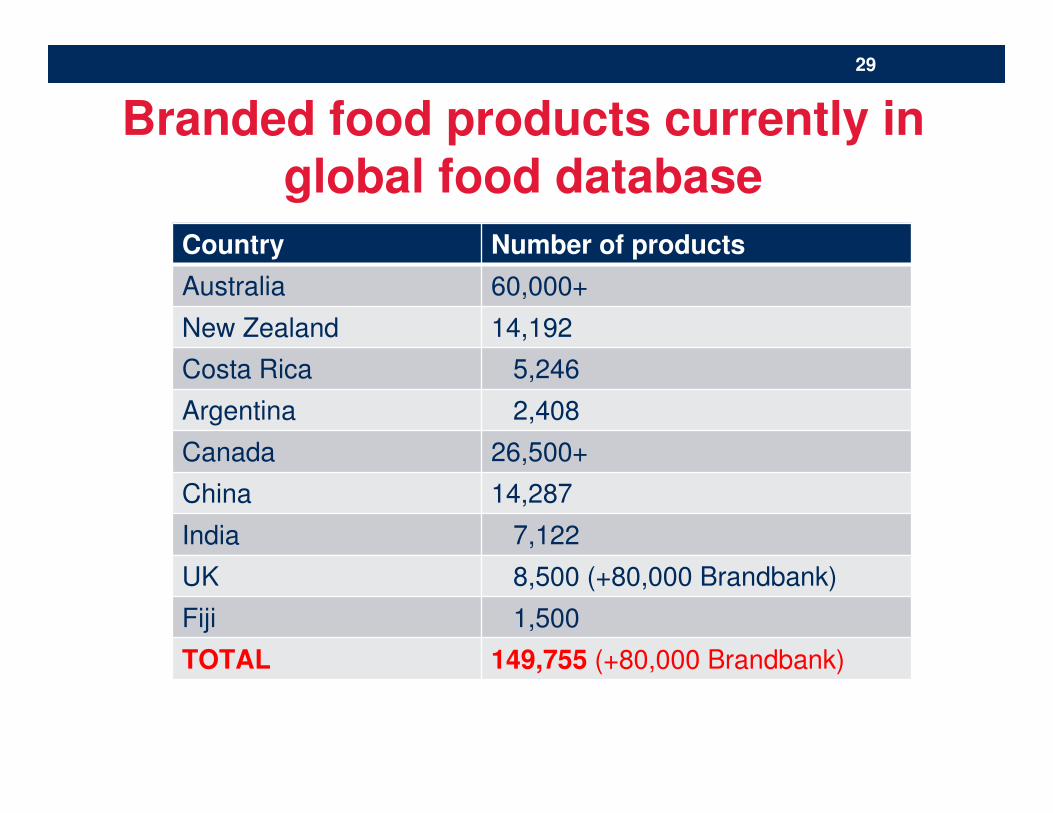
Branded food products currently in global food database
29
Country Number of products
Australia 60,000+
New Zealand 14,192
Costa Rica 5,246
Argentina 2,408
Canada 26,500+
China 14,287
India 7,122
UK 8,500 (+80,000 Brandbank)
Fiji 1,500
TOTAL 149,755 (+80,000 Brandbank)
Partnerships and networks lead to BIG DATA
q University of Toronto – L’Abbe group – food databases
q World Obesity - International Network for Food and
Obesity/NCD Research, Monitoring and Action Support
q George Institute, Australia – are collaborating for
FoodSwitch – as a starting point to “Canadianize”
q Dietitians of Canada – IT technical support; house and
maintain the FLIP database, web “cloud” access
q Many Granting Agencies such as CIHR; Canadian Stroke Network; IDRC; Rockefeller; WHO/FAO
q Burroughs-Wellcome Fund (2014-2019)
q Heart and Stroke Foundation of Canada
30
FundingResearch Team:JoAnne Arcand, PhD, RDMary Scourboutakos, BScChristina Wong, MScAlyssa Schermel, MScTeri Emrich, MPH, RDChelsea Murray, BScMavra Ahmed, MScMahsa Jessri, MScSheida Noorhosseini, BScJodi Bernstein, MPH
E.W. McHenry Endowed Chair(M. L’Abbe)
Acknowledgements
Thank You/Questions
Mary R. L’Abbe, PhDDepartment of Nutritional Sciences
Faculty of Medicine, University of Toronto
CollaboratorsDoug Manuel, OHRI, ICESBoyd Swinburn, U Auckland, NZBruce Neal, George Inst, U SydneyAdriana Blanco-Meltzer, INCENSAMarsha Sharpe, Dietitians CanadaWendy Lou, UofTYing Qi, MSc, UofTSpencer Henson, U GuelphJulio Mendoza, U GuelphMike Rayner, U Oxford, UKLaurette Dube. McGillDavid Buckeridge, McGill
Elizabeth Mansfield, Health Canada
31