Embed Size (px)
Citation preview
Heiber et al. redox imbalanced mutants 1
The rimb (redox imbalanced)-mutants of Arabidopsis thaliana differentiate signalling pathways for redox-regulation of chloroplast antioxidant enzymes
1
2
3
4
5
6
7
8
9
10
11
12
13
14
15
16
17
18
19
20
21
22
23
24
25
26
27
28 29 30
31
32
33
34
35
36
37
38
39
Isabelle Heiber1, Elke Ströher1, Bodo Raatz1, Ingo Busse2, Uwe Kahmann3, Mike W. Bevan4,
Karl-Josef Dietz1, Margarete Baier1*
1: Biochemistry and Physiology of Plants, Bielefeld University, Universitätsstraße 25, 33615
Bielefeld, Germany
2: Cell Biology, Bielefeld University, Universitätsstraße 25, 33615 Bielefeld, Germany
3: Zentrum für ultrastrukturelle Diagnostik im IIT, Universitätsstraße 25, 33615 Bielefeld,
Germany
4: Cell and Developmental Biology, John Innes Centre, Norwich NR4 7UH, England
*: Corresponding author: Margarete Baier
Biochemistry and Physiology of Plants
Bielefeld University - Faculty of Biology
Universitätsstrasse 25
33615 Bielefeld
Germany
Fon: +49-521-106-5586
Fax: +49-521-106-6039
e-mail: [email protected]
Keywords: redox signalling, chloroplast, gene expression, photosynthesis, antioxidants, 2-
Cys peroxiredoxin Running title: Expressional regulation of chloroplast antioxidant enzymes
Abbreviations: 2-Cys Prx: 2-Cys peroxiredoxin; 2CPA: 2-Cys Prx A gene; ABA: abscisic acid;
APx: ascorbate peroxidase; Asc: ascorbate; BAC: bacterial artificial chromosome; Csd: CuZn-
superoxide dismutase; DHA: dehydroascorbate; DTT: dithiothreitol; fw: fresh weight; IEP:
isoelectric point; Kcorr: Pearson correlation coefficient; GUS: β-glucuronidase; Kcorr 2CPA: Kcorr for
correlation of the transcript abundance with the transcript levels of 2CPA; NPQ: non-
photochemical quenching; PAGE: polyacrylamide gel electrophoresis; PQ: plastoquinone; PS:
photosystem; QA ox/red: oxidation / reduction state of QA; ΦPSII: quantum yield of PS-II; ROS:
reactive oxygen species
Plant Physiology Preview. Published on March 2, 2007, as DOI:10.1104/pp.106.093328
Copyright 2007 by the American Society of Plant Biologists
www.plantphysiol.orgon May 28, 2018 - Published by Downloaded from Copyright © 2007 American Society of Plant Biologists. All rights reserved.

Heiber et al. redox imbalanced mutants 2
Abstract 1
2
3
4
5
6
7
8
9
10
11
12
13
14
15
16
17
A network of enzymatic and non-enzymatic antioxidants protects chloroplasts from photo-
oxidative damage. With all enzymatic components being nuclear encoded, the control of the
antioxidant capacity depends on chloroplast-to-nucleus redox signalling. Using an Arabidopsis
reporter gene line expressing luciferase under control of the redox sensitive 2-Cys
peroxiredoxin A (2CPA) promoter, six mutants with low 2CPA promoter activity were isolated,
of which five mutants show limitations in redox-box regulation of the 2CPA promoter. In
addition to 2CPA, the transcript levels for other chloroplast antioxidant enzymes were
decreased, although a higher oxidation status of the ascorbate pool, a higher reduction state
of the plastoquinone pool and an increased oxidation status of the 2-Cys peroxiredoxin pool
demonstrated photooxidative stress conditions. Greening of the mutants, chloroplast ultra-
structure, steady state photosynthesis, and the responses to the stress hormone ABA were
wildtype-like. In the rosette state, the mutants were more sensitive to low CO2 and to H2O2.
Comparison of gene expression patterns and stress sensitivity characterizes the mutants as
redox-imbalanced in the regulation of nuclear encoded chloroplast antioxidant enzymes and
differentiates redox signalling cascades.
www.plantphysiol.orgon May 28, 2018 - Published by Downloaded from Copyright © 2007 American Society of Plant Biologists. All rights reserved.

Heiber et al. redox imbalanced mutants 3
Introduction 1
2
3
4
5
6
7
8
9
10
11
12
13
14
15
16
17
18
19
20
21
22
23
24
25
26
27
28
29
30
31
32
33
34
35
36
37
Photosynthesis provides a strong reducing power and a high risk for generation of reactive
oxygen species (ROS) particularly under environmental constrains (Foyer et al., 1994).
Accumulation of cytotoxic ROS is antagonized by superoxide dismutases, stromal and
thylakoid-bound ascorbate peroxidases (sAPx and tAPx), monodehydroascorbate and
dehydroascorbate reductases (MDHAR and DHAR), glutathione reductases (GR),
peroxiredoxins (Prx) and non-enzymatic reactions with the low molecular weight antioxidants
ascorbate (Asc) and glutathione (GSH) (Asada, 2000; Baier and Dietz, 1999a; Dietz et al.,
2006). Under unfavourable conditions, the biosynthesis and the activity of these antioxidants
increase (Foyer et al., 1994; Karpinski, 1997; Kliebenstein et al., 1998; Baier et al., 2000;
Rossel et al., 2002; Horling et al., 2003; Mittler et al., 2004) and stabilize the chloroplast redox
poise (Foyer et al., 1994; Asada, 2000).
Sequence analysis of plant plastomes and genomes revealed that all genes for chloroplast
antioxidant enzymes and all enzymes involved in the biosynthesis and the regeneration of low
molecular weight antioxidants are nuclear encoded. Therefore, regulation of gene expression
depends on chloroplast-to-nucleus signalling. Depending on the deviation from the cellular
redox homeostasis different signalling pathways have been hypothesised (Pfannschmidt et al.,
2001; Apel und Hirt, 2004; Foyer and Noctor, 2005; Baier and Dietz, 1999a and 2005): Class 1
signalling originates from specific redox pairs in the photosynthetic electron transport chain,
such as reduced and oxidized plastoquinone. Class 2 signalling depends on the redox state of
stromal redox pairs, such as the thioredoxin, glutathione and ascorbate pools, and class 3
signalling is triggered by ROS (Pfannschmidt, 2003; Dietz, 2003). Experimentally, nuclear
expression of chloroplast proteins has been shown to tentatively correlate with redox shifts in
the thioredoxin, NAD(P)/NAD(P)H, plastoquinone, glutathione and ascorbate pools
(summarized in: Foyer and Noctor, 2005; Baier and Dietz, 2005) on a high background level,
which is coordinated with chloroplast development and light signals (Pena-Ahumada et al.,
2006).
The Arabidopsis gene for 2-Cys peroxiredoxin-A (2CPA) (Baier and Dietz, 1997) serves as a
model in the analysis of chloroplast-to-nucleus redox signalling (Baier et al., 2004a). It
encodes a chloroplast peroxidase (König et al., 2002), which protects the photosynthetic
membrane against oxidative damage (Baier and Dietz, 1999b). The 314 bp promoter core
coordinates 2CPA transcription with leaf development (Baier et al., 2004a). Upstream of the
core promoter, a 216 bp cis-element provides responsiveness to redox signals (Baier et al.,
2004a) and regulates 2CPA expression depending on the redox state of the electron
acceptors of PS-I (Baier et al., 2004a). Putative signals are the redox states of ferredoxin,
stromal thioredoxins, NAD(P)H and the ascorbate and the glutathione systems (Baier and
www.plantphysiol.orgon May 28, 2018 - Published by Downloaded from Copyright © 2007 American Society of Plant Biologists. All rights reserved.

Heiber et al. redox imbalanced mutants 4
Dietz, 2005), which are class 2 redox signals according to the classifications by Pfannschmidt
(2003) and Dietz (2003).
1
2
3
4
5
6
7
8
9
10
11
12
13
14
15
16
17
18
19
20
21
22
23
24
25
26
27
28
29
30
31
32
33
34
35
36
37
The induction of genes encoding antioxidant enzymes upon oxidative stress conditions was
observed in various studies with transgenic plants and mutants (Baier et al., 2000;
Vandenabeele et al., 2004; Mittler et al., 2004). In signal transduction, chloroplast redox
signals interplay with the antioxidant activity of the regulated genes. For example, antisense
suppression of 2CPA expression specifically increases expression of sAPx, tAPx and MDHAR,
which counteract the loss of 2-Cys Prx function (Baier et al., 2000). However, tight linkage
between enzymatic and non-enzymatic reactions (Foyer et al., 1994; Fridlyand and Scheibe,
1999) limits experimental signal differentiation. Thus, the first models on chloroplast-to-nucleus
signal transduction were based on selective experimental data that need further substantiation
by genetic means (Pfannschmidt, 2003; Foyer and Noctor, 2005; Baier and Dietz, 2005; Baier
et al., 2006).
To address the redox signalling pathway(s) involved in the expressional control of the
chloroplast antioxidant system, a mutant screen was performed in Arabidopsis thaliana and
mutants were isolated based on decreased transcriptional activity of 2CPA. Low transcript
levels of other genes with compensatory function indicate expressional co-regulation. Here,
five mutants are presented, in which redox regulation of 2CPA through the 216 bp redox active
promoter domain is affected, and one with decreased activation of the core promoter. It is
shown that the mutational defects impact on the regulation of various genes for chloroplast
antioxidant enzymes and cause higher sensitivity of the mutants to H2O2 and low CO2.
Results
Isolation of mutants affected in 2CPA gene expression To isolate mutants affected in transcriptional regulation of a chloroplast antioxidant enzyme, a
mutant screen was performed in transgenic Arabidopsis thaliana expressing luciferase under
control of the 2CPA promoter (Baier et al., 2004a). Previous characterisation of the reporter
gene line (Baier et al., 2004a) demonstrated that transgene regulation copies 2CPA transcript
abundance regulation. For mutagenesis, the line T19-2 was selected, which carries a single
insertion of the reporter gene on the bottom arm of chromosome III close to BAC MQC12.
Seeds of the homozygous reporter gene line T19-2 were treated for 5 h with 50 mM ethyl
methanesulfonate to introduce random point mutations. 20.000 seedlings of the M2 progeny
were grown aseptically in constant light. At 10 days, the seedlings were individually screened
for decreased in vivo luciferase activity. At this stage of seedling development, in wildtype
plants 2CPA promoter activity is strong in primary leaves and hardly detectable in cotyledons
(Baier et al., 2004a). Plants with less than 2/3 of the reporter gene activity of the parental line
www.plantphysiol.orgon May 28, 2018 - Published by Downloaded from Copyright © 2007 American Society of Plant Biologists. All rights reserved.

Heiber et al. redox imbalanced mutants 5
were selected for further analysis (Fig. 1). To exclude artefacts due to lower luminescent areas
or unspecific defects in chloroplast development, only plants were selected which were
indistinguishable from the parental line at screening age in respect of size and colour. The
inheritance of the low reporter gene activity was tested in the progenies under the same
conditions. In 7 lines the decrease in luciferase expression was confirmed (Fig. 1).
1
2
3
4
5
6
7
8
9
10
11
12
13
14
15
16
17
18
19
20
21
22
23
24
25
26
27
28
29
30
31
32
33
34
35
36
37
38
Scoring the luciferase activity in the F2 progeny of the backcrosses to the parental line T19-2
in 10 day old seedlings demonstrated segregation of single recessive Mendelian loci (Suppl.
1). Strongest penetrance of the phenotype was observed in rimb1, rimb6 and rimb7 (Suppl. 1).
Because rimb2 and rimb3 were originally isolated from the same seed pool, they were tested
for genetic independence by mapping the mutations to chromosome arms. 1000 seedlings of
the F2 population of the mutants with Arabidopsis thaliana var. Landsberg erecta wildtype
(Ler) were screened and re-screened for low luciferase activity and genotyped with SSLP
markers designed against sequence length polymorphisms between the Arabidopsis ecotypes
Col-0 and Ler. Mapping of rimb3 to the middle section of the bottom arm of chromosome IV
and rimb2 to the top of the top arm of chromosome III demonstrated genetic independence.
Trans-activity of the mutations To test whether the mutations act in trans, RT-PCR analysis of 2CPA transcript amount was
performed with cDNA samples standardized on actin-2 transcript amount (Fig. 1). Like the
reporter gene activity, the transcript levels of the endogenous 2CPA gene were decreased in
10 day old seedlings grown under screening conditions. Due to different locations of the
reporter and the 2CPA gene on chromosome III and lack of transcript sequence similarity, it
can be concluded that the mutations act on the regulatory elements of the 2CPA promoter,
which the reporter gene and the endogenous gene have in common.
Photosynthetic electron transport in the rimb-mutants Regulation of 2CPA transcription correlates with the photosynthetic electron pressure at the
acceptor site of photosystem-I (Baier et al., 2004a). To analyse whether the mutants are
affected in photosynthetic electron transport, steady state chlorophyll-a fluorescence patterns
were determined. The effective quantum yield (ΦPSII = FV´/FM´) reflects the efficiency by which
PS-II transforms excitation energy into chemical energy (Schreiber and Bilger, 1993). In 3
week old rimb-mutants, ΦPSII was determined throughout the day with single saturating light
flashes (every 60 min, beginning 30 min after on-set of light). All mutants, except the highly
chlorotic rimb4, showed a wildtype-like ΦPSII around 0.7 (Fig. 2). In rimb4, it was reduced to
0.387 - 0.466 (Fig. 2) demonstrating a severe mutational impact on photosynthetic
performance. As photosynthetic electron transport controls 2CPA promoter activity (Baier et
al., 2004a), rimb4 was excluded from the further analysis.
www.plantphysiol.orgon May 28, 2018 - Published by Downloaded from Copyright © 2007 American Society of Plant Biologists. All rights reserved.

Heiber et al. redox imbalanced mutants 6
Target element in the 2CPA promoter 1
2
3
4
5
6
7
8
9
10
11
12
13
14
15
16
17
18
19
20
21
22
23
24
25
26
27
28
29
30
31
32
33
34
35
36
37
In the 2CPA promoter, regulation of the 314 bp minimal promoter coordinates the expression
intensity with chloroplast development, while redox-regulation takes place on the 216 bp redox
box located upstream of the minimal promoter (Baier et al., 2004a). To distinguish, whether
the mutants are affected in regulation of the minimal promoter or in regulation of the redox-
box, mesophyll protoplasts isolated from 3 week old mutants and the parental line were
transfected with equal amounts of GUS-reporter gene plasmids encoding glucuronidase under
control of either the 314 bp minimal promoter (D1) or the 530 bp promoter fragment (D3),
which includes the 216 bp redox-box (Baier et al., 2004a). The GUS-activity was quantified
after 6 h incubation at a light intensity of 50 µmol quanta m-2 s-1 (Fig. 3). For comparison, the
protoplast preparation and DNA quality were standardized by setting the ratio of D3- and D1-
GUS-expression in T19-2 protoplasts to 100%. In rimb1, rimb2, rimb3, rimb5 and rimb7 less
activation of the longer promoter fragment than the 314 bp promoter of the redox-box resulted
in lower D3/D1-ratios. In rimb6 the D3/D1-ratio was similar to T19-2 demonstrating that the
mutational defects do not specifically affect regulation of the redox-box (Fig. 3).
ABA-responsiveness of the mutants In wildtype plants, the 216 bp redox-sensitive promoter fragment also mediates ABA
responsiveness (Baier et al., 2004a). To test whether low 2CPA expression resulted from
increased ABA-responsiveness, 9 day old seedlings grown in 50 µmol quanta m-2 s-1 were
screened for luciferase activity 3 h after application of 40 µM ABA to 100 µl medium. Like in
T19-2, the luciferase activity was decreased in all mutants by approximately 60 % (Fig. 4). In
addition, no differences between T19-2 and the mutants were observed in physiological tests
for ABA-responsiveness, such as germination on 0 - 1 µM ABA (Koornneef et al., 1984) and
wilting (Finkelstein, 1994), with six independent seed batches (Fig. 4).
Light regulation of 2CPA promoter activity Under low light conditions of 50 µmol quanta m-2 s-1 1 h after onset of illumination, the reporter
gene activity was not significantly different from that in the parental line T19-2 (Fig. 5A). 2 h
illumination with 400 µmol quanta m-2 s-1 increased the relative reporter gene activity in rimb1,
rimb2 and rimb7 demonstrating light intensity dependent induction of gene expression (Fig.
5A).
In seedlings adapted to 100 µmol quanta m-2 s-1, which is in our growth chambers a light
intensity yielding optimal biomass production, 5h illumination with 400 µmol quanta m-2 s-1
decreased the reporter gene activity stronger in all mutants than in T19-2 indicating stronger
responses to photosynthetic signals (Fig. 5B).
www.plantphysiol.orgon May 28, 2018 - Published by Downloaded from Copyright © 2007 American Society of Plant Biologists. All rights reserved.

Heiber et al. redox imbalanced mutants 7
Content and redox state of low molecular weight antioxidants The redox state and the pool size of low molecular weight antioxidants and cellular thiols are
indicators for the cellular redox state (Foyer et al., 1994). In all mutants with low 2CPA
promoter activity the ascorbate pool was more oxidized than in the parental line (Fig. 6B). In
rimb1, rimb3, rimb5, rimb6 and rimb7, the ascorbate pool size was increased (Fig. 6A). The
glutathione pool size was decreased in rimb1 (Fig. 6C), while in rimb2, rimb3 and rimb5 trends
towards slightly less glutathione were observed. However, in all mutants, except rimb1, the
glutathione pool was kept reduced demonstrating that the shift in the cellular redox poise was
almost specific to ascorbate, while the redox state of the major cellular thiol pool was kept
widely balanced.
1
2
3
4
5
6
7
8
9
10
11
12
13
14
15
16
17
18
19
20
21
22
23
24
25
26
27
28
29
30
31
32
33
34
35
36
37
Content and redox state of 2-Cys peroxiredoxin In all rimb-mutants, consistent with decreased transcript abundance, the 2-Cys peroxiredoxin
protein level was decreased. As a marker for oxidative stress inside chloroplasts, the redox
state of 2-Cys peroxiredoxin was determined by 1-D and 2-D gel electrophoresis. Depending
on the redox state and the regeneration potential by thiol-disulfide isomerases, such as
thioredoxins, 2-Cys Prx dimers can be covalently linked by non, one or two disulfide bonds
(König et al., 2002). For analysis of intermolecular disulfide bonds, proteins were immediately
extracted in SDS-containing buffer and analysed on 20% polyacrylamide gels. Compared to
the parental line T19-2, in the rimb-mutants increased relative amounts of dimers were
detected, which are linked by only one disulfide bond (mono-disulfide dimer) (Fig. 7). In rimb1,
rimb2, rimb3 and rimb5, the amount of non-covalently linked 2-Cys Prx (dissociated into
monomers) was decreased demonstrating a higher propensity to form intermolecular disulfide
bonds, such as by insufficient reductive regeneration of the active site (König et al., 2002 and
2003). In contrast, in rimb6 and rimb7 the amount of the non-covalently linked 2-Cys Prx form
was increased indicating either higher 2-Cys Prx regeneration or accumulation of sulfinic acid
derivates of 2-Cys Prx protein.
For differentiation between reduced and oxidized 2-Cys Prx, the proteins were separated
electrophoretically according to their isoelectric point after reductive cleavage of the disulfide
bonds with DTT and freezing of the thiol groups by iodoacetamide (Sheehan, 2006). For
reduced 2-Cys Prx an isoelectric point (IEP) of 6.54 was determined. In the parental line, 45 %
of the protein had an IEP 6.32 and of a small portion of 2-Cys Prx one of about 6.21. Oxidation
of fresh protein extracts with H2O2 partially oxidized the protein resulting in IEPs of 6.21, 6.12
and 6.05.
In all rimb-mutants the amount of the oxidized 2-Cys Prx form with an IEP of 6.21 was
increased and that of the reduced form immobilizing at pH 6.54 was decreased. In addition, in
rimb2, rimb5, rimb6 and rimb7 oxidized 2-Cys Prx forms accumulated, which were only
www.plantphysiol.orgon May 28, 2018 - Published by Downloaded from Copyright © 2007 American Society of Plant Biologists. All rights reserved.

Heiber et al. redox imbalanced mutants 8
detected in H2O2-treated proteins samples of the parental line T19-2, but not in untreated T19-
2 samples.
1
2
3
4
5
6
7
8
9
10
11
12
13
14
15
16
17
18
19
20
21
22
23
24
25
26
27
28
29
30
31
32
33
34
35
36
37
Growth habit of the mutants Although indistinguishable at screening age, from 2 weeks onwards the mutants grew slower
than the parental line under long-days (14 h light). In plants older than 3 - 4 weeks, under long
day illumination early leaf senescence (rimb1) and chlorosis (rimb3 and rimb5) developed
randomly and starch (especially in rimb5 and rimb6) and anthocyanins (especially in rimb6)
accumulated (Tab. 1). The strongest phenotype was observed in rimb4, which turned highly
chlorotic soon after expansion of the primary leaves. Indicating severe pleiotropic defects,
including decreased photosynthetic activity (Fig. 2), rimb4 was excluded from further analysis.
By contrast, when grown under short day illumination (10 h light), only subtle phenotypic
differences were observed in the other rimb-mutants (data not shown).
Chloroplast ultrastructure
Redox imbalances can affect chloroplast development, which can influence gene expression
of chloroplast proteins (Rizhsky et al., 2003). Therefore, the chloroplast ultra-structure was
analysed in the rimb-mutants. In young mutant leaves, which show the most pronounced
differences in 2CPA transcript amount compared to the parental line, the chloroplast ultra-
structure was wildtype-like. Small starch granules were observed in chloroplasts of rimb1 and
rimb5 (data not shown). At the mature stage, transitory starch accumulated in all rimb-mutants.
Most starch was observed in chloroplasts of rimb5, in which one big starch granule with low
electron density was formed, and in rimb6, in which several granules with high electron density
were observed. In parallel to starch accumulation, thylakoid stacking was decreased by 1-3
layers in rimb5 and rimb6, while rimb2 and rimb3 showed slightly stronger (2 - 3 layers) grana
stacking than T19-2 (data not shown).
Performance of the mutants in low CO2
To test the performance of the mutants under stress conditions, 4 week old plants were
exposed to 50 ppm CO2 for 8 and 16 h, respectively. After the treatment, the plants were
transferred to standard growth conditions (350 ppm CO2). Reduced CO2-availability restricts
ribulose-1,5-bisphosphate carboxylation and favours ribulose-1,5-bisphosphate oxygenation.
Here, the low-CO2-treatment was started with the on-set of light to avoid carbohydrate
biosynthesis prior to activation of ribulose-1,5-bisphosphate oxygenation. Low CO2 supports
H2O2 and superoxide production by photorespiration (Ogren, 1984) and photoreduction of O2
(Fridlyand and Scheibe, 1999). Increased ROS generation demands for extra antioxidant
protection. Consistently, the expression of many antioxidant enzymes, including 2CPA, is
www.plantphysiol.orgon May 28, 2018 - Published by Downloaded from Copyright © 2007 American Society of Plant Biologists. All rights reserved.

Heiber et al. redox imbalanced mutants 9
induced in wildtype plants and protects the leaves against photooxidative damage (Baier et al.,
2004a; Wormuth et al., 2006).
1
2
3
4
5
6
7
8
9
10
11
12
13
14
15
16
17
18
19
20
21
22
23
24
25
26
27
Two days after the 8 h CO2-deprivation treatment, strong chlorosis was observed in rimb2 and
rimb3 (Fig. 8A left). To a lesser extend the chlorophyll content decreased all over the leaf
blades in rimb1, rimb5 and rimb6. Under the same conditions, it only decreased in the leaf tips
in T19-2. 48 h after the 16 h treatment with 50 ppm CO2 (Fig. 8A right), in rimb1, rimb2, rimb3
and rimb6 all leaves, which exposed to low CO2 in the pre-mature state, were highly chlorotic.
96 h after the treatment (data not shown) the leaves were completely bleached, while less
leaves were affected in the parental line. Leaves formed during the post-fumigation period and
the leaves of rimb5, which had highest starch contents (Tab. 1) developed no visible damage.
Effect of H2O2 application on the mutants Because low CO2-availability can increase H2O2 production (Ogren, 1984), the mutants were
tested for their sensitivity to exogenously supplied H2O2. Leaf discs of 5 week old plants were
floated for 8 h on 20 mM H2O2. ΦPSII was analysed as an indicator for chloroplast damage. In
the mutants, H2O2 application decreased ΦPSII stronger than in the parental line (Fig. 9A). In
addition, chlorophyll degradation was enhanced (except in rimb7) (Fig. 9B) demonstrating that
the mutants are more sensitive to H2O2. Rimb5, which barely responded to low CO2 (Fig. 7)
showed highest sensitivity to H2O2.
To analyse whether the higher sensitivity to H2O2 might be caused by decreased catalase
levels, catalase protein amounts were detected immunochemically in samples standardized on
the same protein amount. In the rimb-mutants the catalase levels were wildtype-like or slightly
increased (Fig. 9C). In addition, guaiacol peroxidase activity was increased in the mutants
demonstrating higher extra-cellular and cytosolic peroxidase activity (Fig. 9D), while 2-Cys Prx
protein levels were decreased (Fig. 7).
Gene expression in mature leaves Transcript amount regulation patterns in wildtype Arabidopsis 28
29
30
31
32
33
34
35
36
37
To identify candidate genes for transcript analysis in the mutants, transcript amount data for
223 putatively redox regulated genes were selected from 249 publicly available Affimetrix Chip
experiments with Arabidopsis thaliana pre-mature and mature leaves. Pearson correlation
coefficients were calculated for all combinations of selected genes, which cover all genes for
Halliwell-Asada-Cycle enzymes (chloroplast superoxide dismutases, ascorbate peroxidases,
glutathione reductase, mono- and dehydroascorbate reductase), peroxiredoxins, the small
electron carrier proteins thioredoxins, glutaredoxins and cyclophilins and nuclear encoded
components of the photosynthetic electron transport chain. In addition, a set of genes for
cytosolic enzymes with expressional response to the carbohydrate availability (e.g. triose
www.plantphysiol.orgon May 28, 2018 - Published by Downloaded from Copyright © 2007 American Society of Plant Biologists. All rights reserved.
Heiber et al. redox imbalanced mutants 10
phosphate isomerase and glucose-6-phosphate dehydrogenase) and extra-plastidic
antioxidant enzymes (e.g. cytosolic glutathione reductase and the three catalases) were
included as references.
1
2
3
4
5
6
7
8
9
10
11
12
13
14
15
16
17
18
19
20
21
22
23
24
25
26
27
Closest co-regulation with 2CPA (At3g11630) was observed for chloroplast cyclophilin
AtCyp20-3 (At3g62030; Kcorr 2CPA = 96,0 %) (Suppl. 2), which supports the peroxidase activity
of 2-Cys Prx (Laxa et al., 2007), followed by two cytochrome b6f subunits (PetC (At4g03280)
and PetM (At2g26500)), plastocyanin PetE2 (At1g20340), two cab-transcripts (Lhca2
(At3g61470) and Lhcb4.1 (At5g01530)), various thioredoxins (At1g43560, At4g03520,
At1g50320, At3g15360, At3g02730, At3g02730, At1g69880), two chloroplast glutaredoxins
(Grx-CxxS14 (At3g54900); Grx-CxxS12 (At2g20270)), ferredoxin-thioredoxin reductase
(At5g08410) and NADP-malate dehydrogenase (At5g58330). The only other antioxidant
enzyme with a Kcorr 2CPA higher than 60 % was PrxIIE (At3g52960; Kcorr 2CPA = 69,6 %), which
encodes, like 2CPA, a chloroplast peroxiredoxin.
The transcript abundances of components of the Halliwell-Asada-Cycle, e.g. CuZn-SOD Csd2
(At2g28190) and tAPx (At1g77490) and sAPx (At4g08390), were negatively correlated with
2CPA transcript levels. This indicates either independent regulation or strong compensatory
responses similar to gene expression regulation observed in transgenic and mutant plants with
decreased activity of one specific antioxidant enzyme (Baier et al., 2000; Vandenabeele et al.,
2004; Mittler et al., 2004). A distance tree drawn by equivalently weighting the correlation
coefficients for all pairs of genes clustered the transcript abundance regulation of these genes
into several distantly related groups (Suppl. 2). Bioinformatic comparison of promoter
sequences by sequence similarity analysis by CREDO (Cis-Regulatory Element Detection Online;
http://mips.gsf.de/proj/regulomips) and comparison of putative transcription factor binding sites
after MatInspector analysis (Cartharius et al., 2005) supported the hypothesis that each gene
is regulated by an individual pattern of signals, which is suited for mutant based signal
transduction analysis.
Regulation of redox regulated genes in the rimb-mutants 28
29
30
31
32
33
34
35
36
37
To study the impact of the mutations on gene expression regulation, RT-PCR was performed 1
h after on-set of light with cDNA of 3 week old plants adapted to 100 µmol quanta m-2 s-1.
Samples from three independently grown batches of plant material were standardized on
actin-2 transcript amount (At5g09810). The specificity of the primers (Tab. 2) and the
amplification reaction was confirmed by sequence analysis of the amplified products. The
transcript levels of the four chloroplast peroxiredoxins 2CPA (At3g11630), 2CPB (At5g06290),
PrxQ (At3g26060), PrxIIE (At3g52960), and that of sAPx (At4g08390) and tAPx (At1g77490),
MDHAR (At1g63940), chloroplast γECS (At4g23100), chloroplast NADP-malate
dehydrogenase (NADP-MDH; At5g58330), chloroplast CuZn-superoxide dismutase (Csd2;
www.plantphysiol.orgon May 28, 2018 - Published by Downloaded from Copyright © 2007 American Society of Plant Biologists. All rights reserved.

Heiber et al. redox imbalanced mutants 11
At2g28190), cytosolic glutathione reductase (cytGR; At3g54660), lipoxygenase-2 (Lox2;
At3g45140), ferredoxin (Fd; PetF1; At1g60950), Lhcb2.2 (At2g05070) and catalase 2 (Cat2;
At4g35090) and the genes for several proteins supporting 2-Cys Prx activity (Dietz et al.,
2006), namely chloroplast thioredoxin-m3 (Trx-m3; A2g15570) and thioredoxin-x (At1g50320;
Collin et al., 2003), CDSP32 (At1g76080; Broin et al., 2002) and the NADPH-thioredoxin
reductase - C (NTRC; At2g41680; Moon et al., 2006) and the cyclophilin Cyp20-3 (At3g62030;
Laxa et al., 2007) were tested for their transcript abundance in 3 week old rimb-mutants (Fig.
10).
1
2
3
4
5
6
7
8
9
10
11
12
13
14
15
16
17
18
19
20
21
22
23
24
25
26
27
28
29
30
31
32
33
34
35
36
2CPA transcript amount was decreased in all rimb-mutants demonstrating persistence of the
mutational defects in the rosette stage. However, consistent with a low expression intensity of
2CPA in older tissues (Baier et al., 2000), the relative differences between T19-2 and the
mutants were less than at screening age (Fig. 1). In parallel to low 2CPA expression, the
transcript levels of Cyp20-3, Trx-x, PrxIIE, chloroplast MDHAR and NADPH-MDH were
decreased in all rimb-mutants (highest Spearman correlation). The mRNA levels of Lhcb2.2
were unchanged and that of Fd (At1g60950), Trx-m3 (At2g15579), cytGR (At3g54660), Lox2
(At3g45140) and peroxisomal Cat2 (At4g35090) were increased. The other genes showed
mutant specific expression regulation (Fig. 10). The strongest relative decrease in transcript
abundance in all rimb-mutants was observed for Cyp20-3. The Pearson correlation coefficient,
which quantitatively weights the similarity in transcript abundance, was highest for γECS (Kcorr
2CPA = 0.841).
Comparing the mutants for transcript abundance regulation, Pearson correlation coefficient
higher than 0.97 were observed between rimb1, rimb2 and rimb3, between rimb3 and rimb7
and between rimb6 and rimb7. Considering only the genes for chloroplast antioxidant enzymes
the transcript abundance regulation of rimb1 and rimb2 (Kcorr = 0.627) separated from that of
rimb3, rimb5 and rimb7 (Kcorr = 0.713 - 0.742), while rimb6 showed the most specific gene
expression pattern.
Discussion
To address pathways involved in the expressional regulation of chloroplast antioxidant
enzymes, a mutant screen was performed in Arabidopsis thaliana expressing luciferase under
control of the 2CPA promoter. Six mutants were isolated with trans-active mutational defects in
activation of 2CPA transcription (Fig. 1). All mutations were recessive (Suppl. 1), showed
gradual differences in penetrance (Suppl. 1) and resulted in individually different phenotypes
(Tab. 1) and expression patterns (Fig. 10).
www.plantphysiol.orgon May 28, 2018 - Published by Downloaded from Copyright © 2007 American Society of Plant Biologists. All rights reserved.

Heiber et al. redox imbalanced mutants 12
The rimb-mutants represent a novel type of mutants 1
2
3
4
5
6
7
8
9
10
11
12
13
14
15
16
17
18
19
20
21
22
23
24
25
26
27
28
29
30
31
32
33
34
35
36
37
Screening for decreased expression of a chloroplast antioxidant enzyme distinguishes the
rimb-mutants from mutants like rax1 (Ball et al., 2004) and axl8 (Rossel et al., 2006), which
express cytosolic ascorbate peroxidase APx2 stronger than wildtype. Rax1 carries a mutation
in γ-glutamylcysteine synthase (Ball et al., 2004) limiting the first step of glutathione
biosynthesis (Mullineaux and Rausch, 2005). Thus, APx2 expression is induced by the
decreased availability of the low molecular weight antioxidant glutathione (Ball et al., 2004). In
contrast, in the rimb-mutants 2CPA promoter activity was decreased despite a higher oxidation
state of the ascorbate pool (Fig. 6) and of oxidation of 2-Cys Prx protein (Fig. 7), which is a
chloroplast-specific marker for oxidative stress (Baier and Dietz, 1997; König et al., 2003),
demonstrating that gene expression regulation is uncoupled from redox sensing.
In knock-down lines of chloroplast CuZn superoxide dismutase (SOD-kd) (Rizhsky et al.,
2003) the expression of various nuclear encoded chloroplast proteins involved in
photosynthesis was decreased in response to oxidative chloroplast damage. In contrast, in the
rimb-mutants expression of cab genes (e.g. Lhcb2.2; Fig 10) and chloroplast ultrastructure
(data not shown) were unaffected. The quantum yields of photosystem-II (ΦPSII = FV/FM) were
wildtype-like indicating high photosynthetic electron transport efficiency and a high oxidation
state of intrinsic components of the photosynthetic electron transport chain (Schreiber and
Bilger, 1993) (Fig. 2). Consistent with not or much less inhibited photosynthesis in the rimb-
mutants, unlike the SOD-kd, only a subset of nuclear encoded chloroplast proteins was
affected in gene expression regulation (Fig. 10). Five mutants, namely rimb1, rimb2, rimb3,
rimb5 and rimb7, were specifically limited in the activation of the recently identified 216 bp
redox-sensitive promoter domain (Baier et al., 2004a) (Fig. 3). The low activation of the redox-
box in five rimb-mutants and the limitation in regulation of the minimal promoter in rimb6,
resulted in decreased transcript abundance of several, but not all tested nuclear encoded
chloroplast enzymes (Fig. 10), suggesting that both types of mutants represent novel classes
of Arabidopsis mutants suited for studying chloroplast-to-nucleus signalling.
rimb6 Transcript abundance regulation of rimb6 was most distinct from that of the other rimb-mutants
(Fig. 10). Since the activity of the 530 bp promoter element (D3) was decreased to the same
extend as the 314 bp distal promoter element (D1) (Fig. 3), rimb6 is not primarily affected in
redox-box regulation. Comparison with transgene regulation of the parental line (Fig. 1 and 3)
suggests regulatory defects in activation of the 314 bp promoter core, which contains R-, G-
and I-boxes known for coordination of nuclear gene expression with chloroplast development
upon greening and in dependence of light availability (Donald and Cashmore, 1990).
Chloroplast-nucleus coordination in greening Arabidopsis seedlings has been intensively
www.plantphysiol.orgon May 28, 2018 - Published by Downloaded from Copyright © 2007 American Society of Plant Biologists. All rights reserved.

Heiber et al. redox imbalanced mutants 13
studied in recent years using mutant approaches. However, unlike e.g. the gun-mutants
(genomes uncoupled) (Mochizuki et al., 2001), cue1 (cab-underexpressed; Li et al., 1995) and
immutans (Wu et al., 1999), rimb6 was not affected in greening (Fig. 9B) and chloroplast
development (data not shown) and the flu-mutant (fluorescence) (Meskauskiene et al., 2001),
rimb6 did not show defects in chlorophyll biosynthesis upon greening of etiolated seedlings
(data not shown). rimb6, like the other rimb-mutants, is also distinct from Arabidopsis mutants
with altered regulation of nuclear expression of chloroplast proteins, such as the hcf-mutants
(high chlorophyll fluorescence), which were screened for high chlorophyll fluorescence
(Meurer et al., 1996), because photosynthetic electron transport (Fig. 2) was wildtype like. It is
therefore concluded that rimb6 represents a novel mutant type with disturbed coordination of
nuclear expression of specific chloroplast proteins, such as MDHAR, Cyp20-3 and sAPx (Fig.
10).
1
2
3
4
5
6
7
8
9
10
11
12
13
14
15
16
17
18
19
20
21
22
23
24
25
26
27
28
29
30
31
32
33
34
35
36
37
Five of the rimb-mutants are affected in redox regulation of gene expression The five other rimb-mutants were limited in activation of the promoter elements which provide
responsiveness to redox signals correlating with the electron pressure at the acceptor site of
photosystem-I (Baier et al., 2004a) (Fig. 3). Consistent with this conclusion, a five-fold
increase of light on top of limited light availability (Fig. 5A) activated 2CPA promoter activity by
stimulating the promoter core, while increased light availability on top of the regular growth
light intensity (Fig. 5B) resulted in a lower level of relative reporter gene activation in rimb1,
rimb2, rimb3, rimb5 and rimb7 than in the parental line.
Previously it was shown that redox-regulation of the 2CPA redox-box depends on ABA (Baier
et al., 2004a). ABA-dependent suppression of 2CPA promoter activity (T19-2 in Fig. 4A)
suggested that in the rimb-mutants low 2CPA expression may result from increased
responsiveness to ABA. However, no difference in ABA-responsiveness of 2CPA promoter
activity (Fig. 4A) and ABA-regulated phenotypes such as wilting (Fig. 4C) and germination
(Fig. 4B) were observed in any rimb-mutant.
The rimb-mutants showed higher sensitivity to an increase in the light intensity (Fig 5B), to low
CO2 (Fig. 8A and B) and to H2O2 (Fig. 9A) and developed stress phenotypes with leaf age
(Tab. 1). Consistently, increased oxidation of the ascorbate pool (Fig. 6B) and accumulation of
oxidized 2-Cys Prx (Fig. 7) mirrored redox imbalances. In rimb1 and rimb3 the portion of non-
covalently linked 2-Cys Prx was decreased demonstrating that the redox imbalances mainly
impacted on reductive regeneration of the thiol residues by thiol-disulfide isomerase, such as
thioredoxin (König et al., 2002). In contrast, in rimb6 and rimb7 determination of the
dimerization status and the isoelectric points indicated increased amounts of monomers, in
which the cysteinyl residues are hyperoxidized and cannot form disulfide bonds (König et al.,
2003). In rimb5, rimb6 and rimb7 increased amounts of 2-Cys Prx forms with IEPs between
www.plantphysiol.orgon May 28, 2018 - Published by Downloaded from Copyright © 2007 American Society of Plant Biologists. All rights reserved.

Heiber et al. redox imbalanced mutants 14
6.05 and 6.22 are consistent with accumulation of ascorbate, which is an alternative marker for
oxidative stress (Foyer et al., 2004). Stronger oxidation of the ascorbate pool and increased
oxidation of 2-Cys Prx, but decreased transcript levels of various chloroplast antioxidant
enzymes in rimb1, rimb2, rimb3, rimb5 and rimb7 (Fig. 10), illustrates the mutations in redox-
signalling.
1
2
3
4
5
6
7
8
9
10
11
12
13
14
15
16
17
18
19
20
21
22
23
24
25
26
27
28
29
30
31
32
33
34
35
36
37
Pearson correlation analysis of the transcript levels of nuclear encoded chloroplast antioxidant
enzymes grouped rimb1 with rimb2 and rimb3 with rimb5 and rimb7 indicating two sub-types
of mutants. Stronger decreased transcript levels of 2CPA, sAPx, tAPx, γECS and Csd2
suggest that the penetrance of the mutational defects on transcript abundance regulation is
stronger in rimb1 and rimb2. It is concluded that rimb1 and rimb2 are mutated in more central
elements of the signal transduction pathway or affected in stronger regulators than rimb3,
rimb5 and rimb7.
Defects in redox-box regulation do not affect typical ROS-pathways Depending on the extent of deviation from cellular homeostasis, various kinds of signalling
cascades have been postulated to mediate chloroplast-to-nucleus redox-signalling. These
range from sensing of the redox state of the plastoquinone pool to responsiveness to ROS
signals (summarized in: Pfannschmidt et al., 2001; Foyer and Noctor, 2005; Baier and Dietz,
2005). To date, most attention has been given to ROS-induced signalling cascades, which are
involved in responses to pathogens and photooxidative stress (Mahalingam et al., 2003;
Mateo et al., 2004; Suzuki and Mittler, 2005). Results from genome array hybridizations
allowed selection of marker genes for specific types of ROS signals (op den Camp et al.,
2003; Suzuki and Mittler, 2005; Gadjev et al., 2006). The increased oxidation states of the
ascorbate pool (Fig. 6) and of 2-Cys Prx protein (Fig. 7) display deviation from the cellular
redox homeostasis (Fig. 6). Up-regulation of transcript levels of Cat2 and Lox2 (Fig. 10)
(Desikan et al., 2001; Kiddle et al., 2003), of the singlet oxygen marker BAP1 (At3g61190) and
of the superoxide / H2O2-marker gene Fer1 (At5g01600; op den Camp et al., 2003; data not
shown) demonstrated activation of stress-induced genes in all rimb-mutants. In addition, the
transcript levels of ferredoxin (Fd; At1g60950) and thioredoxin-m3 (At2g15570) were
increased, which encode chloroplast redox proteins involved in distribution of electrons from
the photosynthetic electron transport chain, while 2CPA, PrxIIE, Cyp20-3, MDHAR and Trx-x
transcript levels were decreased (Fig. 10).
Lox2 expression is induced e.g. by insufficient antioxidant protection by ascorbate (Kiddle et
al., 2003) and in light regimes promoting photosystem-I activity (Fey et al., 2005), stimulating
superoxide formation in the Mehler reaction (Mehler, 1951) and resulting in oxidation of the
glutathione pool (Fey et al., 2005). In signal transduction, jasmonate transmit the redox-signals
and activate Lox2 via the NPR1-dependent signalling pathway (Spoel et al., 2003). Consistent
www.plantphysiol.orgon May 28, 2018 - Published by Downloaded from Copyright © 2007 American Society of Plant Biologists. All rights reserved.

Heiber et al. redox imbalanced mutants 15
with the conclusion on independent redox signal transduction mechanisms drawn from the
transcript abundance pattern depicted in figure 10, 2CPA transcription is insensitive to
jasmonate (and salicylate) (Baier et al., 2004a).
1
2
3
4
5
6
7
8
9
10
11
12
13
14
15
16
17
18
19
20
21
22
23
24
25
26
27
28
29
30
31
32
33
34
35
36
Compared to ROS-signalling in pathogenesis and under excess photosynthetic excitation
energy (summarized in: Mullineaux et al., 2006; Torres et al., 2006), little is known about the
mechanisms controlling nuclear expression of chloroplast antioxidant enzymes upon less
severe redox imbalances (Baier and Dietz, 2005). Recently, Davletova et al. (2005) reported
that in response to insufficient cytosolic H2O2 detoxification, the chloroplastic H2O2-scavenging
system collapses by oxidative inhibition of the enzyme function. However, the steady state
level of APx activity was elevated during early light stress (Davletova et al., 2005). Since the
activity of stromal and thylakoid ascorbate peroxidases is highly sensitive to H2O2 (Asada,
2000; Miyake et al., 2006), it implicates expressional induction of chloroplast APx. In the rimb-
mutants, the redox shift in the ascorbate pool (Fig. 6) and increased oxidation of 2-Cys Prx
protein (Fig. 7) demonstrated intracellular redox-imbalances. Like in 2-Cys Prx antisense lines,
which resemble the rimb-mutants in respect to (i.) low 2CPA expression (Fig. 1, 8C and 10),
(ii.) the shift in the redox state of the ascorbate pool (Fig. 6), (iii.) an unchanged redox-state of
the glutathione pool (Fig. 6) and (iv.) wildtype-like chlorophyll and protein levels in young
tissues (Tab. 1), an induction of sAPx, MDHAR and / or tAPx transcript levels can be expected
(Baier et al., 2000). However, only in rimb7 higher transcript levels were observed for the two
APx genes (Fig. 10). In parallel, this mutant showed highest 2CPA transcript levels and
strongest 2-Cys Prx reduction in the rosette state (Fig. 7, 10) demonstrating that in rimb7 the
(developmental) penetrance of the mutational defects is weak.
In the other rimb-mutants induction of sAPx, tAPx and MDHAR expression was either missing
or only the transcript level of one of the genes was increased (Fig. 10). As shown in the
ascorbate biosynthetic mutant vtc1 (Kiddle et al., 2003), tissue levels of ascorbate correlate
with sAPx transcript levels and ascorbate decreases tAPx transcript abundance. Comparing
vtc1 with wildtype plants, and adg1 and pgr1 mutants, Wormuth et al. (2006) described
recently an 86 % correlation of 2CPA transcript abundance with the oxidation state of the
ascorbate pool. The ascorbate level was at least slightly increased in the rimb-mutants and the
ascorbate pool more oxidized (Fig. 6). Consequently, in the rimb-mutants the correlation
between ascorbate availability and the expression of sAPx, tAPx and 2CPA (Kiddle et al.,
2003; Wormuth et al., 2006) was broken. In contrast, the correlation between the ascorbate
pool size and redox state was maintained for Lox2 expression (Kiddle et al., 2003). It is
concluded, that a specific signalling pathway is affected in the rimb-mutants, which is distinct
from induction of Lox2, Cat2, Fd and Trx-m3.
www.plantphysiol.orgon May 28, 2018 - Published by Downloaded from Copyright © 2007 American Society of Plant Biologists. All rights reserved.

Heiber et al. redox imbalanced mutants 16
Regulation of several chloroplast antioxidant enzymes is coupled 1
2
3
4
5
6
7
8
9
10
11
12
13
14
15
16
17
18
19
20
21
22
23
24
25
26
27
28
29
30
31
32
33
34
35
36
37
Even stronger than the 2CPA transcript levels, the relative transcript levels of Cyp20-3 were
decreased, which encodes a cyclophilin promoting 2-Cys Prx activity (Laxa et al., 2007). The
relative changes in transcript abundance were subjected to Pearson correlation analysis. Only
a correlation coefficient of +0.491 was observed between 2CPA and Cyp20-3 in three week
old rimb-mutants (Fig. 10), while it was 0.960 in wildtype plants (Suppl. 2). The difference
suggests that the two genes are transcriptionally co-regulated, but independently post-
transcriptionally regulated.
In addition to Cyp20-3, the transcript levels of thioredoxin-x, MDHAR, PrxIIE, and tAPx were
decreased in the five mutants which are affected in redox-box regulation (Fig. 3; 10). Lack of
sequence similarities excludes post-transcriptional regulation, such as control by microRNAs
or transcript stabilizing proteins (Sunkar et al., 2006; Lee et al., 2006) and, therefore,
demonstrates transcriptional co-regulation.
The transcript levels of most other tested nuclear encoded chloroplast antioxidant enzymes
(2CPB, PrxQ, sAPx, Csd2) and redox-active proteins (MDH, CDSP32, NTRC) were
differentially regulated in the various mutants. For 2CPB, PrxQ, sAPx, Csd2, MDH, CDSP32
and NTRC increased transcript levels in some mutants showed that the transcript levels are
not exclusively dependent on the mutated signalling pathway, consistent with hypothesis on
regulatory networks by transcript correlation analysis in wildtype Arabidopsis (Suppl. 2). For
example, the 2CPB promoter contains strong ethylene response elements (data not shown),
by which gene expression can secondarily and independently be induced (Fig. 10). Thus,
comparative transcriptome analysis of the rimb-mutants provides insight into the cross-talk
between parallel induced, compensatory signalling cascades in addition to demonstrating
common links between the expressional regulation of nuclear encoded chloroplast proteins.
Conclusions This report describes the isolation and biochemical characterisation of novel mutants with
decreased expression of 2CPA and other genes for chloroplast antioxidant enzymes. Low
expression of various genes with compensatory regulation in wildtype plants (Fig. 1, 10; Suppl.
2), demonstrates co-regulation by common signalling pathways. For rimb1, rimb2, rimb3,
rimb5 and rimb7 the mutational defects limited redox activation of the 2CPA promoter.
Comparison of transcript abundance regulation in rimb1 and rimb2 with rimb3, rimb5 and
rimb7 showed tight co-regulation of MDHAR, γECS, Cyp20-3, Trx-x and tAPx with 2CPA than
sAPx and Csd2. The novel type of mutant presented here give genetic evidence for the
independence of lately defined redox-signalling pathways (e.g. Pfannschmidt et al., 2001;
Foyer and Noctor, 2005; Baier and Dietz, 2005; Gadjev et al., 2006) and differentiate signalling
cascades. The co-suppression of genes for various chloroplast antioxidant enzymes under
www.plantphysiol.orgon May 28, 2018 - Published by Downloaded from Copyright © 2007 American Society of Plant Biologists. All rights reserved.

Heiber et al. redox imbalanced mutants 17
oxidizing conditions and the separation of redox-box regulation from induction of marker genes
for ROS-signalling, such as Cat2, Lox2, BAP1 and Fer1 (Kiddle et al., 2003; op den Camp et
al., 2003), represent two steps towards understanding inter-compartment redox signalling.
1
2
3
4
5
6
7
8
9
10
11
12
13
14
15
16
17
18
19
20
21
22
23
24
25
26
27
28
29
30
31
32
33
34
35
36
Materials and Methods Plant material and growth conditions Arabidopsis thaliana wildtype plants and mutants were grown on soil under controlled
conditions (long day illumination: 14 h light (70 - 100 µmol quanta m-2 s-1) and 23 °C / 10 h
dark and 18 °C; 45 - 55 % relative humidity) unless otherwise specified. Leaf disks were cut
with an 8 mm cork screw from the leaf blades of mature leaves of 5 week old plants and
incubated upside up on the indicated medium in the light (100 µmol quanta m-2 s-1). For the
CO2-fumigation experiment, the plants were transferred to a 28 l perspex chamber and
fumigated with synthetic air controlled by a Millipore Tylan RO 7030 system. For in vitro growth
seeds were surface-sterilized with 80% ethanol followed by 20% (v/v) household bleach,
washed at least 5 times with sterile water, stratified at 4 °C for 2 days in the dark and
germinated on MS-medium (Duchefa Biochemie BV, Haarlem, The Netherlands) containing
0.5 or 1 % (w/v) sucrose, respectively. Plants were grown in constant light at 20 °C and 10 -
400 µmol quanta m-2 s-1 or in cycling light as described for soil-grown plants. Effectors were
applied to the medium.
Isolation of the rimb-mutants and genetic analysis Approximately 200 mg seeds of a homozygous 2CPA:Luc reporter gene line (Baier et al.,
2004a) were treated with a 50 mM ethyl methanesulfonate (EMS; Sigma, Poole, UK) for 5 h.
The mutagenized M1 seeds were sown in 100 pools on soil. The harvested M2 seeds were
surface sterilized and grown in microtiter plates on MS-medium containing 1 % sucrose in
continuous light. After 10 days growth a total of 20,000 M2 seedlings, representing 2000 M1
plants were screened using a Victor Luminometer (Wallac, Perkin-Elmer, Boston, USA). Five
minutes after spraying with a 1 mM luciferin (Duchefa, Haarlem, The Netherlands), 0.01 %
(v/v) Triton X-100 solution, luciferase activity was measured for 1 s. Seedlings showing lower
luminescence than the parental line were selected for further analysis. The progenies were re-
screened under the same conditions for confirmation of the inheritance of the low-luciferase
phenotype. To show the independence of the mutants, the mutations were mapped to
chromosome arms from the F2 population of crosses to Arabidopsis ecotype Landsberg erecta
(Ler) according to Jander et al. (2002). Selection and confirmation of low-luciferase lines was
performed as described for isolation from the mutagenized seedling population.
www.plantphysiol.orgon May 28, 2018 - Published by Downloaded from Copyright © 2007 American Society of Plant Biologists. All rights reserved.

Heiber et al. redox imbalanced mutants 18
Gene expression analysis 1
2
3
4
5
6
7
8
9
10
11
12
13
14
15
16
17
18
19
20
21
22
23
24
25
26
27
28
29
30
31
32
33
34
35
36
37
RNA-isolation and RT-PCR was performed as described in Baier et al. (2000). The cDNA
samples were standardized on actin-2 transcript amount. The transcripts of the genes of
interest were amplified using gene-specific primers. The primer sequences and AGI codes are
given in table 1. The signal intensities were quantified from the fluorogrammes of ethidium
bromide stained DNA separated on agarose gels using the GELSCAN software package
(BIOSCITECH, Marburg, Germany) and normalized to the transcript abundance observed in
the parental line. Representative examples from three independent experiments are shown.
Protein extraction, 2-D and 1-D gel electrophoresis and Western-blot-Analysis For 1-D Western-blot analysis mature leaves were extracted in 1.44 % (w/v) Glycine, 0.303 %
(w/v) Tris, 2 % (w/v) SDS either in the presence or absence of 2% (v/v) 2-mercaptoethanol,
separated in 20 % resolving gels after addition of 1 volume 2x loading buffer and analysed as
described in Baier and Dietz (1997). Band intensities were quantified using the GELSCAN
software package (BIOSCITECH, Marburg, Germany).
For 2-D gel electrophoresis the plant material was extracted at the ratio of 1:10 with 50 mM
Tris-HCl pH 8.0, 1 mM PMSF supplemented with 20 mM DTT or 20 mM H2O2, respectively.
Following precipitation with trichloroacetic acid (Amme et al., 2006) the proteins were
dissolved in sample buffer (8 M urea; 4% (w/v) CHAPS (3-[(3-
cholamidopropyl)dimethylamonio]-1-propanesulfonate); 60 mM DTT; 2% (v/v) Pharmalyte 4-7
(GE-Healthcare / Amersham); 0.002 % (w/v) bromophenol blue). For each genotype, 350 µg
protein were separated on 18-cm-strips with immobilized pH gradient of 4-7 (GE Healthcare/
Amersham) in an IPGphor Unit (GE Healthcare/Amersham) using the following settings: 12 h
30 V, 2 h 60 V, 1 h 500 V, 1 h 1000 V and 8000 V for a total of about 60 kVh. After two 15 min
equilibration steps in 50 mM Tris–HCl (pH 8.8), 6 M urea, 30% (v/v) glycerol, 2% (w/v) SDS,
0.01% (w/v) bromophenol blue, first supplemented with 1 % (w/v) DTT and then with 2.5 %
(w/v) iodoacetamide, the stripes were mounted on 12 % SDS–polyacrylamide gels (Baier and
Dietz, 1997) and separated for 45 min at 50 mA. 2-Cys Prx proteins was detected after
Western blotting (Baier and Dietz, 1997) with anti-2-Cys Prx antibody and SuperSignal West
Pico Chemiluminescent Substrate (Pierce, USA).
Analysis of expressional regulation patterns For analysis of co-regulation of 223 putatively redox regulated genes, from the signal
intensities published in 249 publicly available Affimetrix cDNA Chip experiments with pre-
mature and mature Arabidopsis leaf tissues (http://affymetrix.arabidopsis.info/AffyWatch.html)
the Pearson correlation coefficients were calculated for all possible pairs of genes. For the
distance plot (Suppl. 1) the data ranging from -1 to +1 were transformed by f(x) = (1+x) / 2 and
www.plantphysiol.orgon May 28, 2018 - Published by Downloaded from Copyright © 2007 American Society of Plant Biologists. All rights reserved.

Heiber et al. redox imbalanced mutants 19
analysed with PAUP matrix using PHYLIP online (http://evolution.genetics.washington.-
edu/phylip/phylipweb.html) and plotted into a distance tree.
1
2
3
4
5
6
7
8
9
10
11
12
13
14
15
16
17
18
19
20
21
22
23
24
25
26
27
28
29
30
31
32
33
34
35
36
37
38
Metabolite analysis Ascorbate, glutathione, chlorophyll, pheophytin and protein contents were determined as
described in Baier et al. (2000) and guaiacol peroxidase activity as described in Baier and
Dietz (1999b). Starch levels were measured as glucose after digestion with α-amylase and
amylo-glucosidase as described in Baier et al. (2004b), with the exception that the starch
content was standardized on fresh weight. H2O2 amounts were quantified enzymatically at 436
nm in a reaction mixture containing 100 mM K2HPO4/KH2PO4 pH 6.5 and 0.05 % (v/v) guaiacol
(Sigma) with 4 U horse radish peroxidase (Sigma).
Protoplast isolation and transfection Protoplasts were isolated from 3 week old T19-2 and the mutants as described in Seidel et al.
(2004) and transfected in parallel with the reporter gene constructs D1 and D3 (Baier et al.,
2004) according to Seidel et al. (2005). After 6 h incubation at 20 µmol quanta m-2 s-1, the
glucuronidase activity was quantified according to Abel and Theologis (1998). To normalize
protoplast and plasmid quality D3-driven glucuronidase activity was standardized on D1-driven
activity and on the activity observed in the parental line T19-2.
Hormone sensitivity tests For physiological ABA sensitivity tests, germination of 2 - 8 week old seeds from 6
independent harvests was analysed on MS-plates containing 1% (w/v) sucrose and 0.4 %
(w/v) phytagel (Sigma) and supplemented with 0 - 1 µM ABA (Sigma). After 7 days the number
of seeds with emerged roots was counted. Wilting was quantified by monitoring cotyledon
wrinkling of seedlings grown in high humidity after exposure to 25-30 % relative humidity.
Electron microscopy of Arabidopsis chloroplasts was performed with leaves of 5 week old
plants grown under long-day illumination as described by König et al. (2002) using the
contrasting method B by Engels et al. (1997).
Chlorophyll-a-fluorescence measurements
The quantum yield of photosystem II (ΦPSII = FV/FM) was measured every hour beginning 30
min after on-set of light under growth conditions using the Mini-PAM Fluorometer (Walz,
Effeltrich, Germany). Light flashes of 2000 µmol quanta m-2 s-1 were given to analyse the
maximum fluorescence. Calculation of photosynthetic parameters was performed as described
by Schreiber and Bilger (1993).
www.plantphysiol.orgon May 28, 2018 - Published by Downloaded from Copyright © 2007 American Society of Plant Biologists. All rights reserved.

Heiber et al. redox imbalanced mutants 20
Acknowledgements 1
2
3
4
5
6
7
8
9
10
11
12
13
14
15
16
17
18
19
20
21
22
23
24
25
26
27
28
29
30
31
32
33
34
35
36
37
We thank Daniela Ledebrink, Lea Johanning, and Rachel Holman for technical assistance,
Prof. Jürgen Feierabend for the catalase antibody and Thorsten Seidel and Fred Rook for
technical advice. The work was supported by the DFG (FOR 387; Ba2011/2) and Bielefeld
University.
References Abel S, Theologis A (1998) Transient gene expression in protoplasts of Arabidopsis thaliana.
Meth Mol Biol 82: 209-217
Amme S, Matros A, Schlesier B, Mock HP (2006) Proteome analysis of cold stress response
in Arabidopsis thaliana using DIGE-technology. J Exp Bot 57:1537-1546.
Apel K, Hirt H (2004) Reactive oxygen species: Metabolism, oxidative stress, and signal
transduction. Annual Rev Plant Biol 55: 373 - 399 Asada K (2000) The water-water cycle as alternative photon and electron sink. Philos
Transact Royal Soc 355: 1419-1431
Baier M, Dietz K-J (1997) The plant 2-Cys peroxiredoxin BAS1 is a nuclear-encoded
chloroplast protein: its expressional regulation, phylogenetic origin, and implications for
its specific physiological function in plants. Plant J 12: 179-190
Baier M, Dietz K-J (1999a) The costs and benefits of oxygen for photosynthesizing cells.
Progress Botany 60: 282-314
Baier M, Dietz K-J (1999b) Prospective function of chloroplast 2-cysteine peroxiredoxin in
photosynthesis. Evidence from transgenic Arabidopsis. Plant Physiol 119: 1407-1414
Baier M, Dietz K-J (2005) Chloroplasts as source and target of cellular redox regulation: a
discussion on chloroplast redox signals in the context of plant physiology. J Exp Bot 56:
1449-1462
Baier M, Hemmann G, Holman R, Corke F, Card R, Smith C, Rook F, Bevan MW (2004b)
Characterization of mutants in Arabidopsis showing increased sugar-specific gene
expression, growth and developmental responses. Plant Physiol 134: 81-91
Baier M, Kandlbinder A, Dietz K-J, Golldack D (2006) New insights into abiotic stress
signalling in plants. Progress Botany 67: 248 - 274
Baier M, Noctor G, Foyer CH, Dietz K-J (2000) Antisense suppression of 2-cysteine
peroxiredoxin in Arabidopsis specifically enhances the activities and expression of
enzymes associated with ascorbate metabolism but not glutathione metabolism. Plant
Physiol 120: 823-832
Baier M, Ströher E, Dietz K-J (2004a) The acceptor availability at photosystem I and ABA
control nuclear expression of 2-Cys peroxiredoxin-A in Arabidopsis thaliana. Plant Cell
Physiol 45: 997-1006
www.plantphysiol.orgon May 28, 2018 - Published by Downloaded from Copyright © 2007 American Society of Plant Biologists. All rights reserved.

Heiber et al. redox imbalanced mutants 21
Ball L, Accotto G-P, Bechtold U, Creissen G, Funck D, Jimenez A, Kular B, Leyland N, Mejia-Carranza J, Reynolds H, Karpinski S, Mullineaux PM (2004) Evidence for a
direct link between glutathione biosynthesis and stress defense gene expression in
Arabidopsis. Plant Cell 16: 1448-2462
1
2
3
4
5
6
7
8
9
10
11
12
13
14
15
16
17
18
19
20
21
22
23
24
25
26
27
28
29
30
31
32
33
34
35
36
37
Broin M, Cuine S, Eymery F, Rey P (2002) The plastidic 2-cysteine peroxiredoxin is a target
for a thioredoxin involved in the protection of the photosynthetic apparatus against
oxidative stress. Plant Cell 14: 1417 - 1432
Cartharius K, Frech K, Grote K, Klocke B, Haltmeier M, Klingenhoff A, Frisch M, Bayerlein M, Werner T (2005) MatInspector and beyond: promoter analysis based on
transcription factor binding sites. Bioinformatics 21: 2933 - 2942
Collin V, Issakidis-Bourguet E, Marchand C, Hirasawa M, Lancelin JM, Knaff DB, Miginiac-Maslow M (2003) The Arabidopsis plastidial thioredoxins - New functions and
new insights into specificity. J Biol Chem 278: 23747 - 23752
Davletova S, Rizhsky L, Liang H, Shengqiang Z, Oliver DJ, Coutu J, Shulaev V, Schlauch K, Mittler R (2005) Cytosolic ascorbate peroxidase 1 is a central component of the
reactive oxygen network of Arabidopsis. Plant Cell 17: 268-281
Desikan, R, Mackerness S, Hancock JT, Neill SJ (2001) Regulation of the Arabidopsis
transcriptome by oxidative stress. Plant Physiol 127: 159-172
Dietz KJ (2003) Redox control, redox signaling, and redox homeostasis in plant cells. Int Rev
Cytol 228: 141 - 193
Dietz K-J, Jacob S, Oelze M-L, Laxa M, Tognetti V, de Miranda SMN, Baier M, Finkemeier I (2006) The function of peroxiredoxins in plant organelle redox metabolism. J Exp Bot
57: 1697 - 1709
Donald RGK, Cashmore AR (1990) Mutation of either G-box or I-box sequences profoundly
affect expression from the Arabidopsis rbcS-1A promoter. EMBO J 9: 1717-1726
Engels A, Kahmann U, Ruppel HG, Pistorius EK (1997) Isolation, partial characterization
and localization of a dihydrolipoamide dehydrogenase from the cyanobacterium
Synechocystis PCC 6803. Biochim Biophys Acta 1340: 33-44
Fey V, Wagner R, Bräutigam K, Wirtz M, Hell R, Dietzmann A, Leister D, Oelmüller R, Pfannschmidt T (2005) Retrograde plastid redox signals in the expression of nuclear
genes for chloroplast proteins of Arabidopsis thaliana. J Biol Chem 280: 5318-5328
Finkelstein RR (1994) Mutations at two new Arabidopsis ABA response loci are similar to the
abi3 mutations. Plant J 5:765-771
Foyer CH, Lelandais M, Kunert KJ (1994) Photooxidative stress in plants. Physiol Plant 92:
696-717
Foyer CH, Noctor G (2005) Redox homeostasis and antioxidant signaling: A metabolic
interface between stress perception and physiological responses. Plant Cell 17: 1866-
www.plantphysiol.orgon May 28, 2018 - Published by Downloaded from Copyright © 2007 American Society of Plant Biologists. All rights reserved.

Heiber et al. redox imbalanced mutants 22
1875 1
2
3
4
5
6
7
8
9
10
11
12
13
14
15
16
17
18
19
20
21
22
23
24
25
26
27
28
29
30
31
32
33
34
35
36
37
Fridlyand LE, Scheibe R (1999) Controlled distribution of electrons between acceptors in
chloroplasts. A theoretical consideration. Biochim Biophys Acta 1413: 31-42
Gadjev I, Vanderauwera S, Gechev TS, Laloi C, Minkov IN, Shulaev V, Apel K, Inzé D, Mittler R, Van Breusegem F (2006) Transcriptomic footprints disclose specificity of
reactive oxygen species signaling in Arabidopsis. Plant Physiol 141: 436-445
Horling F, Lamkemeyer P, König J, Finkemeier I, Kandlbinder A, Baier M, Dietz K-J (2003) Divergent light-, ascorbate-, and oxidative stress-dependent regulation of
expression of the peroxiredoxin gene family in Arabidopsis. Plant Physiol 131: 317-325
Jander G, Norris SR, Rounsley SD, Bush DF, Levin IM, Last RL (2002) Arabidopsis Map-
based cloning in the post-genome era. Plant Physiol 129: 440-450
Karpinski S, Escobar C, Karpinska B, Creissen G, Mullineaux PM (1997) Photosynthetic
electron transport regulates expression of cytosolic ascorbate peroxidase genes in
Arabidopsis during excess light stress. Plant Cell 9: 627-640
Kiddle G, Pastori GM, Bernard S, Pignocchi C, Antoniw J, Verrier PJ, Foyer CH (2003)
Effects of leaf ascorbate content on defense and photosynthesis gene expression in
Arabidopsis thaliana. Antioxidants Redox Signalling 5: 23-32
Kliebenstein DJ, Monde R-A, Last RL (1998) Superoxide dismutase in Arabidopsis: An
eclectic enzyme family with disparate regulation and protein localization. Plant Physiol
118: 637-650
König J, Baier M, Horling F, Kahmann U, Harris G, Schürmann P, Dietz K-J (2002) The
plant-specific function of 2-Cys peroxiredoxin-mediated detoxification of peroxides in the
redox-hierarchy of PET. Proc Natl Acad Sci USA 99: 5738-5743
König J, Lotte K, Plessow R, Brockhinke A, Baier M, Dietz K-J (2003) Reaction
mechanism of plant 2-Cys peroxiredoxin: Role of the C-terminus and the quaternary
structure. J Biol Chem 278: 24409-24420
Koornneef M, Reuling G, Karssen CM (1984) The isolation and characterization of abscisic
acid-insensitive mutants in Arabidopsis thaliana. Physiol Plant 61: 377-383
Laxa M, König J, Dietz K-J, Kandlbinder A (2007) Role of the cysteinyl residues in
Arabidopsis thaliana cyclophilin CYP20-3 in peptidyl-prolyl cis-trans isomerase and
redox-related function. Biochem J 401: 287 - 297
Lee B-h, Kapoor A, Zhu J, Zhu J-K (2006) STABILIZED1, a stress-upregulated nuclear
protein, is required for pre-mRNA splicing, mRNA turnover, and stress tolerance in
Arabidopsis. Plant Cell 18: 1736-1749
Li H-m, Culligan K, Dixon RA, Chory J (1995) CUE1: A mesophyll cell-specific positive
regulator of light-controlled gene expression in Arabidopsis. Plant Cell 7: 1599 - 1610
Mahalingam R, Gomez-Buitrago AM, Eckardt N, Shah N, Guevara-Garcia A, Day P, Raina
www.plantphysiol.orgon May 28, 2018 - Published by Downloaded from Copyright © 2007 American Society of Plant Biologists. All rights reserved.

Heiber et al. redox imbalanced mutants 23
R, Fedoroff NV (2003) Characterizing the stress/defense transcriptome of Arabidopsis.
Genome Biol 4: R20
1
2
3
4
5
6
7
8
9
10
11
12
13
14
15
16
17
18
19
20
21
22
23
24
25
26
27
28
29
30
31
32
33
34
35
36
37
Mateo A, Muhlenbrock P, Rusterucci C, Chang CCC, Miszalski Z, Karpinska B, Parker JE, Mullineaux PM, Karpinski S (2004) Lesion simulating disease 1 - Is required for
acclimation to conditions that promote excess excitation energy. Plant Physiol 136:
2818-2830
Mehler A (1951) Studies on the reaction of illuminated chloroplasts. I. Mechanisms of the
reduction of oxygen and other Hill reagents. Archives Biochem Biophys 33: 65-77
Meskauskiene R, Nater M, Goslings D, Kessler F, op den Camp R, Apel K (2001) FLU: a
negative regulator of chlorophyll biosynthesis in Arabidopsis thaliana. Proc Natl Acad Sci
USA 98: 12826-12831
Meurer J, Meierhoff K, Westhoff P (1996) Isolation of high-chlorophyll-fluorescence mutants
of Arabidopsis thaliana and their characterisation by spectroscopy, immunoblotting and
Northern hybridization. Planta 198: 385-396
Miyake C, Shinzaki Y, Nishioka M, Horiguchi S, Tomizawa KI (2006) Photoinactivation of
ascorbate peroxidase in isolated tobacco chloroplasts: Galdieria partia APX maintains
the electron flux through the water-water-cycle in transplastomic tobacco plants. Plant
Cell Physiol 47: 200 - 210
Mittler R, Vanderauwera S, Gollery M, Van Breusegem F (2004) Reactive oxygen gene
network in plants. Trends Plant Sci 9: 490-498
Mochizuki N, Brusslan JA, Larkin R, Nagatani A, Chory J (2001) Arabidopsis genomes
uncoupled 5 (gun5) mutant reveals the involvement of Mg-chelatase H subunit in plastid-
to-nucleus signal transduction. Proc Natl Acad Sci USA 98: 2053-2058
Moon JC, Jang HH, Chae HB, Lee JR, Lee SY, Jung YJ, Shin MR, Lim HS, Chung WS, Yun DJ, Lee KO, Lee SY (2006) The C-type Arabidopsis thioredoxin reductase ANRT-C
acts as an electron donor to 2-Cys peroxiredoxins in chloroplasts. Biochem Biophys Res
Commun 348: 478 - 484
Mullineaux PM, Karpinski S, Baker NR (2006) Spatial dependence for hydrogen peroxide-
directed signaling in light-stressed plants. Plant Physiol 141: 346-350
Mullineaux PM, Rausch T (2005) Glutathione, photosynthesis and the redox regulation of
stress-responsive gene expression. Photosynth Res 86: 459-474
Ogren WL (1984) Photorespiration: Pathways, regulation, and modification. Ann Rev Plant
Physiol 35: 415–442
op den Camp RGL, Przybla D, Ochsenbein C, Laloi C, Kim C, Danon A, Wagner D, Hindeg E, Göbel C, Feussner I, Nater M, Apel K (2003) Rapid induction of distinct
stress responses after release of singlet oxygen. Plant Cell 15: 2320-2332
Pena-Ahumada A, Kahmann U, Dietz K-J, Baier M (2006) Regulation of peroxiredoxin
www.plantphysiol.orgon May 28, 2018 - Published by Downloaded from Copyright © 2007 American Society of Plant Biologists. All rights reserved.

Heiber et al. redox imbalanced mutants 24
expression versus expression of Halliwell-Asada-Cycle enzymes during early seedling
development of Arabidopsis thaliana. Photosynth Res 89: 99 - 112
1
2
3
4
5
6
7
8
9
10
11
12
13
14
15
16
17
18
19
20
21
22
23
24
25
26
27
28
29
30
31
32
33
34
35
36
37
Pfannschmidt T (2003) Chloroplast redox signals: how photosynthesis controls its own
genes. trends Plant Sci 8: 33 - 41
Pfannschmidt T, Allen JE, Oelmüller R (2001) Principles of redox control in photosynthesis
gene expression. Physiol Plant 112: 1-9
Rizhsky L, Liang H, Mittler L (2003) The water-water-cycle is essential for chloroplast
protection in the absence of stress. J Biol Chem 278: 38921 - 38925
Rossel JB, Walter PB, Hendrickson L, Chow WS, Poole A, Mullineaux PM, Pogson BJ
(2006) A mutation affecting ascorbate peroxidase 2 gene expression reveals a link
between responses to high light and drought tolerance. Plant Cell Environm 29: 269-281
Rossel JB, Wilson IW, Pogson BJ (2002) Global changes in gene expression in response to
high light in Arabidopsis. Plant Physiol 130: 1109-1120
Schreiber U, Bilger W (1993) Progress in chlorophyll fluorescence research: major
developments during the past years in retrospect. Progr Bot 54: 151-173
Seidel T, Golldack D, Dietz K-J (2005) Mapping of C-termini of V-ATPase subunits by in
vivo-FRET measurements. FEBS Lett 579: 4374-4382
Seidel T, Kluge C, Hanitzsch M, Ross J, Sauer M, Dietz K-J, Golldack D (2004)
Colocalization and FRET-analysis of subunits c and a of the vacuolar H+-ATPase in
living plant cells. J Biotechnol 112: 165-175
Sheehan D (2006) Detection of redox-based modification in two-dimensional electrophoresis
proteomic separation. Biochem Biophys Res Commun 349: 455 - 462
Spoel SH, Koorneef A, Classens SMC, Korzelius JP, Van Pelt JA, Mueller MJ, Buchala AJ, Metraux JP, Brown R, Kazan K, Van Loon LC, Dong XN, Pieterse SMJ (2003)
NPR1 modulates cross-talk between salicylate- and jasmonate-dependent defense
pathways through a novel function in the cytosol. Plant Cell 15: 760 - 770
Sunkar R, Kapoor A, Zhu J-K (2006) Posttranscriptional induction of two Cu/Zn superoxide
dismutase genes in Arabidopsis is mediated by downregulation of miR398 and important
for oxidative stress tolerance. Plant Cell 18: 2051-2065
Suzuki N, Mittler R (2005) Reactive oxygen species and temperature stresses: A delicate
balance between signaling and destruction. Physiol Plant 126: 45-51
Torres MA, Jones JDG, Dangl JL (2006) Reactive oxygen species signaling in response to
pathogens. Plant Physiol 141: 373-378
Vandenabeele S, Vanderauwera S, Vuylsteke M, Rombauts S, Langebartels C, Seidlitz HK, Zabeau M, Van Montagu M, Inzé D, Van Breusegem F (2004) Catalase deficiency
drastically affects gene expression induced by high light in Arabidopsis thaliana. Plant J
39: 45-58.
www.plantphysiol.orgon May 28, 2018 - Published by Downloaded from Copyright © 2007 American Society of Plant Biologists. All rights reserved.

Heiber et al. redox imbalanced mutants 25
Wormuth D, Baier M, Kandlbinder A, Scheibe R, Hartung W, Dietz K-J (2006) Regulation
of gene expression by photosynthetic signals triggered through modified CO
1
2
3
4
5
6
7
2 availability.
BMC Plant Biol 6: 15
Wu D, Wright DA, Wetzel C, Voytas DF, Rodermel S (1999) The IMMUTANS variegation
locus of Arabidopsis defines a mitochondrial alternative oxidase homologue that
functions during early chloroplast biogenesis. Plant Cell 11: 1-3
www.plantphysiol.orgon May 28, 2018 - Published by Downloaded from Copyright © 2007 American Society of Plant Biologists. All rights reserved.
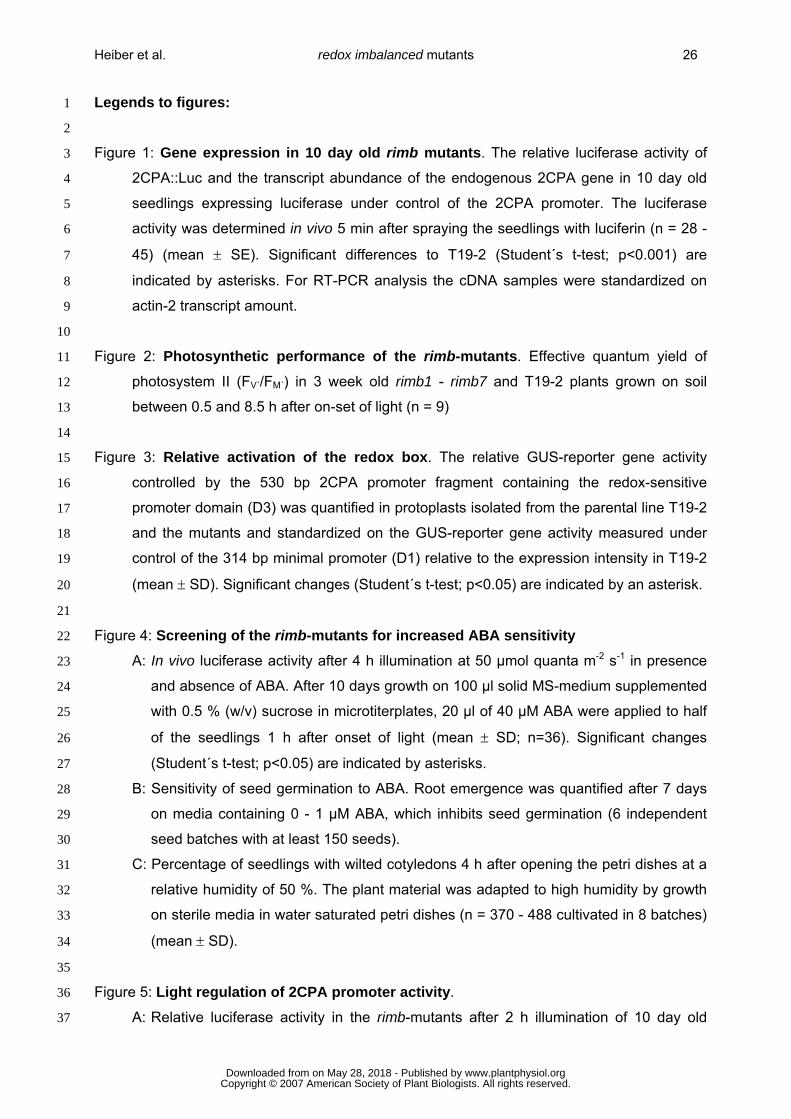
Heiber et al. redox imbalanced mutants 26
Legends to figures: 1
2
3
4
5
6
7
8
9
10
11
12
13
14
15
16
17
18
19
20
21
22
23
24
25
26
27
28
29
30
31
32
33
34
35
36
37
Figure 1: Gene expression in 10 day old rimb mutants. The relative luciferase activity of
2CPA::Luc and the transcript abundance of the endogenous 2CPA gene in 10 day old
seedlings expressing luciferase under control of the 2CPA promoter. The luciferase
activity was determined in vivo 5 min after spraying the seedlings with luciferin (n = 28 -
45) (mean ± SE). Significant differences to T19-2 (Student´s t-test; p<0.001) are
indicated by asterisks. For RT-PCR analysis the cDNA samples were standardized on
actin-2 transcript amount.
Figure 2: Photosynthetic performance of the rimb-mutants. Effective quantum yield of
photosystem II (FV´/FM´) in 3 week old rimb1 - rimb7 and T19-2 plants grown on soil
between 0.5 and 8.5 h after on-set of light (n = 9)
Figure 3: Relative activation of the redox box. The relative GUS-reporter gene activity
controlled by the 530 bp 2CPA promoter fragment containing the redox-sensitive
promoter domain (D3) was quantified in protoplasts isolated from the parental line T19-2
and the mutants and standardized on the GUS-reporter gene activity measured under
control of the 314 bp minimal promoter (D1) relative to the expression intensity in T19-2
(mean ± SD). Significant changes (Student´s t-test; p<0.05) are indicated by an asterisk.
Figure 4: Screening of the rimb-mutants for increased ABA sensitivity
A: In vivo luciferase activity after 4 h illumination at 50 µmol quanta m-2 s-1 in presence
and absence of ABA. After 10 days growth on 100 µl solid MS-medium supplemented
with 0.5 % (w/v) sucrose in microtiterplates, 20 µl of 40 µM ABA were applied to half
of the seedlings 1 h after onset of light (mean ± SD; n=36). Significant changes
(Student´s t-test; p<0.05) are indicated by asterisks.
B: Sensitivity of seed germination to ABA. Root emergence was quantified after 7 days
on media containing 0 - 1 µM ABA, which inhibits seed germination (6 independent
seed batches with at least 150 seeds).
C: Percentage of seedlings with wilted cotyledons 4 h after opening the petri dishes at a
relative humidity of 50 %. The plant material was adapted to high humidity by growth
on sterile media in water saturated petri dishes (n = 370 - 488 cultivated in 8 batches)
(mean ± SD).
Figure 5: Light regulation of 2CPA promoter activity.
A: Relative luciferase activity in the rimb-mutants after 2 h illumination of 10 day old
www.plantphysiol.orgon May 28, 2018 - Published by Downloaded from Copyright © 2007 American Society of Plant Biologists. All rights reserved.

Heiber et al. redox imbalanced mutants 27
seedlings adapted to 50 µmol quanta m-2 s-1 with 400 µmol quanta m-2 s-1
standardized on the luciferase activity observed in the parental line T19-2 (white
bares) compared to the relative luciferase activity prior to the increased light
treatment (black bars) (mean ± SD). Significant changes (Student´s t-test; p<0.05) are
indicated by an asterisk.
1
2
3
4
5
6
7
8
9
10
11
12
13
14
15
16
17
18
19
20
21
22
23
24
25
26
27
28
29
30
31
32
33
34
35
36
37
B: Relative luciferase activity in the rimb-mutants after 5 h illumination of 10 day old
seedlings adapted to 100 µmol quanta m-2 s-1 with 400 µmol quanta m-2 s-1
standardized on the luciferase activity observed in the parental line T19-2 (mean ±
SD). Significant changes (Student´s t-test; p<0.05) are indicated by asterisks.
Figure 6: Content and redox states of ascorbate and glutathione in 3 week old rimb-mutants grown on soil under long day illumination (14 h light / 10 h dark) (n = 6 - 10)
(mean ± SD). Significant differences to T19-2 (Student´s t-test; p<0.05) are indicated by
asterisks.
Figure 7: Content and redox states of 2-Cys peroxiredoxin in 3 week old rimb-mutants.
Left: the total 2-Cys peroxiredoxin protein amount was determined in DTT treated plant
samples by Western-blot analysis with 2-Cys peroxiredoxin antibody and quantification
of the band intensities. Middle: Intermolecular disulfide bond formation was analysed in
protein samples extracted immediately in SDS-containing buffer by 20% SDS-PAGE,
Western-blot analysis with 2-Cys peroxiredoxin-specific antibodies and quantification of
band intensities. Right: The isoelectric point of 2-Cys peroxiredoxin was determined by
2-D PAGE with immobilized pH-gradients (pH 4-7) and Western-blot analysis with 2-Cys
peroxiredoxin-sepcific antibodies.
Figure 8: Performance of the mutants under photorespiratory conditions. A: Habitus of
five rimb-mutants and T19-2 48 h after 8 or 16h fumigation with 50 ppm CO2. The digital
colour images were taken 48 h after the end of the low CO2-treatment. The signal
intensity of the green channel was squared using Photoshop CS and visualized in gray-
scale images. Chlorophyll contents (B) prior to 16 h fumigation (filled bars) with 50 ppm
CO2 and 48 h after the treatment (open bars) (n = 6) (mean ± SD). Significant changes
(Student´s t-test; p<0.05) are indicated by asterisks.
Figure 9: Effect of H2O2 on the quantum yield of photosystem II (A) and the chlorophyll
content (B). Leaf disks of 9 mm diameter were floated for 8 h on 20 mM H2O2 under
constant illumination with 100 µmol quanta m-2 s-1. The catalase protein levels were
analysed immunochemically by Western-blot analysis of 10 µg protein extracted from
www.plantphysiol.orgon May 28, 2018 - Published by Downloaded from Copyright © 2007 American Society of Plant Biologists. All rights reserved.

Heiber et al. redox imbalanced mutants 28
mature leaves of 3 week old plants (C) and the protein amount was calculated relative to
T19-2. (D) Guaiacol peroxidase activity as indicator for extracellular and cytosolic
peroxidase activity in 3 week old rimb-mutants harvested 1 h after onset of light (n = 6).
Significant differences to T19-2 (Student´s t-test; p<0.05; mean ± SD) are indicated by
asterisks.
1
2
3
4
5
6
7
8
9
10
11
12
13
14
15
16
17
18
19
20
21
22
23
24
25
26
27
28
29
Figure 10: Transcript analysis in the rimb-mutants by gene specific RT-PCR. The
transcript abundances of selected genes were analysed in the rimb-mutants and the
parental line T19-2 by RT-PCR in cDNA samples standardized on actin-2 transcript
amount. The numbers give the means of the percentage of signal intensity relative to the
T19-2 in three independent experiments. For Fd and Trx-m3 very strong induction was
detected, tentatively quantified and labled with ">>" and ">", respectively.
Supplement 1: Segregation analysis of the low luciferase phenotype in the F2 generation of the backcross of the rimb-mutants to the parental line T19-2. The in vivo
luciferase activity was quantified individually in 10 day old seedlings of the F2-population
of the backcrosses of the rimb-mutants to the parental line T19-2 by reading the light
emission 5 min after spraying the seedlings with luciferin. The percentage of seedlings
falling into 11 activity classes defined by the square root of the luciferase activity, were
plotted in comparison to the activity distribution pattern of the non-mutagenized line T19-
2 (dotted line).
Supplement 2: Transcript amount correlation analysis. From pairwise correlation
coefficients of 223 transcripts of nuclear encoded chloroplast proteins and redox
regulated extra-plastidic transcripts taken from 249 Affimetrix-cDNA-array hybridization
experiments a PULP tree was drawn expressing the similarity of transcript amount
regulation of 133 transcripts. Details of two tightly co-regulated subgroups (A and B)
were extracted for better visualization.
www.plantphysiol.orgon May 28, 2018 - Published by Downloaded from Copyright © 2007 American Society of Plant Biologists. All rights reserved.

Heiber et al. redox imbalanced mutants 29
Table 1: Protein, chlorophyll, anthocynanin and starch contents of 3 week old rimb-
mutants grown under long-day illumination (14 h light / 10 h dark; harvest: 3 h after on-
set of light). Significant differences to T19-2 (Student´s t-test; p<0.05) are indicated by
an asterisk.
1
2
3
4 5
protein
[mg g-1 fw]
chlorophyll
[mg g-1 fw]
anthocyanin
E530 corr g-1 fw]
starch
[µmol glc g-1 fw]
T19-2 12.58 ± 0.62 0.769 ± 0.084 19.40 ± 1.36 5.21 ± 1.39
rimb1 12.52 ± 0.38 0.761 ± 0.046 21.36 ± 0.95 * 6.60 ± 1.53 *
rimb2 12.85 ± 0.19 0.722 ± 0.063 21.01 ± 1.43 * 7.08 ± 1.50 *
rimb3 12.29 ± 0.57 0.641 ± 0.057 * 21.07 ± 2.57 12.54 ± 3.15 *
rimb5 12.28 ± 1.02 0.604 ± 0.101 * 23.87 ± 2.46 * 23.31 ± 3.37 *
rimb6 12.82 ± 1.27 0.727 ± 0.055 32.44 ± 4.27 * 29.16 ± 4.92 *
rimb7 13.02 ± 0.91 0.766 ± 0.099 20.00 ± 1.29 8.68 ± 2.61 *
n 7 5 8 10 6
7
8 9
Table 2: List of primers
gene gene code sense primer antisense primer
actin At5g09810 GAGAAGATGACTCAGATC ATCCTTCCTGATATCGAC
luciferase ATTGACAAGGATGGATGGCTAC AGGGAGACCGGCCTCGAGATCG
2CPA At3g11630 CTCTCCATCTGTTTCTTT GTACCTTTTTCGTATCAT
2CPB At5g06290 ATAGCTTCTTCTTCTTCC CATGTGTTCAATCTTAGC
PrxQ At3g26060 TGGCTCCACACTCACTCA TCAGGCTGGAACTGGTTG
PrxIIE At3g52960 ATGGCGACTTCTCTCTCC AGTCCCACAGGCTTATCC
sAPx At4g08390 TGTTCCAGTTAGCTAGTG GGTTGAGTAAATTAGGTGC
tAPx At1g77490 AATAGTTGCCTTGTCTGG GGAATATATGATCACCACG
Cat2 At4g35090 AGCAACTTGCTTTCTGTC TTAGATGCTTGGTCTCAC
Csd2 At2g28190 CTCCGTTCCTCTTTCAGC GCGTCAAGCCAATCACAC
plast. γ-ECS At4g23100 CCTATGTACTTTGCCTAC CCTTATTCCGGAGACTCG
Fd At1g60950 CCACAAGCCATAATCCTC AAAGCTGGTGAGTAGGTG
cyt. GR At3g54660 GGATTTGTGTGAGTCTGC TAATAGCCAGCTCATGTC
Lox2 At3g45140 CCTGATGAAGAACTGATC AAGAGACAGAGATACAG
plast. MDH At5g58330 ATGAAGAGATCCAAGAGC CTACTTCAATGCCATGTTC
MDHAR At1g63940 TTGGAATTGGAGCTAAGC TTCTTCGACTGAAGATGC
CDSP32 At1g76080 CCGGACCAGTTAATGGGGAG AAGTGACACGAACGCCTGAG
Trx-m3 At2g15579 TTCTGCTCTTCAAGAACG AGGCAACAACAGTAGTAAC
Trx-x At1g50320 CTAGTTCGGTGATAAGATGC ATTGAGTTCAAGAGACCATC
Cyp20-3 At3g62030 TGACCGATGCATTGTCTTTG AAGCTCGAGCCAATTGTTCA
NTRC At2g41680 ATCGTCAGTTATTGGAAGGC CTCTTTCTTCATCTTCACAC
10
www.plantphysiol.orgon May 28, 2018 - Published by Downloaded from Copyright © 2007 American Society of Plant Biologists. All rights reserved.

Heiber et al.Figure 1
T19-2 rimb1 rimb2 rimb3 rimb4 rimb5 rimb6 rimb7
Relative
luciferaseactivity
2CPA
Actin
*0%
25%
50%
75%
100%
* * **
**
www.plantphysiol.orgon May 28, 2018 - Published by Downloaded from Copyright © 2007 American Society of Plant Biologists. All rights reserved.

Heiber et al.Figure 2
0.0
0.1
0.2
0.3
0.4
0.5
0.6
0.7
0.8
1 2 3 4 5 6 7 8h after onset of light
Effe
ctiv
e qu
antu
m y
ield
(FV/
F M)
T19-2rimb1rimb2rimb3
rimb4rimb5rimb6rimb7
www.plantphysiol.orgon May 28, 2018 - Published by Downloaded from Copyright © 2007 American Society of Plant Biologists. All rights reserved.

Heiber et al.Figure 3
0%
20%
40%
60%
80%
100%
120%
**
* * *
T19-2 rimb1 rimb2 rimb3 rimb5 rimb6 rimb7
Rel
ativ
e re
dox-
box
effe
ct (D
3/D
1)
www.plantphysiol.orgon May 28, 2018 - Published by Downloaded from Copyright © 2007 American Society of Plant Biologists. All rights reserved.
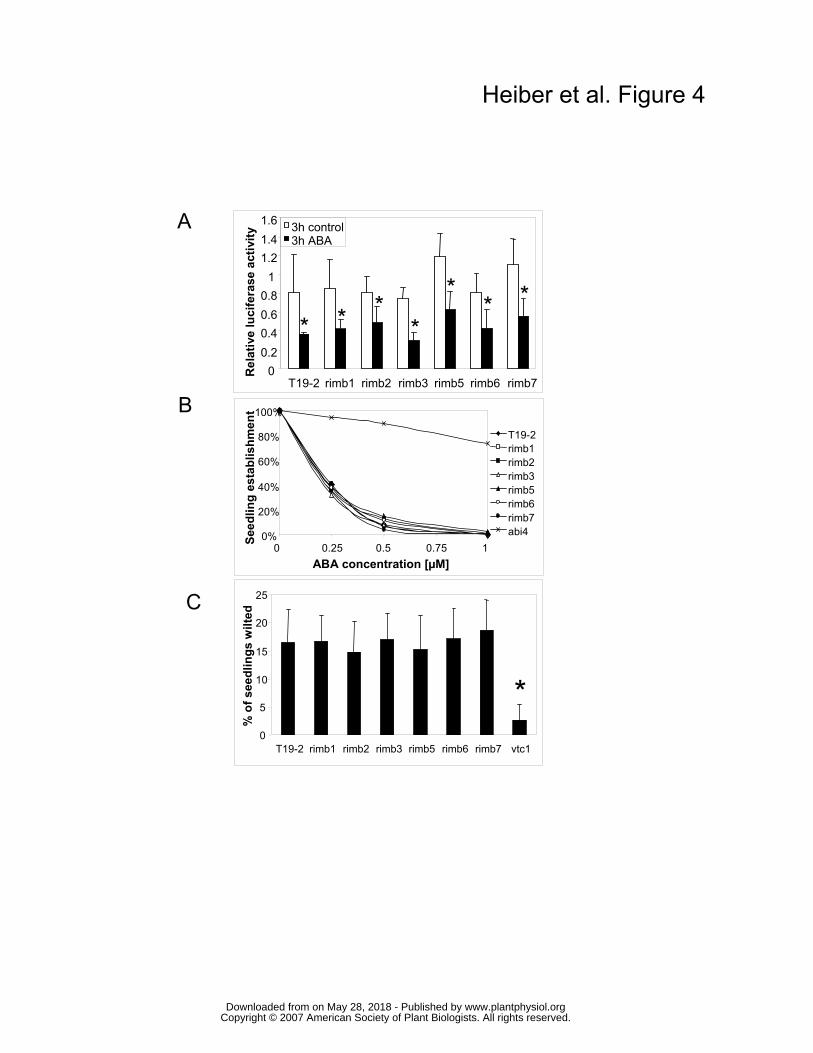
Heiber et al. Figure 4
0%
20%
40%
60%
80%
100%
0 0.25 0.5 0.75 1ABA concentration [µM]
Seed
ling
esta
blis
hmen
t
T19-2rimb1rimb2rimb3rimb5rimb6rimb7abi4
A
C
T19-2 rimb1 rimb2 rimb3 rimb5 rimb6 rimb7 vtc1
% o
f see
dlin
gs w
ilted
0
5
10
15
20
25
*
C
B
00.20.40.60.8
11.21.41.6
T19-2 rimb1 rimb2 rimb3 rimb5 rimb6 rimb7
3h control3h ABA
* * **
** *
Rel
ativ
e lu
cife
rase
act
ivity
www.plantphysiol.orgon May 28, 2018 - Published by Downloaded from Copyright © 2007 American Society of Plant Biologists. All rights reserved.

Heiber et al.Figure 5
0T19-2 rimb1 rimb2 rimb3 rimb5 rimb6 rimb7
Rel
ativ
e lu
cife
rase
act
ivity
startafter 2h HL
* ** *
**
0.5
1
1.5
2
* * ***
0.0
0.2
0.4
0.6
0.8
1.0
T19-2 rimb1 rimb2 rimb3 rimb5 rimb6 rimb7
Rel
ativ
e lu
cife
rase
act
ivity
A
B
www.plantphysiol.orgon May 28, 2018 - Published by Downloaded from Copyright © 2007 American Society of Plant Biologists. All rights reserved.

Heiber et al. Figure 6
A
B
D
C
0
5
10
15
20A
scor
bate
con
tent
[µm
ol /
mg
Phe
ophy
tin]
DH
A /
Asc
T19-2 rimb1 rimb2 rimb3 rimb5 rimb6 rimb7
T19-2 rimb1 rimb2 rimb3 rimb5 rimb6 rimb7
* *
*
**
*
T19-2 rimb1 rimb2 rimb3 rimb5 rimb6 rimb7
GSS
G /
2 G
SH
T19-2 rimb1 rimb2 rimb3 rimb5 rimb6 rimb7
Glu
tath
ione
con
tent
[µm
ol /
g fw
]
0.0
0.1
0.2
0.3
0.4
0.5
0.6
0.7
* ** *
*
0.00
0.02
0.04
0.06
0.08
0.10
0.0
0.2
0.4
0.6
0.8
1.0
1.2
1.4
*
www.plantphysiol.orgon May 28, 2018 - Published by Downloaded from Copyright © 2007 American Society of Plant Biologists. All rights reserved.

Heiber et al. Figure 7
2CP + 2-ME73 71 64 85 68 87
T19-2 rimb1 rimb2 rimb3 rimb5 rimb6 rimb7
22.3%15.3%10.5%9.8%10.4%9.7%13.9%monomer46.8%48.5%49.9%47.3%49.6%48.7%45.2%mono-disulfide dimer30.9%36.1%39.6%42.9%40.1%41.6%40.9%di-disulfide dimer
T19-2 rimb1 rimb2 rimb3 rimb5 rimb6 rimb7T19-2+H2O2
6.0
6.6
IEP
www.plantphysiol.orgon May 28, 2018 - Published by Downloaded from Copyright © 2007 American Society of Plant Biologists. All rights reserved.

Heiber et al. Figure 8
beforeafter 48 h
00.10.20.30.40.50.60.70.8
0.91
T19-2 rimb1 rimb2 rimb3 rimb5 rimb6 rimb7Chl
orop
hyll
cont
ent [
mg
chl /
g fw
]
* * * **
B
T19-2 rimb1
rimb5 rimb6
rimb3 rimb2
8 h 50 ppm CO2 16 h 50 ppm CO2 A
www.plantphysiol.orgon May 28, 2018 - Published by Downloaded from Copyright © 2007 American Society of Plant Biologists. All rights reserved.

Heiber et al. Figure 9
B
C
D
0%
20%
40%
60%
80%
100%
120%
T19-2 rimb1 rimb2 rimb3 rimb5 rimb6 rimb7Rel
ativ
e ch
ange
in c
hlor
ophy
ll co
nten
t
control20 mM H2O2
Catalase
**
*
0
24
68
1012
1416
18
T19-2 rimb1 rimb2 rimb3 rimb5 rimb6 rimb7
Pero
xida
se a
ctiv
ity[µ
mol
H2O
2/(m
g pr
otei
n * m
in)]
* *
T19-2 rimb1 rimb2 rimb3 rimb5 rimb6 rimb7
*
130 111 71 91 80 114
T19-2 rimb1 rimb2 rimb3 rimb5 rimb6 rimb7
Qua
ntum
yie
ld o
f PS-
II (F
V/F M
)
0 h8 h control8 h 20 mM H2O2* * *
* *
*
0
0.1
0.2
0.3
0.4
0.5
0.6
0.7
0.8
*
A
www.plantphysiol.orgon May 28, 2018 - Published by Downloaded from Copyright © 2007 American Society of Plant Biologists. All rights reserved.

Heiber et al. Figure 10
Actin
2CPA
MDHAR
str. APx
Lox2
Fd
Trx-m3
cytGR
plast. MDH
thy. APx
plast. γECS
Cat2
Csd2
T19-
2
rimb1
rimb2
rimb3
rimb5
rimb6
rimb7
2CPB
CDSP32
NTRC
PrxQ
Trx-x
Lhcb2.2
Cyp20-3
39 58 67 59 69 79
82 56 61 50 12 83
n.d. 22 88 97 27 144
90 59 95 67 121 113
56 50 82 103 100 97
43 58 117 59 69 83
17 50 99 115 82 100
>> > >> > >> >>
>> > > > > >
376 282 208 178 275 271
637 383 433 424 302 284
279 230 270 232 353 284
167 84 142 94 117 150
141 82 106 166 68 129
97 103 92 99 87 96
74 57 52 65 106 82
27 << 2 44 10 8
105 40 83 90 108 96
PrxIIE51 97 86 92 93 78
108 32 47 135 92 109
www.plantphysiol.orgon May 28, 2018 - Published by Downloaded from Copyright © 2007 American Society of Plant Biologists. All rights reserved.