Embed Size (px)
Citation preview

1
The Effect of Heavy-Tailed Job Size Distributions
on System Design
The Effect of Heavy-Tailed Job Size Distributions
on System Design
Mor Harchol-Balter
MIT Laboratory for Computer Science
2
Distribution of job sizes
SystemDesign
3
CPU Load Balancing in a N.O.W.CPU Load Balancing in a N.O.W.
Problem 1:
[Harchol-Balter, Downey --- Sigmetrics ‘96; Transactions on Computer Systems ‘97]
4
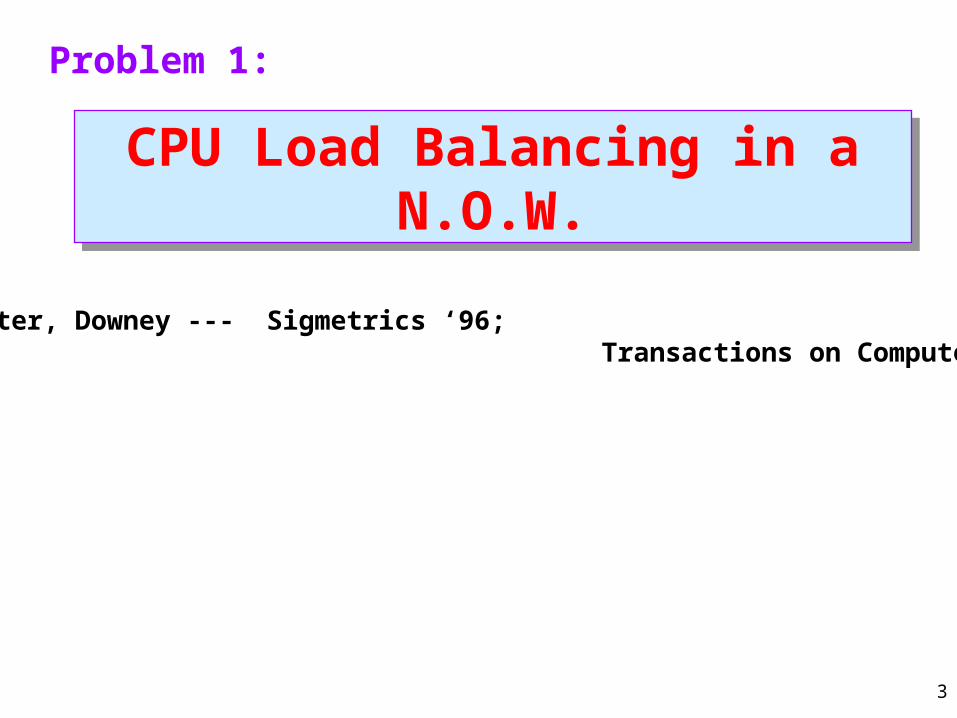
CPU Load Balancing in a NOW
pp
p
pp
host Ahost A
host Dhost Dhost Bhost B
p p
host Chost C
2 types of migration
Non-preemptive migration (NP) Preemptive migration(P)(a.k.a. placement, remote execution) (a.k.a. active process migration)
The Problem: Policy Decisions
1. Should we bother with P migration, or is NP enough?2. Which processes should we migrate? ** migration policy **
5
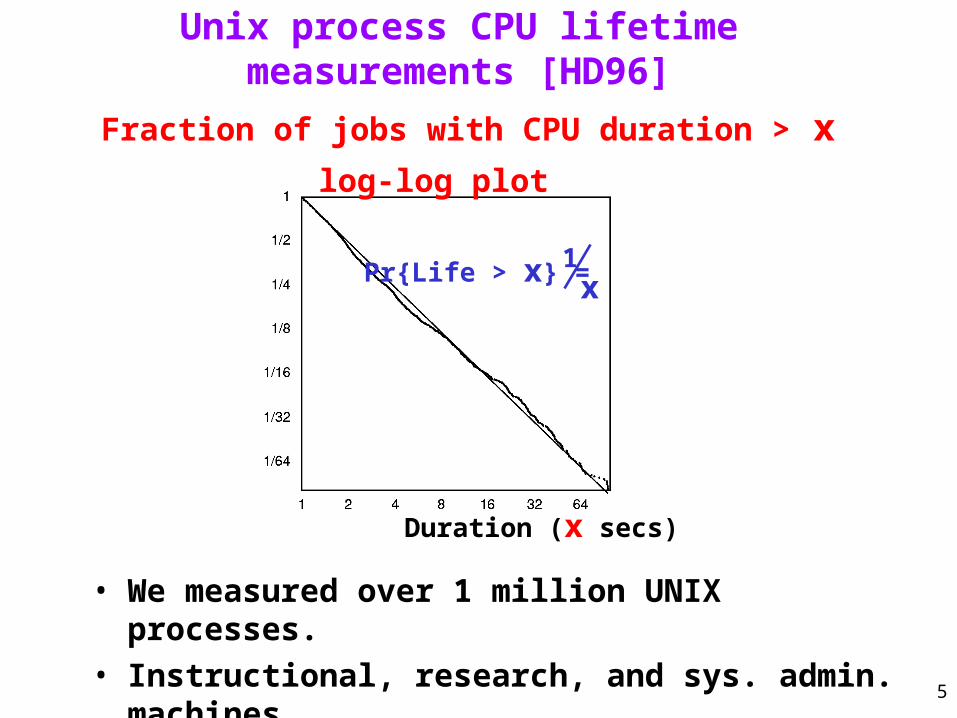
Unix process CPU lifetime measurements [HD96]
• We measured over 1 million UNIX processes.
• Instructional, research, and sys. admin. machines.
• Job of cpu age x has probability 1/2 of using another x.
Fraction of jobs with CPU duration > x
Duration (x secs)
log-log plot
Pr{Life > x} = 1x
6
Compare with exponential distribution
Fraction of jobs with size > x
Title:expvspareto.epsCreator:MATLAB, The Mathworks, Inc.Preview:This EPS picture was not savedwith a preview included in it.Comment:This EPS picture will print to aPostScript printer, but not toother types of printers.
7
• 1/x distribution measured previously by [Leland,Ott86] at Bellcore.
• [LO86] result rarely referenced and ignored when
referenced.
• WHY? 1) People not convinced lifetime distribution
matters.
2) Belief that 1/x distribution is useless in
developing migration policy because not
analytically tractable.
So what?
8
• Exponential distribution (memoryless) => migrate newborns
DFR (decreasing failure rate) distrib. => old jobs live longer
May pay to
migrate old jobs.
Why lifetime distribution matters
• 70% of our jobs had lifetime < .1s < cost of NP migration => NP not viable without namelists
9
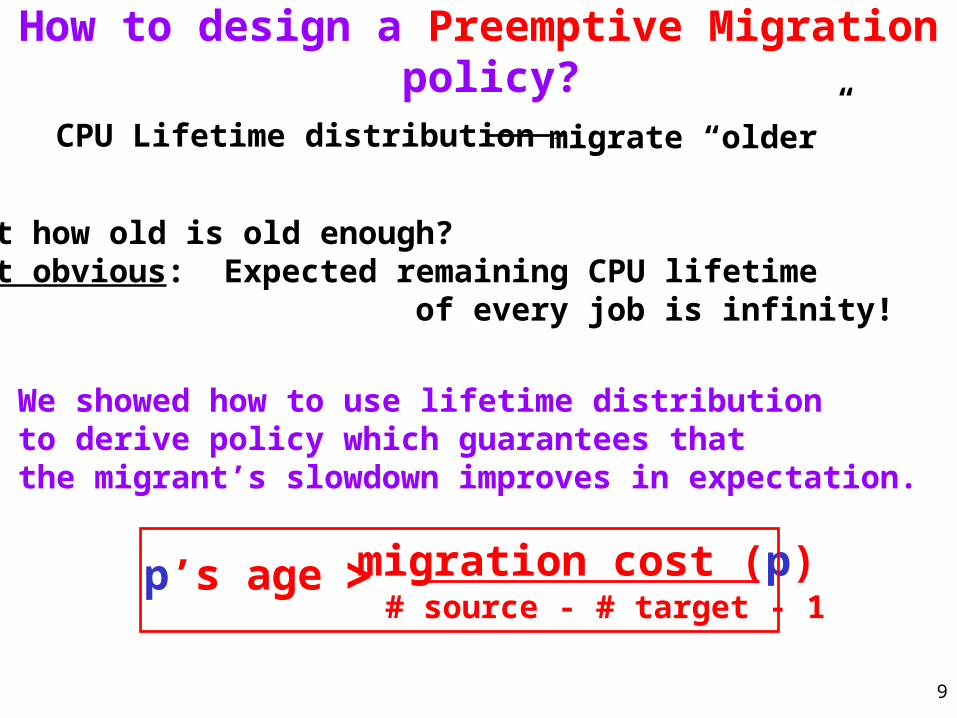
How to design a Preemptive Migration policy?
CPU Lifetime distribution migrate “older”
But how old is old enough?Not obvious: Expected remaining CPU lifetime of every job is infinity!
p’s age migration cost (p)# source - # target - 1
>
We showed how to use lifetime distribution to derive policy which guarantees that the migrant’s slowdown improves in expectation.
10
vs.
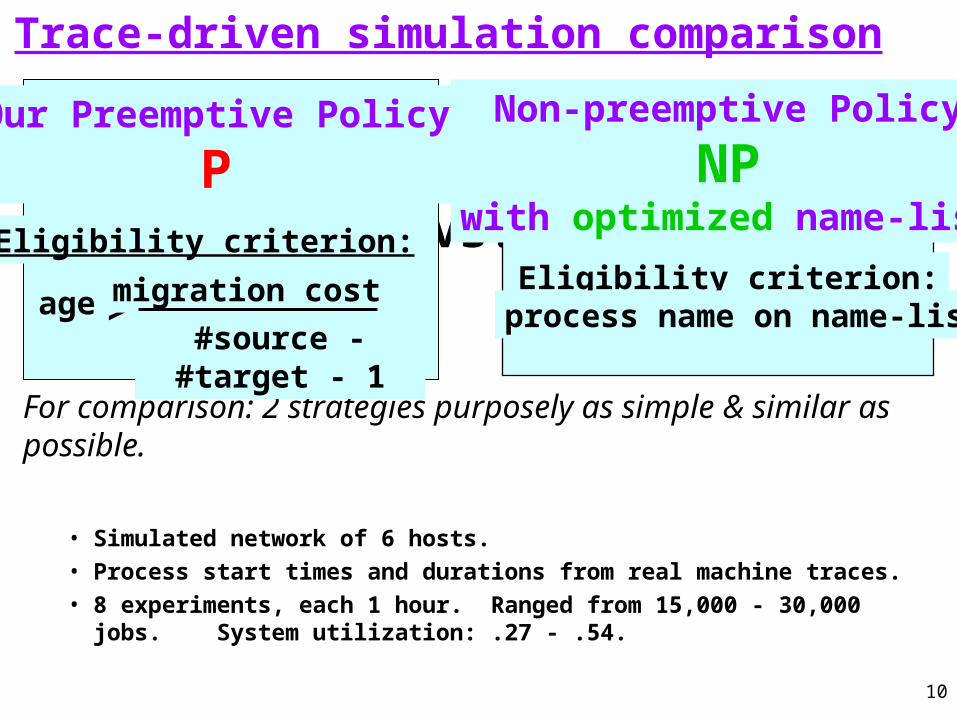
Non-preemptive Policy
NPwith optimized name-list
Eligibility criterion:process name on name-list
For comparison: 2 strategies purposely as simple & similar as possible.
Trace-driven simulation comparison
• Simulated network of 6 hosts.
• Process start times and durations from real machine traces.
• 8 experiments, each 1 hour. Ranged from 15,000 - 30,000 jobs. System utilization: .27 - .54.
Our Preemptive Policy
PEligibility criterion:
age >migration cost
#source - #target - 1
11
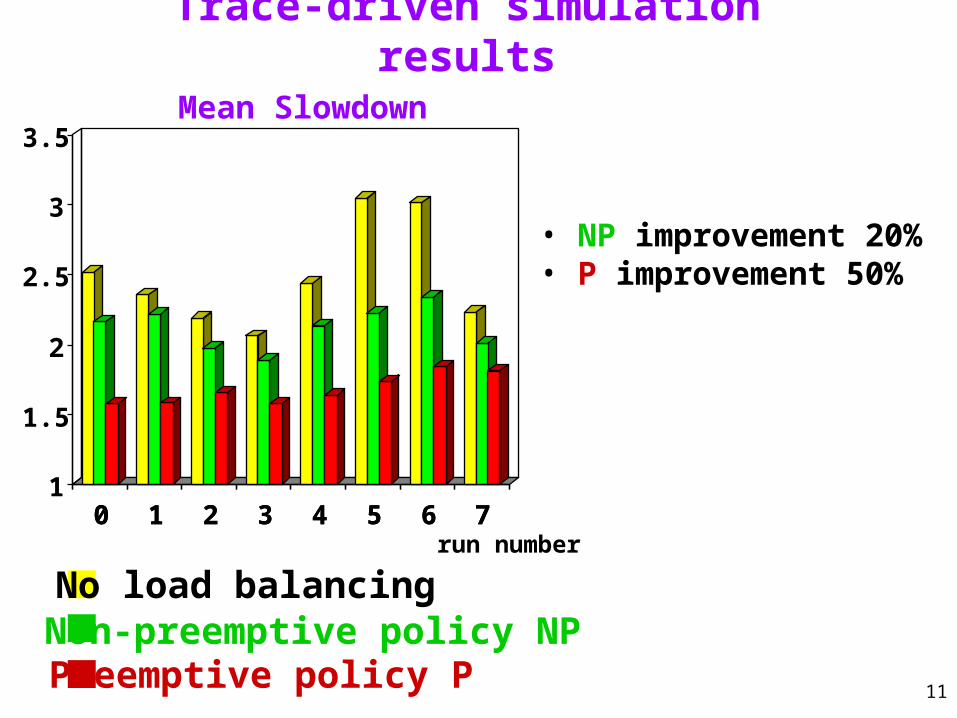
Trace-driven simulation results
0 1 2 3 4 5 6 71
1.5
2
2.5
3
3.5
0 1 2 3 4 5 6 7run number
Mean Slowdown
No load balancingNon-preemptive policy NPPreemptive policy P
• NP improvement 20%• P improvement 50%
12(assuming NP cost = .3 sec)
Mean slowdown as a function of P mean migration cost
Title:pmignolabel.epsCreator:MATLAB, The Mathworks, Inc.Preview:This EPS picture was not savedwith a preview included in it.Comment:This EPS picture will print to aPostScript printer, but not toother types of printers.
Mean slowdown
P mean migration cost(seconds)
13
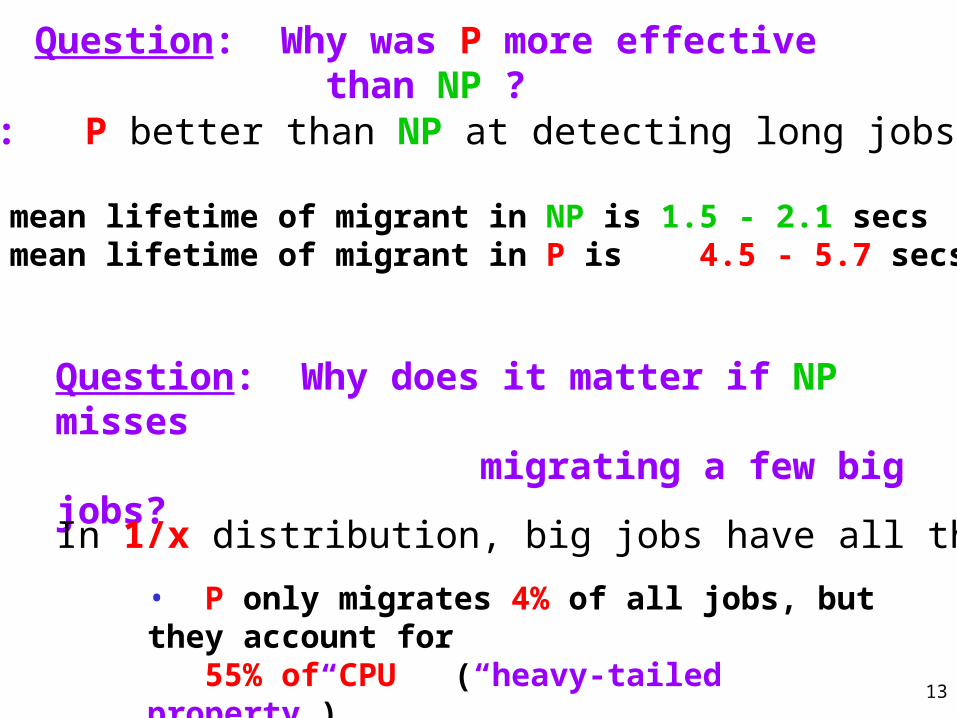
Question: Why was P more effective than NP ?
Answer: P better than NP at detecting long jobs.
• mean lifetime of migrant in NP is 1.5 - 2.1 secs• mean lifetime of migrant in P is 4.5 - 5.7 secs
Question: Why does it matter if NP misses migrating a few big jobs?
Answer: In 1/x distribution, big jobs have all the CPU.
• P only migrates 4% of all jobs, but they account for 55% of CPU (“heavy-tailed property”)
14
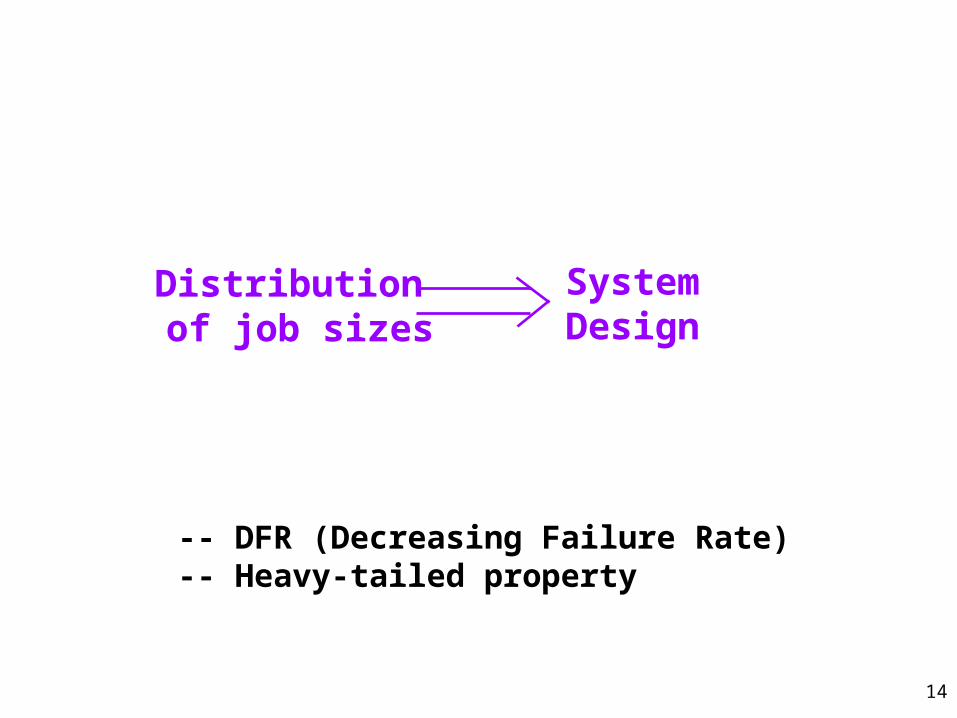
Distribution of job sizes
SystemDesign
-- DFR (Decreasing Failure Rate)-- Heavy-tailed property
15
Task Assignment in a Distributed Server
Task Assignment in a Distributed Server
Problem 2:
[Harchol-Balter, Crovella, Murta --- Performance Tools ‘98]
16
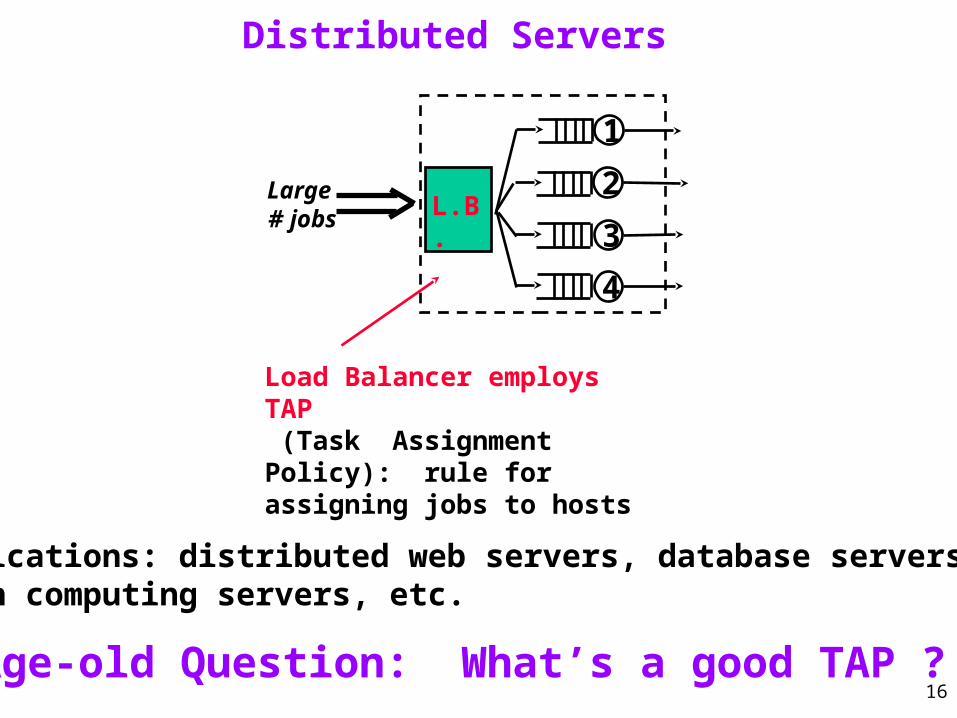
Distributed Servers
Load Balancer employs TAP (Task Assignment Policy): rule for assigning jobs to hosts
Age-old Question: What’s a good TAP ?
L.B.3
2
4
1
Large # jobs
Applications: distributed web servers, database servers, batch computing servers, etc.
17
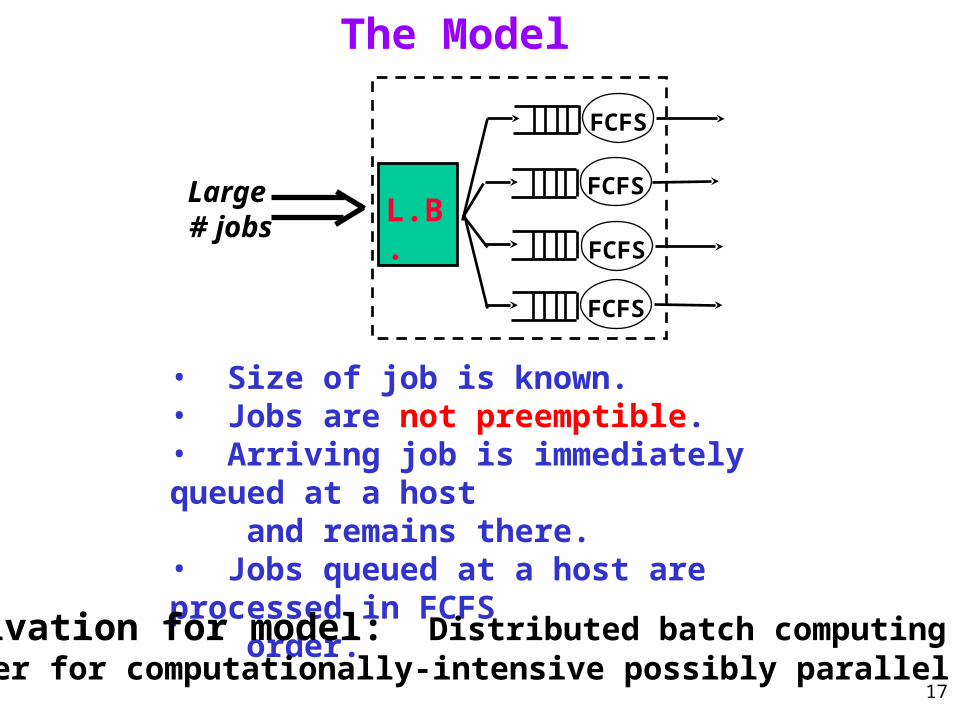
The Model
L.B.Large # jobs
FCFS
FCFS
FCFS
FCFS
• Size of job is known.• Jobs are not preemptible.• Arriving job is immediately queued at a host and remains there.• Jobs queued at a host are processed in FCFS order.
Motivation for model: Distributed batch computingserver for computationally-intensive possibly parallel jobs.

18
L.B.
1
3
4
2
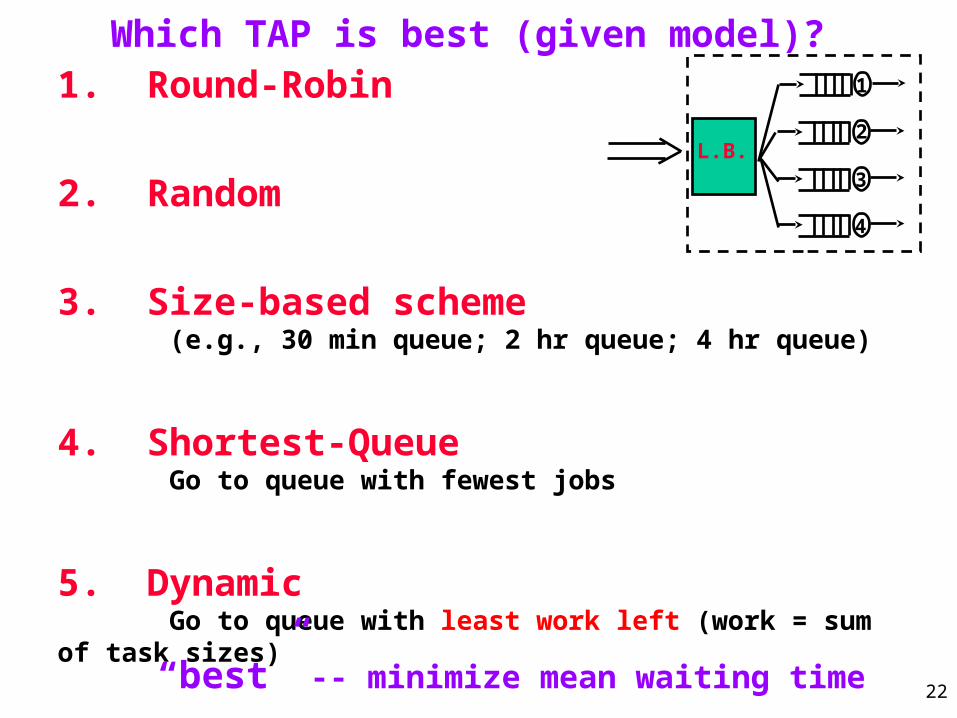
Which TAP is best (given model)? 1. Round-Robin
2. Random
3. Size-based scheme (e.g., 30 min queue; 2 hr queue; 4 hr queue)
4. Shortest-Queue Go to queue with fewest jobs
5. Dynamic Go to queue with least work left (work = sum of task sizes)
“best” -- minimize mean waiting time
19
To answer “Which TAP is best” question, need to understand distribution of task sizes.

20
Pareto (heavy-tailed) distribution
Properties:• Decreasing Failure Rate• Infinite variance!• Heavy-tail property -- Miniscule fraction (<1%) of the very largest jobs comprise half the load.
1
job size0
Pr{ }Size x x , 0 2
: degree of variability
0 ------ ------ 2more
variable& more
heavy-tailed
less variable& less
heavy-tailed
21
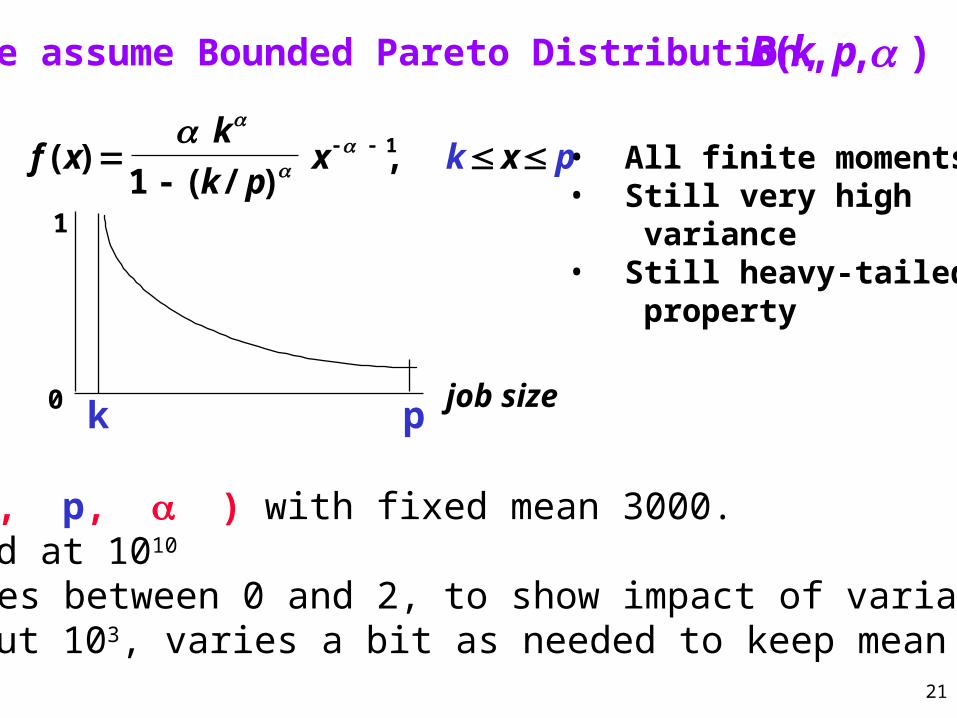
B k p( , , )We assume Bounded Pareto Distribution,
f xk
k px k x p( )
( / ),
-
1 1
1
0 k job size
p
• All finite moments• Still very high variance• Still heavy-tailed property
X ~ B( k, p, ) with fixed mean 3000.p : fixed at 1010
: ranges between 0 and 2, to show impact of variabilityk : about 103, varies a bit as needed to keep mean constant.
22
L.B.
1
3
4
2
Which TAP is best (given model)? 1. Round-Robin
2. Random
3. Size-based scheme (e.g., 30 min queue; 2 hr queue; 4 hr queue)
4. Shortest-Queue Go to queue with fewest jobs
5. Dynamic Go to queue with least work left (work = sum of task sizes)
“best” -- minimize mean waiting time
23
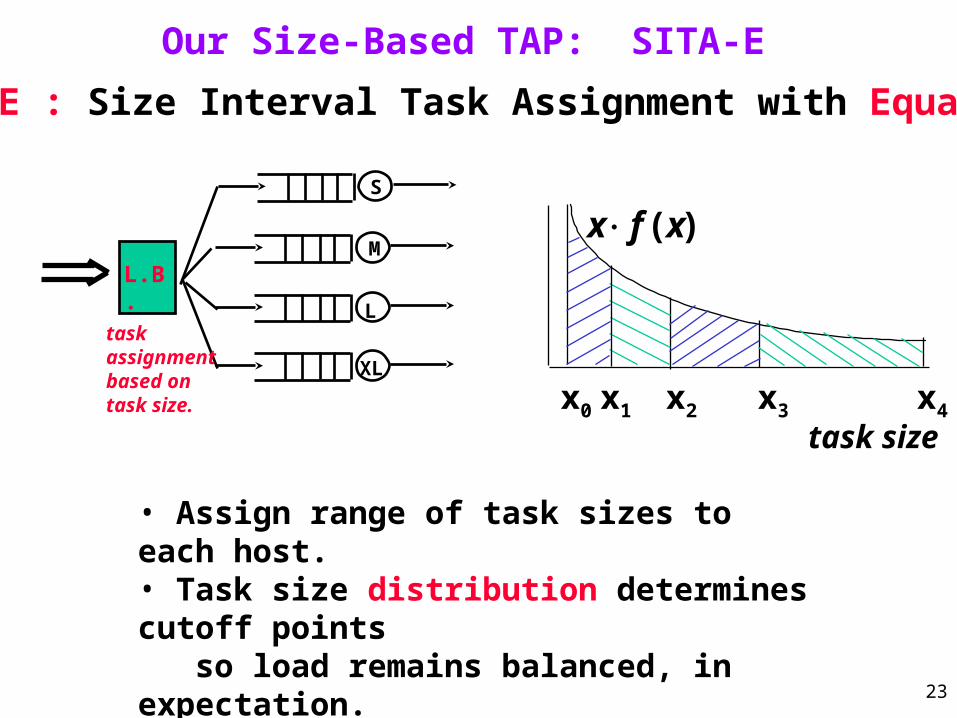
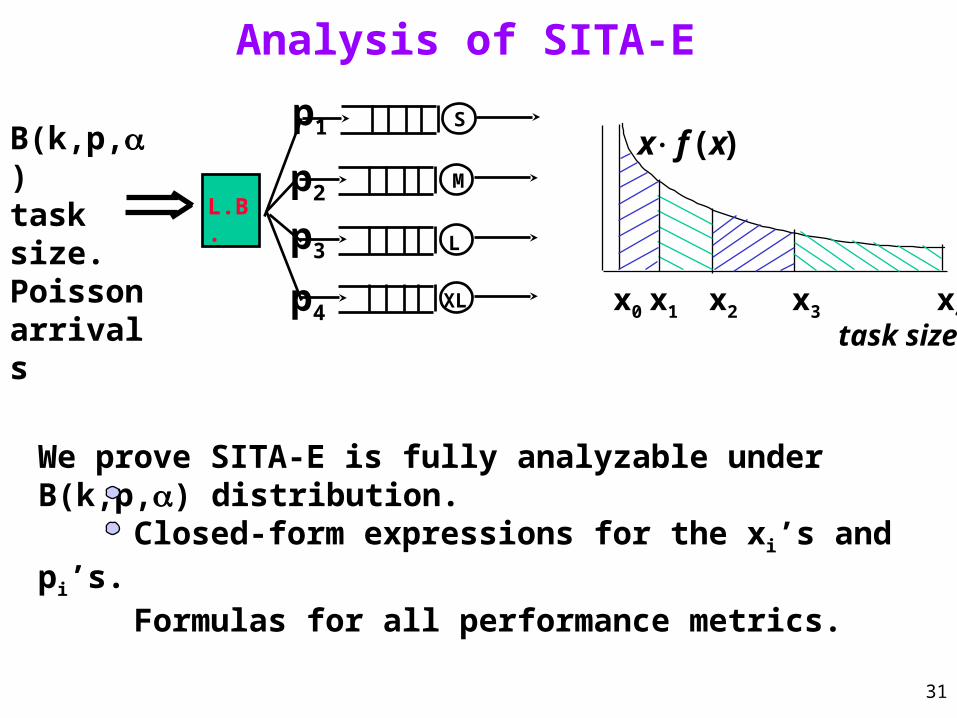
SITA-E : Size Interval Task Assignment with Equal Load
• Assign range of task sizes to each host.• Task size distribution determines cutoff points so load remains balanced, in expectation.
L.B.
S
L
XL
M
task assignmentbased ontask size.
Our Size-Based TAP: SITA-E
task sizex0 x3x2x1 x4
x f x ( )
24
Simulations: Mean Waiting Time• Random & RR similar.• Under less variability (high ), Dynamic best. • Under high variability (lower ), SITA-E beats Dynamic by a factor of 100, and beats RR by a factor of 10000.
Title:simmeanwait.epsCreator:MATLAB, The Mathworks, Inc.Preview:This EPS picture was not savedwith a preview included in it.Comment:This EPS picture will print to aPostScript printer, but not toother types of printers.
25
Simulations: Mean Queue Length• Random & RR similar.• Under less variability (high ), Dynamic best. • Under high variability (lower ), SITA-E beats Dynamic by a factor of 100, and beats RR by a factor of 1000. • In SITA-E, queue length = 2-3, always.
Title:simmeanqueue.epsCreator:MATLAB, The Mathworks, Inc.Preview:This EPS picture was not savedwith a preview included in it.Comment:This EPS picture will print to aPostScript printer, but not toother types of printers.
26
Simulations: Mean Slowdown
• Random & RR similar.• Under less variability (high ), Dynamic best. • Under high variability (lower ), SITA-E beats Dynamic by a factor of 100, and beats RR by a factor of 10000. • In SITA-E, slowdown = 2-3 always.
Title:simmeanslow.epsCreator:MATLAB, The Mathworks, Inc.Preview:This EPS picture was not savedwith a preview included in it.Comment:This EPS picture will print to aPostScript printer, but not toother types of printers.

27
WHY?
28
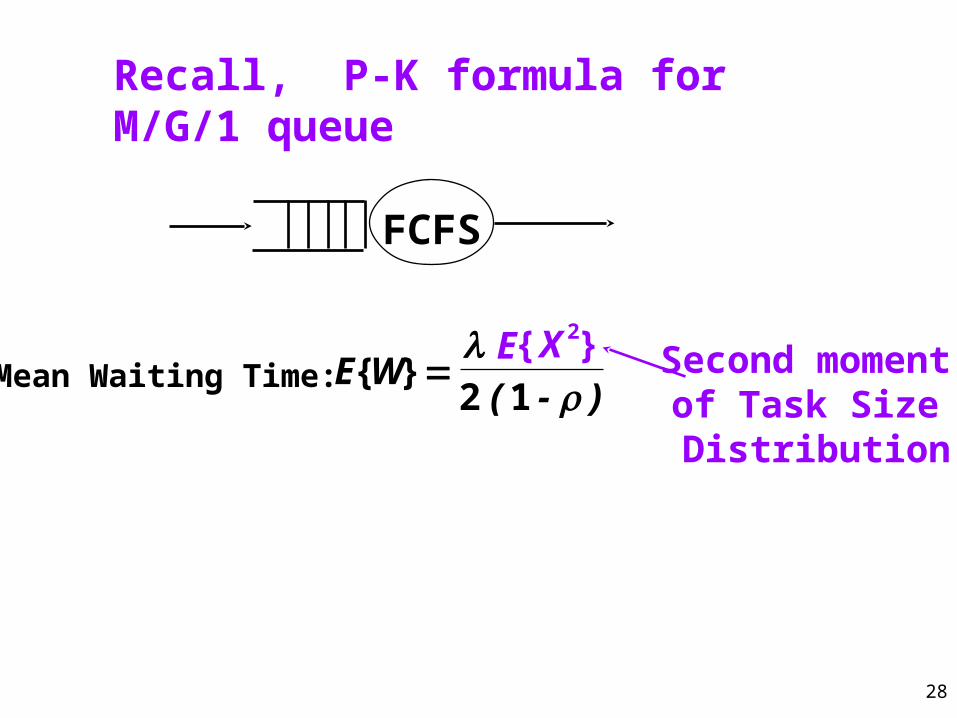
E W
E X
( - ){ }
{ }2
2 1Mean Waiting Time: Second moment
of Task Size Distribution
Recall, P-K formula for M/G/1 queue
FCFS
29
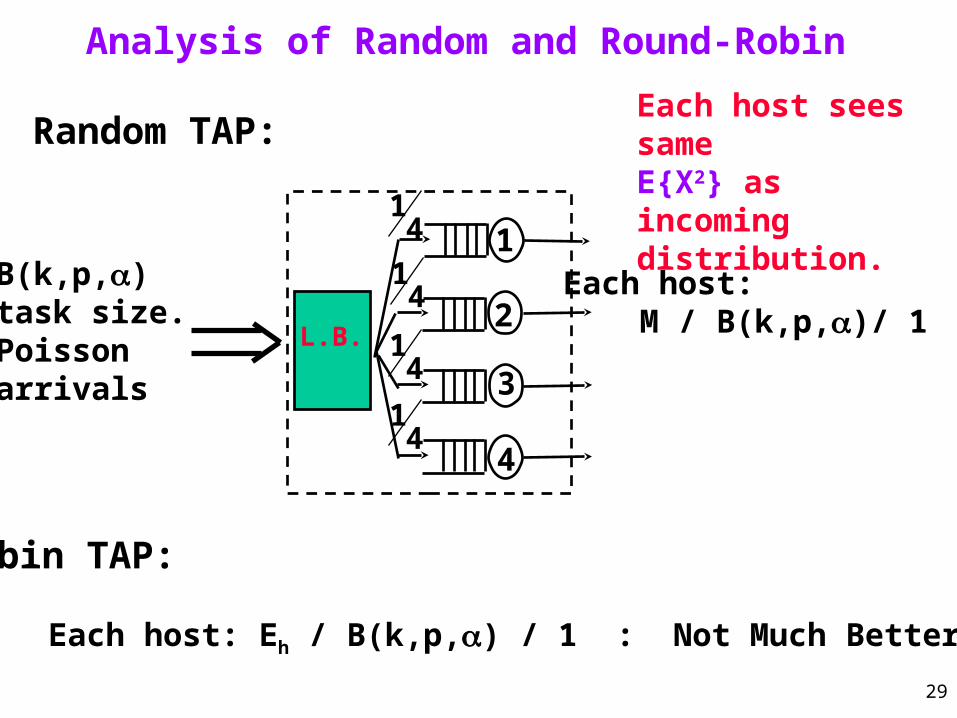
Analysis of Random and Round-Robin
L.B.
3
2
4
1
Random TAP:
B(k,p,)task size.Poissonarrivals
14
14
14
14
Each host: M / B(k,p,)/ 1
Round-Robin TAP:
Each host: Eh / B(k,p,) / 1 : Not Much Better.
Each host sees sameE{X2} as incoming distribution.
30
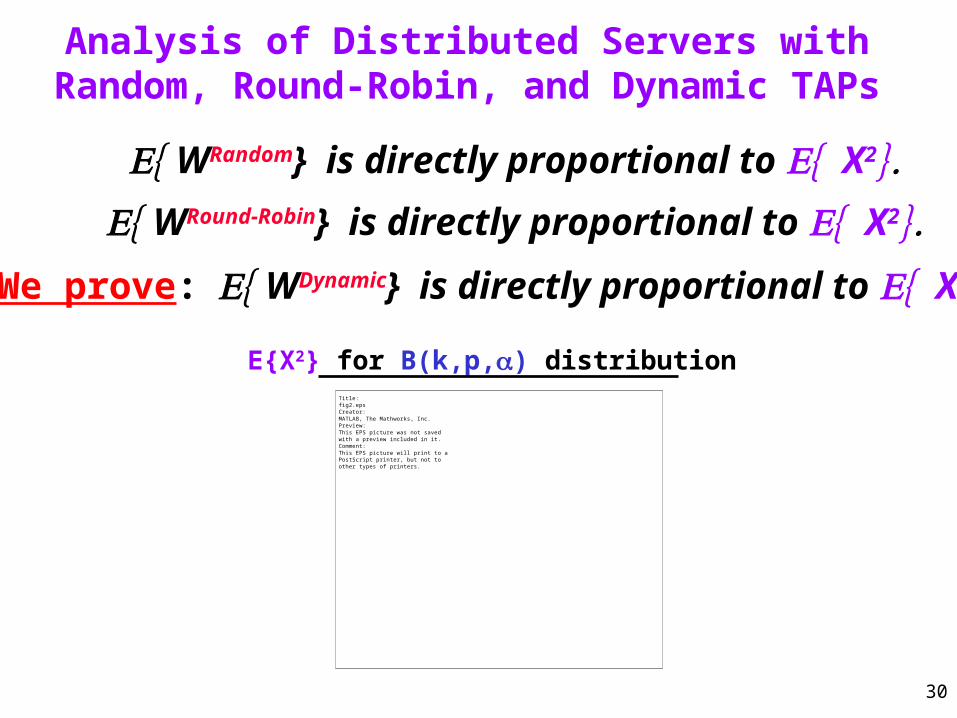
Analysis of Distributed Servers withRandom, Round-Robin, and Dynamic TAPs
WRandom} is directly proportional to X2
WRound-Robin} is directly proportional to X2
We prove: WDynamic} is directly proportional to X2
E{X2} for B(k,p,) distributionTitle:fig2.epsCreator:MATLAB, The Mathworks, Inc.Preview:This EPS picture was not savedwith a preview included in it.Comment:This EPS picture will print to aPostScript printer, but not toother types of printers.
31
Analysis of SITA-E
We prove SITA-E is fully analyzable under B(k,p,) distribution.Closed-form expressions for the xi’s and pi’s.Formulas for all performance metrics.
L.B.
S
L
XL
M
p4
p3
p2
p1B(k,p,)task size.Poissonarrivals
task sizex0 x3x2x1 x4
x f x ( )
32
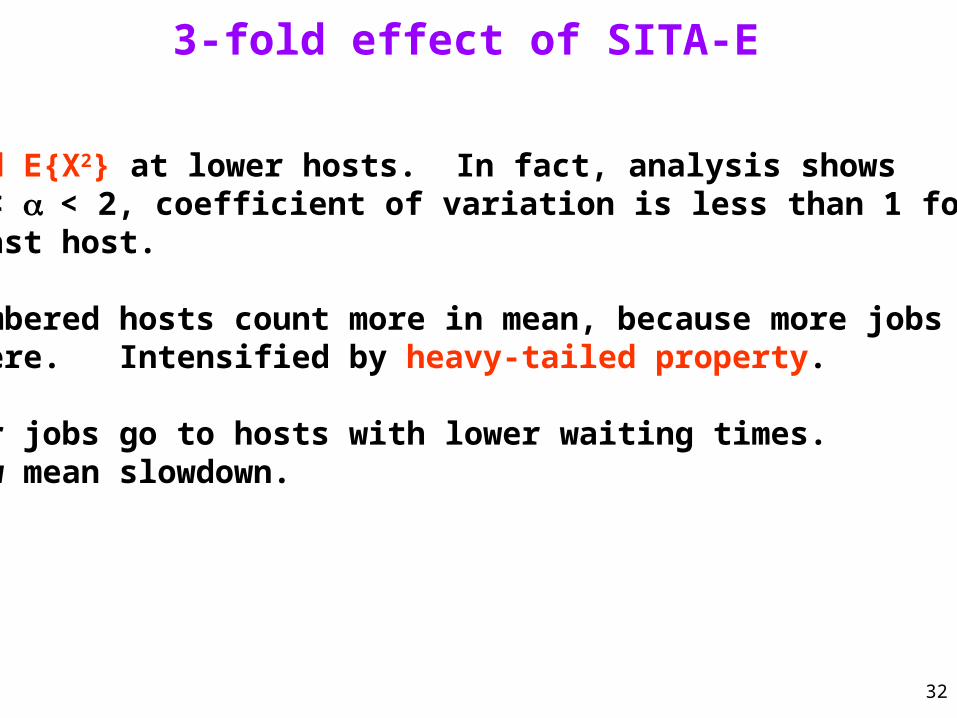
3-fold effect of SITA-E
1. Reduced E{X2} at lower hosts. In fact, analysis shows for 1< < 2, coefficient of variation is less than 1 for all hosts but last host.
2. Low numbered hosts count more in mean, because more jobs go there. Intensified by heavy-tailed property.
3. Smaller jobs go to hosts with lower waiting times. => low mean slowdown.
33
Analytic Results:
Analytically-derivedMean Sowdown
(0 < < 2)
Analytically-derivedMean Sowdown
(1 < < 2)
Title:predmeanslowupclose.epsCreator:MATLAB, The Mathworks, Inc.Preview:This EPS picture was not savedwith a preview included in it.Comment:This EPS picture will print to aPostScript printer, but not toother types of printers.
Title:predmeanslow.epsCreator:MATLAB, The Mathworks, Inc.Preview:This EPS picture was not savedwith a preview included in it.Comment:This EPS picture will print to aPostScript printer, but not toother types of printers.
34
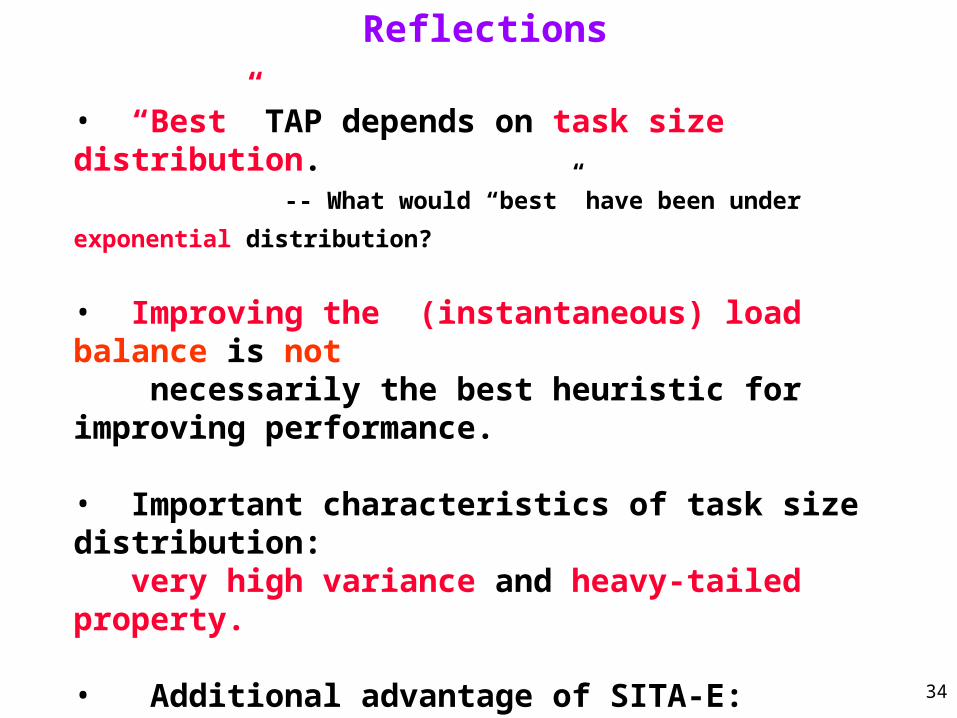
Reflections
• “Best” TAP depends on task size distribution. -- What would “best” have been under exponential distribution?
• Improving the (instantaneous) load balance is not necessarily the best heuristic for improving performance.
• Important characteristics of task size distribution: very high variance and heavy-tailed property.
• Additional advantage of SITA-E: Caching benefits
35
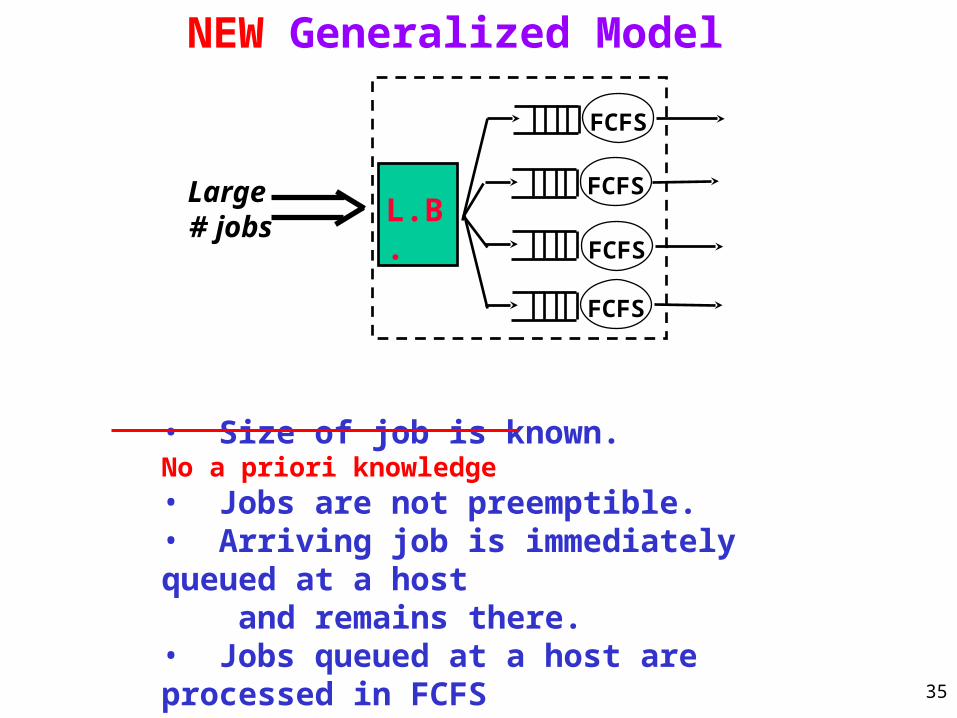
NEW Generalized Model
L.B.Large # jobs
FCFS
FCFS
FCFS
FCFS
• Size of job is known. No a priori knowledge• Jobs are not preemptible.• Arriving job is immediately queued at a host and remains there.• Jobs queued at a host are processed in FCFS order.
36
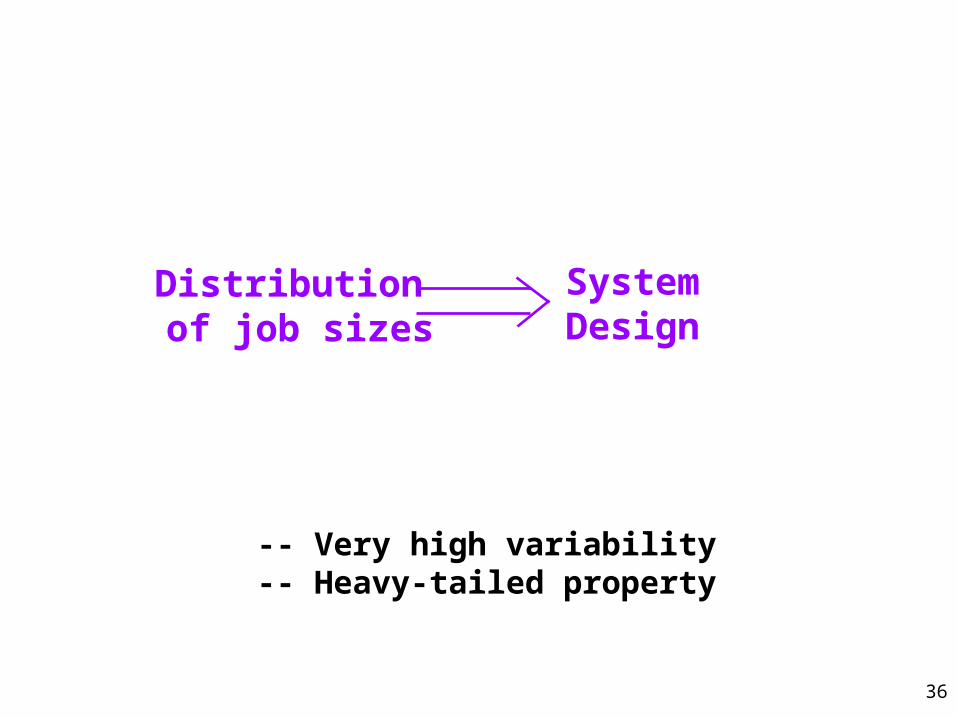
Distribution of job sizes
SystemDesign
-- Very high variability-- Heavy-tailed property
37
The case for SRPT schedulingin Web servers*
The case for SRPT schedulingin Web servers*
Problem 3:
* in progress ...
Joint work with: Crovella, Frangioso, Medina, Sengupta

38
Theoretical Motivation
jobs
(load < 1)
How about using SRPT in Web servers as opposed to the traditional processor-sharing (PS) type scheduling ?
• It’s well known that SRPT minimizes mean flow time.
39
Immediate Objections
• Can’t assume known job size
• Is there enough of a performance gain?
• Starvation, starvation, starvation!
• A real Web server is much more complicated than a single processor
40
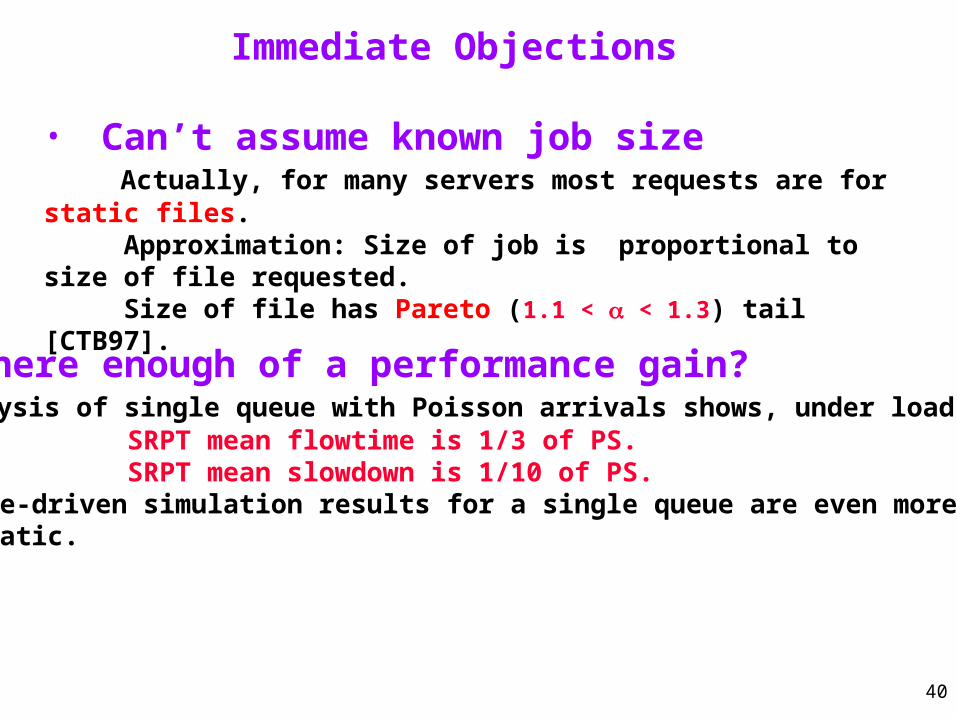
Immediate Objections
• Can’t assume known job size Actually, for many servers most requests are for static files. Approximation: Size of job is proportional to size of file requested. Size of file has Pareto (1.1 < < 1.3) tail [CTB97].
• Is there enough of a performance gain? Analysis of single queue with Poisson arrivals shows, under load = .9, SRPT mean flowtime is 1/3 of PS. SRPT mean slowdown is 1/10 of PS. Trace-driven simulation results for a single queue are even more dramatic.
41
Q: What makes Web workloads special wrt starvation?
Web job size distribution --> Bounded Pareto ( = 1). Largest 1% of all tasks account for more than 50% load.
In exponential distribution, Largest 1% of all tasks account for 5% total load.
A: heavy-tailed property
• Starvation, starvation, starvation! Analysis of single queue shows starvation under SRPT is a problem for many distributions, however NOT for Web workloads. Even jobs in 99%-tile experience mean slowdown far less than PS.
Immediate Objections
42
Immediate Objections
• A real Web server is much more complex than a single processor
• Many devices -- where to do the scheduling?
• One job at a time execution model is no longer appropriate.
Goal: Develop system that maintains high throughput while maximally favoring small jobs.
43
Server Designs for SRPT
1) Coarse approximation to SRPT, familiar programming model.
2 projects
• Thread-per-request.• Thread priority based on size, updatable occasionally.• Implemented as a Web server on Solaris.
2) Closer approximation to SRPT, unusual programming model.
• No longer thread-per-request. Instead, thread-per-queue.• Read, write queues managed in SRPT order.• Implemented as a Web server on Linux.
44
Preliminary Results
Mean Response Time as a function of Server Load
Title:latency.epsCreator:MATLAB, The Mathworks, Inc.Preview:This EPS picture was not savedwith a preview included in it.Comment:This EPS picture will print to aPostScript printer, but not toother types of printers.
45
Distribution of job sizes
SystemDesign
-- Heavy-tailed property
46
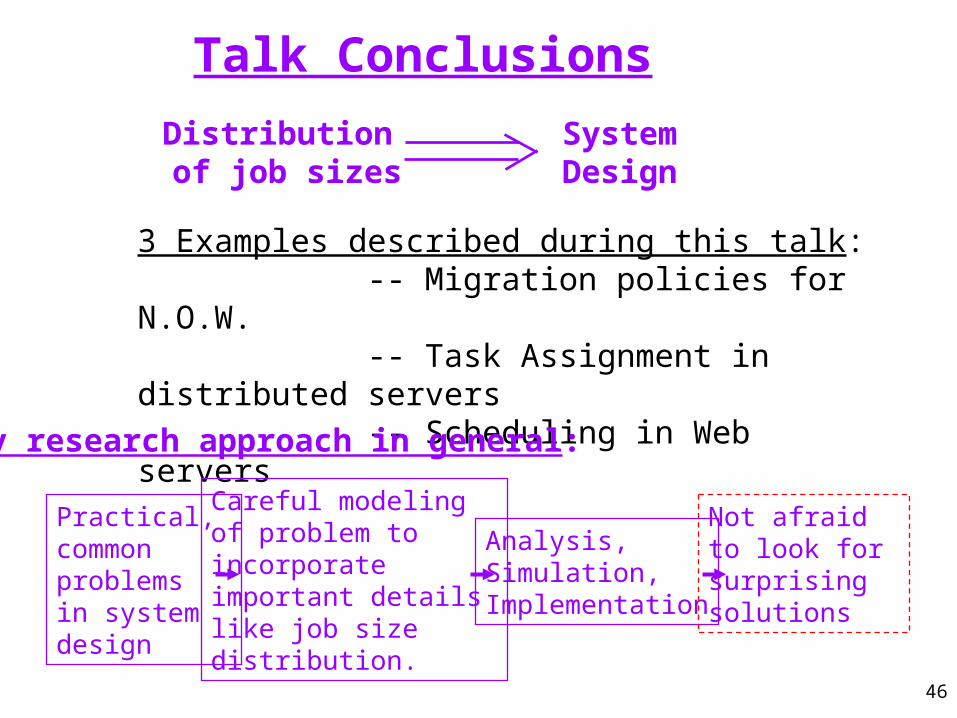
Talk Conclusions
3 Examples described during this talk: -- Migration policies for N.O.W. -- Task Assignment in distributed servers -- Scheduling in Web servers
Distribution of job sizes
SystemDesign
Practical, commonproblemsin system design
Careful modeling of problem to incorporate important details like job size distribution.
Analysis,Simulation,Implementation
Not afraid to look for surprising solutions
My research approach in general:
47
L.B.
1
3
4
2
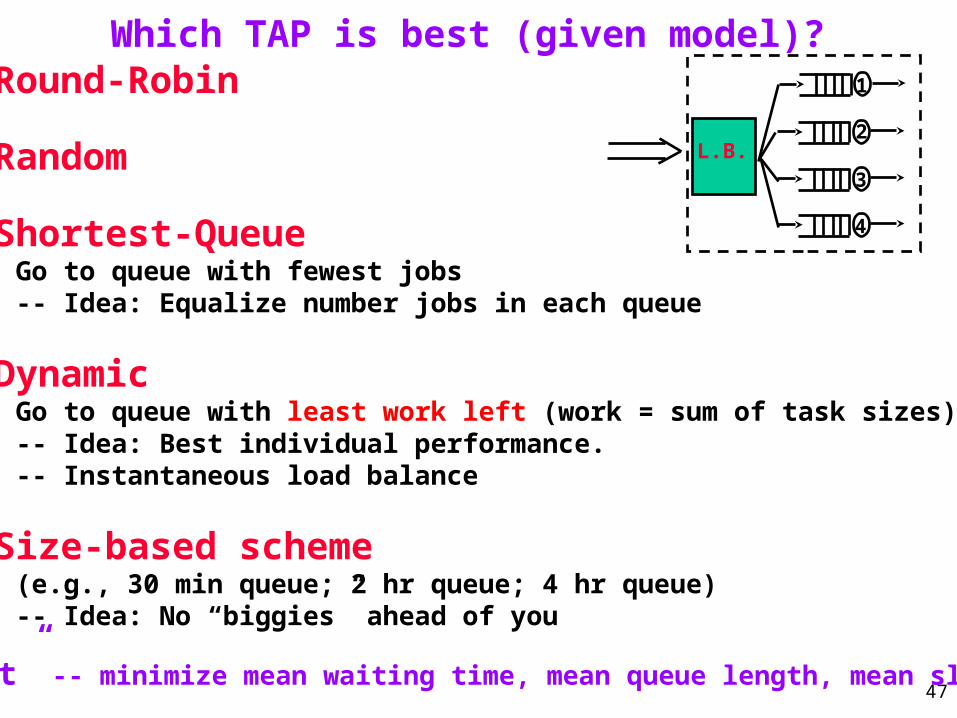
Which TAP is best (given model)? 1. Round-Robin
2. Random
3. Shortest-Queue Go to queue with fewest jobs -- Idea: Equalize number jobs in each queue
4. Dynamic Go to queue with least work left (work = sum of task sizes) -- Idea: Best individual performance. -- Instantaneous load balance
5. Size-based scheme (e.g., 30 min queue; 2 hr queue; 4 hr queue) -- Idea: No “biggies” ahead of you
“best” -- minimize mean waiting time, mean queue length, mean slowdown
48
Preliminary Results
Mean Response Time as a function of Server Load
Title:srptps.epsCreator:MATLAB, The Mathworks, Inc.Preview:This EPS picture was not savedwith a preview included in it.Comment:This EPS picture will print to aPostScript printer, but not toother types of printers.
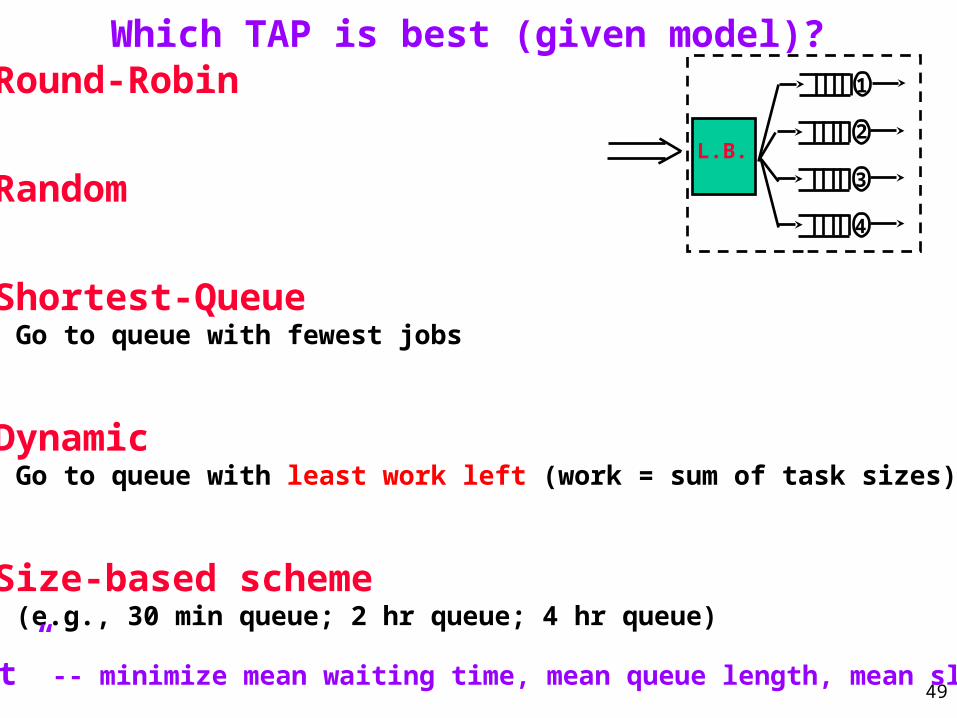
49
L.B.
1
3
4
2
Which TAP is best (given model)? 1. Round-Robin
2. Random
3. Shortest-Queue Go to queue with fewest jobs
4. Dynamic Go to queue with least work left (work = sum of task sizes)
5. Size-based scheme (e.g., 30 min queue; 2 hr queue; 4 hr queue)
“best” -- minimize mean waiting time, mean queue length, mean slowdown


![Thesis Oral VARUN GUPTA - University of Chicagohome.uchicago.edu/~guptav/talks/thesis_slides.pdf · 38 [Performance’] V. Gupta, M. Harchol-Balter, K. Sigman, and W. Whitt. Analysis](https://img.pdfslide.us/doc/110x75/5ed9cf0ac775f12f0c206f3c/thesis-oral-varun-gupta-university-of-guptavtalksthesisslidespdf-38-performancea.jpg)


![ISAAC GROSOF, MOR HARCHOL-BALTER, arXiv:1905.03439v1 [cs.PF] 9 … · MOR HARCHOL-BALTER, Carnegie Mellon University, USA Load balancing systems, comprising a central dispatcher and](https://img.pdfslide.us/doc/110x75/5ec423f9f8c238719566f720/isaac-grosof-mor-harchol-balter-arxiv190503439v1-cspf-9-mor-harchol-balter.jpg)