Embed Size (px)
Citation preview

1
The Art and Science of Valuation
Prepared for Faegre & Benson April 19, 2006

2
Overall Agenda Part 1: Capturing the Attention of the
Venture Capitalist Part 2: Understanding the state of the
Venture Capital Industry Part 3: Valuation Overview

3
Part 1 Agenda Part 1: Capturing the Attention of the
Venture Capitalist Finding the right VC Courting the right VC Management Team Market Characteristics How hard can it be?
Part 2: Understanding the state of the Venture Capital Industry
Part 3: Valuation Overview

4
Finding the Right VC
Do Your Homework
Buying Criteria Just Like a
Customer

5
Courting the Right VC
Online Dating Anonymous Highly
Competitive 1 Chance

6
“As a founder, think hardest about the team. Are these the people I want to be in trouble with for the next 5, 10, 15 years of my life? Because as you build a new business, one thing’s for sure: you will get into trouble.”
John Doerr, Kleiner Perkins Caufield & Byers
Management Team

7
Investing In TalentFactors considered most important by investment professionals(Weighted importance out of 100*)
Management Team
Market Sector
Business Model
Proprietary Product/Service
37
24
20
19
Source: Spencer Stuart/NVCA VC-backed Leadership survey

8
Market Characteristics Worth Winning
$250 million Sustainable
Drivers Y2k
Well Defined Sub-segment

9
How Hard can it Be?
10
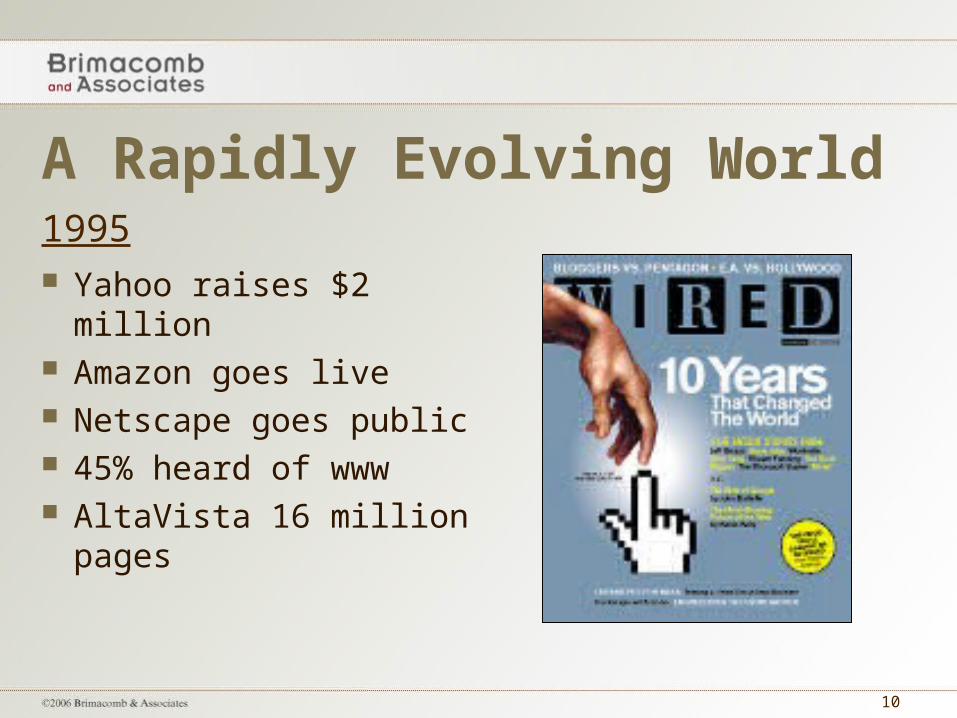
A Rapidly Evolving World
Yahoo raises $2 million Amazon goes live Netscape goes public 45% heard of www AltaVista 16 million
pages
1995

11
Technology is only the Ante
12
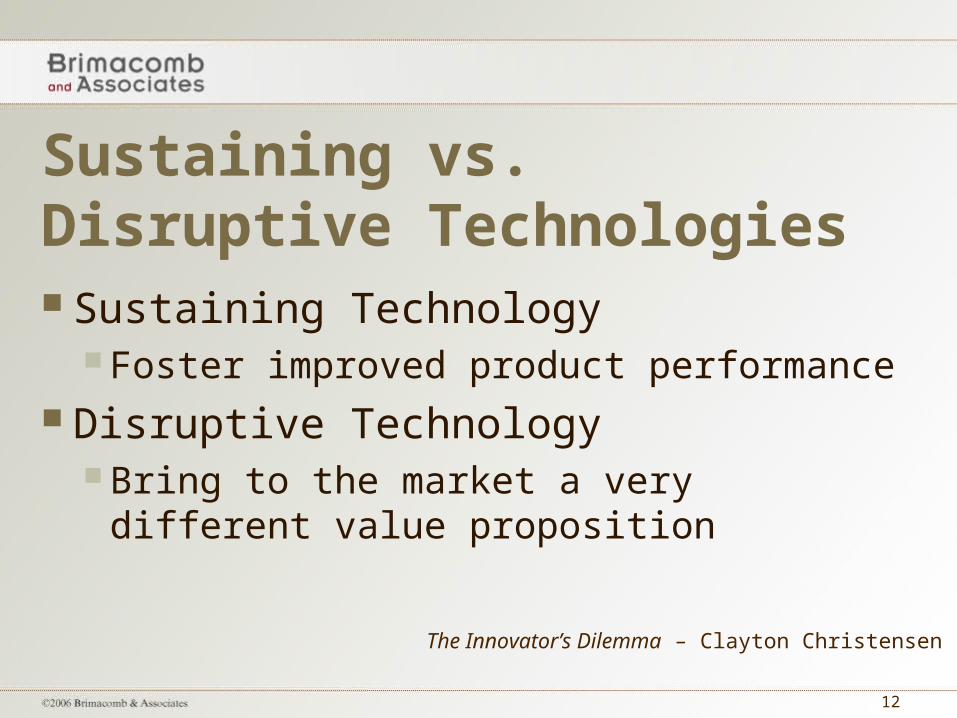
Sustaining vs. Disruptive Technologies Sustaining Technology
Foster improved product performance Disruptive Technology
Bring to the market a very different value proposition
The Innovator’s Dilemma – Clayton Christensen

13
Sustaining vs. Disruptive Technologies
Sustaining Technology Improves
performance along an existing utility curve
A
BSustaining Technology
Cost
Performance

14
Sustaining vs. Disruptive Technologies
Disruptive Technology Moves the market
to new utility curveA
Disruptive Technology
B
Cost
Performance

15
Explicit Need / Compelling ROI
IT Budgets and ROI:“Purse strings are loosening ever so slightly, but that won’t slow the quest for better metrics”

16
Part 2 Agenda Part 1: Capturing the Attention of the
Venture Capitalist Part 2: Understanding the state of the
Venture Capital Industry Locations: East Coast / West Coast and everywhere else State of Emerging Market Funding US Market Trend Minnesota Market Trend Pre-Bubble Normal
Part 3: Valuation Overview

17
Locations: CA, MA and then the Rest

18
State of Emerging Company Funding(Hint: Small VC Funds are Disappearing )

19
U.S. Venture Capital Market Trend Info
% of U.S. VC
0%
10%
20%
30%
40%
50%
60%
70%
1995
-1
1996
-1
1997
-1
1998
-1
1999
-1
2000
-1
2001
-1
2002
-1
2003
-1
2004
-1
2005
-1
Expansion Later StageEarly Stage Seed Stage
Group Median Expansion – 53% Later Stage –
18% Early Stage –
22% Seed Stage – 4%
Source: PWC MoneyTree
20
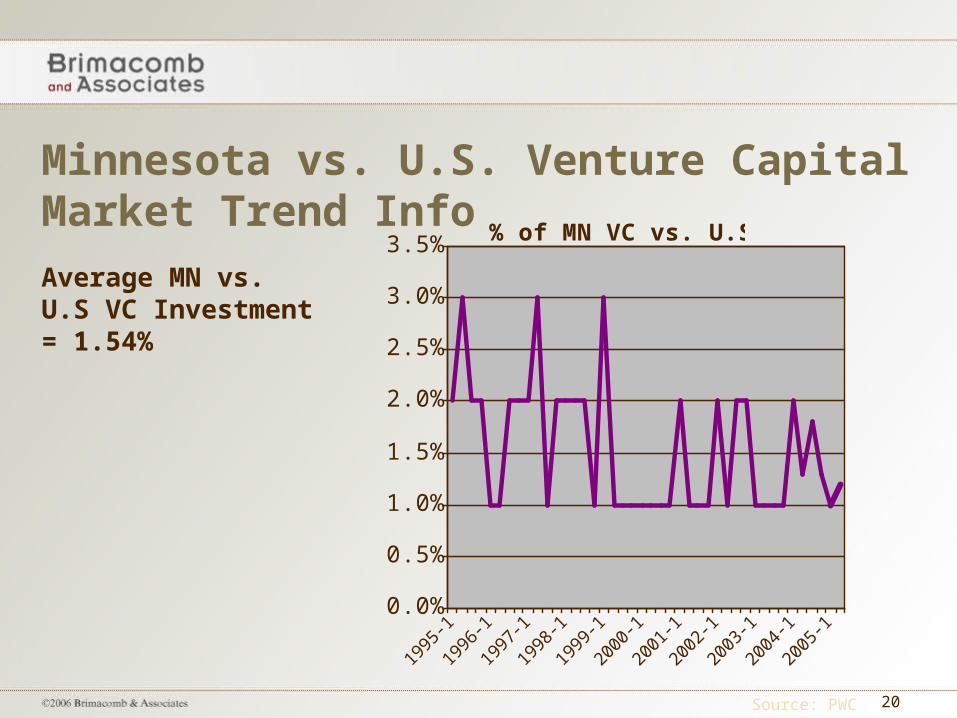
Minnesota vs. U.S. Venture Capital Market Trend Info
Source: PWC MoneyTree
% of MN VC vs. U.S. VC
0.0%
0.5%
1.0%
1.5%
2.0%
2.5%
3.0%
3.5%
1995
-1
1996
-1
1997
-1
1998
-1
1999
-1
2000
-1
2001
-1
2002
-1
2003
-1
2004
-1
2005
-1
Average MN vs. U.S VC Investment = 1.54%

21
A Pre-Bubble NormalValution Trends
0
20
40
60
80
100
120
140
1995 1996 1997 1998 1999 2000 2001 2002 2003 2004 2005
$ i
n M
illi
on
s Seed
Early
Expansion
Later
BuyOut

22
Part 3 Agenda Part 1: Capturing the Attention of the
Venture Capitalist Part 2: Understanding the state of the
Venture Capital Industry Part 3: Valuation Overview
Valuation Start-Up Stages Equity Financing Food Chain Sherpa Guide to Success Valuation Methodology A Lesson from Charles Darwin
23
Valuation is Chess Not Checkers

24
Stages of a Startup
Definition and Validation
Prove Solution is Repeatable
Grow the Channel to Capture Opportunity

25
Seed Stage
100% – 30% IRR
Early Stage – (Sherpa)
50% - 20% IRR
Expansion Stage
25% - 15% IRR
Late Stage
20% - 12% IRR
Early Adopter Customers
Early Majority Customers
Late Majority Customers
Innovation Customers
Friends/Family
Angels Institutional - VCs Public Market
Equity Financing Food ChainReturn Expectations

26
Return Expectations

27
Return Expectations
5-10x your investment
or30%+ IRR

28
Sherpa Pocket Guide to Success
Quick Go vs. No Go Decision
(4x in 5 Years = 32% IRR)

29
Valuation Methodology1. Determine valuation
in an out year
Revenue in year 5 is $20 million
Use a multiplier (i.e., revenue, operating income, earnings, subscribers, locations, etc.) to determine value
A revenue multiple of 2x would make the company value $40 million in year 5
2. Compare future value with current value
Divide the future value ($40 million) by the post-money valuation
Post-money value of $10 million means this investment increased in value by 4x ($40 million / $10 million)
4x in 5 years equals a 32% IRR

30
“It is not the strongest of the species that survives, nor the most intelligent; it is the one that is most adaptable to change.”
- Charles Darwin, British Naturalist

31
Recap Part 1: Capturing the Attention of the
Venture Capitalist Part 2: Understanding the state of the
Venture Capital Industry Part 3: Valuation Overview

32
Rick BrimacombFounder, Brimacomb & AssociatesGeneral Partner, Sherpa PartnersBoard Member, Minnesota Venture Capital
Association
Jason VoiovichPrincipal, Ecra Creative [email protected]


![Benson Lecture Inpla[1] Phil Benson](https://img.pdfslide.us/doc/110x75/5549e849b4c90518488b4ca4/benson-lecture-inpla1-phil-benson.jpg)
![George Benson - The Best of George Benson[1]](https://img.pdfslide.us/doc/110x75/5695cf541a28ab9b028d9c4a/george-benson-the-best-of-george-benson1.jpg)