Embed Size (px)
Citation preview
Machine Vision140.429 Texture Analysis Using Co-Occurrence Matrix----------------------------------------------------------------------------------------------------------------------------
1
1. Texture
1.1 Introduction
Texture is a measure of the variation of the intensity of a surface, quantifying properties such as smoothness, coarseness and regularity. It's often used as a region descriptor in image analysis and computer vision.
The three principal approaches used to describe texture are statistical, structural and spectral. Statistical techniques characterise texture by the statistical properties of the grey levels of the points comprising a surface. Typically, these properties are computed from the grey level histogram or grey level co occurrence matrix of the surface.
Structural techniques characterise texture as being composed of simple primitives called "texels" (texture elements), that are regularly arranged on a surface according to some rules. These rules are formally defined by grammars of various types.
Spectral techniques are based on properties of the Fourier spectrum and describe global periodicity of the grey levels of a surface by identifying high energy peaks in the spectrum.
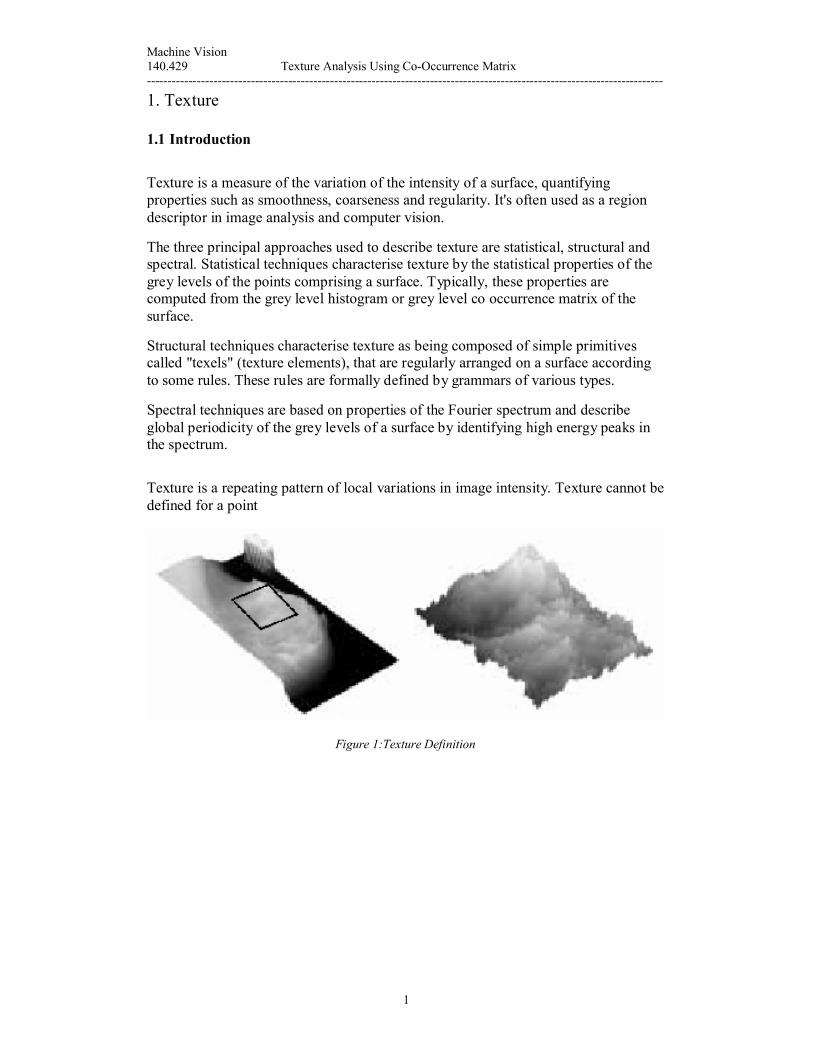
Texture is a repeating pattern of local variations in image intensity. Texture cannot be defined for a point
Figure 1:Texture Definition

Even numbered pages not converted in the evaluation version
To purchase easyPDFgo to our website at
http://www.bcltechnologies.com

Machine Vision140.429 Texture Analysis Using Co-Occurrence Matrix----------------------------------------------------------------------------------------------------------------------------
3
2. Texture Analysis
2.1 Introduction
Texture analysis and synthesis is very important for computer graphics, vision, and image processing. During analysis, an example texture is summarized into a nonlinear deterministic function using tree structure vector quantization. An output texture, initially random noise, is then synthesized from this estimated function.
Many applications in computer graphics, vision, and image processing can benefit from a texture analysis and synthesis algorithm. For example, textures have long beenused to decorate object surfaces in computer rendered images. However, natural textures are often difficult to generate manually; therefore an algorithm to synthesize a large texture from a small scanned patch will be desirable. In machine vision, the ability to discriminate, segment, or classify textures is essential for tasks such as automatic inspection. Natural texture images are also notoriously hard to compress due to their high frequency contents, and compact representation may be achieved via a good texture analysis algorithm. Despite these wide applicability, however, an algorithm that is both efficient and capable of representing all the texture properties has yet to come.
2.2 Texture Model
Texture is a common visual experience. However, a precise definition of texture is difficult to formulate. Traditionally, textures have been categorized as either structural or stochastic. A structural texture is characterized by a set of primitives (texons) and placement rules. For example, a brick wall texture is generated by tiling up bricks (primitives) in a layered fashion (the placement rule). A stochastic texture, on the other hand, do not contain explicit primitives (such as grass and sand). Since most natural textures are neither complete stochastic nor structural, we attempt tocharacterize both kinds of textures with a single model. The probability distribution of the intensity value for a single pixel is completely determined by the intensity values of pixels in its spatial neighborhood. More formally, let N(x, y) be the collection of pixel values in the neighborhood of a pixel located at (x, y). Then thevalue of pixel (x, y), I(x, y), can be represented as follows:
where F is a probability distribution that determines the pixel value of I(x, y) from its neighborhoods N(x, y). The size of the neighborhood determines the “randomness” of the texture. Textures with regular patterns such as tiled floor require large neighborhoods, while small neighborhoods are sufficient for stochastic textures as such sand beach. Given such a model, the goal of a texture analysis and synthesis

Even numbered pages not converted in the evaluation version
To purchase easyPDFgo to our website at
http://www.bcltechnologies.com
Machine Vision140.429 Texture Analysis Using Co-Occurrence Matrix----------------------------------------------------------------------------------------------------------------------------
5
3. Grey Level Co-Occurrence Matrix
3.1 Introduction
The role of automatic visual inspection has grown up during the last decade in the same way as the computational power has increased and the prize of computation has decayed. Visual inspection, especially, in the sense of visual quality control has gained in popularity. Nowadays, several commercial applications are available e.g. in paper mills in saw mills, and in rock industry. Most of these applications are based on texture classification.
Visual texture contains variations of intensities, which form certain repeated patterns. Those patterns can be caused by physical surface properties, such as roughness, or they could result from reflectance differences, such as the color on a surface. Differences observed by visual inspection are difficult to define in quantitative manner, which leads to demand of defining texture using some features.
Among the current approaches used in image processing to describe texture, the so called statistical approach is the widely used because it produces good results with low computational costs. This method considers the distribution of gray levels and their interrelationship. The pixel values are used to construct numerical structures which are associated to the texture pattern of the image. This pattern is based mainly on the inter-relationship between one pixel and its neighbors.
Grey Level Co-Occurrence Matrix (GLCM) is one of the best known texture Analysis methods. GLCM estimates image properties related to second order statistics. Each entry (i,j) in GLCM corresponds to the number of occurrences of the pair of grey levels I and j which are a distance d apart in the original image.
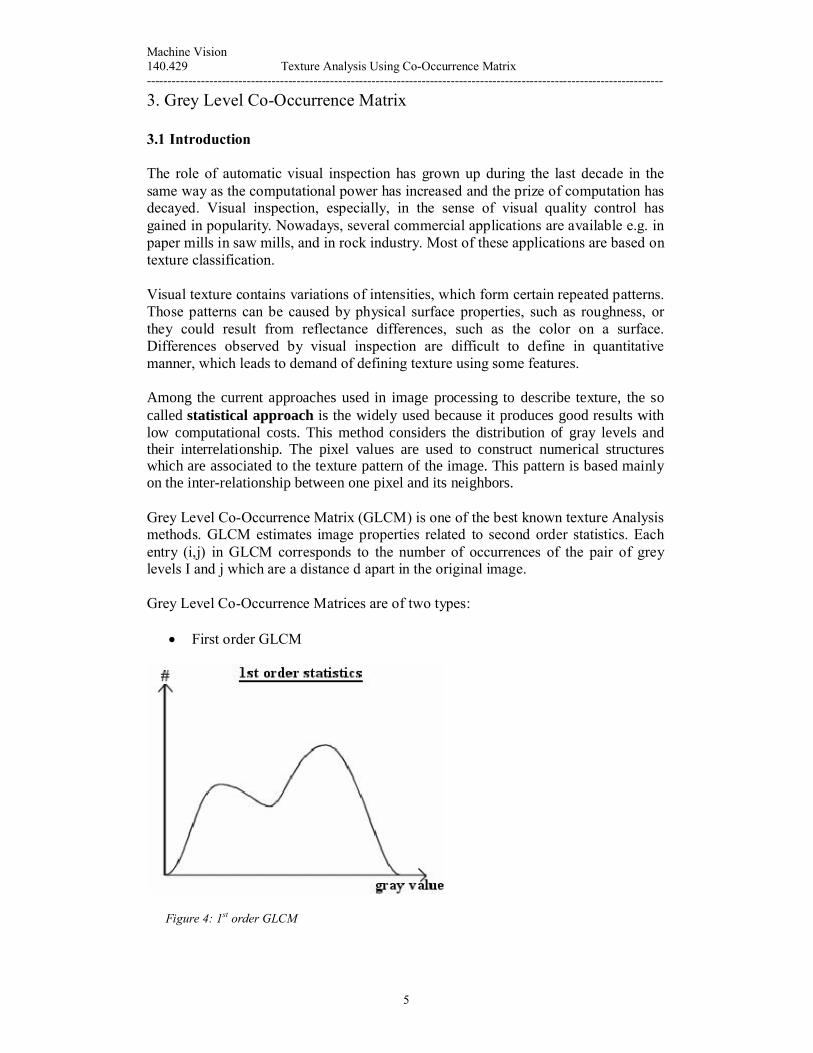
Grey Level Co-Occurrence Matrices are of two types:
First order GLCM
Figure 4: 1st order GLCM

Even numbered pages not converted in the evaluation version
To purchase easyPDFgo to our website at
http://www.bcltechnologies.com
Machine Vision140.429 Texture Analysis Using Co-Occurrence Matrix----------------------------------------------------------------------------------------------------------------------------
7
3.2 Mathematical Framework of GLCM
A co-occurrence matrix is a square matrix with elements corresponding to the relative frequency ofOccurrence of pairs of gray level of pixels separated by a certain distance in a given direction. Formally, the elements of a GxG gray level co-occurrence matrix Pd for a displacement vector d = (dx,dy) is defined as :Pd (i,j ) = |{((r,s) , (t,v)) :I (r, s)=i, I (t, v)= j}|where I (×,× ) denote an image of size NxN with G gray values, (r, s), ( t, v)Î NxN, (t,v)=(r + dx, s + dy) and |. | is the cardinality of a set.
Haralick, Shanmugan and Dinstein proposed 14 measures of textural features which are derived from the co-occurrence matrices, and each represents certain image properties as coarseness, contrast, homogeneity and texture complexity. Those that most commonly used are given below:
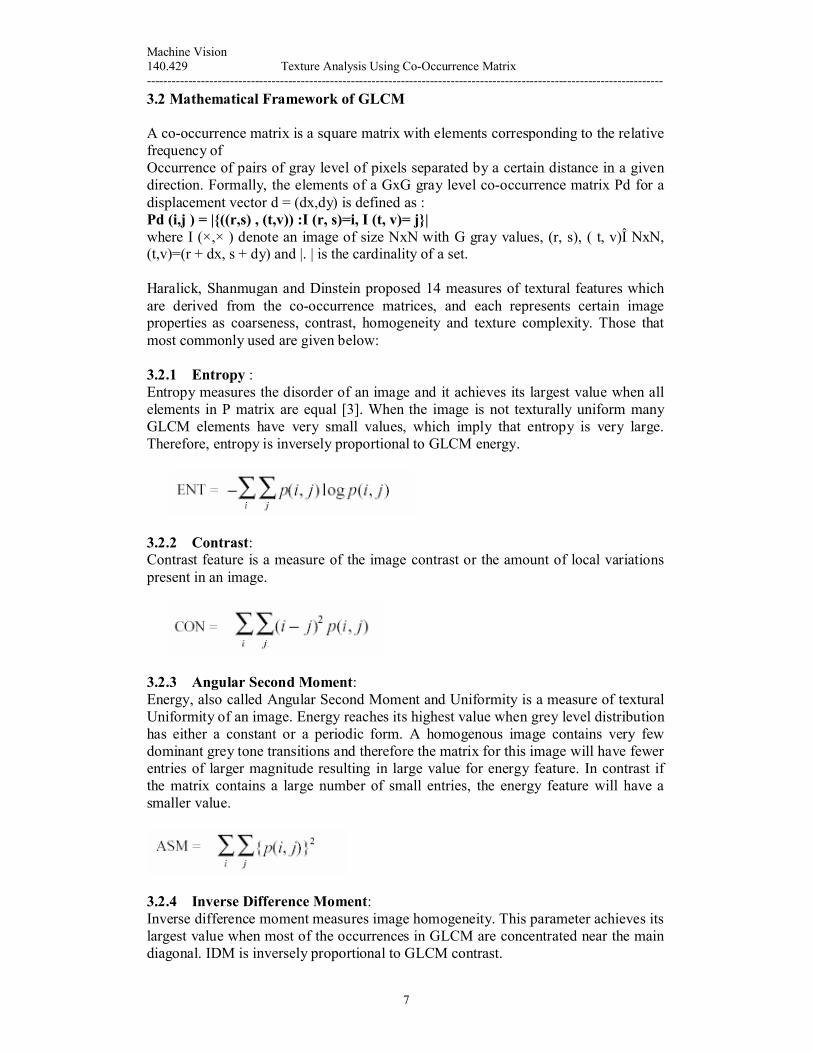
3.2.1 Entropy :Entropy measures the disorder of an image and it achieves its largest value when all elements in P matrix are equal [3]. When the image is not texturally uniform many GLCM elements have very small values, which imply that entropy is very large. Therefore, entropy is inversely proportional to GLCM energy.
3.2.2 Contrast:Contrast feature is a measure of the image contrast or the amount of local variations present in an image.
3.2.3 Angular Second Moment:Energy, also called Angular Second Moment and Uniformity is a measure of textural Uniformity of an image. Energy reaches its highest value when grey level distribution has either a constant or a periodic form. A homogenous image contains very few dominant grey tone transitions and therefore the matrix for this image will have fewer entries of larger magnitude resulting in large value for energy feature. In contrast if the matrix contains a large number of small entries, the energy feature will have asmaller value.
3.2.4 Inverse Difference Moment:Inverse difference moment measures image homogeneity. This parameter achieves its largest value when most of the occurrences in GLCM are concentrated near the main diagonal. IDM is inversely proportional to GLCM contrast.

Even numbered pages not converted in the evaluation version
To purchase easyPDFgo to our website at
http://www.bcltechnologies.com
Machine Vision140.429 Texture Analysis Using Co-Occurrence Matrix----------------------------------------------------------------------------------------------------------------------------
9
The figure above is a 3D image of the Grey Level Co-Occurrence Matrix of the example shown above with d=1 and angle equal to 0 degrees (? = 0? )
After these calculation is done, the matrix is reduced by dividing each value by normalization factors rendering a matrix whose sum is equal to 1. One co-occurrencematrix is created for each pair direction-distance considered by the texture analysis.
Descriptor. Having a co-occurrence matrix, different properties of the pixel distribution can be obtained by applying mathematical operations on the matrix values. These operations are called descriptors. Each descriptor is related to a particular visual feature about texture. The most common descriptors are already described above ( Entropy, contract etc..)
Image Signature. This is a numeric value or a set of them, which can be used to represent an image regarding one or more characteristics of it. For example, one signature that can be assigned to an image is a vector of values obtained from the application of the Energy descriptor over its set of co-occurrence matrices. The image signature is generally used as parameter of comparison between two images.
3.4 Method in 4 steps:
Step 1: Obtain the co-occurrence matrices of each image. The gray levels of the image are reduced to 16. For 0 degrees, 45 degrees, 90 degrees and 135 degreesdirections, and distances 1, 2, 3, 4 and 5, calculate the corresponding co-occurrence matrix. This produces 20 matrices of 16x16 integer elements per image.
Step 2: Obtain the values for the chosen descriptors. For each co-occurrence matrix, the value for the descriptor (or descriptors) is calculated. For each image, the resulting descriptor values are stored in a matrix where the rows represent the directions 0degrees, 45 degrees, 90 degrees and 135 degrees and the columns represent distances 1, 2, 3, 4 and 5.
Step 3: Generate image signatures. The image signatures are calculated from the descriptor matrix by averaging the values obtained with the different distances for each direction. Aiming at eliminating dependencies of image rotation, distances are calculated with different "rotations" on the elements of the signatures and the smaller one is adopted.
Step 4: Compare the images through their signatures. The signatures of two images are compared and the distance between them is calculated, using the Euclidean distance function on the elements of the signature.
3.5 Grey Level Co-Occurrence Matrix Algorithm:

Even numbered pages not converted in the evaluation version
To purchase easyPDFgo to our website at
http://www.bcltechnologies.com
Machine Vision140.429 Texture Analysis Using Co-Occurrence Matrix----------------------------------------------------------------------------------------------------------------------------
11
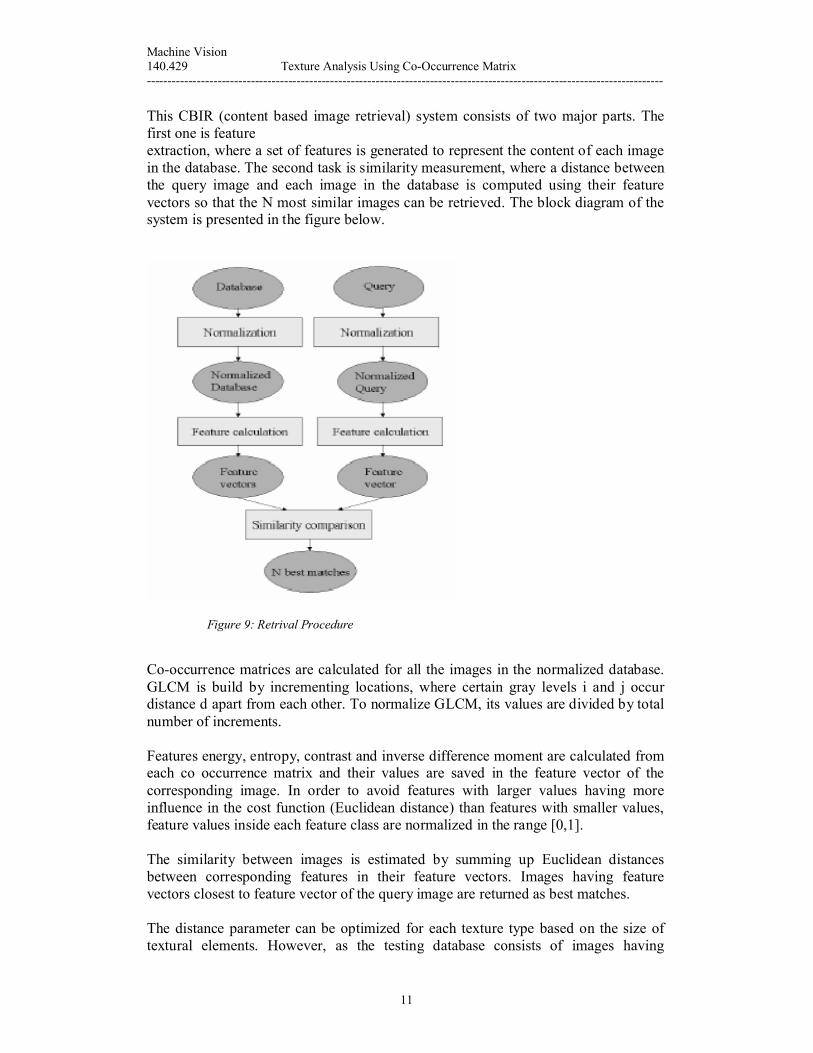
This CBIR (content based image retrieval) system consists of two major parts. The first one is featureextraction, where a set of features is generated to represent the content of each image in the database. The second task is similarity measurement, where a distance between the query image and each image in the database is computed using their feature vectors so that the N most similar images can be retrieved. The block diagram of the system is presented in the figure below.
Figure 9: Retrival Procedure
Co-occurrence matrices are calculated for all the images in the normalized database. GLCM is build by incrementing locations, where certain gray levels i and j occur distance d apart from each other. To normalize GLCM, its values are divided by total number of increments.
Features energy, entropy, contrast and inverse difference moment are calculated from each co occurrence matrix and their values are saved in the feature vector of the corresponding image. In order to avoid features with larger values having more influence in the cost function (Euclidean distance) than features with smaller values, feature values inside each feature class are normalized in the range [0,1].
The similarity between images is estimated by summing up Euclidean distances between corresponding features in their feature vectors. Images having feature vectors closest to feature vector of the query image are returned as best matches.
The distance parameter can be optimized for each texture type based on the size of textural elements. However, as the testing database consists of images having
Even numbered pages not converted in the evaluation version
To purchase easyPDFgo to our website at
http://www.bcltechnologies.com
Machine Vision140.429 Texture Analysis Using Co-Occurrence Matrix----------------------------------------------------------------------------------------------------------------------------
13
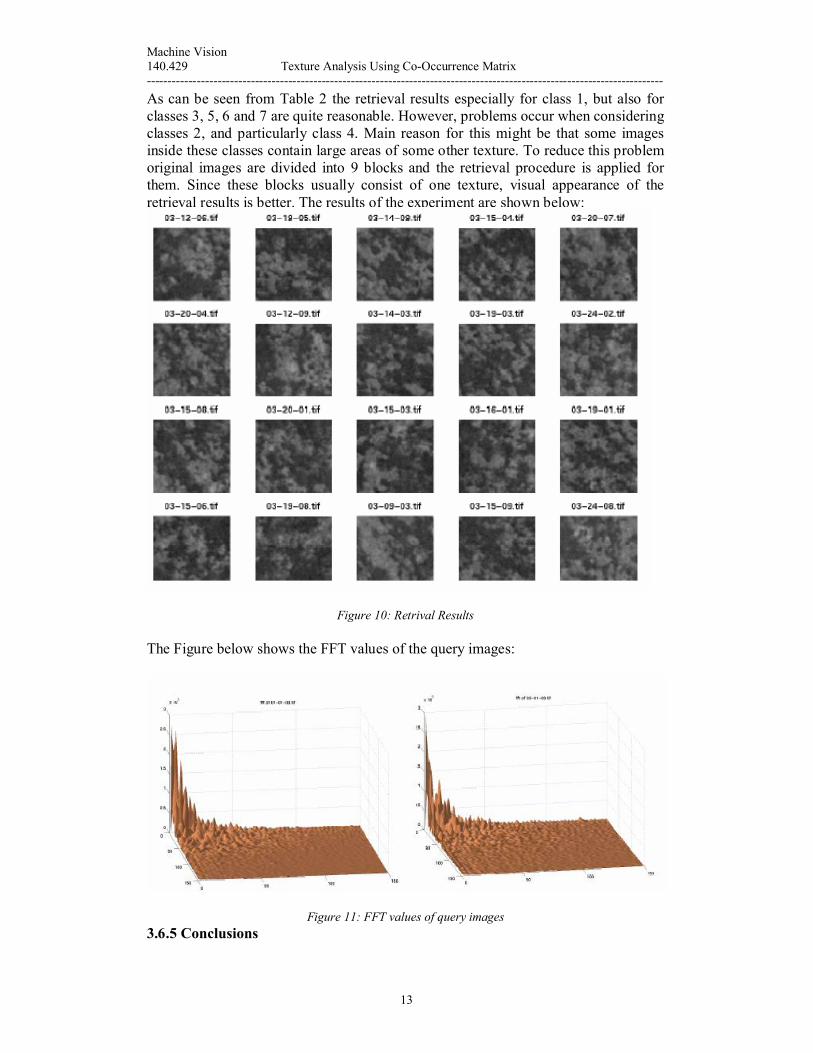
As can be seen from Table 2 the retrieval results especially for class 1, but also for classes 3, 5, 6 and 7 are quite reasonable. However, problems occur when considering classes 2, and particularly class 4. Main reason for this might be that some images inside these classes contain large areas of some other texture. To reduce this problem original images are divided into 9 blocks and the retrieval procedure is applied for them. Since these blocks usually consist of one texture, visual appearance of the retrieval results is better. The results of the experiment are shown below:
Figure 10: Retrival Results
The Figure below shows the FFT values of the query images:
Figure 11: FFT values of query images3.6.5 Conclusions

Even numbered pages not converted in the evaluation version
To purchase easyPDFgo to our website at
http://www.bcltechnologies.com
Machine Vision140.429 Texture Analysis Using Co-Occurrence Matrix----------------------------------------------------------------------------------------------------------------------------
15
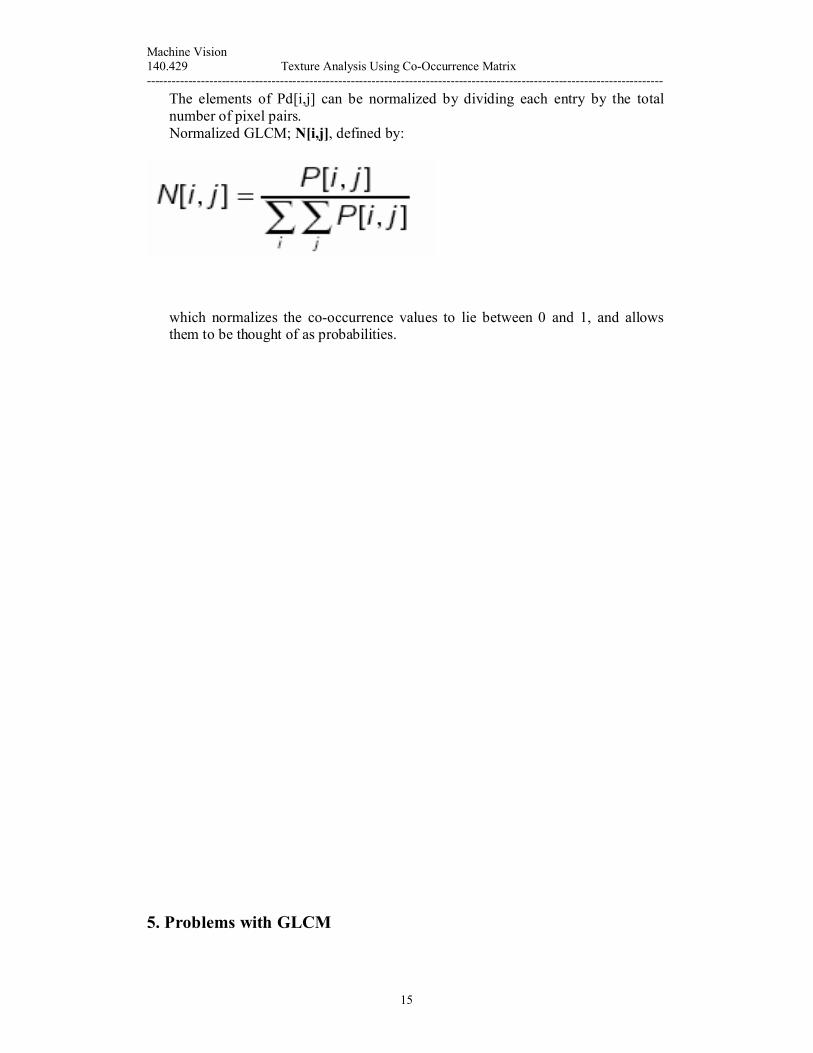
The elements of Pd[i,j] can be normalized by dividing each entry by the total number of pixel pairs.
Normalized GLCM; N[i,j], defined by:
which normalizes the co-occurrence values to lie between 0 and 1, and allows them to be thought of as probabilities.
5. Problems with GLCM

Even numbered pages not converted in the evaluation version
To purchase easyPDFgo to our website at
http://www.bcltechnologies.com