Embed Size (px)
Citation preview

1
Sustainable Transport and Carbon Emissions in Mexico and China: Accomplishments and
Potential
Lee Schipper, Ph.D. EMBARQ
October 2006

2
EMBARQ
• A catalyst for socially, financially, and environmentally sound solutions to the problems of urban mobility

3
EMBARQ• Established as a unique center within World Resources
Institute in 2002, EMBARQ is now the hub of a network of centers for sustainable transport in developing countries.
• Shell Foundation and Caterpillar Foundation are EMBARQ’s Global Strategic Partners, supporting EMBARQ projects worldwide
• Additional EMBARQ supporters include– Hewlett Foundation– Netherlands Ministry of Foreign Affairs– BP– US AID– Asian Development Bank– Energy Foundation– Blue Moon Fund– US Environmental Protection Agency
4
Sustainable Transport: Mobility, Security, and Environment
• Economic Sustainability– Affordable to users – Attractive as business– Each mode or fuel bears full social costs
• Social Sustainability – Promotes access for all, not just a few– Builds healthy and solid communities
• Environmental Sustainability– Minimizes accidents and damage to human health– Leaves no burdens for future generations – Reduces greenhouse gas emissions – Not Yet
Governance is The Roof Over these PillarsIntegrating Mobility, Security, and Energy

5
Which Suggest Sustainable Transport?

6
World CO2 Emissions From Fuel
0
5000
10000
15000
20000
25000
30000
MT
on
ne
s C
O2
Sea and Aviation Bunkers
OECD Transport ex Mexico
Non OECD Transport w/Mexico
Non-Oecd non Transport
OECD Non Transport
Source: IEA

7
Global CO2 Emissions from Fuel
• Developing World Share Rising– Higher economic growth and urbanization – Shift from renewable to fossil fuels– Rapid industrialization, but more energy efficient
• Transport Share Rising Fastest – Vehicles cheaper and cheaper, particularly 2 wheelers– Urbanization driving more private transport, traveling longer
distances– Globalization means more goods for int’l trade
• Developing Transport Share Rising Most– Transport most urban – roads, infrastructure, cars– Transport share of urban air pollution rising rapidly– Efficiency falling from congestion, poor fuel
Oil Imports Remain a Concern in Third WorldCO2 Not Yet A Reason to Stop These Developments
8
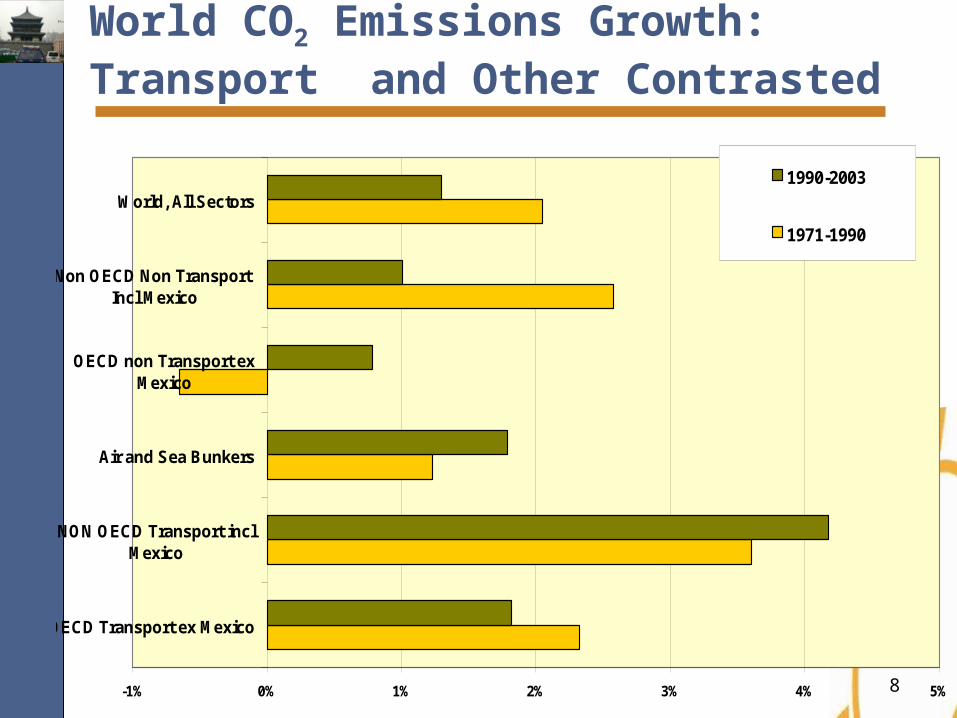
World CO2 Emissions Growth: Transport and Other Contrasted
Source: IEA
-1% 0% 1% 2% 3% 4% 5%
OECD Transport ex Mexico
NON OECD Transport inclMexico
Air and Sea Bunkers
OECD non Transport exMexico
Non OECD Non Transport Incl Mexico
World, All Sectors1990-2003
1971-1990
78

9
The Bush Metric of Success–CO2/GDPChina Has Far Outpaced the US
Source: IEA
-40%
-30%
-20%
-10%
0%
10%
20%
30%
40%
China US Mexico India
Changes in Carbon Dioxide/GDP Ratio 1990-2003
Changes in Total Emissions 1990-2003
Changes in Per Capita Emissions 1990-2003

10
0
10
20
30
40
50
60
70
80
90
100
GDP Cars Oil Oil for Cars Total CO2
US
Pe
r C
ap
ita
Va
lue
= 1
00
US China ROW
World Oil: The U.S. and China In Context(All figures in per capita terms)
U.S. increment in oil use for cars and light trucks 2002-2003 was half of China’s total in 2003

11
GHG and Transport: Contrasts between Developed and Developing World
• Developed World – Steady growth in individual cars since 1920s – US, Canada change after 1970s, car saturation today– EU, Japan approaching car saturation at lower level
• Developing World– L. America – US patterns from 1960s – OPEC countries – rapid rise in 1970s, 1980s– Rest of Asia – two wheelers, buses, now cars?
• The Real Contrast – Time Perspective– Latin America got US patterns, tech, castoffs– Asia moving rapidly from castoffs to leaders?– Asia ahead: Can look back on OECD developments
Why Does Asia. Lat. America Want to Look like OECD?

12
CO2 Emissions from Road Transport
0.01
0.10
1.00
10.00
$0.1 $1.0 $10.0 $100.0
GDP/Capita, $1000 USD (2000) PPP
To
nn
es C
O2/C
ap
ita
US 60-03 UK 60-03
China 71-03 India 71-03
Japan 60-03 Mexico 71-03
Brazil 71-03 Turkey 60-03
Korea 65-03 Viet Nam 93-03
Source: IEA

13
Emissions from Road Transport
• Two Groups of Countries– “US Like” – High fuel/GDP (US, Mexico, Brazil) – Europe/Japan Like– Uncommitted – China, Viet Nam, Turkey
• Driving Factors – Urbanization– Fuel Prices – clear split (exception – Turkey)– Presence of car industry
• Mitigating Factors– Fuel Economy agreements, standards in OECD, China– Rising oil prices (?) and concerns about energy security– World-Wide agreement on CO2 in transport?
CO2 in Transport May be Restrained by High Oil Prices, Congestion, and

14
Motorization in China and Mexico
Is rapid urbanization in China and other countriesputting cities and cars on a collision course?
Mexican experience says yes.
1
10
100
1000
$1,000 $10,000 $100,000
GDP Capita, 1995 USD (PPP)
Ca
rs a
nd
pe
rso
na
l li
gh
t tr
uc
ks
- S
UV
s/
10
00
pe
op
le
United States 1910-2003
China 1987-2003
Korea 1970 - 2002
Japan 1965 - 2000
w. Germany 1960-1995
Mexico (1986-2000)
Source: EMBARQ

15
GHG and Transport In Developing World
China and Mexico Contrasted• Mexico - Oil Exporter (for how much longer?)
– High car ownership (>100/thousand), poor fuel economy – Fuel prices higher than China, about US level– Low urban shares of walking, cycles, cities stuffed
• China - Oil Importer now– Low car ownership (<12/thousand) – China fuel economy standards, but low fuel prices– Cars concentrated in cities with high population densities
• The Real Contrast – time perspective– Mexican cities built around cars, denser Chinese cities around feet– Mexico influenced by US, China developing own path– China moving on urban transport, car fuel economy
China Moving Earlier in its Development than Mexico

16
CASE STUDIES: CHINA AND MEXICO What Happened and What Could Happen • Mexico
– BRT System – Real test – Can a huge city turn the corner?
• China – Headed for Mexico congestion on far fewer
cars– Not too late to change courses?– Apply Mexico changes to Chinese cities?

17
• Policy makers in silos: no effective collaboration
• Political neglect of the bus system
• Little integration of public modes
• Road cutting wide swaths through residential neighborhoods filled up rapidly
• Little cooperation with surrounding jurisdictions
• Little involvement of NGOs or the private sector
Mexico City: Past Political Chaos Hindered Sustainable Transport
There was Little Change until EMBARQ Appeared.

18
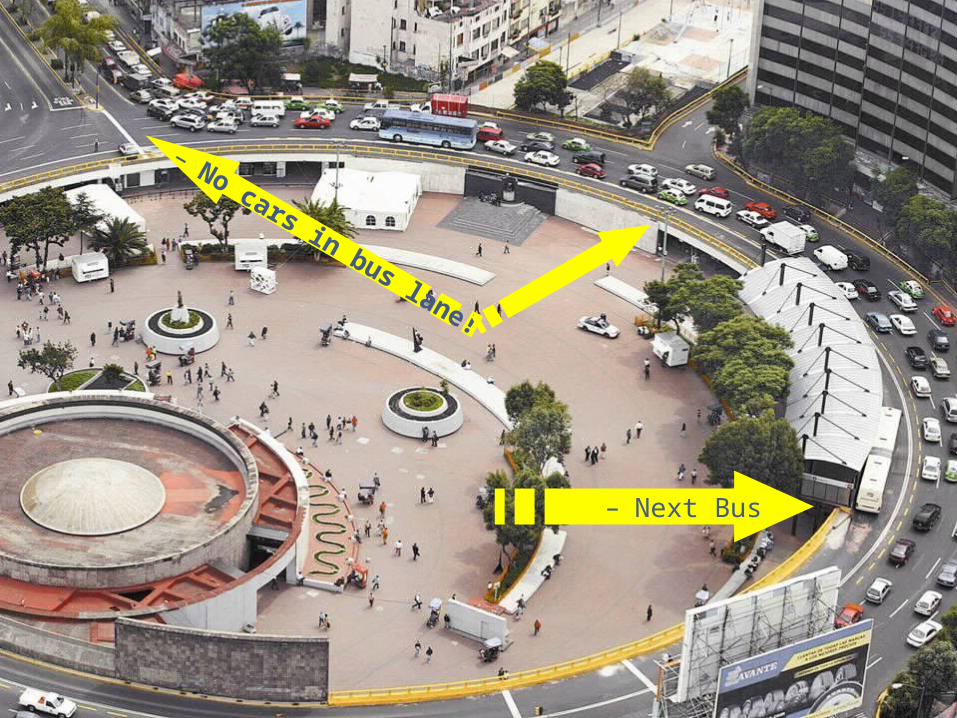
Moving MexicoClean Bus Rapid Transit
•Bus Rapid Transit Moving 250 000 people/day– 10 Min/trip time savings and modest fuel/CO2 reduction– Profitable system based on new business model, not dirty minibuses – Dozen of other Mexican cities want similar systems
•Conventional BRT Bus Technology at Minimal
Cost– Results show big improvements possible – if buses not stuck in traffic– Tested ultra-low sulfur diesel and CNG in Euro 3 or better engines– Tested two hybrids: modest fuel savings and local emissions reductions
•Retrofit Existing Buses with 15 PPM Sulfur
Diesel – 90% drop in particulate matter on newest buses – diesel particle filters– Modest drop in NOx and PM on older buses - diesel oxidation catalysts – Commitment by State Oil Co. to introduce ULSD sooner
Mexico City Proved Turnaround is PossibleFuel and CO2 NOT the Driver
19
– Next Bus
–No cars in bus lane!

20
Cars and Urban Transport in China:Symbol for Much of the World?
• Congestion: Cars and Other Traffic• Buses and people stuck in traffic• Building more roads makes problem worse • Tough policies called for – by whom?
• Air Pollution: Too Many Vehicles• Enough old smokers to ruin air• New fuels, vehicles improving• Emissions from cars could offset
improvements
• Traffic Safety: People First• Walkers, cyclists main victims• Too many kinds of traffic in same place,
unequal road space distribution • More cars and speed will kill more people

21
EMBARQ’s Scenarios for China
• Base Case – China has Korean car/GDP ratio in 2020– 120-160 million cars, 10,000-12,000 km/car
– 8-8.5 L/100 km if no new measures
– Closer to 2 mn bbl/day oil in 2020
• Oil Saving Scenario – 40% as much oil, some CNG– Japanese/Euro level of fuel prices
– 110-130 million cars, but less driving/car
– Take into account fuel economy standards, some hybrids and CNG
• Integrated Transport - Livable cities with good transport– Much lower car ownership and use– avoiding the plague
– Very small cars (incl. slow electrics, hybrids) to avoid space and congestion problems in cities
– Serious BRT, Metro, car-use restraint, land-use planning – avoid Mexico

22
The Sustainability Challenge: Cars and CO2 Emissions in 2020
Sustainable Urban Mobility Saves Cities, Fuel, andAbove all, Greenhouse Gas Emissions
CO2 Emissions
0
20
40
60
80
100
En
erg
y U
se f
or
Car
s, b
y so
urc
e, M
TO
E
0
20
40
60
80
100
120
To
tal C
arb
on
Em
issi
on
s (M
n T
on
nes
)
Electricity, as Primary Energy
CNG
Oil in Hybrids
Oil in Conventional Gasoline Cars

23
Transport Projects and CO2 Counting: Difficult Bean Counting
• Rush to Sell “CO2 Avoided” in Developing Projects– Both fuels/vehicles and traffic changes (like BRT)
– Most projects are small, changes within noise
– Very difficult to measure or model changes
• Various Mechanisms – in Order of Difficulty – Mayors make feel-good pledges
– Companies (including WRI) buy offsets
– Countries buy “additional” options: Clean Dvpt. Mechanism
• Additionality and CDM Projects – the Real Rub– Verification/Certification becomes expensive and time consuming
– Few non-fuel transport projects truly “additional”
– Danger of transport projects aimed at CDM, not good transport

24
Transport Project Outcomes: Not always less carbon, hopefully better transport
Carbon
Quality of transport
Fuel, Emissions, Carbon reduction,Fuel, Emissions, Carbon reduction,Improved transportImproved transport
Carbon increase,Carbon increase, improved transportimproved transport
+
+-
-
Carbon increase, Worse transport
Carbon reduction, Worse transport

25
Measurements Have to Continue Over Time Example: Mexico City With or Without BRT
Time
Em
issi
on
s
Baseline
(the contra -factual “without project” case)
Base-case
(Now)
Impact:
25000-46 000 T/year
Project line
(the factual “with project” case)
Today
Dynamic Base-line & Project-line over timeAfter John Rogers, Trafalgar SA, Mexico

26
GHG Savings at $5/Ton in Mexico City:Hypothetical Insurgentes Corridor Case
$0
$20,000
$40,000
$60,000
$80,000
$100,000
$120,000
$140,000
$160,000
Yearly Savings- CO2
US
$/y
ear
Saved
Indirect effects from reducedcongestion on 50 000 cars/day @10 mins/car
Direct Effects from Full Newbuses

27
Fuel Savings ($340/ton):Hypothetical Insurgentes Corridor Case
$0
$500,000
$1,000,000
$1,500,000
$2,000,000
$2,500,000
$3,000,000
$3,500,000
$4,000,000
$4,500,000
Yearly Savings- CO2 Yearly Savings-Fuel
US
$/y
ea
r S
av
ed
Indirect effects fromreduced congestion on 50000 cars/day @ 10 mins/car
Direct Effects from FullNew buses

28
GHG, Fuel, Time ($1/hour) Savings(Ignores less pollution and accidents)
$0
$10,000,000
$20,000,000
$30,000,000
$40,000,000
$50,000,000
$60,000,000
$70,000,000
$80,000,000
$90,000,000
$100,000,000
Yearly Savings- CO2 Yearly Savings-Fuel Yearly Savings-Time @ 5min/day/person, $1/hr
US
$/ye
ar S
aved
Indirect effects from reduced congestion on 50 000cars/day @ 10 mins/car
Direct Effects from Full New buses

29
Conclusions: Are Mexico and China Decarbonising?
• Mexico – Adjustment is difficult– Metrobus a huge step for reform – will there be more? – Fuel economy standards possible next step– Next steps – restraints on car use (congestion pricing?)
• China – Easier to Choose than Change Later– Fuel economy standards a valuable first step– Real urban transport – not just token BRT -- reform next– Next steps – car restraints, protection for NMT
• Overall– Fuel economy is necessary but not sufficient – Good urban transport is necessary but not sufficient– More demos of success needed in both countries

30
GHG In Developing World Not an Important Policy Driver:
• Little Concrete Action on GHG from Transport– Auto use in Mexico high, in China low but rising rapidly – Wasted fuel, extra air pollution from bad traffic– Less than 20% of urban trips in cars, yet cities stuffed
• Some Motion on Fuel Quality and Fuel Economy – Increased stringency on fuel quality and emissions in both
countries – China fuel economy standards, Mexico contemplating
• Lip Service to the Real Threat – Urban Immobility– More vehicle use, congestion, accidents– Fuel waste and higher greenhouse gas emissions– Higher health and accident risks
First Step: More Sustainable Mobility

31
Overall Lessons: Lower Transport in Developing Countries
• Beyond Carbon -- Aim at Good Transport– Strong collective transport with some limits on private car use – Strong support for existing NMT – Rein in car-based land-use
• Transparent Fuel and Carbon Pricing– Level playing field for transport – Clear price signals to users, operators, manufacturers – End to the subsidies of fuels, vehicles, commuting
• Transparent Governance– Stakeholder involvement– Fuel quality and local emissions, fuel economy standards– Clean rules for transport providers, infrastructure development