Embed Size (px)
Citation preview

1
Sustainable Agricultural Economic benefits of reservoir scale expansion in
Balkh Basin, Afghanistan
Abdelaziz A. Gohar & Frank A. Ward New Mexico State University, USA
South Valley University, Qena, Egypt July 25, 2012
With support from Dr. Saud Amer, US Geological Survey

2
Road Map Background
Balkh irrigation system Balkh agricultural system Historical water and land use
Research problem Objectives Methods (Approach) Data Analysis Results Conclusions Path forward

3
1. Background : Irrigation System Balkh River: important source of irrigation water in northern
Afghanistan. Policy and distribution control by local authority (Mirab) Little cooperation among neighboring mirabs Watershed regions
Upper Middle Lower
80 % of population is rural Irrigated Crops: wheat , tomato , potato ,melon, rice , cotton , alfalfa, pulses

Schematic of Balkh River Canal System, Afghanistan
Balkh
Mushtag
Siagard
Abdulah
Dawlatabad
Chemtal
Faizabad
Murdian
Charbulak
Mingajik
Nahr_Shahi
Aman_Sahib
Khanaqah
Aqcha
G4
G5
G6
G8
G7
G3 G2
G1
G12
G11
G10
G9
Reservoir
Lower basin
Middle Basin
Upper Basin
Use node
gauge
G13
Lower Region
Middle R.
Upper R
5
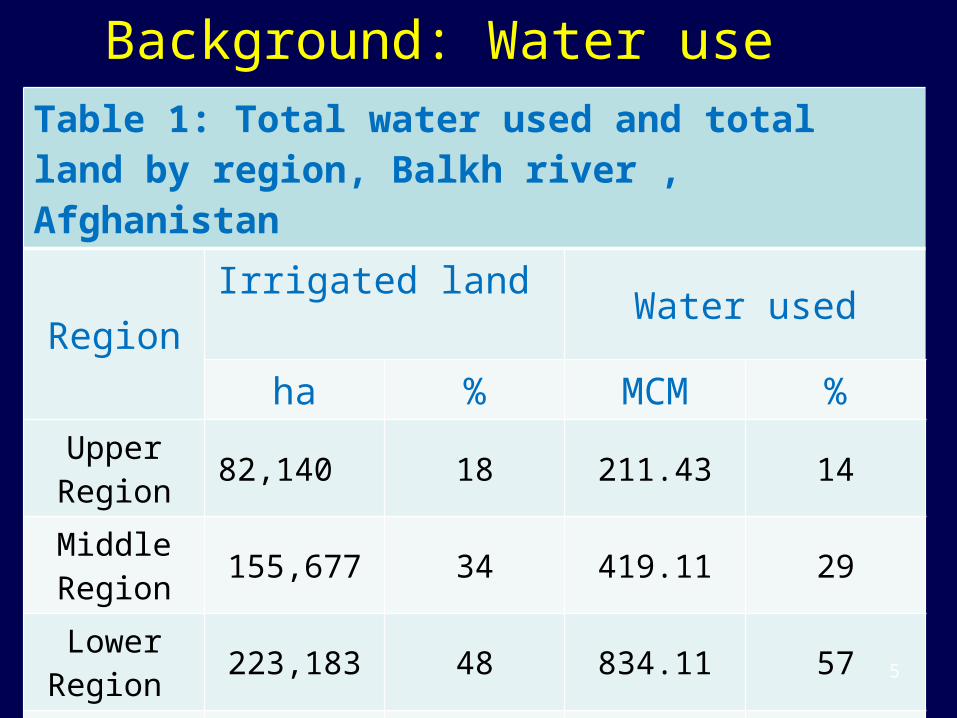
Background: Water use Table 1: Total water used and total land by region, Balkh river , Afghanistan
RegionIrrigated land Water used
ha % MCM %Upper Region 82,140 18 211.43 14
Middle Region 155,677 34 419.11 29
Lower Region 223,183 48 834.11 57
Total 461,000 100 1,464.65 100

6
Background: Land use Table 2: Total assumed irrigated Land by region and crops in Hectares
Crop/Region Upper Middle Lower Total
Wheat 8,000 8,300 5,206 21,506 Tomato 9,352 2,398 12,906 24,656 Potato 2,008 2,350 11,126 15,484 Melon 17,498 47,060 33,924 98,482 Rice 2,008 2,661 34,328 38,997 Cotton 20,112 31,683 38,169 89,964 Alfalfa 4,400 5,100 5,800 15,300 Pulses 18,762 56,125 81,724 156,611 Total 82,140 155,677 223,183 461,000

7
Background: Water use Table 3: Total water in use by region (MCM)
Crops / Region
Upper Region
Middle Region
Lower Region Total
Wheat 15.46 17.15 11.63 44.23Tomato 20.00 5.49 31.93 57.42Potato 4.99 6.24 31.96 43.20Melon 43.47 125.04 97.46 265.97
Rice 15.45 22.08 310.84 348.37Cotton 57.36 96.63 125.88 279.87Alfalfa 14.57 18.06 22.21 54.85Pulses 40.13 128.41 202.19 370.73Total 211.43 419.11 834.11 1,464.65
8
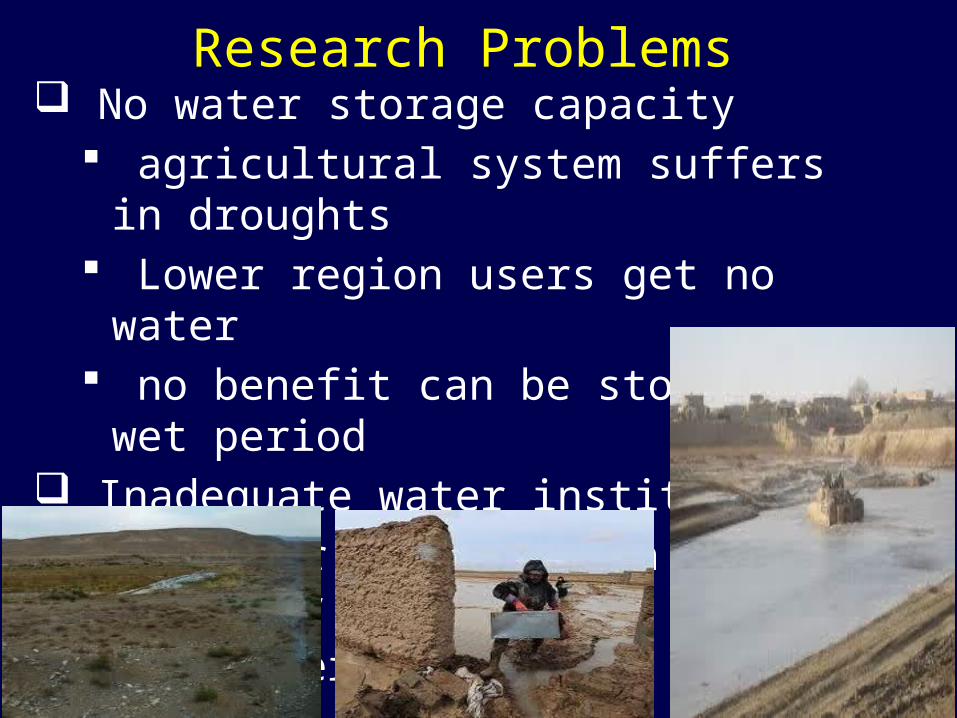
Research Problems No water storage capacity
agricultural system suffers in droughts Lower region users get no water no benefit can be stored in wet period
Inadequate water institutions Low water distribution efficiency High water losses

9
Objectives • Assemble historical data on water supply, water use,
crop yields, land in production, crop mix, crop costs and crop prices that characterize the economics of irrigated agriculture in the Balkh River Basin, Afghanistan.
• Integrate data into a framework that explains profitability, crop production, and crop land and water use so that Afghan ministry personnel, mirabs and farmers can understand what influences profitability and food-security effects of irrigated agriculture.
• Examine how profitability and food security at both the farm and basin levels are affected by additional reservoir storage capacity development in the Basin.

10
Approach

11
OverviewCharacterize the basin’s river-canal network. Use the canal network to predict the spatial distribution
of water use and crop production patterns under stochastic future water supplies
Examine several reservoir capacities for adapting to future water supply variability Base conditions: No reservoir capacity Small reservoir : 50 % of average annual inflow Medium reservoir: 100% of average annual inflow Large reservoir: 200 % of average annual inflow

12
Data Sources
Torrel and Ward (2010). Carver and Lee, 2009. consulting report Farm budget data: USAID report, 2009 Water supply data: USAID, 2003 Food subsistence: FAOSTAT balance sheet

Methods: DetailsIntegrated Basin Framework Approach We developed an integrated basin scale framework
to identify the potential agricultural economic benefits from constructing different reservoir capacities in Balkh River. This framework is :- Dynamic optimization of economic benefits Includes hydrology Includes Land use Economic: farm budget Stochastic water inflow 20 years policy analysis
13

Xvt = Total river flows at any given v-th gauge in t-th period
Xht = Flows at upstream headwater gaugeXvt = flows at upstream river gaugeXdt = diversions at upstream agricultural nodeXrt = Return flow from upstream agricultural nodeXmt = Unmeasured flows upstream gaugeXLt = Reservoir releases at L-th upstream gaugeB’s fixed coefficients
14
Hydrologic Balancevt hv ht vv vt dv dt
h v d
rv rt mv mt Lv Ltr m l
X B X B X B X
B X B X B X

15
Objective Function
NPV = Basin’s discounted agricultural economic benefits
Xbut = Total agricultural economic benefits at
u-th node in t-th period r = Discount rate
tt
u
ut
u r
XBNPV
)1(

16

17
Policy Evaluation : Storage capacities Base situation
No water storage capacities No increase in available land Produce historical land in production for first year
Small reservoir Reservoir holds 50 % of average annual inflow No increase in irrigated land Produce no more 2 times historical land for each
crops and node

18
Policy Evaluation : Storage capacities Medium reservoir
Reservoir holds 100% of average annual inflow No increase in available land No more 2 time of historical irrigated land
large Reservoir Reservoir can hold 200% of annual inflow No increase in irrigated land No more than 2 time of historical irrigated land

19
Results

20
Results : Basin Farm Income
Table 4: Average Annual Net Farm Income by Reservoir Capacity, Million US $
Reservoir Capacity
Net Annual Income
Change in Income
%
Base 139 0 100.00
Small 165 26.39 119.05
Medium 177 12.11 127.79
Large 184 7.02 132.86

21
Results: Basin Farm Income

22
Results: Basin Farm Income

23
Results: Basin Farm Income
Table 5: Total Basin Farm Income by Crop and Storage Capacity (Million US $)
Crops Base Small Medium LargeWheat 20.55 20.55 20.55 20.55Tomato 15.52 19.76 19.76 19.76Potato 0.02 0.02 0.02 0.02Melon 69.26 86.94 91.60 91.60
Rice 17.06 14.04 12.53 12.56Cotton 12.15 11.16 18.73 21.57Alfalfa 0.15 0.15 0.15 0.15Pulses 3.80 12.28 13.66 17.82Total 138.52 164.91 177.02 184.03

24
Results: Irrigated Land Table 6: Average total irrigated land by region and reservoir capacity, Balkh River Basin, Afghanistan
Region/ Capacity
Base Small Medium Large Hectares % % %
Upper 88,387 11 39 49
Middle 132,956 30 36 51
Lower 96,303 27 31 31
Total 317,646 23 36 44

25
Results: Irrigated Land Table 7: Average total irrigated land by crops and reservoir capacity, Balkh river, Afghanistan.
Crops/ Capacity
Base Small Medium LargeHectares % change % change % change
Wheat 41,937 0 0 0Tomato 37,754 27 27 27Potato 774 0 0 0Melon 145,206 26 32 32
Rice 32,582 -18 -26 -26Cotton 42,479 -8 53 76Alfalfa 765 0 0 0Pulses 16,149 224 260 370Total 317,646 23 36 44

26
Results: Irrigated Land

27
Results : Storage volume
28
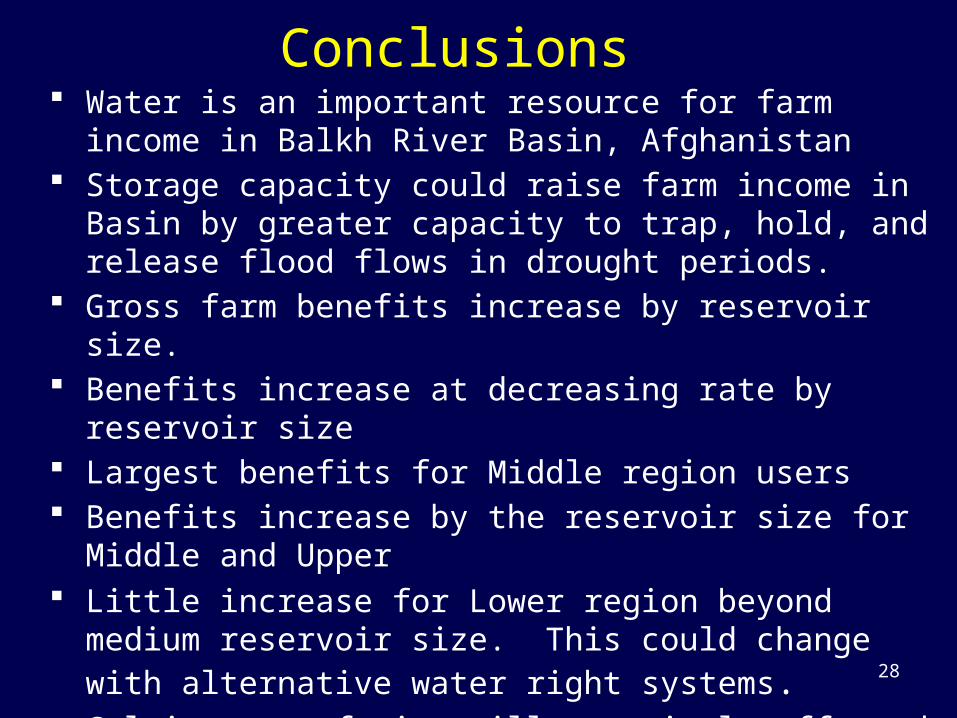
Conclusions Water is an important resource for farm income in Balkh River
Basin, Afghanistan Storage capacity could raise farm income in Basin by greater
capacity to trap, hold, and release flood flows in drought periods. Gross farm benefits increase by reservoir size. Benefits increase at decreasing rate by reservoir size Largest benefits for Middle region users Benefits increase by the reservoir size for Middle and Upper Little increase for Lower region beyond medium reservoir size.
This could change with alternative water right systems. Cultivators of rice will negatively effected by small and medium
capacity Cotton cultivators will negatively effected by small capacity
29
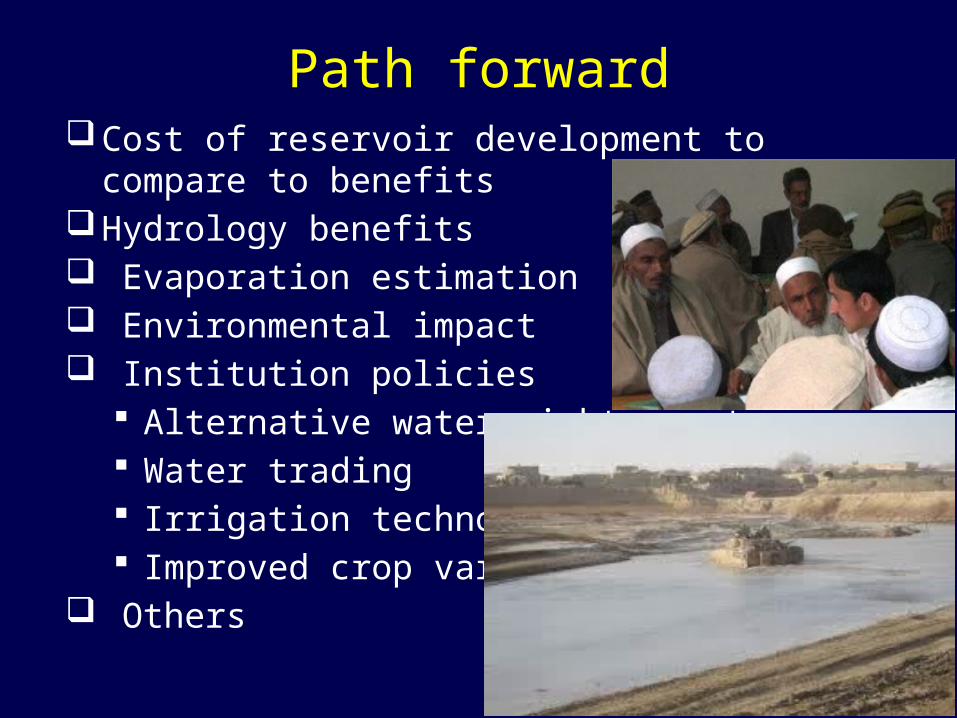
Path forwardCost of reservoir development to compare to benefitsHydrology benefits Evaporation estimation Environmental impact Institution policies
Alternative water rights systems Water trading Irrigation technology Improved crop varieties
Others

30
Thanks Comments Welcome