Embed Size (px)
Citation preview
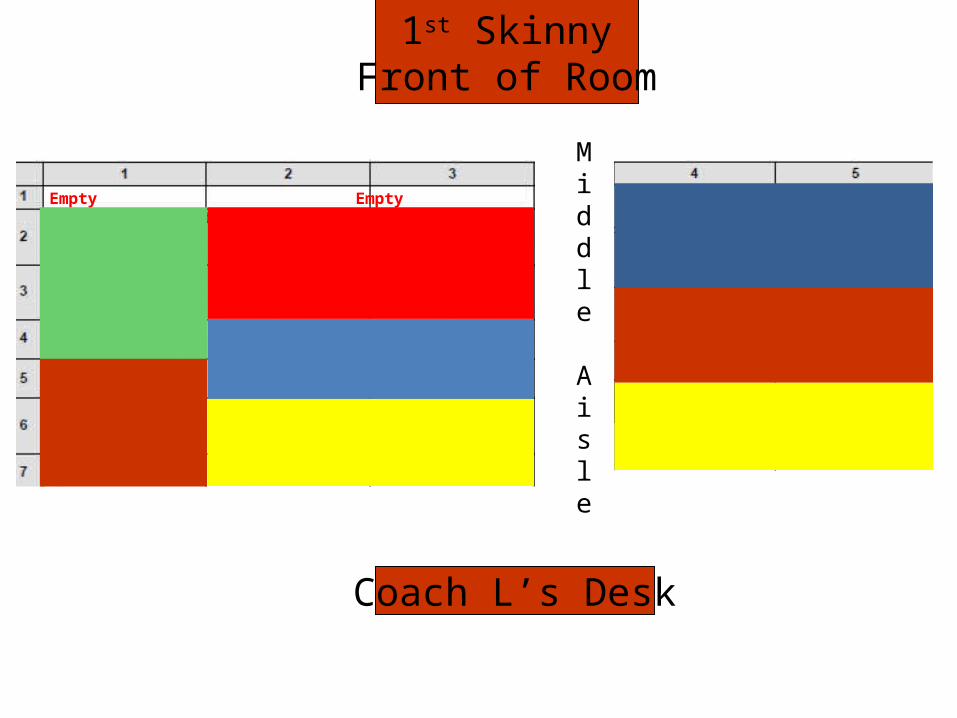
1st SkinnyFront of Room
Coach L’s Desk
Middle Aisle
Empty Empty
Empty Empty Empty Empty
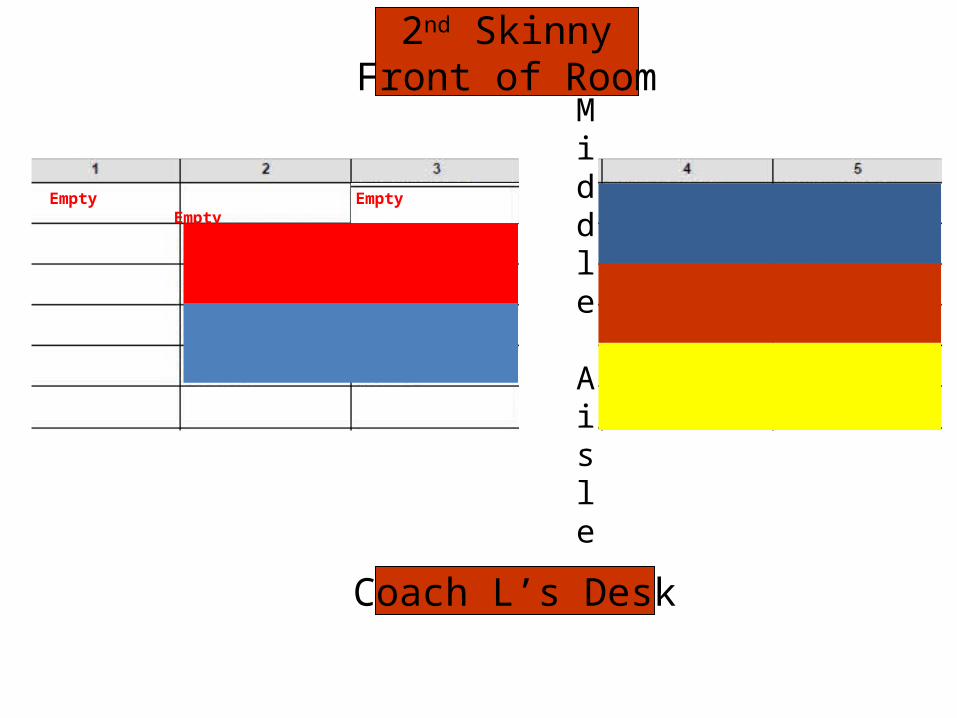
2nd SkinnyFront of Room
Coach L’s Desk
Middle Aisle
Empty EmptyEmpty Empty Empty
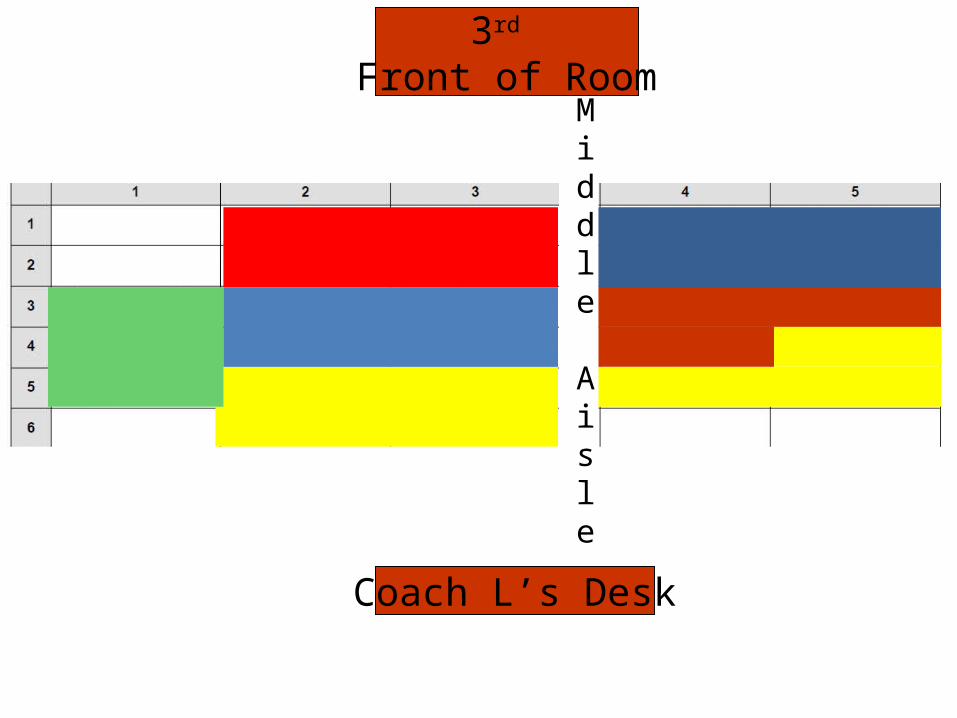
3rd Front of Room
Coach L’s Desk
Middle Aisle

Videos
Back to the Future Michael Myers
I explain to my students using the SRPC = mirror SRAS metaphor. And I teach inflationary expectations with a basic anecdote about salaries. I ask students to envision the kind of life they could live with a $50,000 salary. What kind of house could they buy? What kind of car would they drive? Where would they shop? And (quite importantly, but oddly) what kinds of gifts could they afford to buy at Christmas? [apologies for political incorrectness, but I teach at a Catholic school - so safe bet to not offend] Now, imagine that inflation went wild over the course of that year you were making $50,000. In reality, you hardly notice it as it's happening. But inflation was an astonishing 10% instead of 2%. It's hard to move or switch cars, those prices are relatively fixed. But food prices and others might hurt over the course of the year. And what would happen to how much money you have left for Christmas presents come December?
So, what's the point? Well, when you realize it's getting expensive to live - and you can't even afford the Christmas you thought you'd have. What do you do? You ask for a raise from your boss when your contract is winding down, explaining that it's just not possible in these conditions to live the way you need to live. And if inflation has been pretty constant across industries, you perhaps get that raise. But SRAS is going to shift inward as input costs rise (you making more money) and SRPC is shifting up, as everyone is starting to accept that this 10% inflation is just a new normal.
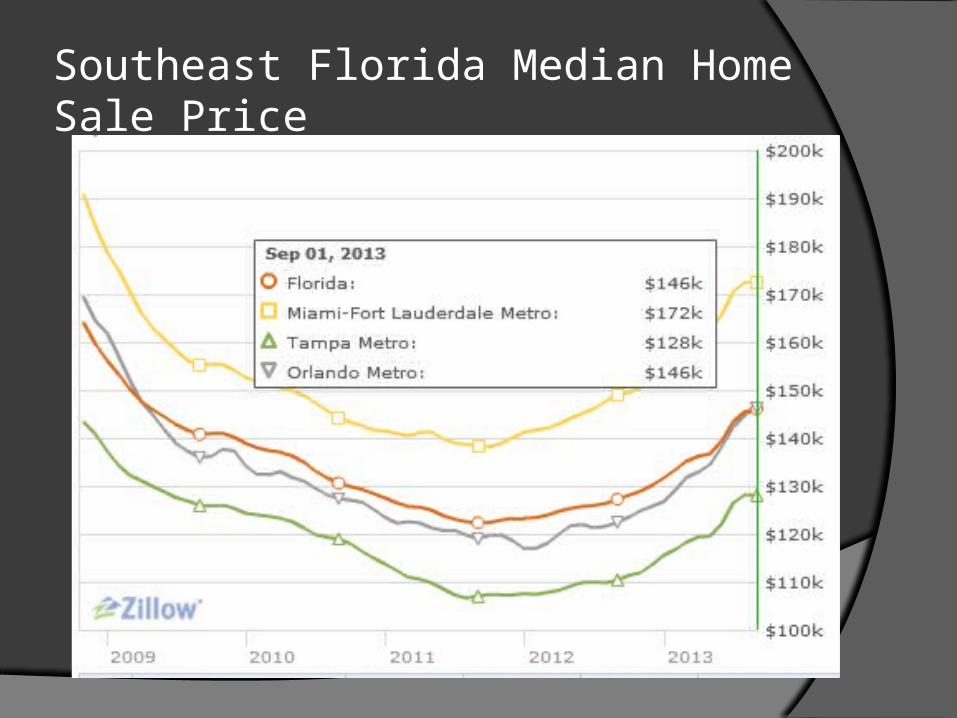
Southeast Florida Median Home Sale Price
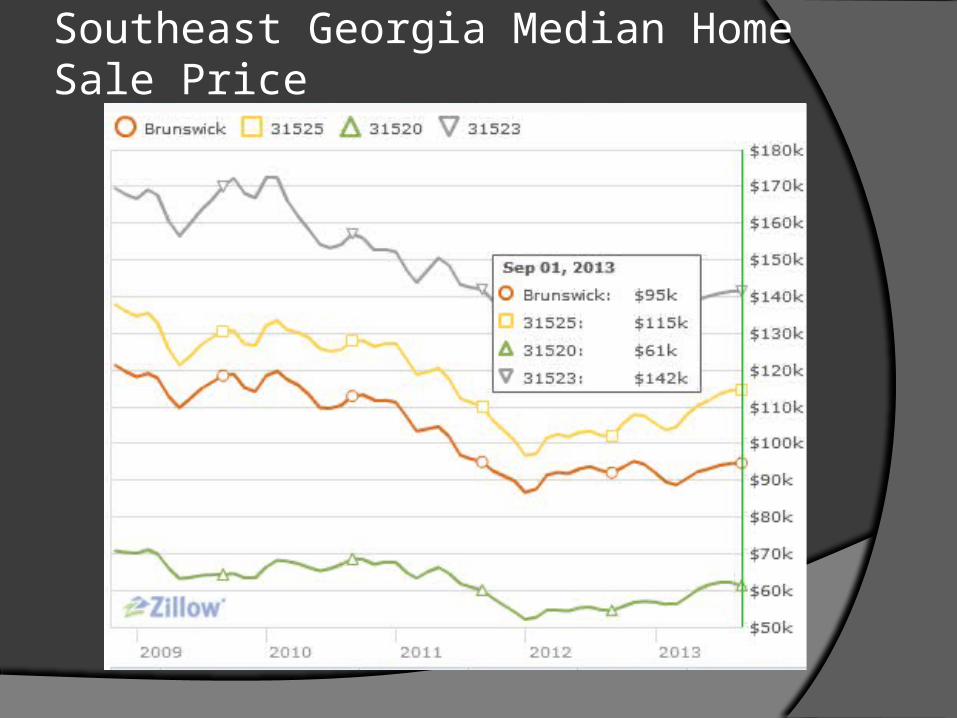
Southeast Georgia Median Home Sale Price
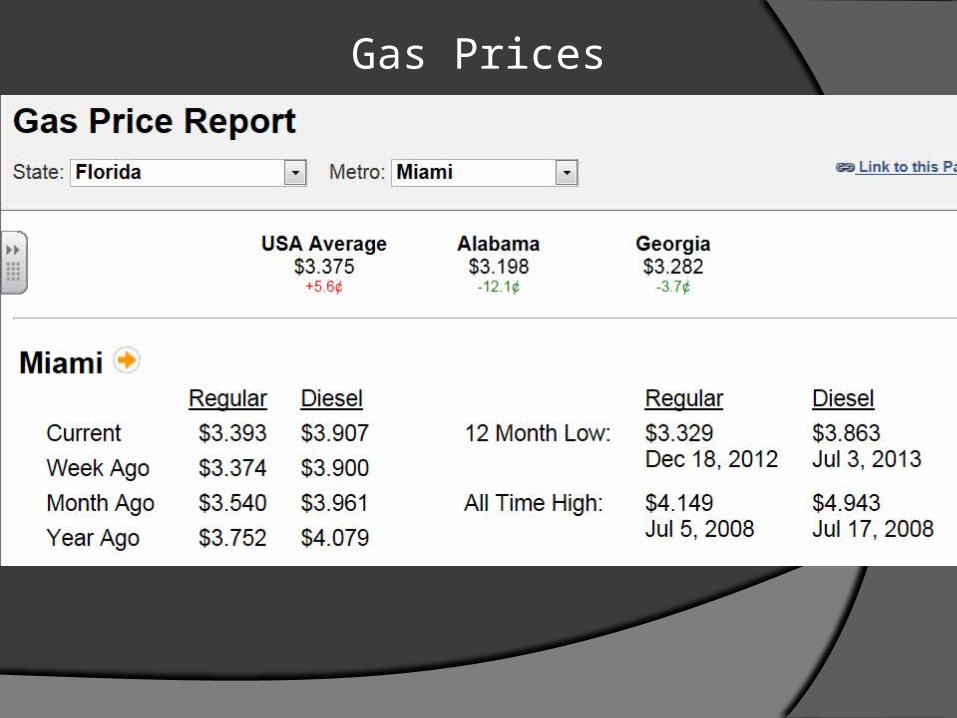
Gas Prices
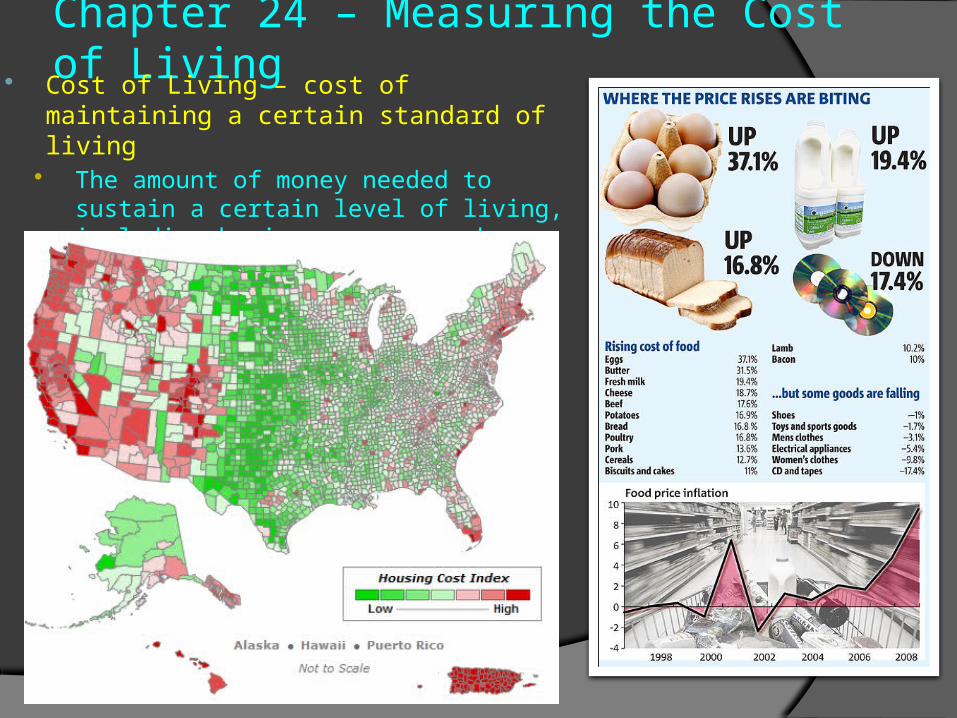
Chapter 24 – Measuring the Cost of Living Cost of Living – cost of maintaining a certain
standard of living The amount of money needed to sustain a
certain level of living, including basic expenses such as housing, food, taxes, and healthcare.
Cost of living calculator
http://cgi.money.cnn.com/tools/costofliving/costofliving.html

Groo the Wanderer Issue #1 March 1985 – $.75
The Amazing Spiderman #700December 2012 – $7.99
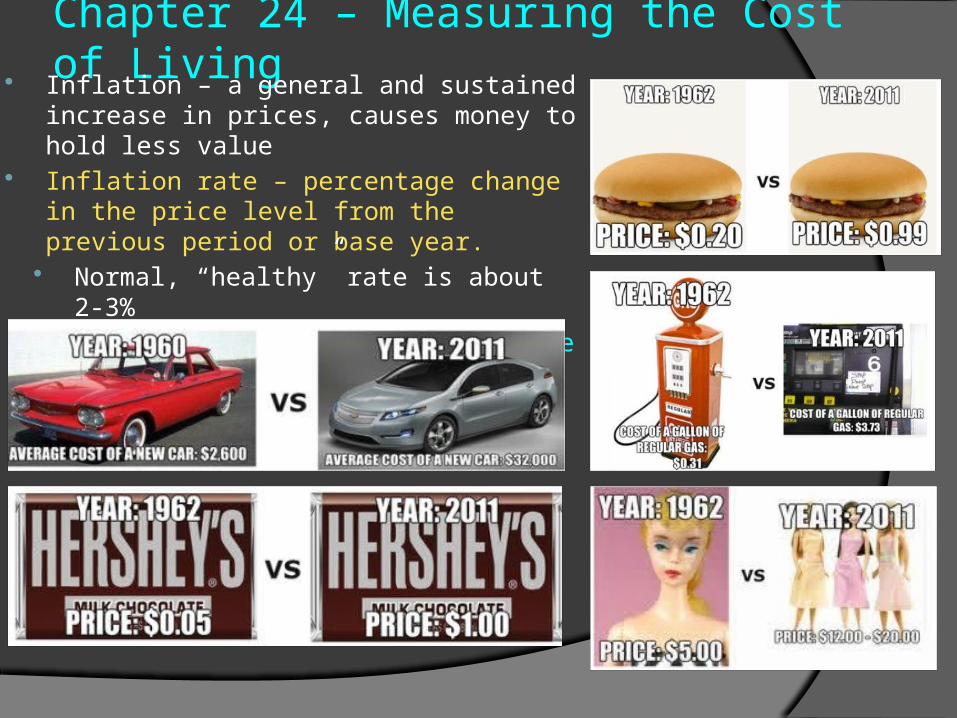
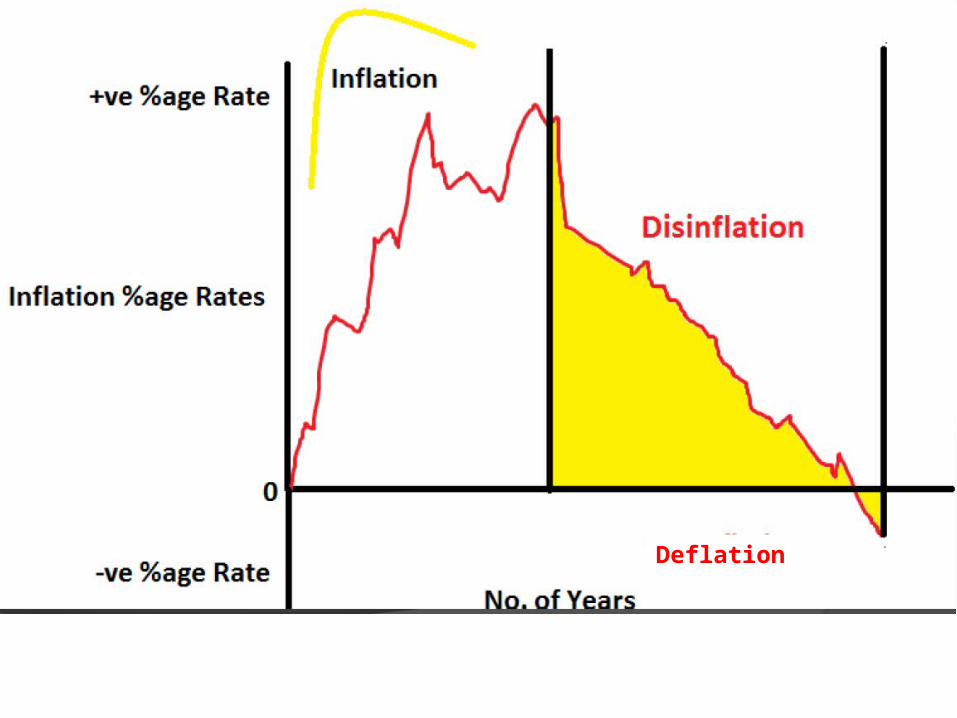
Chapter 24 – Measuring the Cost of Living Inflation – a general and sustained increase in
prices, causes money to hold less value Inflation rate – percentage change in the price
level from the previous period or base year. Normal, “healthy” rate is about 2-3% From 1914 until 2010, the average inflation
rate in United States was 3.38 percent
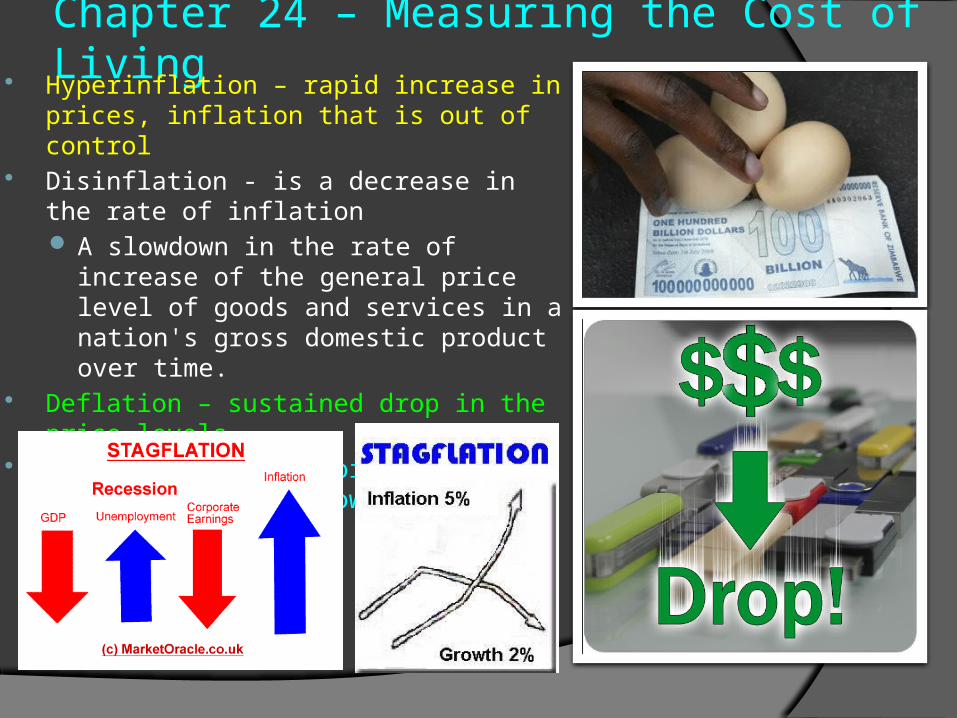
Chapter 24 – Measuring the Cost of Living Hyperinflation – rapid increase in prices,
inflation that is out of control Disinflation - is a decrease in the rate of
inflation A slowdown in the rate of increase of the
general price level of goods and services in a nation's gross domestic product over time.
Deflation – sustained drop in the price levels Stagflation – a combined rise in prices with a
slowdown in the economy
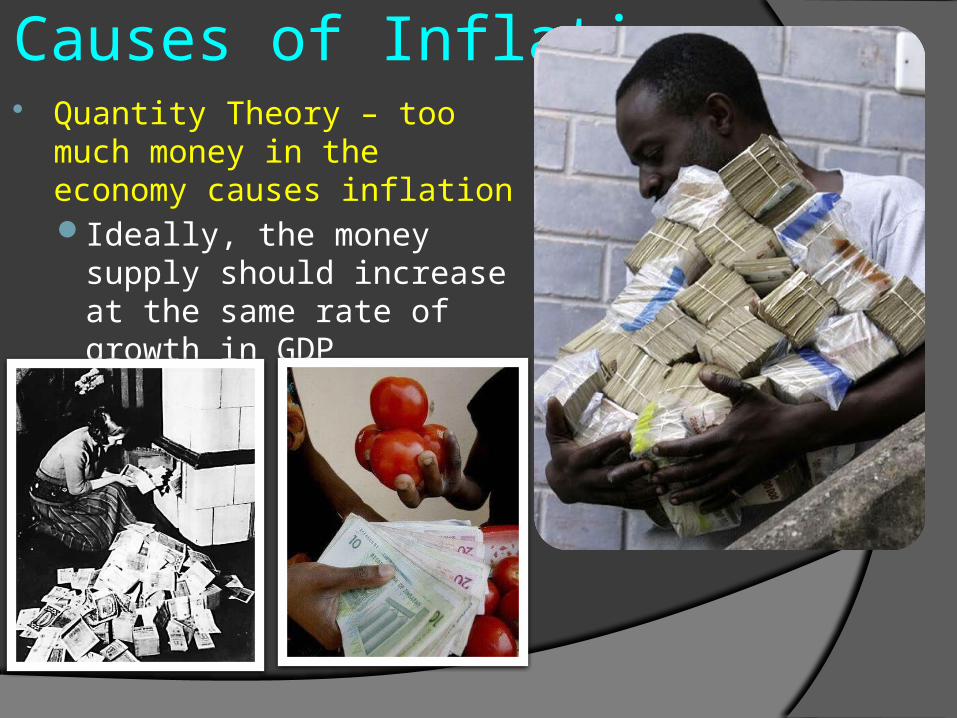
Causes of Inflation Quantity Theory – too much
money in the economy causes inflationIdeally, the money supply
should increase at the same rate of growth in GDP
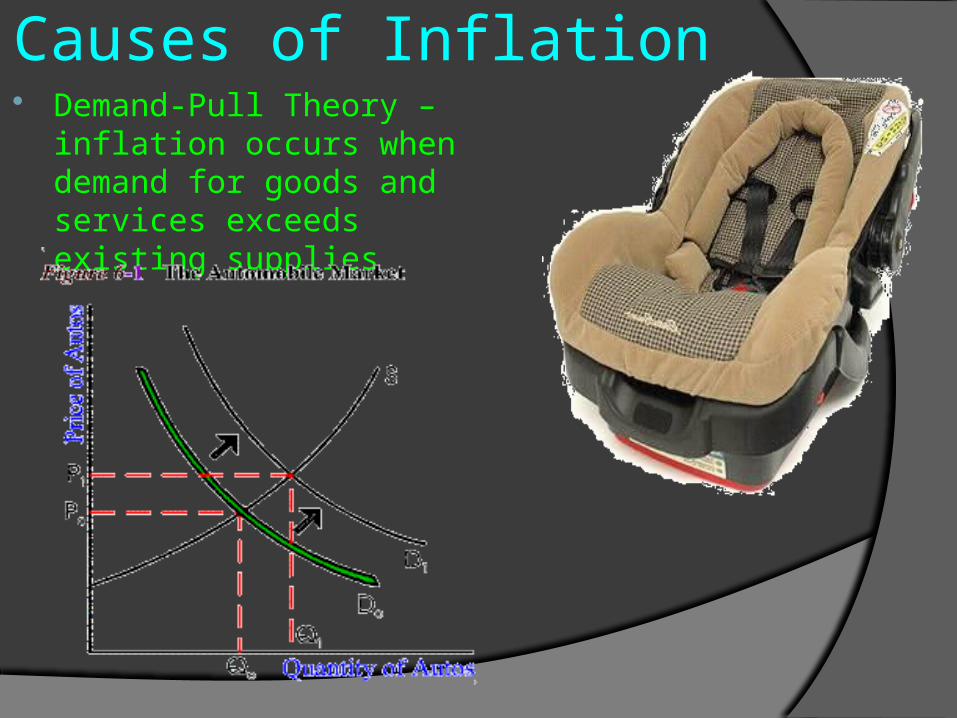
Causes of Inflation Demand-Pull Theory – inflation
occurs when demand for goods and services exceeds existing supplies
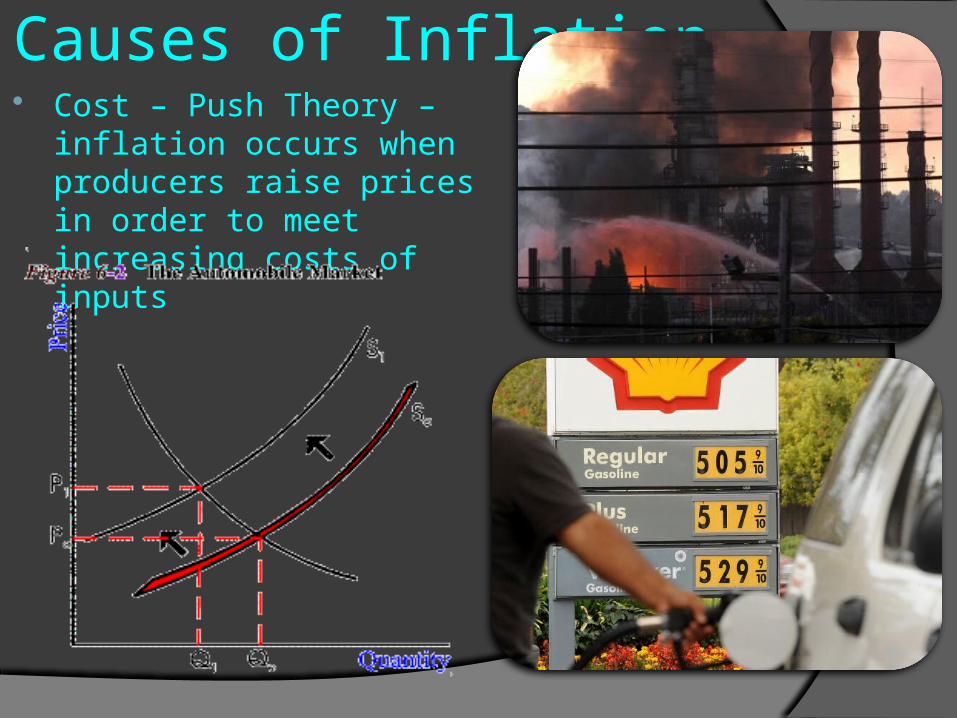
Causes of Inflation Cost – Push Theory – inflation
occurs when producers raise prices in order to meet increasing costs of inputs
Causes of Inflation
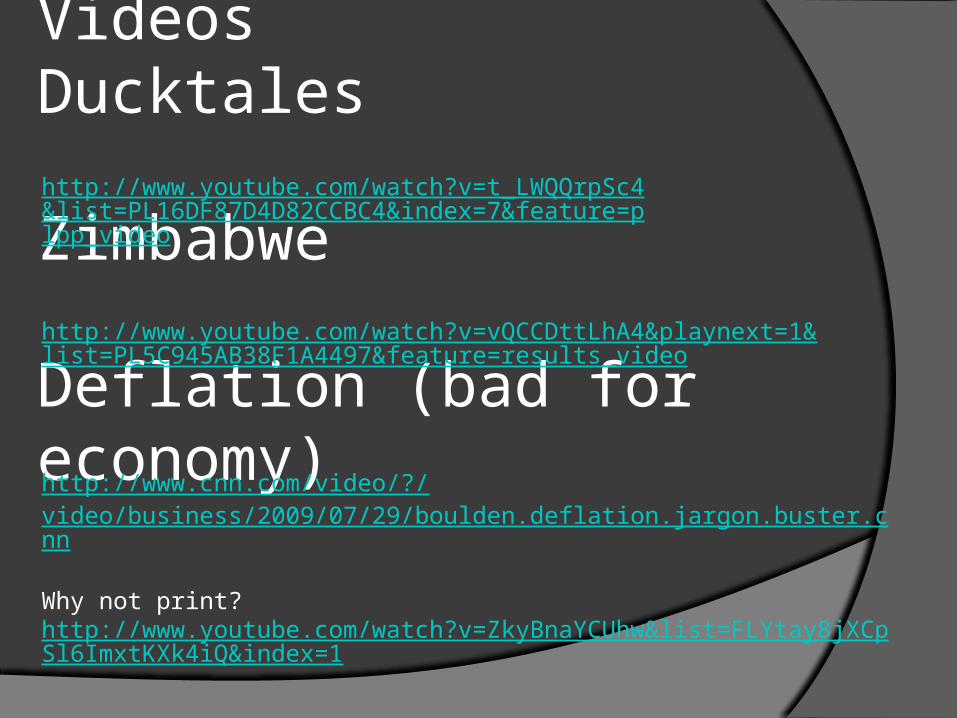
Videos Ducktales
Zimbabwe
Deflation (bad for economy)
http://www.youtube.com/watch?v=vQCCDttLhA4&playnext=1&list=PL5C945AB38F1A4497&feature=results_video
http://www.youtube.com/watch?v=t_LWQQrpSc4&list=PL16DF87D4D82CCBC4&index=7&feature=plpp_video
http://www.cnn.com/video/?/video/business/2009/07/29/boulden.deflation.jargon.buster.cnn
Why not print?http://www.youtube.com/watch?v=ZkyBnaYCUhw&list=FLYtay8jXCpSl6ImxtKXk4iQ&index=1
Deflation
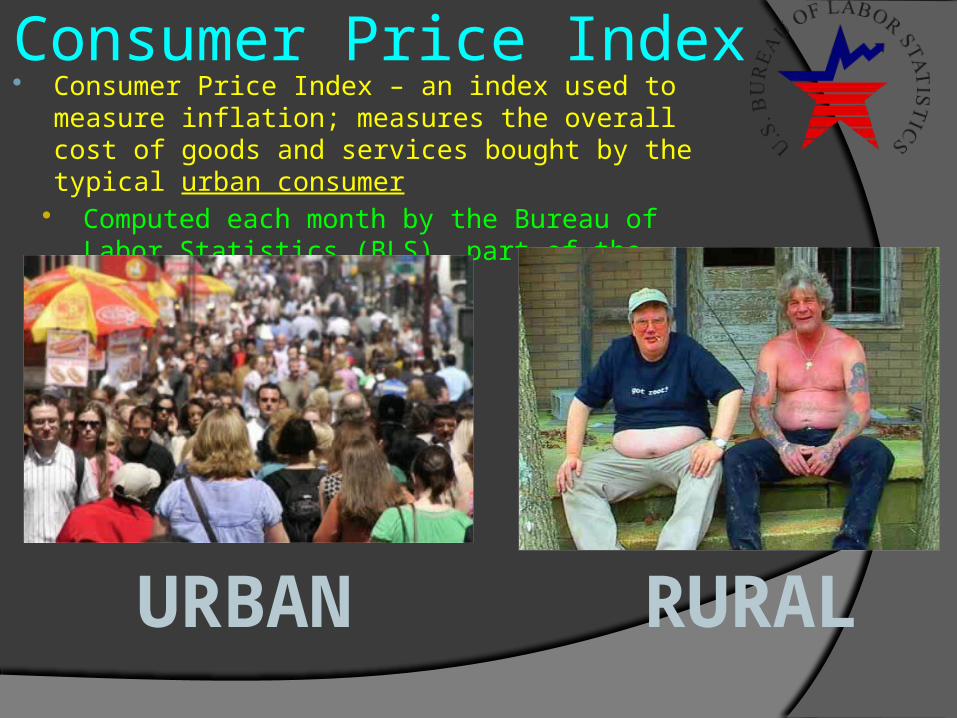
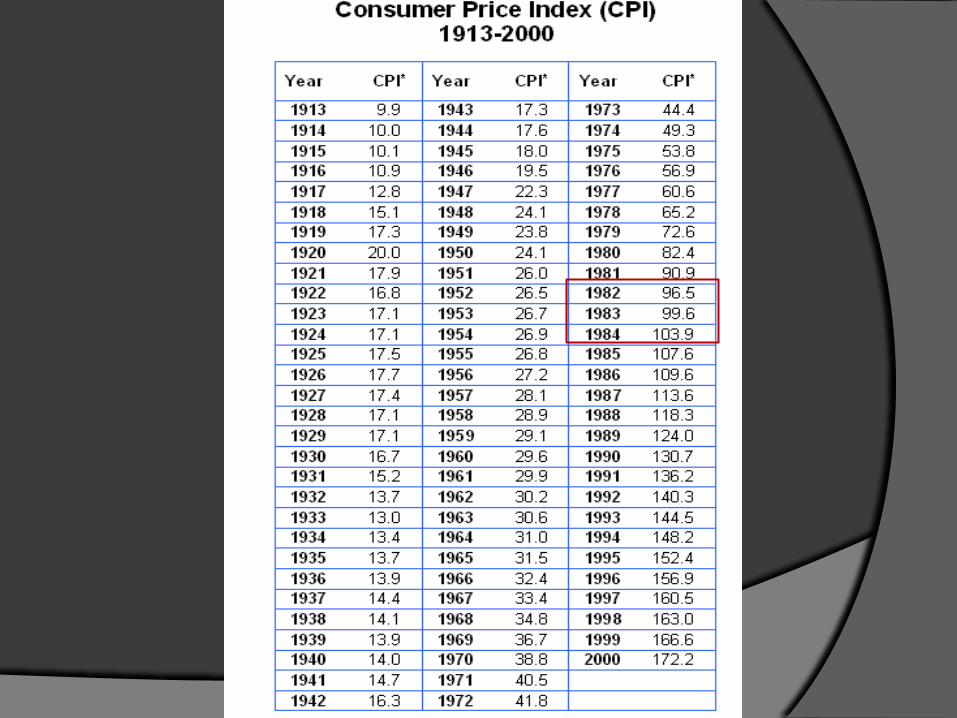
Consumer Price Index Consumer Price Index – an index used to measure
inflation; measures the overall cost of goods and services bought by the typical urban consumer
Computed each month by the Bureau of Labor Statistics (BLS), part of the Department of Labor
URBAN RURAL
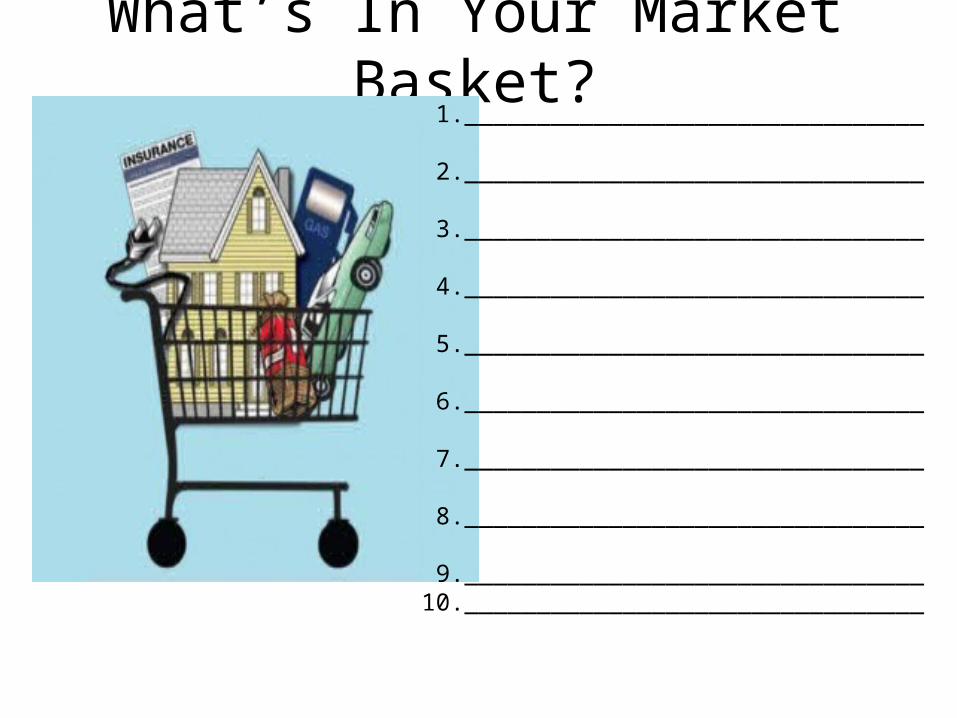
What’s In Your Market Basket?1. ________________________________
2. ________________________________
3. ________________________________
4. ________________________________
5. ________________________________
6. ________________________________
7. ________________________________
8. ________________________________
9. ________________________________10.________________________________

Consumer Price Index Market Basket – metaphorical object to
represent the collection of goods and services purchased by the typical urban consumer on a monthly basis Fix the basket of goods and services to
compare prices Derived of more than 200 sub-categories,
arranged into eight major groups
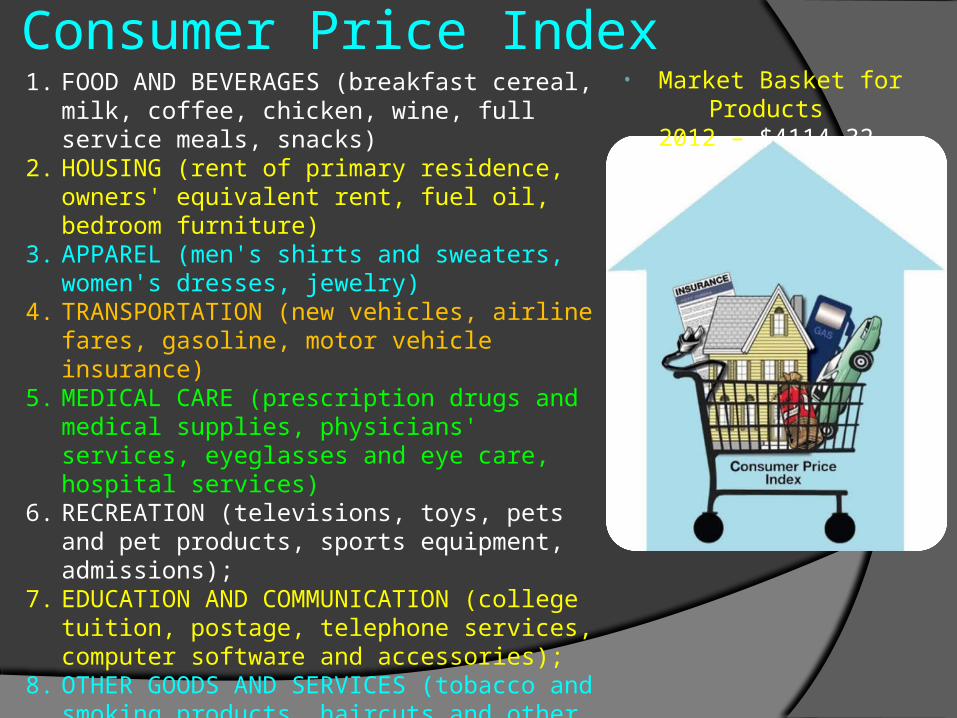
1. FOOD AND BEVERAGES (breakfast cereal, milk, coffee, chicken, wine, full service meals, snacks)
2. HOUSING (rent of primary residence, owners' equivalent rent, fuel oil, bedroom furniture)
3. APPAREL (men's shirts and sweaters, women's dresses, jewelry)
4. TRANSPORTATION (new vehicles, airline fares, gasoline, motor vehicle insurance)
5. MEDICAL CARE (prescription drugs and medical supplies, physicians' services, eyeglasses and eye care, hospital services)
6. RECREATION (televisions, toys, pets and pet products, sports equipment, admissions);
7. EDUCATION AND COMMUNICATION (college tuition, postage, telephone services, computer software and accessories);
8. OTHER GOODS AND SERVICES (tobacco and smoking products, haircuts and other personal services, funeral expenses).
Consumer Price Index• Market Basket for Products
2012 – $4114.32
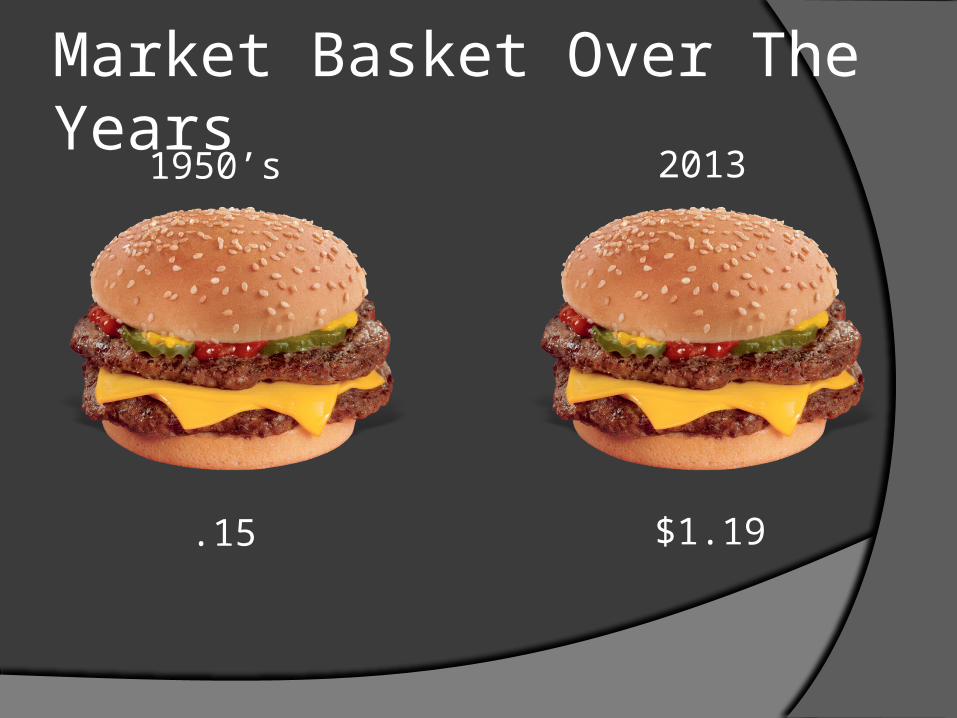
Market Basket Over The Years
1950’s 2013
.15 $1.19
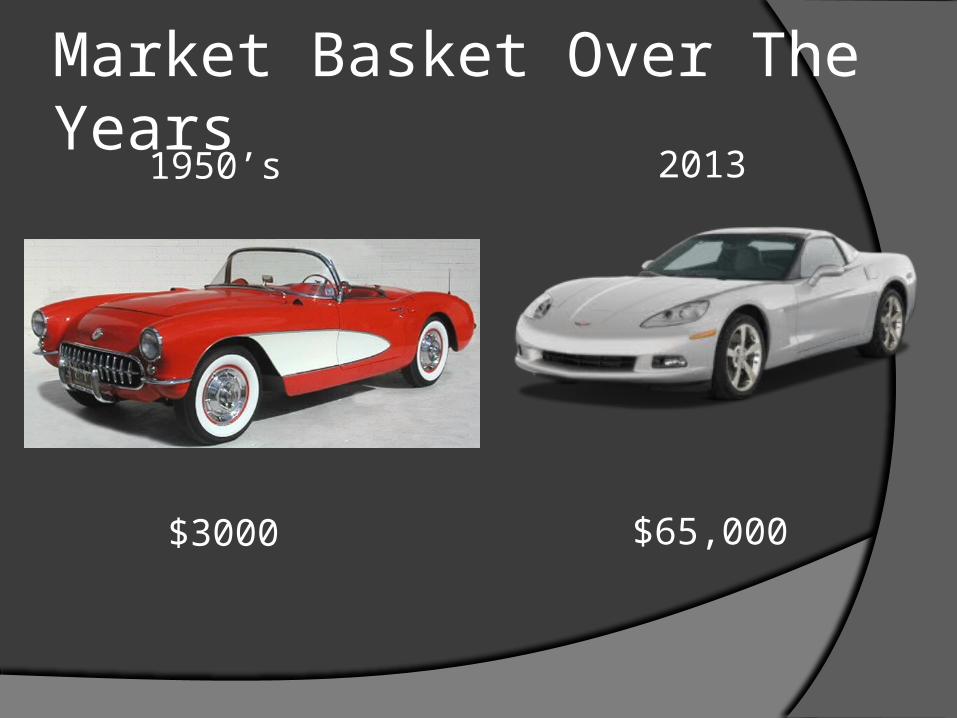
Market Basket Over The Years
1950’s 2013
$3000 $65,000
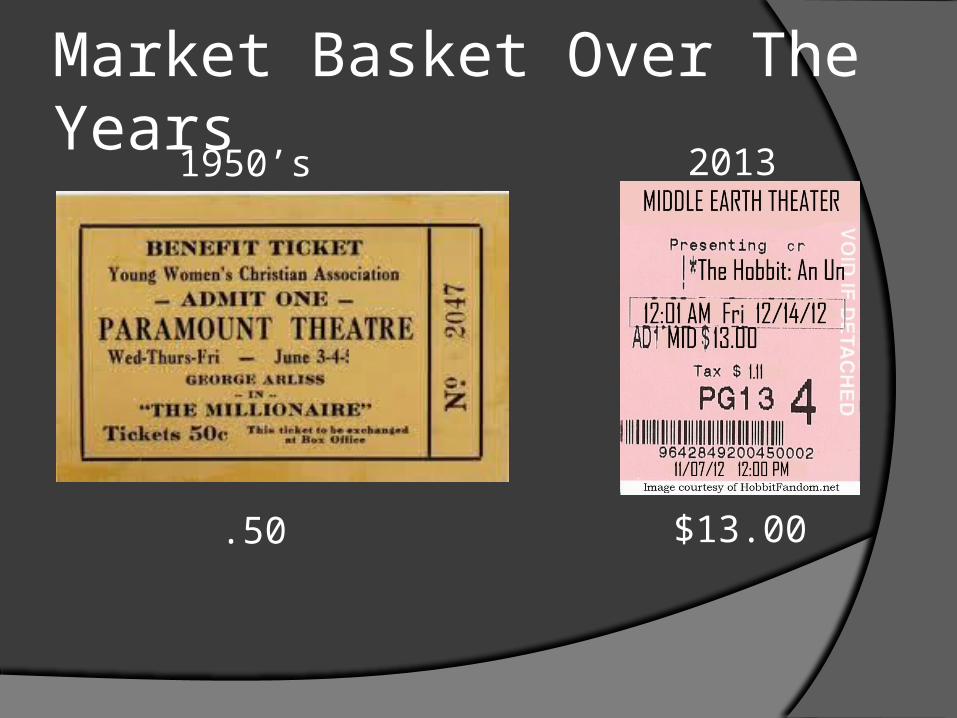
Market Basket Over The Years
1950’s 2013
.50 $13.00
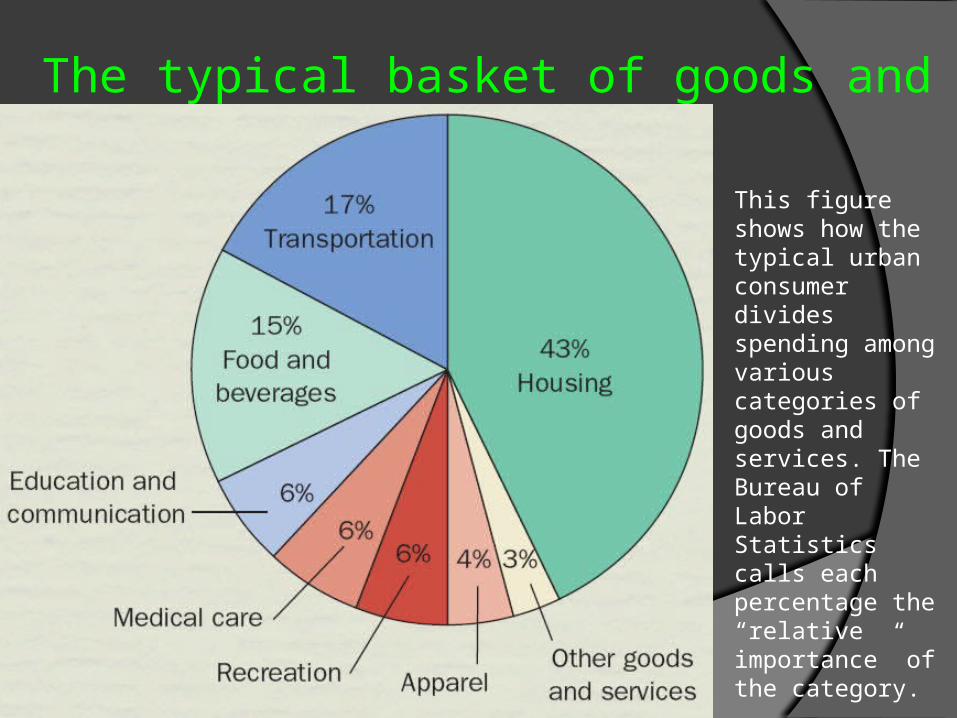
The typical basket of goods and services
This figure shows how the typical urban consumer divides spending among various categories of goods and services. The Bureau of Labor Statistics calls each percentage the “relative importance” of the category.
What is Inflation? CPI Video
30
http://www.youtube.com/watch?v=Si37yjZM-SA&list=PL4D085215905ABBE5&index=21&feature=plpp_video
http://www.youtube.com/watch?v=Vi3Q1ypNw3M&list=PL4D085215905ABBE5&index=15&feature=plpp_video
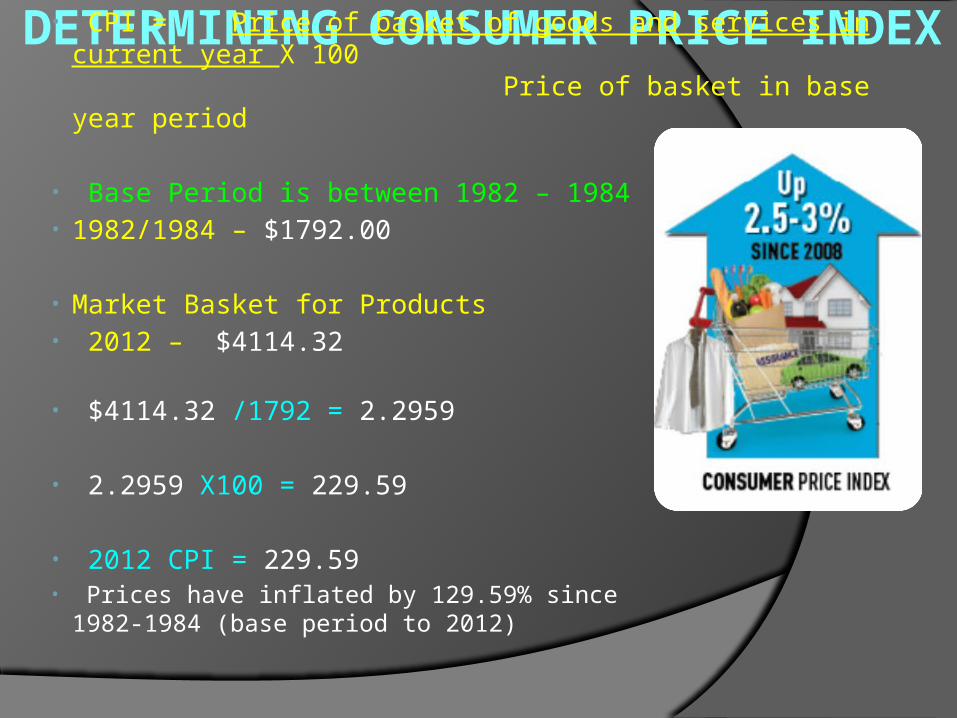
DETERMINING CONSUMER PRICE INDEX• CPI = Price of basket of goods and services in current year X 100
Price of basket in base year period
• Base Period is between 1982 – 1984• 1982/1984 – $1792.00
• Market Basket for Products• 2012 – $4114.32
• $4114.32 /1792 = 2.2959
• 2.2959 X100 = 229.59
• 2012 CPI = 229.59• Prices have inflated by 129.59% since 1982-1984
(base period to 2012)
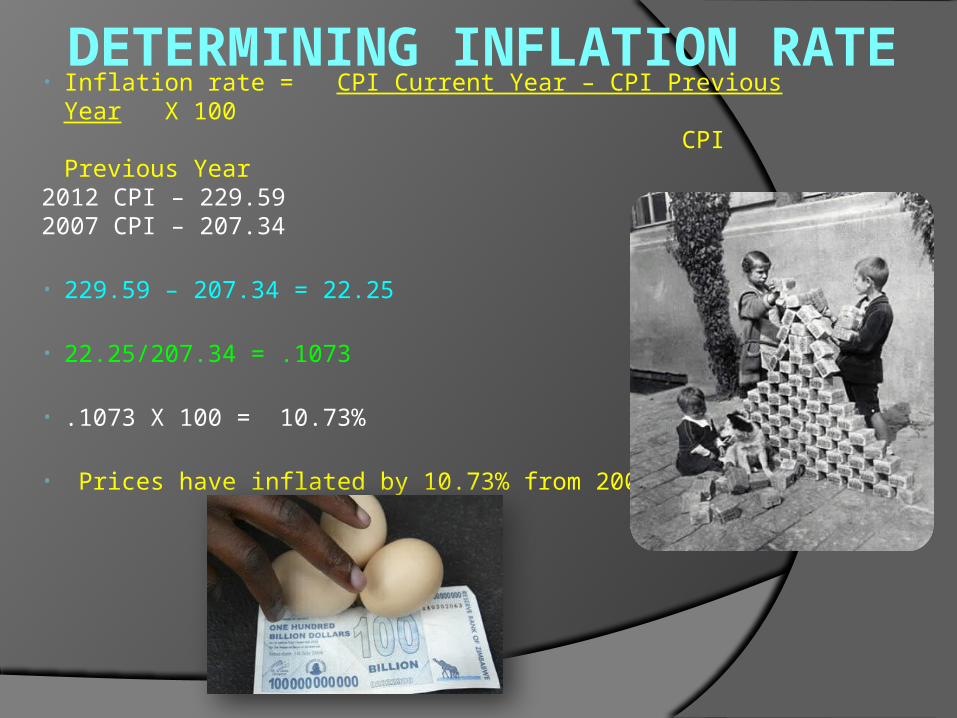
DETERMINING INFLATION RATE
• Inflation rate = CPI Current Year – CPI Previous Year X 100 CPI Previous Year
2012 CPI – 229.592007 CPI – 207.34
• 229.59 – 207.34 = 22.25
• 22.25/207.34 = .1073
• .1073 X 100 = 10.73%
• Prices have inflated by 10.73% from 2007 to 2012
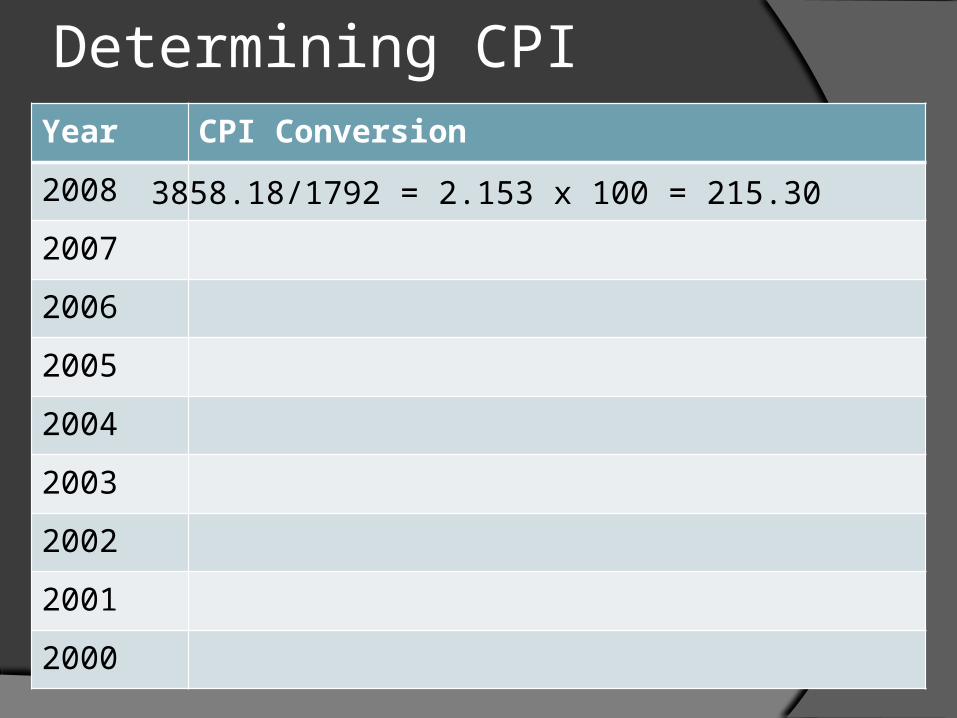
Determining CPIYear CPI Conversion
2008
2007
2006
2005
2004
2003
2002
2001
2000
3858.18/1792 = 2.153 x 100 = 215.30
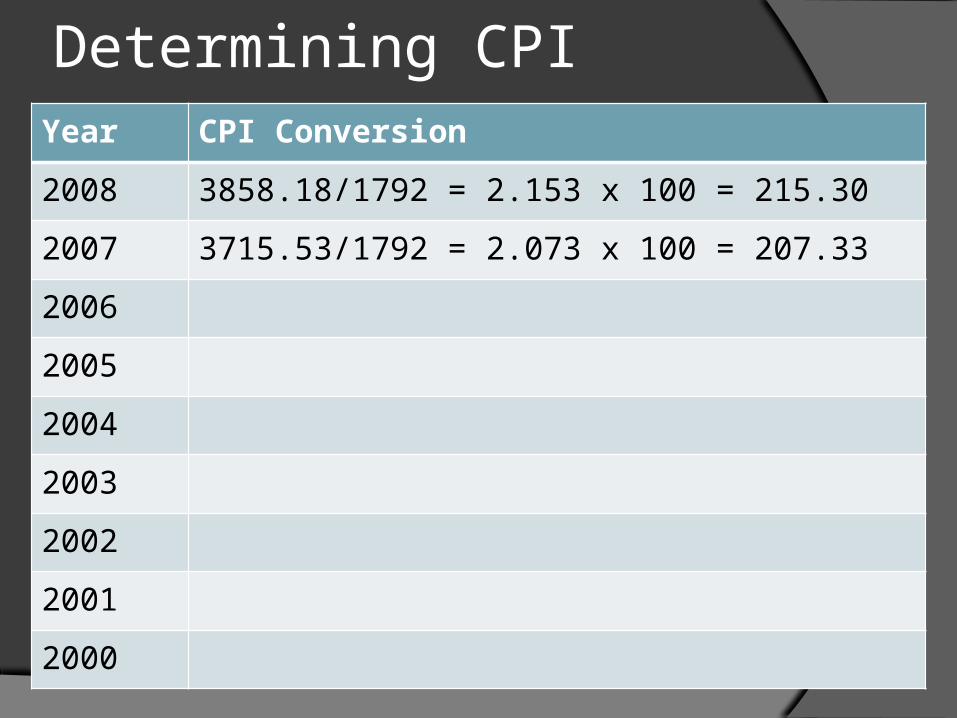
Determining CPIYear CPI Conversion
2008 3858.18/1792 = 2.153 x 100 = 215.30
2007 3715.53/1792 = 2.073 x 100 = 207.33
2006
2005
2004
2003
2002
2001
2000
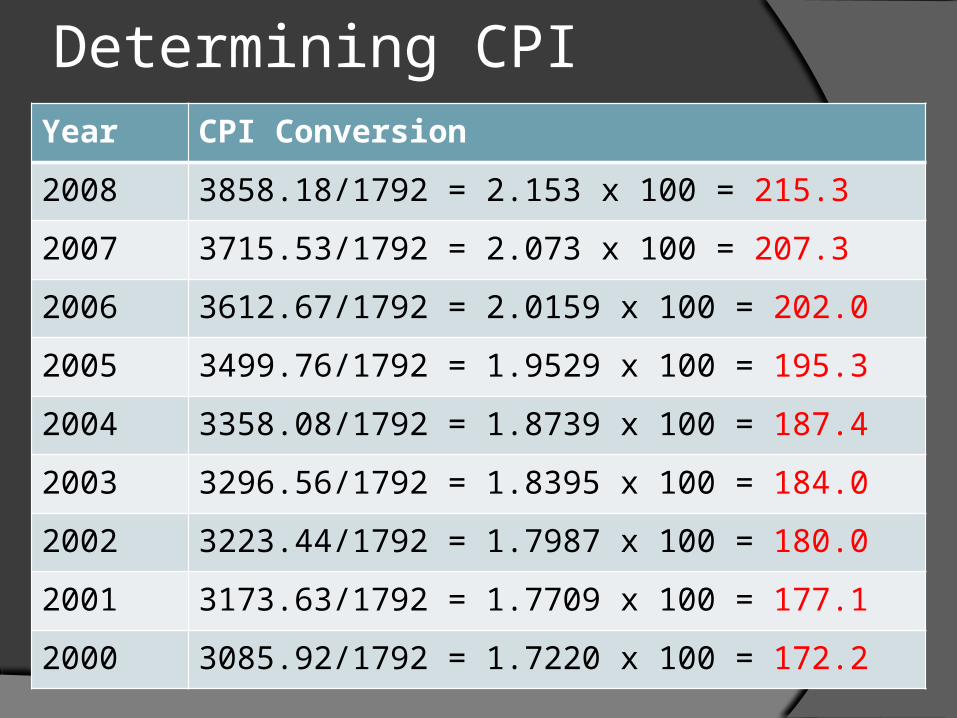
Determining CPIYear CPI Conversion
2008 3858.18/1792 = 2.153 x 100 = 215.3
2007 3715.53/1792 = 2.073 x 100 = 207.3
2006 3612.67/1792 = 2.0159 x 100 = 202.0
2005 3499.76/1792 = 1.9529 x 100 = 195.3
2004 3358.08/1792 = 1.8739 x 100 = 187.4
2003 3296.56/1792 = 1.8395 x 100 = 184.0
2002 3223.44/1792 = 1.7987 x 100 = 180.0
2001 3173.63/1792 = 1.7709 x 100 = 177.1
2000 3085.92/1792 = 1.7220 x 100 = 172.2

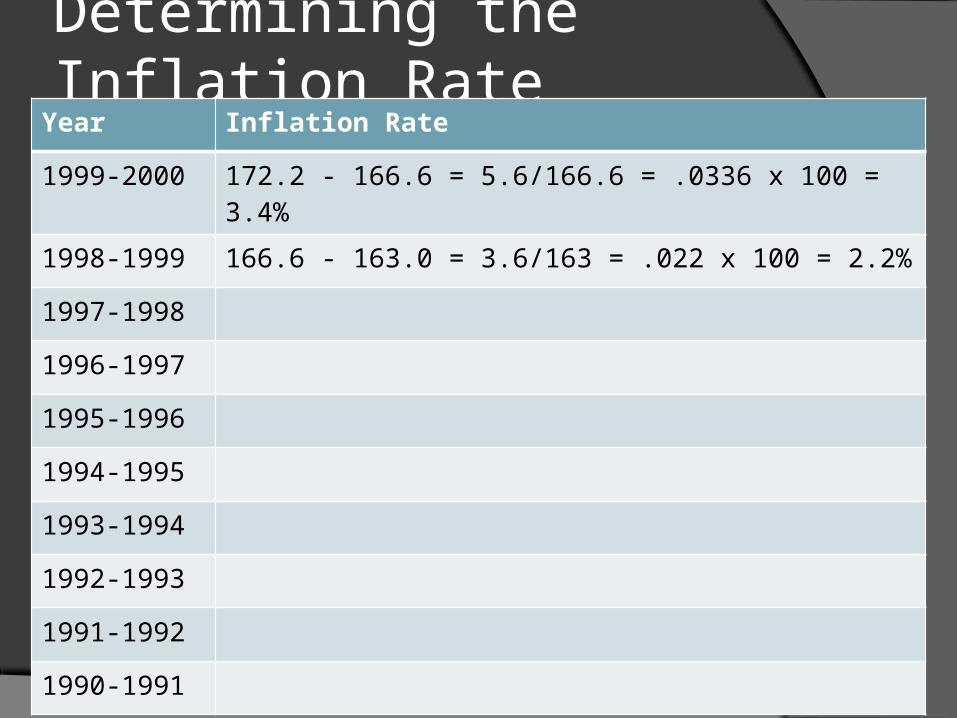
Determining the Inflation Rate
Year Inflation Rate
1999-2000 172.2 - 166.6 = 5.6/166.6 = .0336 x 100 = 3.4%
1998-1999
1997-1998
1996-1997
1995-1996
1994-1995
1993-1994
1992-1993
1991-1992
1990-1991
Determining the Inflation Rate
Year Inflation Rate
1999-2000 172.2 - 166.6 = 5.6/166.6 = .0336 x 100 = 3.4%
1998-1999 166.6 - 163.0 = 3.6/163 = .022 x 100 = 2.2%
1997-1998
1996-1997
1995-1996
1994-1995
1993-1994
1992-1993
1991-1992
1990-1991

Determining the Inflation Rate
Year Inflation Rate
1999-2000 172.2 - 166.6 = 5.6/166.6 = .0336 x 100 = 3.4%
1998-1999 166.6 - 163.0 = 3.6/163 = .022 x 100 = 2.2%
1997-1998 163.0 – 160.5 = 2.5/160.5 = .0015 x 100 = 1.6%
1996-1997
1995-1996
1994-1995
1993-1994
1992-1993
1991-1992
1990-1991
Determining the Inflation Rate
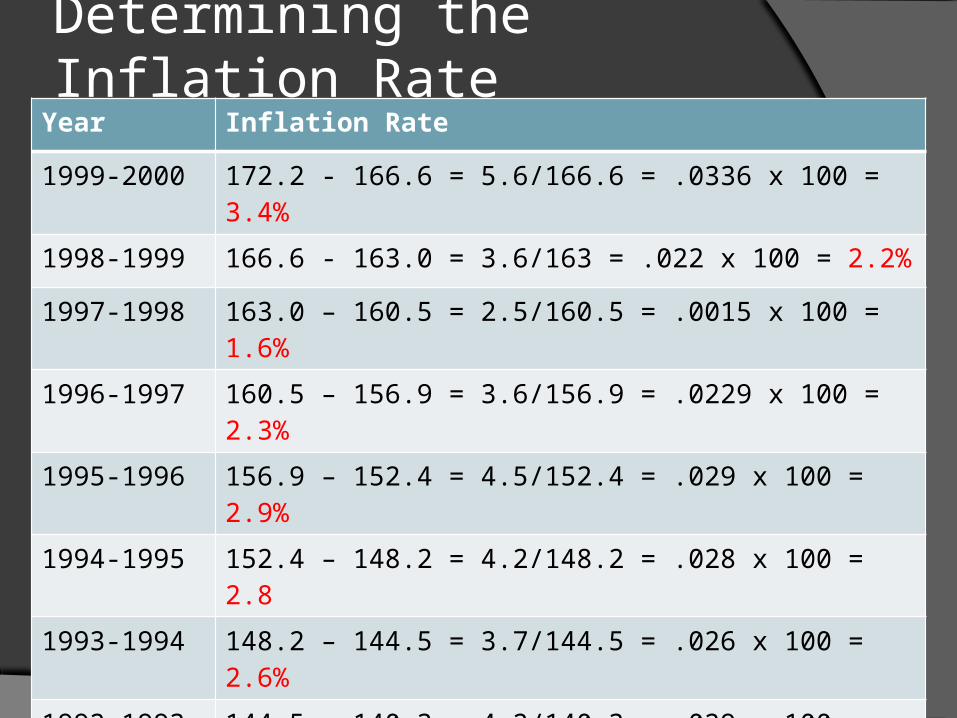
Year Inflation Rate
1999-2000 172.2 - 166.6 = 5.6/166.6 = .0336 x 100 = 3.4%
1998-1999 166.6 - 163.0 = 3.6/163 = .022 x 100 = 2.2%
1997-1998 163.0 – 160.5 = 2.5/160.5 = .0015 x 100 = 1.6%
1996-1997 160.5 – 156.9 = 3.6/156.9 = .0229 x 100 = 2.3%
1995-1996 156.9 – 152.4 = 4.5/152.4 = .029 x 100 = 2.9%
1994-1995 152.4 – 148.2 = 4.2/148.2 = .028 x 100 = 2.8
1993-1994 148.2 – 144.5 = 3.7/144.5 = .026 x 100 = 2.6%
1992-1993 144.5 – 140.3 = 4.2/140.3 = .029 x 100 = 2.9%
1991-1992 140.3 – 136.2 = 4.1/136.2 = .03 x 100 = 3.0%
1990-1991 136.2 – 130.7 = 5.5/130.7 = .04 x 100 = 4.2%
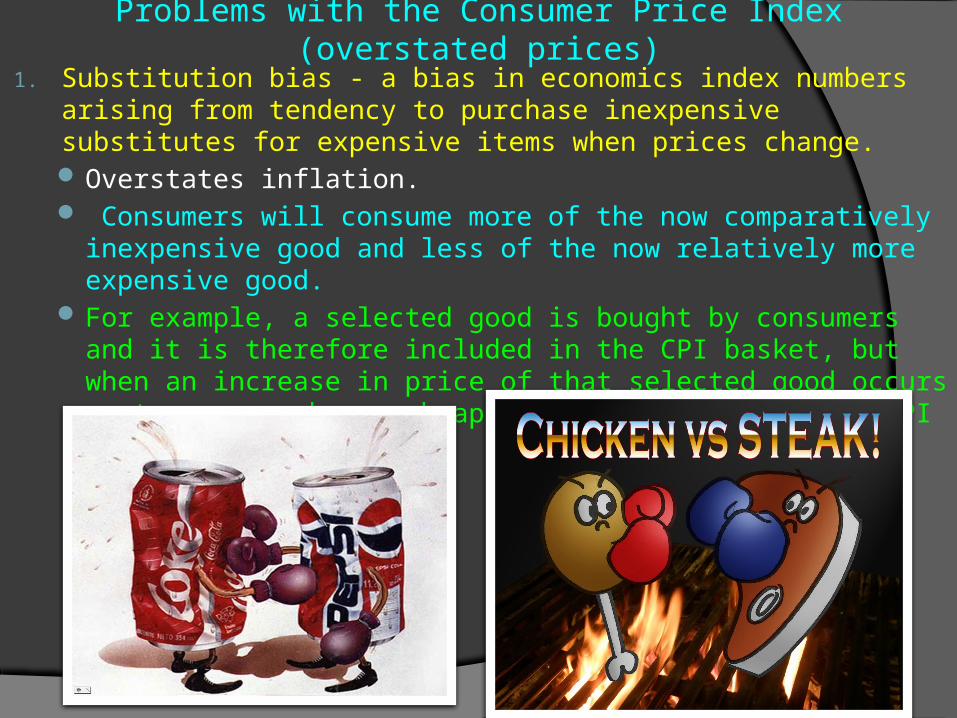
Problems with the Consumer Price Index (overstated prices)
1. Substitution bias - a bias in economics index numbers arising from tendency to purchase inexpensive substitutes for expensive items when prices change. Overstates inflation. Consumers will consume more of the now comparatively inexpensive good and
less of the now relatively more expensive good. For example, a selected good is bought by consumers and it is therefore
included in the CPI basket, but when an increase in price of that selected good occurs customers may buy a cheaper substitute, while the CPI basket does not change.
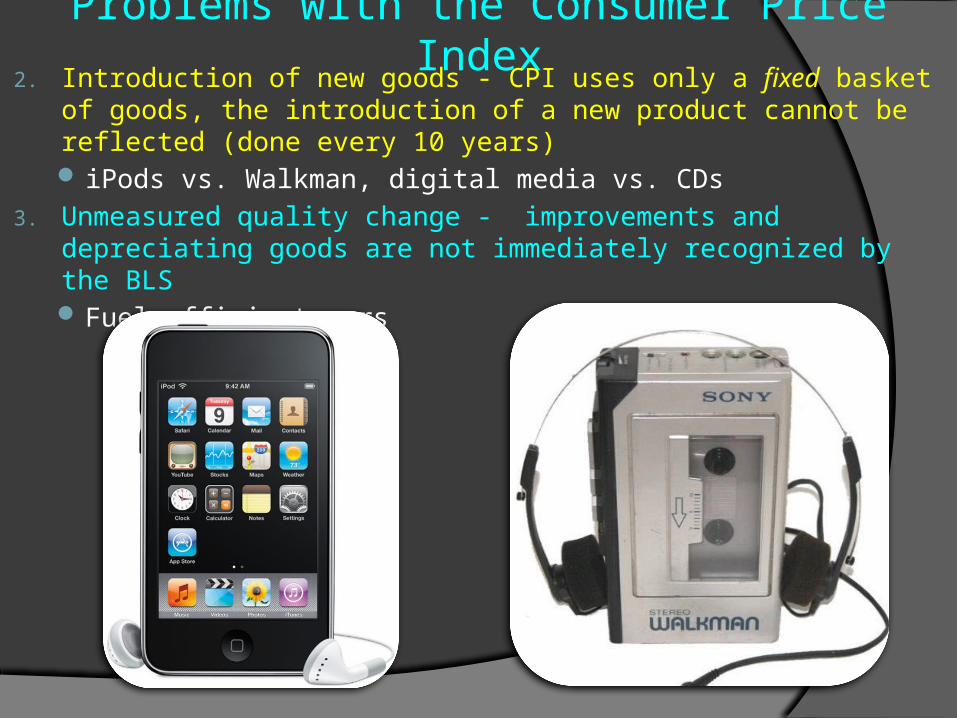
Problems with the Consumer Price Index
2. Introduction of new goods - CPI uses only a fixed basket of goods, the introduction of a new product cannot be reflected (done every 10 years) iPods vs. Walkman, digital media vs. CDs
3. Unmeasured quality change - improvements and depreciating goods are not immediately recognized by the BLS Fuel efficient cars
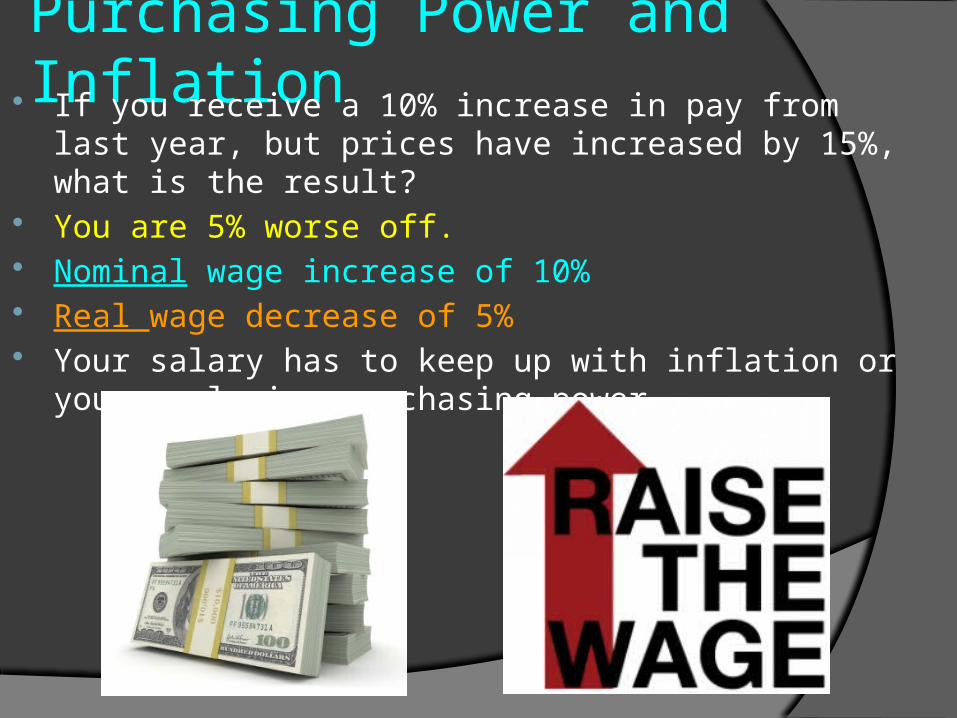
Purchasing Power and Inflation If you receive a 10% increase in pay from last year, but prices
have increased by 15%, what is the result? You are 5% worse off. Nominal wage increase of 10% Real wage decrease of 5% Your salary has to keep up with inflation or you are losing
purchasing power
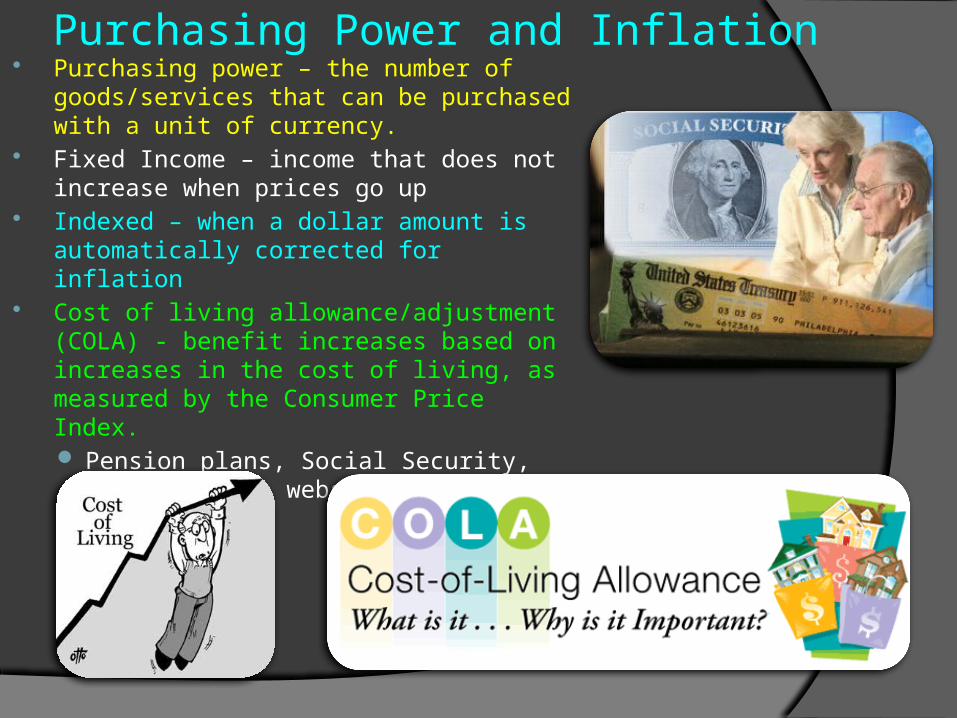
Purchasing Power and Inflation Purchasing power – the number of
goods/services that can be purchased with a unit of currency.
Fixed Income – income that does not increase when prices go up
Indexed – when a dollar amount is automatically corrected for inflation
Cost of living allowance/adjustment (COLA) - benefit increases based on increases in the cost of living, as measured by the Consumer Price Index. Pension plans, Social Security, Salaries (see
website)
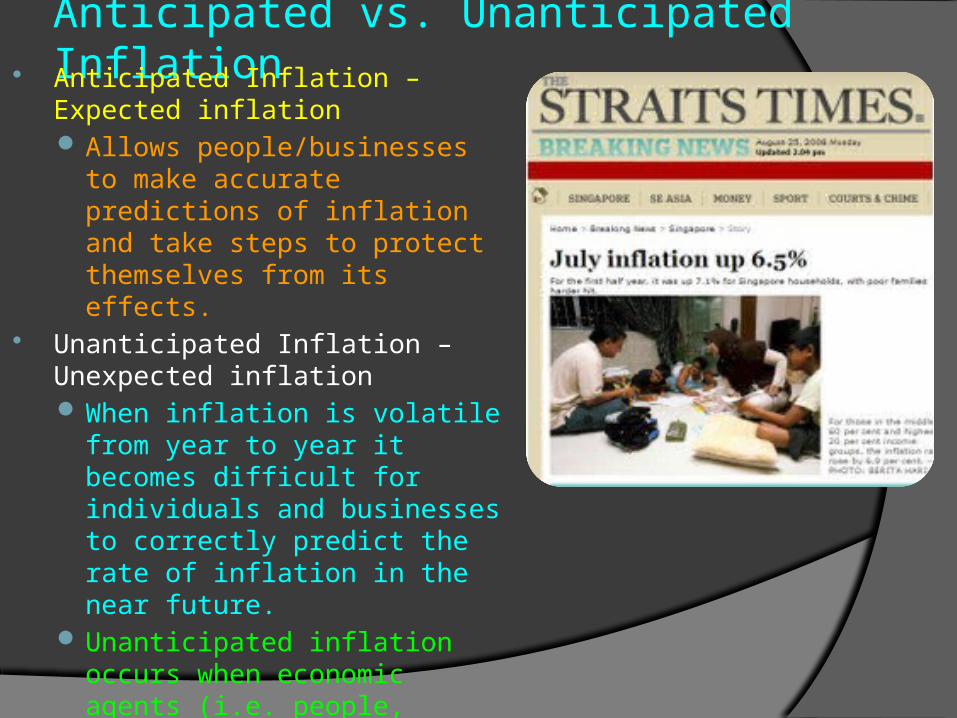
Anticipated vs. Unanticipated Inflation Anticipated Inflation – Expected inflation Allows people/businesses to make
accurate predictions of inflation and take steps to protect themselves from its effects.
Unanticipated Inflation – Unexpected inflation When inflation is volatile from year
to year it becomes difficult for individuals and businesses to correctly predict the rate of inflation in the near future.
Unanticipated inflation occurs when economic agents (i.e. people, businesses and governments) make errors in their inflation forecasts.
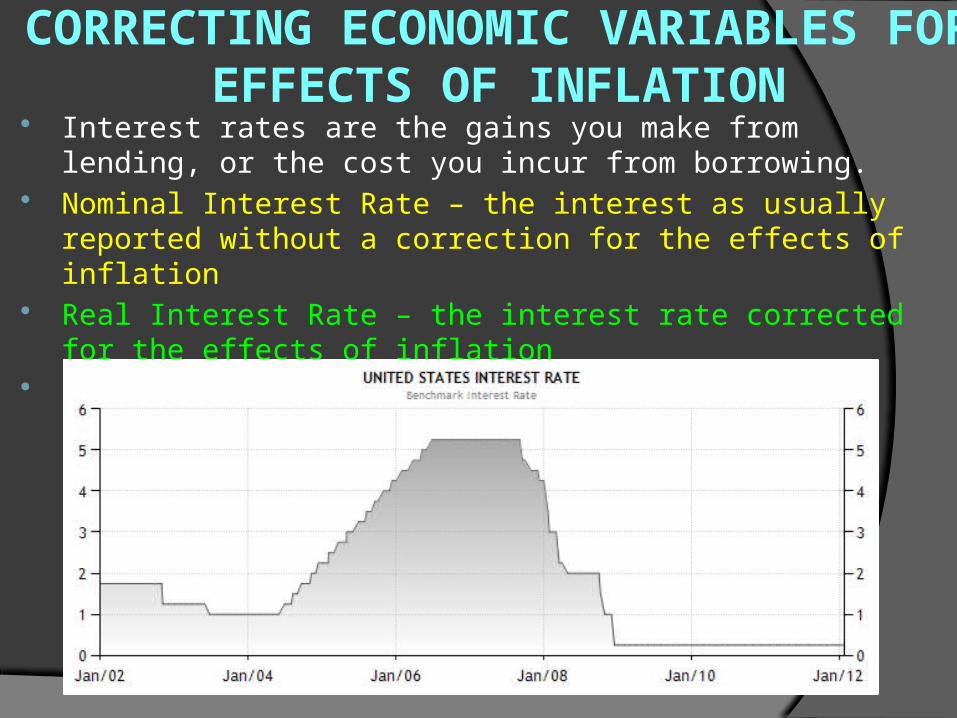
Interest rates are the gains you make from lending, or the cost you incur from borrowing.
Nominal Interest Rate – the interest as usually reported without a correction for the effects of inflation
Real Interest Rate – the interest rate corrected for the effects of inflation Real Interest Rate = Nominal Interest Rate – Inflation
CORRECTING ECONOMIC VARIABLES FOR EFFECTS OF INFLATION
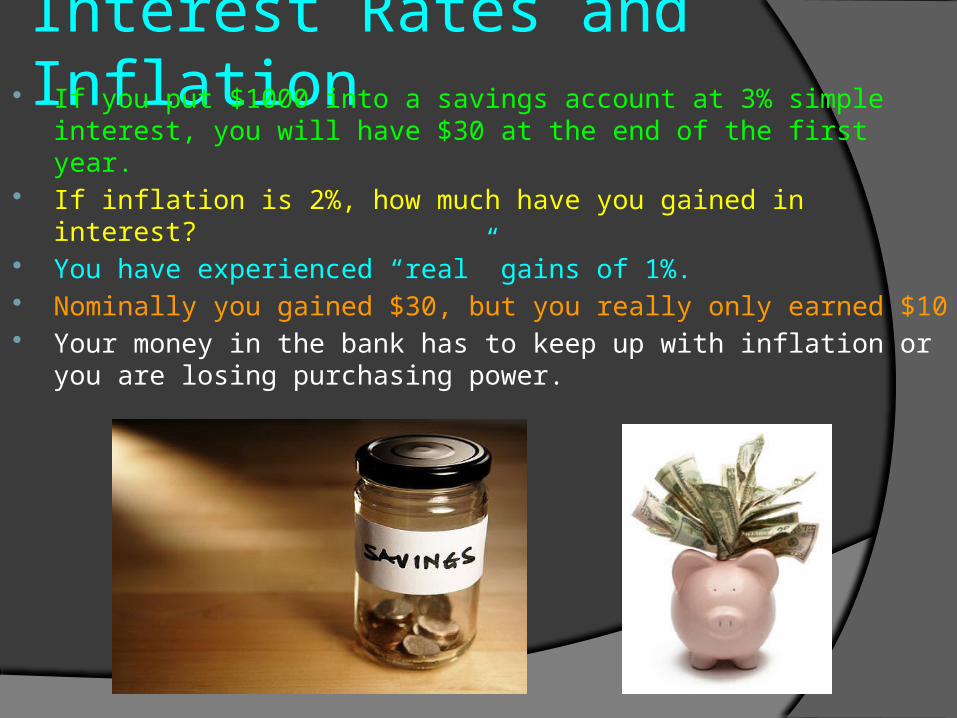
Interest Rates and Inflation If you put $1000 into a savings account at 3% simple interest, you will have
$30 at the end of the first year. If inflation is 2%, how much have you gained in interest? You have experienced “real” gains of 1%. Nominally you gained $30, but you really only earned $10 Your money in the bank has to keep up with inflation or you are losing
purchasing power.
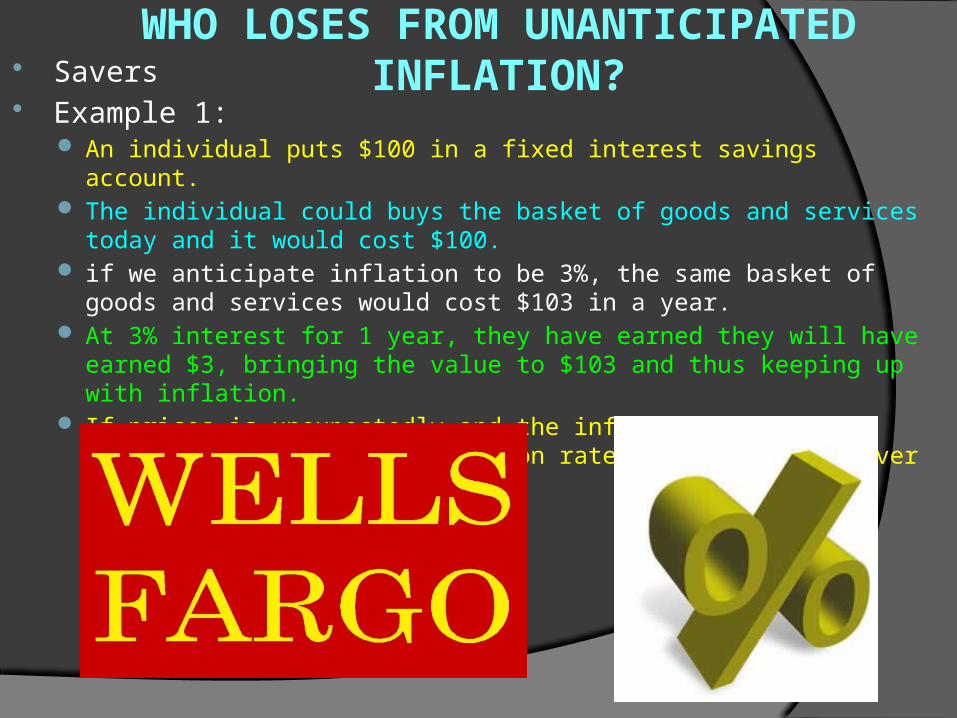
Savers Example 1:
An individual puts $100 in a fixed interest savings account. The individual could buys the basket of goods and services today and it would cost
$100. if we anticipate inflation to be 3%, the same basket of goods and services would cost
$103 in a year. At 3% interest for 1 year, they have earned they will have earned $3, bringing the
value to $103 and thus keeping up with inflation. If prices is unexpectedly and the inflation rate is 4%, then the unanticipated inflation
rate is 1%, and the saver loses purchasing power.
WHO LOSES FROM UNANTICIPATED INFLATION?
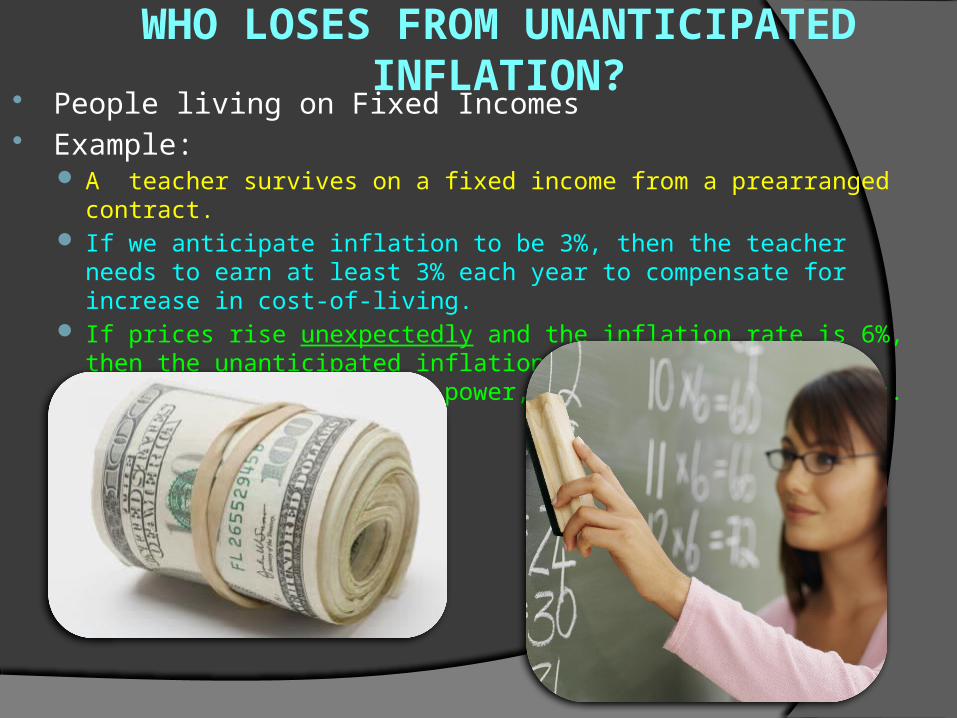
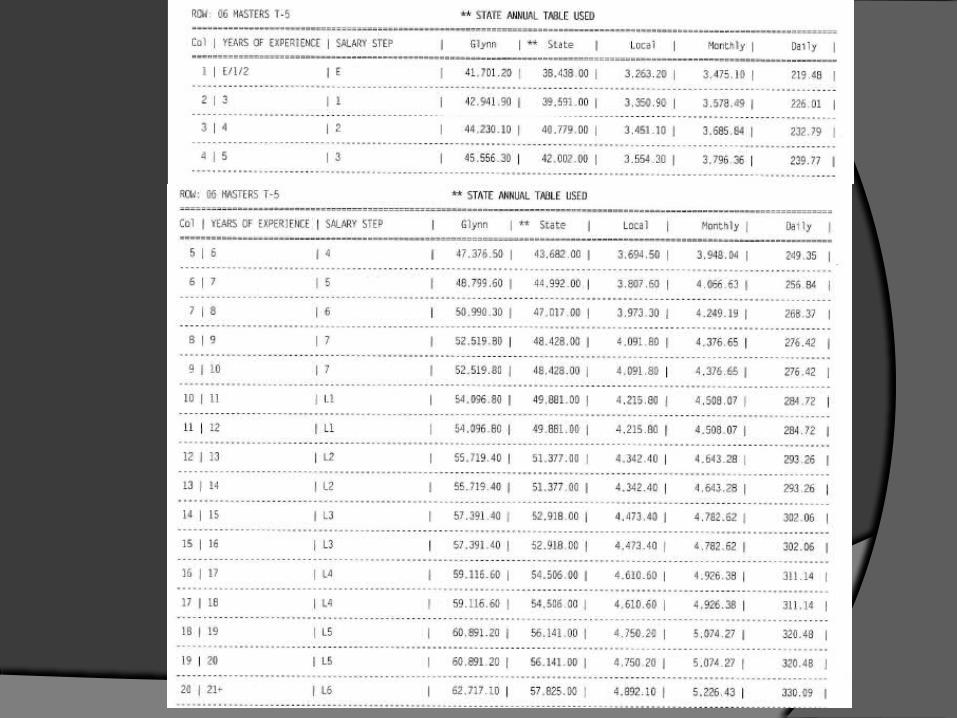
People living on Fixed Incomes Example:
A teacher survives on a fixed income from a prearranged contract. If we anticipate inflation to be 3%, then the teacher needs to earn at least 3% each
year to compensate for increase in cost-of-living. If prices rise unexpectedly and the inflation rate is 6%, then the unanticipated inflation
rate is 3%, and the teacher loses purchasing power, bringing down real wages.
WHO LOSES FROM UNANTICIPATED INFLATION?
Lenders Example:
Suppose Bank of America lends an individual $10,000 to be paid back in 2 years at 4% simple interest, or 800 dollars.
The bank will structure the loan to account for anticipated inflation. If inflation rises beyond what is structured in the loan, say 6% each year, then the
lender is being paid back with money that is less valuable relative to the rate of inflation.
WHO LOSES FROM UNANTICIPATED INFLATION?
People living on a flexible income (COLA) Example:
Someone living on Social Security (COLA is pegged to inflation) Someone that has a COLA built into their contract for wages. Someone that is retired and is living on a pension that accounts for inflation.
Borrowers (fixed interest rate): Example:
Someone borrows $275,000 to build a house and negotiates a 4.25% interest rate. Inflation rises and causes banks to build higher rates into current contracts . Now contracts are set at 6.25%
WHO GAINS/UNAFFECTED BY UNANTICIPATED INFLATION?
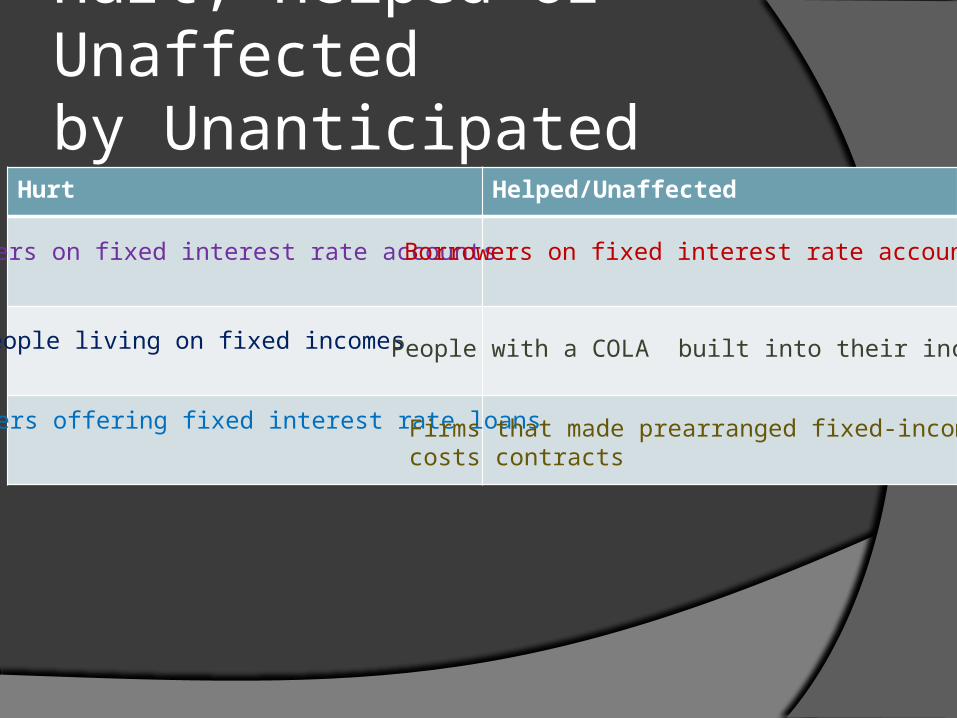
Hurt, Helped or Unaffected by Unanticipated Inflation
Hurt Helped/Unaffected
Savers on fixed interest rate accounts
People living on fixed incomes
Lenders offering fixed interest rate loans
Borrowers on fixed interest rate accounts
People with a COLA built into their income
Firms that made prearranged fixed-income/costs contracts
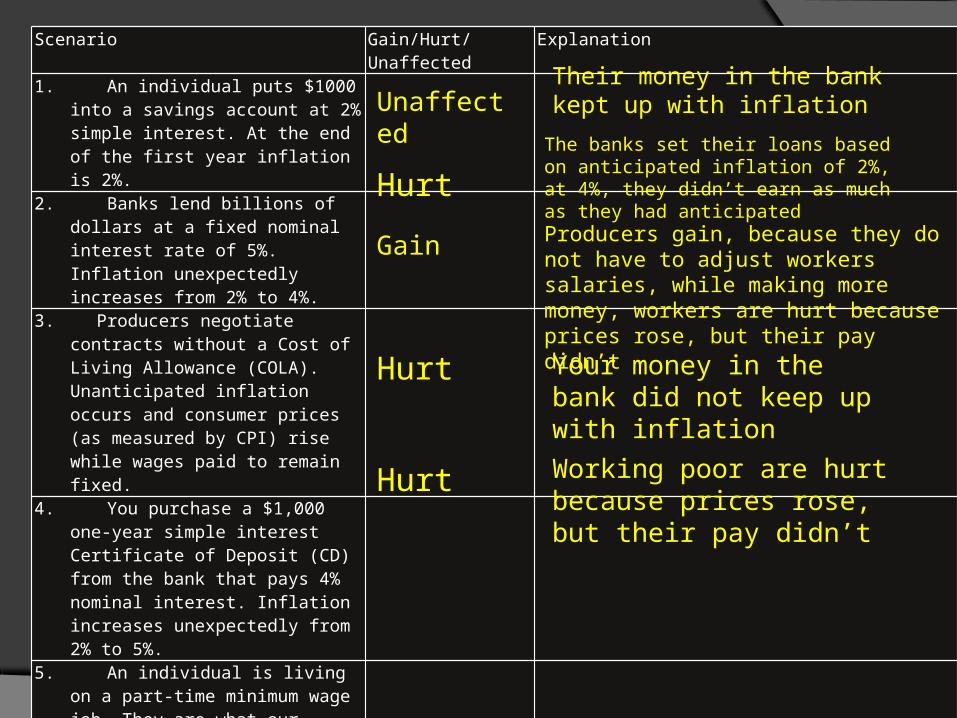
Scenario Gain/Hurt/Unaffected Explanation1. An individual puts $1000 into a
savings account at 2% simple interest. At the end of the first year inflation is 2%.
2. Banks lend billions of dollars at a fixed nominal interest rate of 5%. Inflation unexpectedly increases from 2% to 4%.
3. Producers negotiate contracts without a Cost of Living Allowance (COLA). Unanticipated inflation occurs and consumer prices (as measured by CPI) rise while wages paid to remain fixed.
4. You purchase a $1,000 one-year simple interest Certificate of Deposit (CD) from the bank that pays 4% nominal interest. Inflation increases unexpectedly from 2% to 5%.
5. An individual is living on a part-time minimum wage job. They are what our society would call “working poor” and as a result of their paycheck-to-paycheck existence have no form of financial investments. Inflation rises at a normal rate of 2-3% for the year. The minimum wage does not increase, nor does the individual get a raise.
Unaffected Their money in the bank kept up with inflation
Hurt
The banks set their loans based on anticipated inflation of 2%, at 4%, they didn’t earn as much as they had anticipated
Gain Producers gain, because they do not have to adjust workers salaries, while making more money, workers are hurt because prices rose, but their pay didn’t
Hurt Your money in the bank did not keep up with inflation
Hurt Working poor are hurt because prices rose, but their pay didn’t
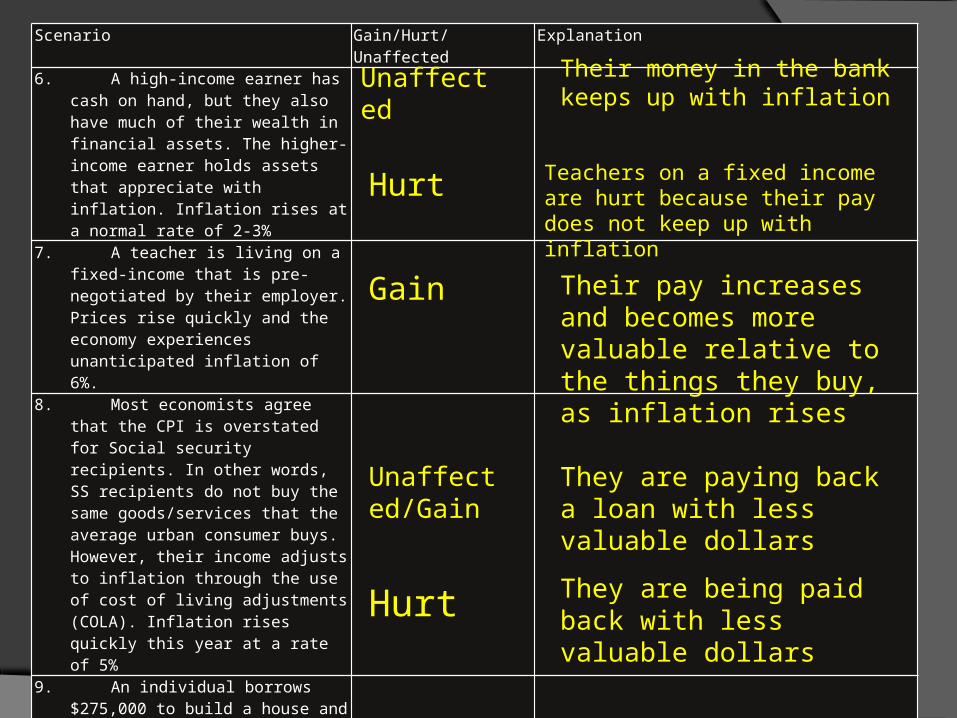
Scenario Gain/Hurt/Unaffected Explanation6. A high-income earner has cash on
hand, but they also have much of their wealth in financial assets. The higher-income earner holds assets that appreciate with inflation. Inflation rises at a normal rate of 2-3%
7. A teacher is living on a fixed-income that is pre-negotiated by their employer. Prices rise quickly and the economy experiences unanticipated inflation of 6%.
8. Most economists agree that the CPI is overstated for Social security recipients. In other words, SS recipients do not buy the same goods/services that the average urban consumer buys. However, their income adjusts to inflation through the use of cost of living adjustments (COLA). Inflation rises quickly this year at a rate of 5%
9. An individual borrows $275,000 to build a house and negotiates a 4.25% interest rate. Inflation rises and causes banks to build higher rates into current contracts. Now contracts are set at 6.25%
10. Suppose Bank of America provides a loan of $10,000 to be paid back in 2 years at 2% simple interest, or 400 dollars. The bank will structure the loan to account for anticipated inflation. Inflation rises beyond what is anticipated, say 5% this year.
Unaffected Their money in the bank keeps up with inflation
Hurt Teachers on a fixed income are hurt because their pay does not keep up with inflation
Gain Their pay increases and becomes more valuable relative to the things they buy, as inflation rises
Unaffected/Gain
They are paying back a loan with less valuable dollars
Hurt They are being paid back with less valuable dollars
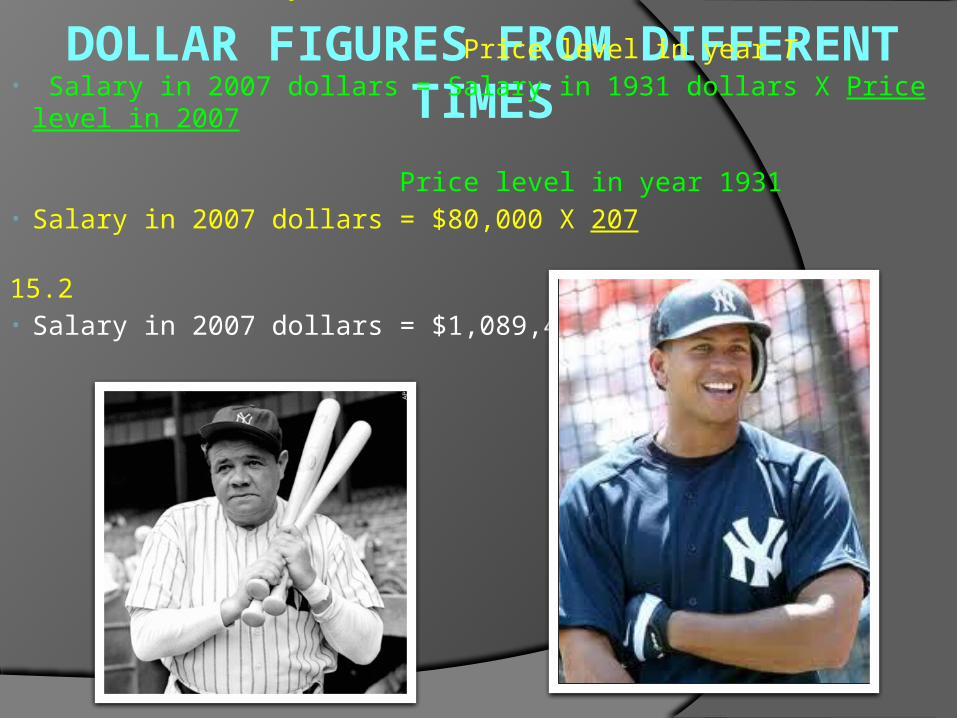
DOLLAR FIGURES FROM DIFFERENT TIMES• Amount in today’s dollars = Amt. in year T dollars X Price level today
Price level in year T • Salary in 2007 dollars = Salary in 1931 dollars X Price level in 2007
Price level in year 1931• Salary in 2007 dollars = $80,000 X 207
15.2• Salary in 2007 dollars = $1,089,474
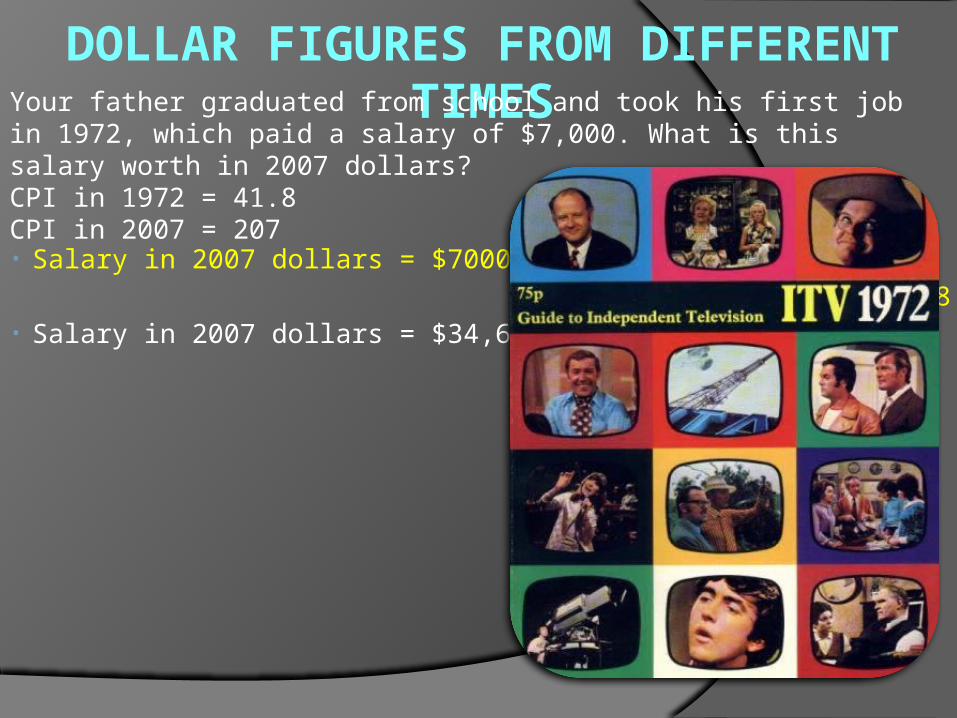
DOLLAR FIGURES FROM DIFFERENT TIMES
• Salary in 2007 dollars = $7000 X 207
41.8• Salary in 2007 dollars = $34,655
Your father graduated from school and took his first job in 1972, which paid a salary of $7,000. What is this salary worth in 2007 dollars?CPI in 1972 = 41.8CPI in 2007 = 207
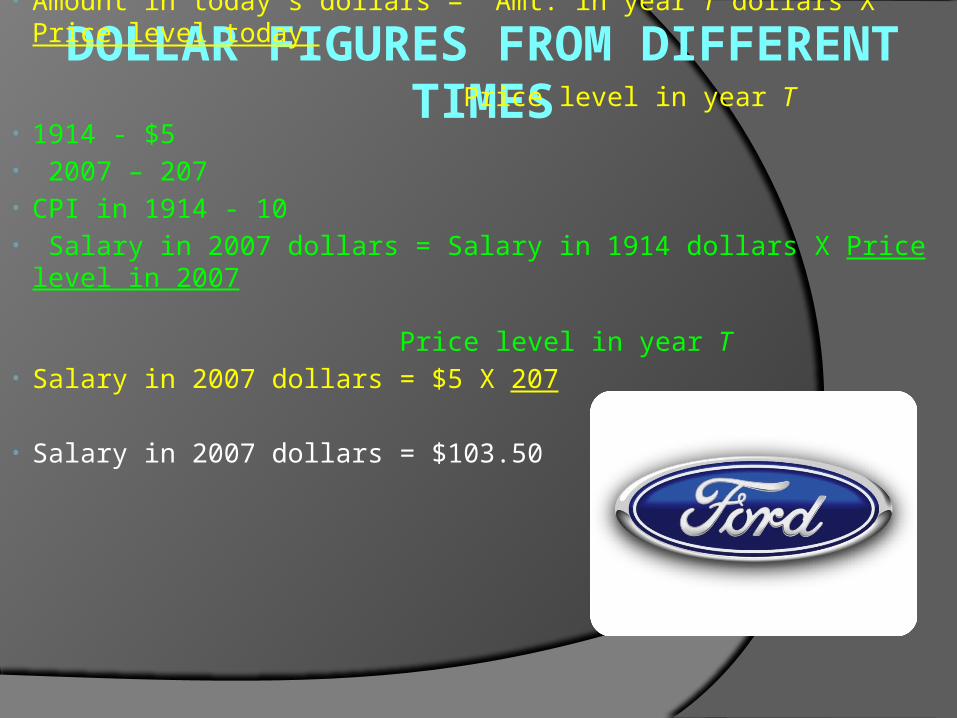
DOLLAR FIGURES FROM DIFFERENT TIMES
• Amount in today’s dollars = Amt. in year T dollars X Price level today Price level in year T
• 1914 - $5• 2007 – 207• CPI in 1914 - 10• Salary in 2007 dollars = Salary in 1914 dollars X Price level in 2007
Price level in year T• Salary in 2007 dollars = $5 X 207
10• Salary in 2007 dollars = $103.50
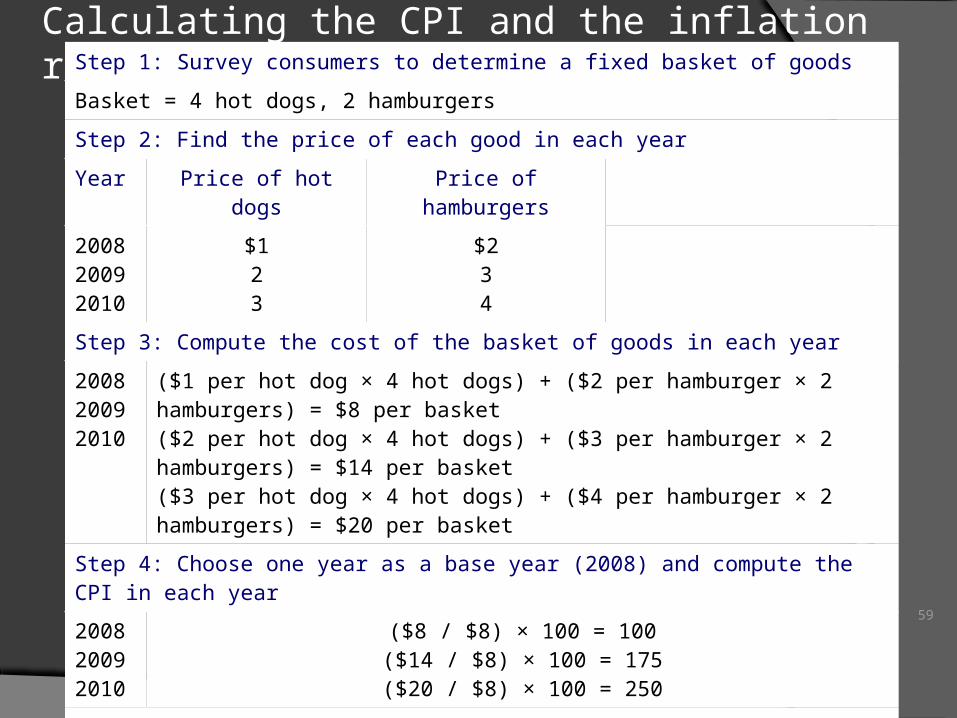
Calculating the CPI and the inflation rate: an example
59
Step 1: Survey consumers to determine a fixed basket of goods
Basket = 4 hot dogs, 2 hamburgers
Step 2: Find the price of each good in each year
Year Price of hot dogs Price of hamburgers
200820092010
$123
$234
Step 3: Compute the cost of the basket of goods in each year
200820092010
($1 per hot dog × 4 hot dogs) + ($2 per hamburger × 2 hamburgers) = $8 per basket($2 per hot dog × 4 hot dogs) + ($3 per hamburger × 2 hamburgers) = $14 per basket($3 per hot dog × 4 hot dogs) + ($4 per hamburger × 2 hamburgers) = $20 per basket
Step 4: Choose one year as a base year (2008) and compute the CPI in each year
200820092010
($8 / $8) × 100 = 100($14 / $8) × 100 = 175($20 / $8) × 100 = 250
Step 5: Use the consumer price index to compute the inflation rate from previous year
20092010
(175 – 100) / 100 × 100 = 75%(250 – 175) / 175 × 100 = 43%
VIS Terms1. Structural2. Cyclical 3. Frictional 4. Seasonal
5. Unemployment Rate
6. Underemployment
7. Discouraged Worker
8. Inflation
9. Inflation rate
10. Hyperinflation
11. Deflation
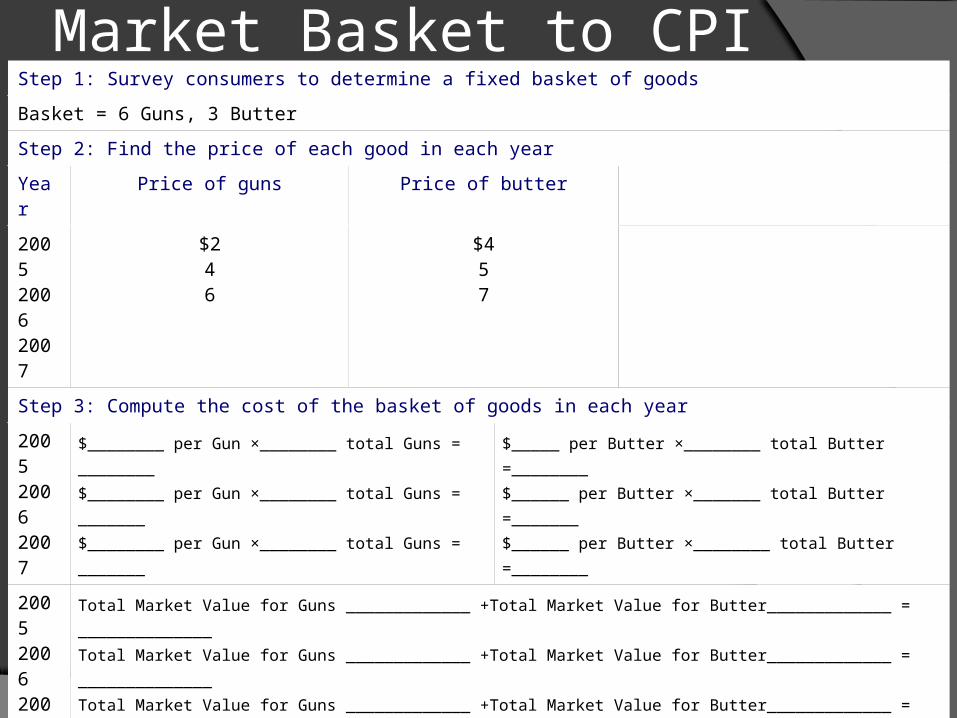
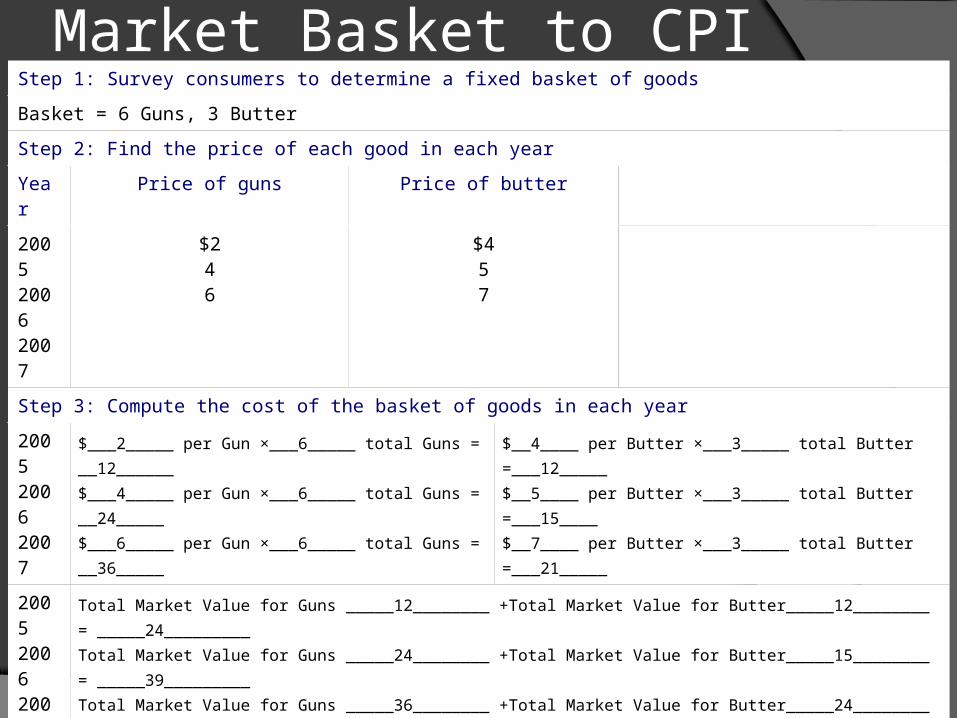
Market Basket to CPIStep 1: Survey consumers to determine a fixed basket of goods
Basket = 6 Guns, 3 Butter
Step 2: Find the price of each good in each year
Year Price of guns Price of butter
200520062007
$246
$457
Step 3: Compute the cost of the basket of goods in each year
200520062007
$________ per Gun ×________ total Guns = ________$________ per Gun ×________ total Guns = _______$________ per Gun ×________ total Guns = _______
$_____ per Butter ×________ total Butter =________$______ per Butter ×_______ total Butter =_______$______ per Butter ×________ total Butter =________
200520062007
Total Market Value for Guns _____________ +Total Market Value for Butter_____________ = ______________ Total Market Value for Guns _____________ +Total Market Value for Butter_____________ = ______________Total Market Value for Guns _____________ +Total Market Value for Butter_____________ = ______________
Step 4: Choose one year as a base year (2005) and compute the CPI in each year
200520062007
CPI = $___________ (2005)/___________(2005) = __________ X 100 = __________CPI = $____________ (2006)/___________(2005) = ___________ X 100 = ________CPI = $___________ (2007)/___________(2005) = ___________ X 100 = _________
Step 5: Use the consumer price index to compute the inflation rate from previous year
20062007

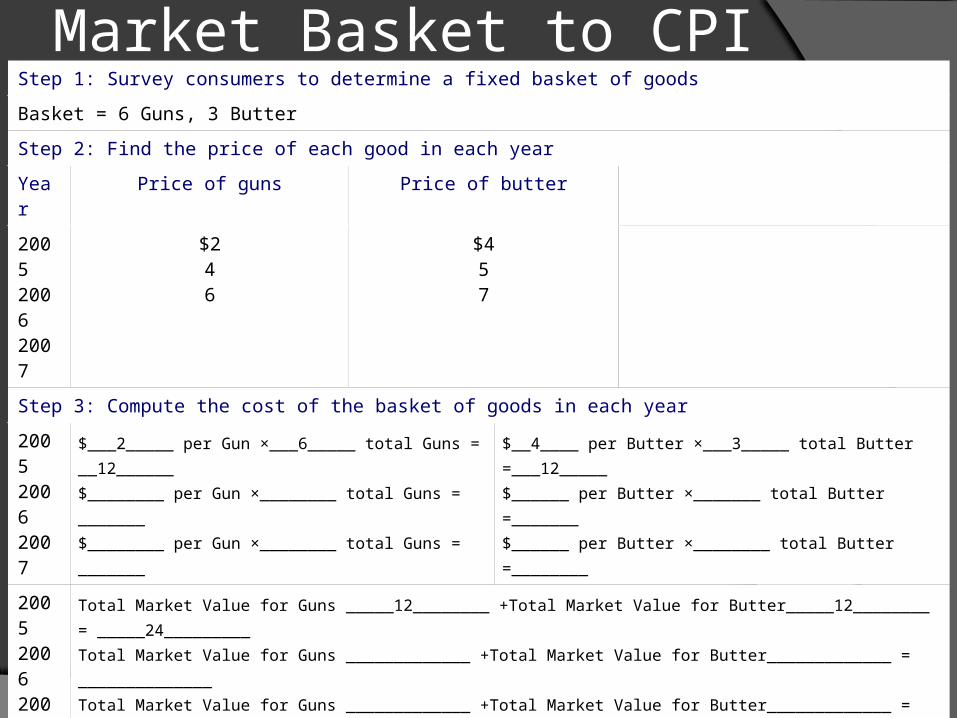
Market Basket to CPIStep 1: Survey consumers to determine a fixed basket of goods
Basket = 6 Guns, 3 Butter
Step 2: Find the price of each good in each year
Year Price of guns Price of butter
200520062007
$246
$457
Step 3: Compute the cost of the basket of goods in each year
200520062007
$___2_____ per Gun ×___6_____ total Guns = __12______$________ per Gun ×________ total Guns = _______$________ per Gun ×________ total Guns = _______
$__4____ per Butter ×___3_____ total Butter =___12_____$______ per Butter ×_______ total Butter =_______$______ per Butter ×________ total Butter =________
200520062007
Total Market Value for Guns _____________ +Total Market Value for Butter_____________ = ______________ Total Market Value for Guns _____________ +Total Market Value for Butter_____________ = ______________Total Market Value for Guns _____________ +Total Market Value for Butter_____________ = ______________
Step 4: Choose one year as a base year (2005) and compute the CPI in each year
200520062007
CPI = $___________ (2005)/___________(2005) = __________ X 100 = __________CPI = $____________ (2006)/___________(2005) = ___________ X 100 = ________CPI = $___________ (2007)/___________(2005) = ___________ X 100 = _________
Step 5: Use the consumer price index to compute the inflation rate from previous year
20062007

Market Basket to CPIStep 1: Survey consumers to determine a fixed basket of goods
Basket = 6 Guns, 3 Butter
Step 2: Find the price of each good in each year
Year Price of guns Price of butter
200520062007
$246
$457
Step 3: Compute the cost of the basket of goods in each year
200520062007
$___2_____ per Gun ×___6_____ total Guns = __12______$________ per Gun ×________ total Guns = _______$________ per Gun ×________ total Guns = _______
$__4____ per Butter ×___3_____ total Butter =___12_____$______ per Butter ×_______ total Butter =_______$______ per Butter ×________ total Butter =________
200520062007
Total Market Value for Guns _____12________ +Total Market Value for Butter_____12________ = _____24_________ Total Market Value for Guns _____________ +Total Market Value for Butter_____________ = ______________Total Market Value for Guns _____________ +Total Market Value for Butter_____________ = ______________
Step 4: Choose one year as a base year (2005) and compute the CPI in each year
200520062007
CPI = $___________ (2005)/___________(2005) = __________ X 100 = __________CPI = $____________ (2006)/___________(2005) = ___________ X 100 = ________CPI = $___________ (2007)/___________(2005) = ___________ X 100 = _________
Step 5: Use the consumer price index to compute the inflation rate from previous year
20062007
Market Basket to CPIStep 1: Survey consumers to determine a fixed basket of goods
Basket = 6 Guns, 3 Butter
Step 2: Find the price of each good in each year
Year Price of guns Price of butter
200520062007
$246
$457
Step 3: Compute the cost of the basket of goods in each year
200520062007
$___2_____ per Gun ×___6_____ total Guns = __12______$________ per Gun ×________ total Guns = _______$________ per Gun ×________ total Guns = _______
$__4____ per Butter ×___3_____ total Butter =___12_____$______ per Butter ×_______ total Butter =_______$______ per Butter ×________ total Butter =________
200520062007
Total Market Value for Guns _____12________ +Total Market Value for Butter_____12________ = _____24_________ Total Market Value for Guns _____________ +Total Market Value for Butter_____________ = ______________Total Market Value for Guns _____________ +Total Market Value for Butter_____________ = ______________
Step 4: Choose one year as a base year (2005) and compute the CPI in each year
200520062007
CPI = $_____24_______ (2005)/_____24______(2005) = _____1______ X 100 = ____100_____CPI = $____________ (2006)/___________(2005) = ___________ X 100 = ________CPI = $___________ (2007)/___________(2005) = ___________ X 100 = _________
Step 5: Use the consumer price index to compute the inflation rate from previous year
20062007

Market Basket to CPIStep 1: Survey consumers to determine a fixed basket of goods
Basket = 6 Guns, 3 Butter
Step 2: Find the price of each good in each year
Year Price of guns Price of butter
200520062007
$246
$457
Step 3: Compute the cost of the basket of goods in each year
200520062007
$___2_____ per Gun ×___6_____ total Guns = __12______$___4_____ per Gun ×___6_____ total Guns = __24_____$________ per Gun ×________ total Guns = _______
$__4____ per Butter ×___3_____ total Butter =___12_____$__5____ per Butter ×___3_____ total Butter =___15____$______ per Butter ×________ total Butter =________
200520062007
Total Market Value for Guns _____12________ +Total Market Value for Butter_____12________ = _____24_________ Total Market Value for Guns _____________ +Total Market Value for Butter_____________ = ______________Total Market Value for Guns _____________ +Total Market Value for Butter____________ = ______________
Step 4: Choose one year as a base year (2005) and compute the CPI in each year
200520062007
CPI = $_____24_______ (2005)/_____24______(2005) = _____1______ X 100 = ____100_______CPI = $____________ (2006)/___________(2005) = ___________ X 100 = ________CPI = $___________ (2007)/___________(2005) = ___________ X 100 = _________
Step 5: Use the consumer price index to compute the inflation rate from previous year
20062007

Market Basket to CPIStep 1: Survey consumers to determine a fixed basket of goods
Basket = 6 Guns, 3 Butter
Step 2: Find the price of each good in each year
Year Price of guns Price of butter
200520062007
$246
$457
Step 3: Compute the cost of the basket of goods in each year
200520062007
$___2_____ per Gun ×___6_____ total Guns = __12______$___4_____ per Gun ×___6_____ total Guns = __24_____$________ per Gun ×________ total Guns = _______
$__4____ per Butter ×___3_____ total Butter =___12_____$__5____ per Butter ×___3_____ total Butter =___15____$______ per Butter ×________ total Butter =________
200520062007
Total Market Value for Guns _____12________ +Total Market Value for Butter_____12________ = _____24_________ Total Market Value for Guns _____24________ +Total Market Value for Butter_____15________ = _____39_________Total Market Value for Guns _____________ +Total Market Value for Butter____________ = ______________
Step 4: Choose one year as a base year (2005) and compute the CPI in each year
200520062007
CPI = $_____24_______ (2005)/_____24______(2005) = _____1______ X 100 = ____100_______CPI = $_____39_______ (2006)/____24_______(2005) = ___1.625________ X 100 = __162.5______
CPI = $___________ (2007)/___________(2005) = ___________ X 100 = _________
Step 5: Use the consumer price index to compute the inflation rate from previous year
20062007

Market Basket to CPIStep 1: Survey consumers to determine a fixed basket of goods
Basket = 6 Guns, 3 Butter
Step 2: Find the price of each good in each year
Year Price of guns Price of butter
200520062007
$246
$457
Step 3: Compute the cost of the basket of goods in each year
200520062007
$___2_____ per Gun ×___6_____ total Guns = __12______$___4_____ per Gun ×___6_____ total Guns = __24_____$___6_____ per Gun ×___6_____ total Guns = __36_____
$__4____ per Butter ×___3_____ total Butter =___12_____$__5____ per Butter ×___3_____ total Butter =___15____$__7____ per Butter ×___3_____ total Butter =___21_____
200520062007
Total Market Value for Guns _____12________ +Total Market Value for Butter_____12________ = _____24_________ Total Market Value for Guns _____24________ +Total Market Value for Butter_____15________ = _____39_________Total Market Value for Guns _____36________ +Total Market Value for Butter_____21________ = _____57_________
Step 4: Choose one year as a base year (2005) and compute the CPI in each year
200520062007
CPI = $_____24_______ (2005)/_____24______(2005) = _____1______ X 100 = ____100_______CPI = $_____39_______ (2006)/____24_______(2005) = ___1.625________ X 100 = __162.5______CPI = $_____57______ (2007)/____24_______(2005) = ___2.375________ X 100 = ____237.5_____
Step 5: Use the consumer price index to compute the inflation rate from previous year
20062007
Market Basket to CPIStep 1: Survey consumers to determine a fixed basket of goods
Basket = 6 Guns, 3 Butter
Step 2: Find the price of each good in each year
Year Price of guns Price of butter
200520062007
$246
$457
Step 3: Compute the cost of the basket of goods in each year
200520062007
$___2_____ per Gun ×___6_____ total Guns = __12______$___4_____ per Gun ×___6_____ total Guns = __24_____$___6_____ per Gun ×___6_____ total Guns = __36_____
$__4____ per Butter ×___3_____ total Butter =___12_____$__5____ per Butter ×___3_____ total Butter =___15____$__7____ per Butter ×___3_____ total Butter =___21_____
200520062007
Total Market Value for Guns _____12________ +Total Market Value for Butter_____12________ = _____24_________ Total Market Value for Guns _____24________ +Total Market Value for Butter_____15________ = _____39_________Total Market Value for Guns _____36________ +Total Market Value for Butter_____24________ = _____57_________
Step 4: Choose one year as a base year (2005) and compute the CPI in each year
200520062007
CPI = $_____24_______ (2005)/_____24______(2005) = _____1______ X 100 = ____100_______CPI = $_____39_______ (2006)/____24_______(2005) = ___1.625________ X 100 = __162.5______CPI = $_____57______ (2007)/____24_______(2005) = ___2.375________ X 100 = ____237.5_____
Step 5: Use the consumer price index to compute the inflation rate from previous year
20062007
(162.5 – 100) / 100 × 100 =

Market Basket to CPIStep 1: Survey consumers to determine a fixed basket of goods
Basket = 6 Guns, 3 Butter
Step 2: Find the price of each good in each year
Year Price of guns Price of butter
200520062007
$246
$457
Step 3: Compute the cost of the basket of goods in each year
200520062007
$___2_____ per Gun ×___6_____ total Guns = __12______$___4_____ per Gun ×___6_____ total Guns = __24_____$___6_____ per Gun ×___6_____ total Guns = __36_____
$__4____ per Butter ×___3_____ total Butter =___12_____$__5____ per Butter ×___3_____ total Butter =___15____$__7____ per Butter ×___3_____ total Butter =___21_____
200520062007
Total Market Value for Guns _____12________ +Total Market Value for Butter_____12________ = _____24_________ Total Market Value for Guns _____24________ +Total Market Value for Butter_____15________ = _____39_________Total Market Value for Guns _____36________ +Total Market Value for Butter_____24________ = _____57_________
Step 4: Choose one year as a base year (2005) and compute the CPI in each year
200520062007
CPI = $_____24_______ (2005)/_____24______(2005) = _____1______ X 100 = ____100_______CPI = $_____39_______ (2006)/____24_______(2005) = ___1.625________ X 100 = __162.5______CPI = $_____57______ (2007)/____24_______(2005) = ___2.375________ X 100 = ____237.5_____
Step 5: Use the consumer price index to compute the inflation rate from previous year
20062007
(162.5 – 100) / 100 × 100 = 62.5%

Market Basket to CPIStep 1: Survey consumers to determine a fixed basket of goods
Basket = 6 Guns, 3 Butter
Step 2: Find the price of each good in each year
Year Price of guns Price of butter
200520062007
$246
$457
Step 3: Compute the cost of the basket of goods in each year
200520062007
$___2_____ per Gun ×___6_____ total Guns = __12______$___4_____ per Gun ×___6_____ total Guns = __24_____$___6_____ per Gun ×___6_____ total Guns = __36_____
$__4____ per Butter ×___3_____ total Butter =___12_____$__5____ per Butter ×___3_____ total Butter =___15____$__7____ per Butter ×___3_____ total Butter =___21_____
200520062007
Total Market Value for Guns _____12________ +Total Market Value for Butter_____12________ = _____24_________ Total Market Value for Guns _____24________ +Total Market Value for Butter_____15________ = _____39_________Total Market Value for Guns _____36________ +Total Market Value for Butter_____24________ = _____57_________
Step 4: Choose one year as a base year (2005) and compute the CPI in each year
200520062007
CPI = $_____24_______ (2005)/_____24______(2005) = _____1______ X 100 = ____100_______CPI = $_____39_______ (2006)/____24_______(2005) = ___1.625________ X 100 = __162.5______CPI = $_____57______ (2007)/____24_______(2005) = ___2.375________ X 100 = ____237.5_____
Step 5: Use the consumer price index to compute the inflation rate from previous year
20062007
(162.5 – 100) / 100 × 100 = 62.5%(237.5 – 162.5) / 162.5 × 100 = 46.15%

Determining CPIYear CPI Conversion
2008 3858.18/1792 = 2.153 x 100 = 215.30
2007
2006
2005
2004
2003
2002
2001
2000

Determining CPIYear CPI Conversion
2008 3858.18/1792 = 2.153 x 100 = 215.3
2007 3715.53/1792 = 2.073 x 100 = 207.3
2006
2005
2004
2003
2002
2001
2000

Determining CPIYear CPI Conversion
2008 3858.18/1792 = 2.153 x 100 = 215.3
2007 3715.53/1792 = 2.073 x 100 = 207.3
2006 3612.67/1792 = 2.0159 x 100 = 202.0
2005 3499.76/1792 = 1.9529 x 100 = 195.3
2004 3358.08/1792 = 1.8739 x 100 = 187.4
2003 3296.56/1792 = 1.8395 x 100 = 184.0
2002 3223.44/1792 = 1.7987 x 100 = 180.0
2001 3173.63/1792 = 1.7709 x 100 = 177.1
2000 3085.92/1792 = 1.7220 x 100 = 172.2
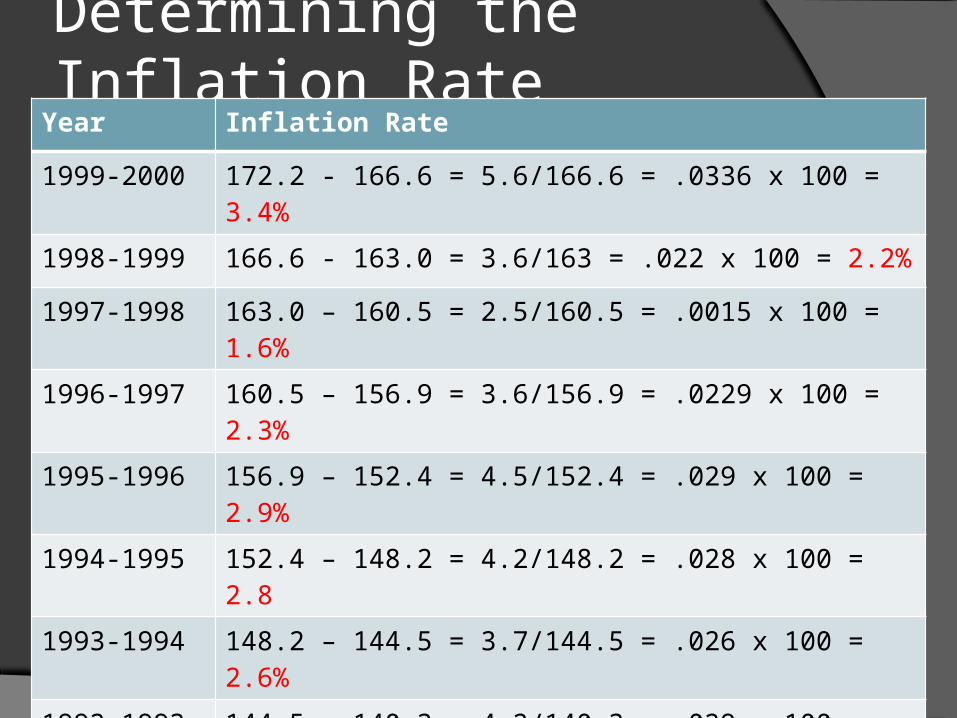
Determining the Inflation Rate
Year Inflation Rate
1999-2000 172.2 - 166.6 = 5.6/166.6 = .0336 x 100 = 3.4%
1998-1999 166.6 - 163.0 = 3.6/163 = .022 x 100 = 2.2%
1997-1998 163.0 – 160.5 = 2.5/160.5 = .0015 x 100 = 1.6%
1996-1997 160.5 – 156.9 = 3.6/156.9 = .0229 x 100 = 2.3%
1995-1996 156.9 – 152.4 = 4.5/152.4 = .029 x 100 = 2.9%
1994-1995 152.4 – 148.2 = 4.2/148.2 = .028 x 100 = 2.8
1993-1994 148.2 – 144.5 = 3.7/144.5 = .026 x 100 = 2.6%
1992-1993 144.5 – 140.3 = 4.2/140.3 = .029 x 100 = 2.9%
1991-1992 140.3 – 136.2 = 4.1/136.2 = .03 x 100 = 3.0%
1990-1991 136.2 – 130.7 = 5.5/130.7 = .04 x 100 = 4.2%
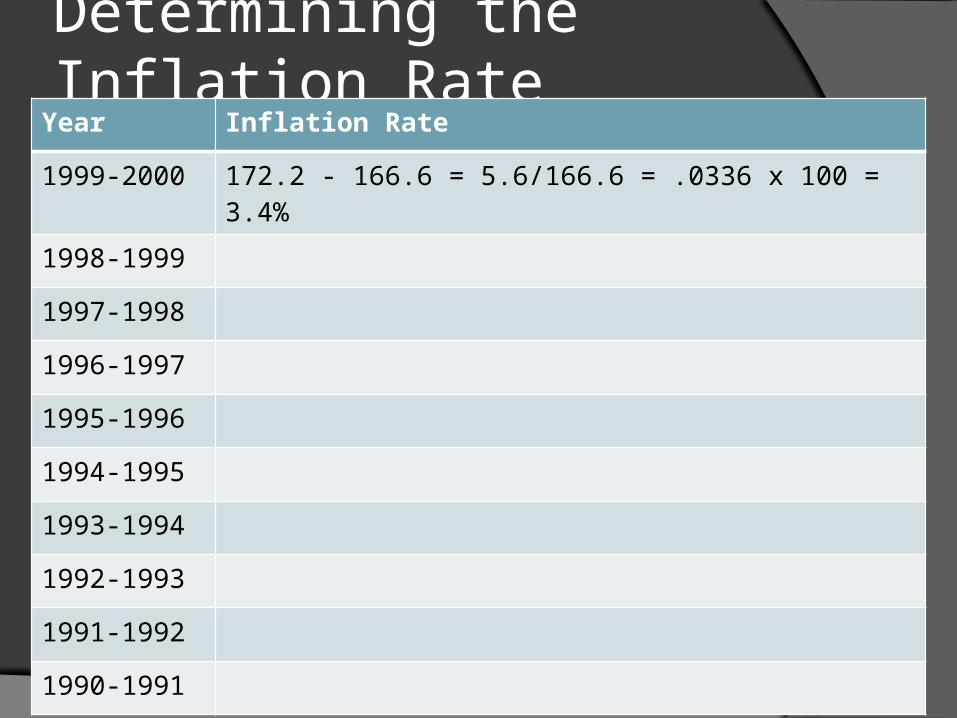
Determining the Inflation Rate
Year Inflation Rate
1999-2000 172.2 - 166.6 = 5.6/166.6 = .0336 x 100 = 3.4%
1998-1999
1997-1998
1996-1997
1995-1996
1994-1995
1993-1994
1992-1993
1991-1992
1990-1991

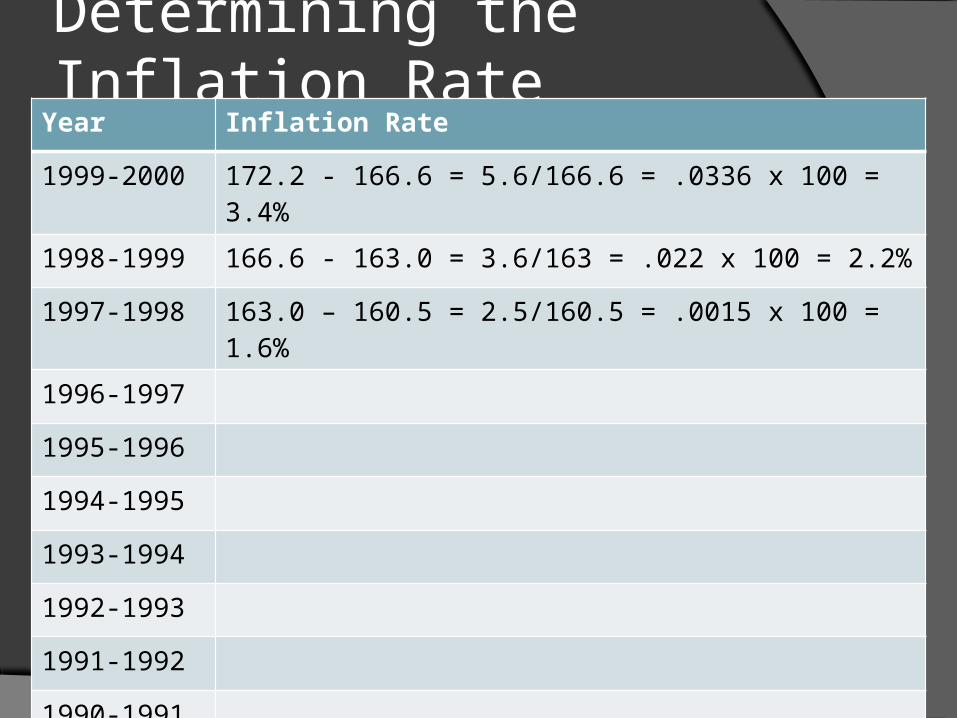
Determining the Inflation Rate
Year Inflation Rate
1999-2000 172.2 - 166.6 = 5.6/166.6 = .0336 x 100 = 3.4%
1998-1999 166.6 - 163.0 = 3.6/163 = .022 x 100 = 2.2%
1997-1998
1996-1997
1995-1996
1994-1995
1993-1994
1992-1993
1991-1992
1990-1991
Determining the Inflation Rate
Year Inflation Rate
1999-2000 172.2 - 166.6 = 5.6/166.6 = .0336 x 100 = 3.4%
1998-1999 166.6 - 163.0 = 3.6/163 = .022 x 100 = 2.2%
1997-1998 163.0 – 160.5 = 2.5/160.5 = .0015 x 100 = 1.6%
1996-1997
1995-1996
1994-1995
1993-1994
1992-1993
1991-1992
1990-1991
1.
2.
3.
4.
Due TodayChapter 24
1. Market Basket to Consumer Price Index (Determining CPI/Inflation Rate)
2. Chapter 24 Mankiw Practice Review
3. The Effects of Inflation
4. Daily Tens
5. Notes
6. Terms (ch. 24)
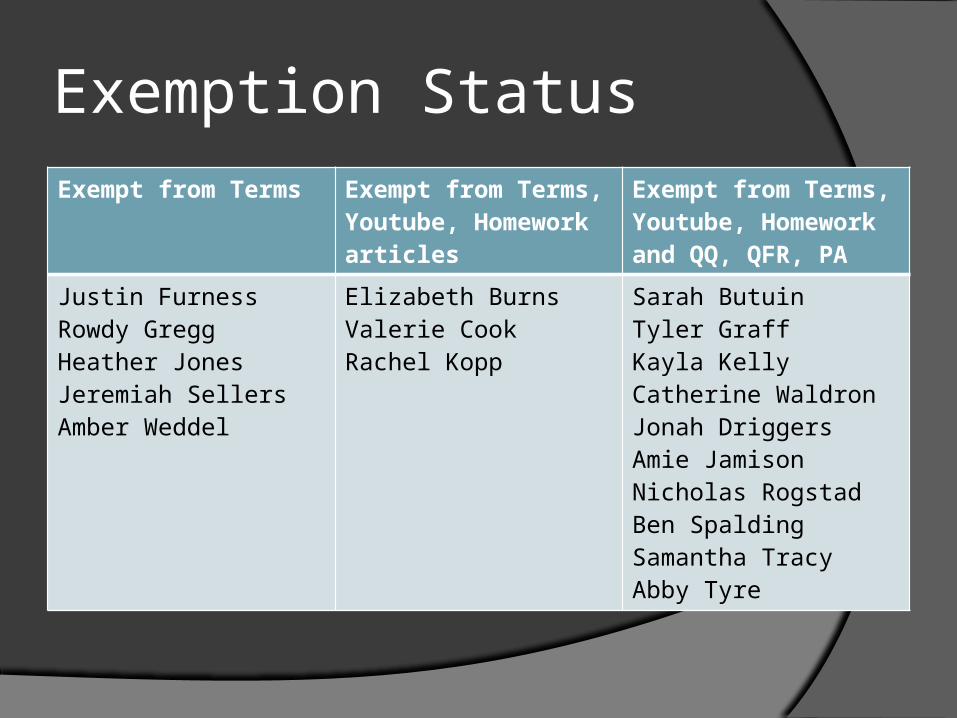
Exemption StatusExempt from Terms Exempt from Terms,
Youtube, Homework articles
Exempt from Terms, Youtube, Homework and QQ, QFR, PA
Justin FurnessRowdy GreggHeather JonesJeremiah SellersAmber Weddel
Elizabeth BurnsValerie CookRachel Kopp
Sarah ButuinTyler GraffKayla KellyCatherine WaldronJonah DriggersAmie JamisonNicholas RogstadBen SpaldingSamantha TracyAbby Tyre