Embed Size (px)
Citation preview

1
St. Louis RegionAir Quality Report
EWGCOG Staff Report
August 12, 2008

2
St. Louis Air Quality History
Clean air act amendments of 1990
Moderate ozone non-attainment area
2002 – attained 1-hour ozone standard
2004 – designated as moderate 8-hour ozone non-attainment area
2005 – designated as fine particle (PM2.5) non-attainment area
2008 – revised 8-hour ozone standard enacted
3
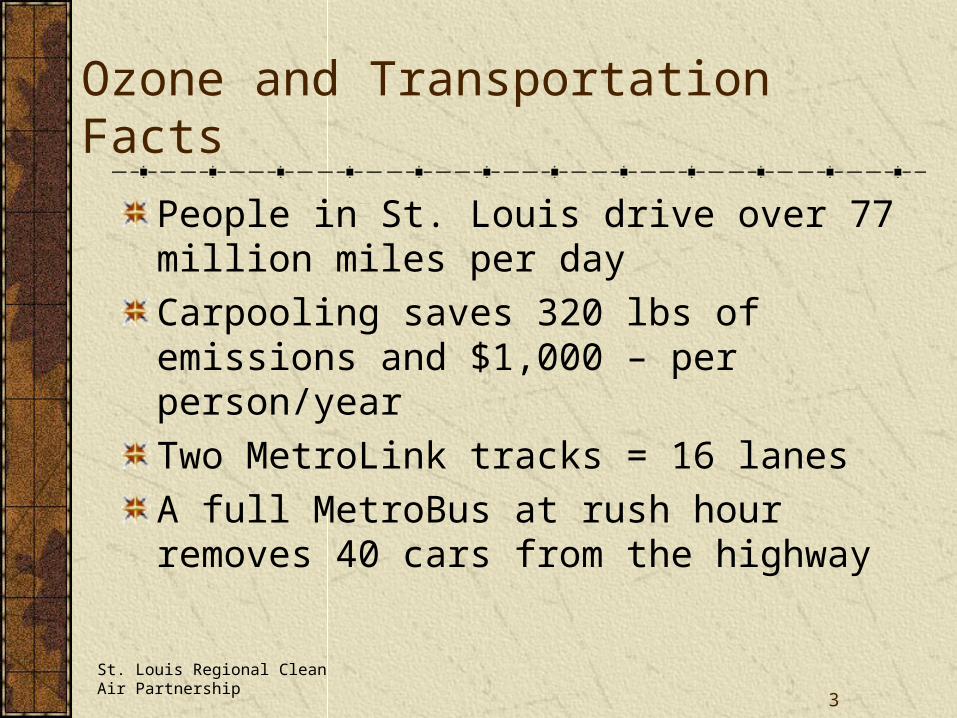
Ozone and Transportation Facts
People in St. Louis drive over 77 million miles per day
Carpooling saves 320 lbs of emissions and $1,000 – per person/year
Two MetroLink tracks = 16 lanes
A full MetroBus at rush hour removes 40 cars from the highway
St. Louis Regional Clean Air Partnership

4
How Ozone Is Formed

5
Four Sources of Volatile Organic Compounds (VOC)
St. Louis Regional Clean Air Partnership

6
Health Effects of Ozone
Headaches, fatigue, shortness of breath, coughing, wheezing
Irritates eyes, nose and respiratory track
Aggravates chronic heart disease and chronic respiratory ailments
Decreases resistance to infection
Triggers asthma attacks

7
1997 8-Hour Ozone Standard
Set in 1997, went into effect in 2004
Standard is 80 parts per billion (ppb) averaged over an 8 hour period
Rounding allows for values up to 84 ppb

8

9
Review of Ozone Standard
More recent science shows 1997 standard is not adequate to protect public healthUSEPA staff and Clean Air Science Advisory Committee reviewed information and made recommendations to USEPA AdministratorMarch 12, 2008 Final Rule signed

10
2008 Ozone Standard
Primary health-based standard set at 75 ppb
No rounding
Form of standard remains the same
Violation is when 3 year average is > 76 ppb

11
Revised Standard Milestones
Actions Dates
USEPA Administrator signs final rule March 12, 2008
Effective date of final rule (60 days after publication in the Federal Register)
~ June 2008
States provide recommendations on designations to USEPA
March 2009
(using 2006-2008 data)
Final designations by USEPA ~ March 2010
Effective date of designations ~ 2010
SIPS due ~ 2013
Attainment dates 2013-2030 depending upon the severity of the problem

12
Fine Particles or PM2.5
PM is a mix of solid particles and liquid droplets suspended in the air
Fine PM is less than or equal to 2.5 microns in diameter (1/30 the width of a human hair)
Made up of a number of components
Can be emitted directly
Can be chemically formed

13
Fine Particles or PM2.5 Sources
Smoke from fires
Power plants
Industrial activities
Vehicle exhaust

14

15
Important Dates
June 15, 2007 – 8-hour ozone SIPs submitted to USEPA
April 5, 2008 – PM2.5 SIPs were to be submitted to USEPA
June 15, 2010 – area to attain 8-hour ozone standard
April 5, 2010 – area to attain PM2.5 standard

16
Gateway’s Air Quality Planning Activities
Facilitate SIP process for ozone and PM2.5
Coordinate the AQAC
Prepare air quality conformity determinationCoordinate the IACG
Ozone data sharing project
Special projects

17
Ozone Data Sharing Project
Ozone season is April 1 – October 31
EWGCOG acts as clearinghouse for 1-hour and 8-hour data provided by MoDNR and IEPA
Initial quality assurance screening

18
19
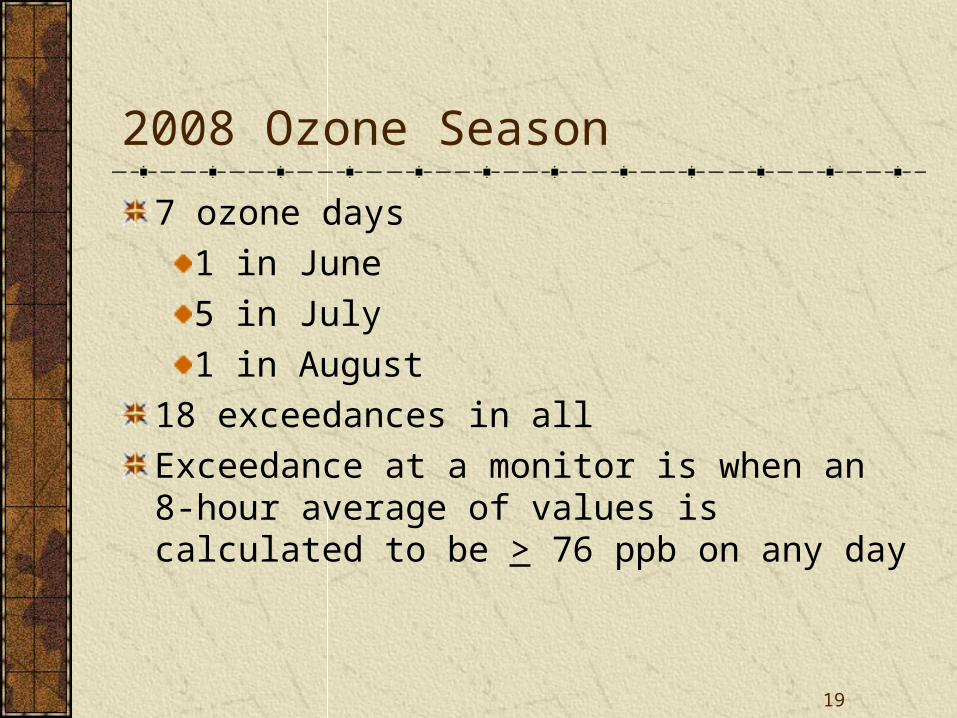
2008 Ozone Season
7 ozone days
1 in June
5 in July
1 in August
18 exceedances in all
Exceedance at a monitor is when an 8-hour average of values is calculated to be > 76 ppb on any day

20
Monitors in Violation of 8-hr Ozone Standard (2006 – August 11, 2008)
West Alton
Orchard Farm
Maryland Heights
Sunset Hills
Pacific
Blair St. (City)
Margaretta (City)
Wood River
Maryville
Alton
Data still to be validated by States
Violation is determined by taking a 3 year average of the 4 th highest annual maximum average by monitor and having average be > 76 ppb.
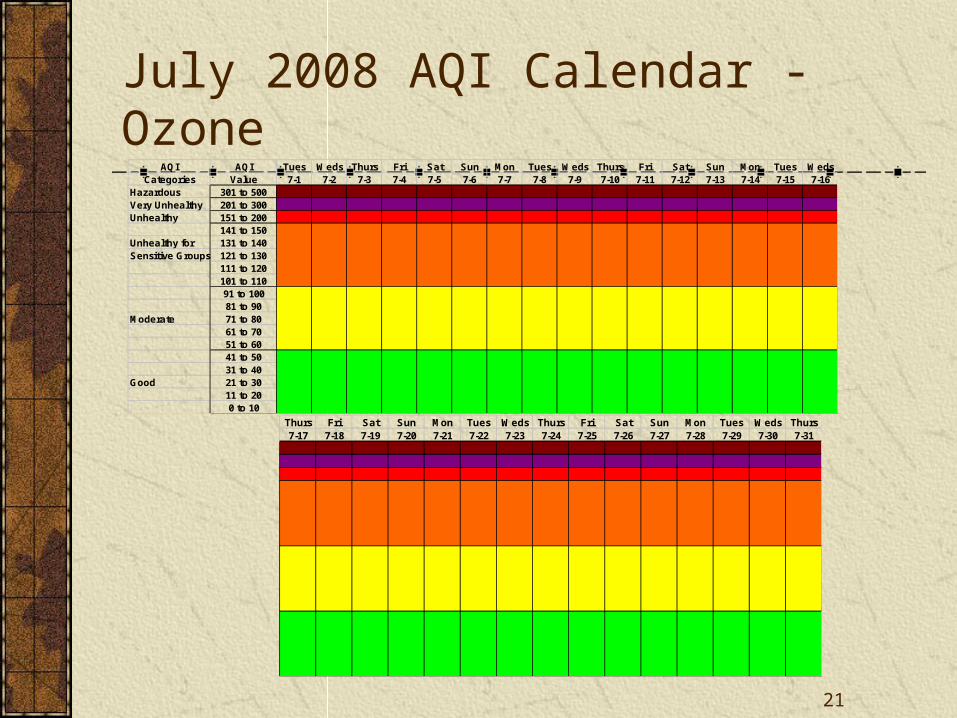
21
July 2008 AQI Calendar - OzoneAQI AQI Tues Weds Thurs Fri Sat Sun Mon Tues Weds Thurs Fri Sat Sun Mon Tues Weds
Categories Value 7-1 7-2 7-3 7-4 7-5 7-6 7-7 7-8 7-9 7-10 7-11 7-12 7-13 7-14 7-15 7-16Hazardous 301 to 500Very Unhealthy 201 to 300Unhealthy 151 to 200
141 to 150Unhealthy for 131 to 140Sensitive Groups 121 to 130
111 to 120101 to 11091 to 10081 to 90
Moderate 71 to 8061 to 7051 to 6041 to 5031 to 40
Good 21 to 3011 to 200 to 10
Thurs Fri Sat Sun Mon Tues Weds Thurs Fri Sat Sun Mon Tues Weds Thurs7-17 7-18 7-19 7-20 7-21 7-22 7-23 7-24 7-25 7-26 7-27 7-28 7-29 7-30 7-31

22
1-Hour Exceedances & MO Air Activities
010203040506070
84 86 88 90 92 94 96 98 '00
'02
'04
Years
# o
f Exce
edance
s
1984 – Basic I/M Test 1993 – Low RVP Gasoline (7.2 psi)
1988 – Stage II Vapor Recovery 1995 – Low RVP Gasoline (7.0 psi)
1990 – Computerized I/M Testing 1999 – Federal Reformulated Gasoline Program
1991 – Low RVP Gasoline (7.8 psi) 2000 – Centralized I/M Program
23
Things to Do to Reduce Ozone Levels
Set air conditioner no lower than 78o to conserve energyShare a ride or use mass transit; Bicycle or walk errands when possibleAvoid using oil- and solvent-based paints, degreasers or lighter fluidDefer use of gasoline-powered lawn and garden equipmentRefuel cars and trucks after dusk to reduce daytime pollution releasesCombine errands and reduce tripsLimit vehicle idling when possible

24
For Additional Information
On-line Air Quality Resource Center
www.ewgateway.org/environmental.aq/aq.htm