Embed Size (px)
Citation preview
1
SPR 667 – Assessment of Statewide Intersection Safety Performance
TAC Meeting August 31, 2009 2:00-3:30PM

Agenda
2
Item Length
Introductions and agenda [Joerger] 5
Meeting objectives [Joerger] 5
Review of Tasks [Research Team] 15
Summary of Progress [Research Team]
Revised Work Plan [if needed] [all]
50
15

Meeting Objectives
Research Objectives
• To quantify the safety performance of typical intersections – To assemble a statewide inventory of
intersections including location, geometry, control and volume data.
– To characterize by a variety of geometric, operational, and volume features the safety performance of typical intersections.
• This performance will include both statistical summaries and exploration of the applicability of predictive models.
4

Review of Tasks
1. Project Initiation – complete2. Literature Review – complete3. Data Assembly & Research Design – 90% complete4. Pilot Study – 85% complete5. Full Intersection Study – 20% complete6. Summary Data Analysis – 20% complete7. Develop Safety Performance Functions 8. Final Report
Budget: $122,516Encumbered: $42,086 (34%)Balance: $80,430
5

Background
• Nearly 21% U.S. fatalities were identified as intersection or intersection-related (2007)
• ITE estimates 50% of all reported crashes occurred at intersections– 55% of injury crashes – 48% of property-damage crashes.
• Oregon (2007) intersection crashes accounted for 38% of total– 18% of fatal crashes– 39% of injury crashes
6

Literature Review
• PART 1– A summary of individual geometric, operation,
traffic control, and other features
• PART 2– Statistical summaries– Methods for pattern diagnostics – Modeling the safety performance at
intersections.
7
PART 1Sources for Intersection Elements• Harwood et al. “Safety Effectiveness of
Intersection Left- and Right- Turn Lanes”• Model Minimum Inventory of Roadway
Elements (MMIRE)• Highway Safety Manual (HSM) Draft 3.1• Elvik and Vaa “Handbook of Road Safety
Measures”• Other research• List is not exhaustive
8

Geometric Elements Traffic Control and Operational FeaturesType of Intersection Type of Traffic ControlRoundabouts Uncontrolled
Number of Circulating Lanes in Roundabout Yield-Controlled Island Diameter of Roundabout STOP-Controlled Sight Obstructions in Roundabout Traffic Signal Controlled Number of Approach Lanes Signal Timing Approach Width All Red Clearance Interval
Number of Approach Lanes Yellow Clearance Interval Approach Lane Width Type of Left-Turn Phasing
Vertical Alignment Right-Turn Arrow OverlapHorizontal Alignment Lead or Lag Left-TurnLeft-Turn Lanes Turn Prohibitions
Type of Left-Turn Treatment Right-Turn on Red Length of Left-Turn Lanes Left-Turn Prohibitions Taper Rate U-Turn Prohibitions Offset Left-Turn Lanes Advance Warning Signs
Right-Turn Lanes Lighting Type of Right-Turn Treatment Red-Light Camera Enforcement Length of Right-Turn Lanes Pavement Friction
Curb Return Radius Pavement Marking ConditionsIntersection Skew Presence of Trans. Rumble StripsIntersection Sight Distance Traffic CharacteristicsMedian Type Average Annual Daily Traffic
Median Width Peak Hour Approach VolumesFixed Objects Turning Movement VolumesPresence of At-Grade Rail Crossing Traffic Comp. (Percent Trucks)Presence of Driveways Average Approach SpeedPresence of On-Street Parking Bicycle VolumesPresence of Sidewalks Pedestrian VolumesPedestrian Crossing Features Other
Max No. of Lanes crossed by Pedestrians Weather Dist from Approach Stop Bar to Ped Cross Land-Use Characteristics Width of Pedestrian Refuge Urban and Rural Curb Extension Presence of a Bicycle Lane
9

PART 2Statistical Summaries (Crash Rates)Study State Number of
IntersectionsNumber of Crashes
Number of Years
Knapp and Campbell, 2005
Wisconsin 1,700 33,000 3
Green and Agent, 2003
Kentucky 7,097 18,778 3
Hanna et al, 1976
Virginia 300 2,300 2
Bonn, 1994 Oregon 413 ? 3
Iowa DOT, 1989 Iowa 3,416 ? 5
Cotrell and Mu, 2005
Utah ? ? 10, 3
Pant and Nagaraju, 2007
Ohio 1,104 ? 3
10

Geometric Elements Traffic Control and Operational FeaturesType of Intersection Type of Traffic ControlRoundabouts Uncontrolled
Number of Circulating Lanes in Roundabout Yield-Controlled Island Diameter of Roundabout STOP-Controlled Sight Obstructions in Roundabout Traffic Signal Controlled Number of Approach Lanes Signal Timing Approach Width All Red Clearance Interval
Number of Approach Lanes Yellow Clearance Interval Approach Lane Width Type of Left-Turn Phasing
Vertical Alignment Right-Turn Arrow OverlapHorizontal Alignment Lead or Lag Left-TurnLeft-Turn Lanes Turn Prohibitions
Type of Left-Turn Treatment Right-Turn on Red Length of Left-Turn Lanes Left-Turn Prohibitions Taper Rate U-Turn Prohibitions Offset Left-Turn Lanes Advance Warning Signs
Right-Turn Lanes Lighting Type of Right-Turn Treatment Red-Light Camera Enforcement Length of Right-Turn Lanes Pavement Friction
Curb Return Radius Pavement Marking ConditionsIntersection Skew Presence of Trans. Rumble StripsIntersection Sight Distance Traffic CharacteristicsMedian Type Average Annual Daily Traffic
Median Width Peak Hour Approach VolumesFixed Objects Turning Movement VolumesPresence of At-Grade Rail Crossing Traffic Comp. (Percent Trucks)Presence of Driveways Average Approach SpeedPresence of On-Street Parking Bicycle VolumesPresence of Sidewalks Pedestrian VolumesPedestrian Crossing Features Other
Max No. of Lanes crossed by Pedestrians Weather Dist from Approach Stop Bar to Ped Cross Land-Use Characteristics Width of Pedestrian Refuge Urban and Rural Curb Extension Presence of a Bicycle Lane
11
District or region
Functional class
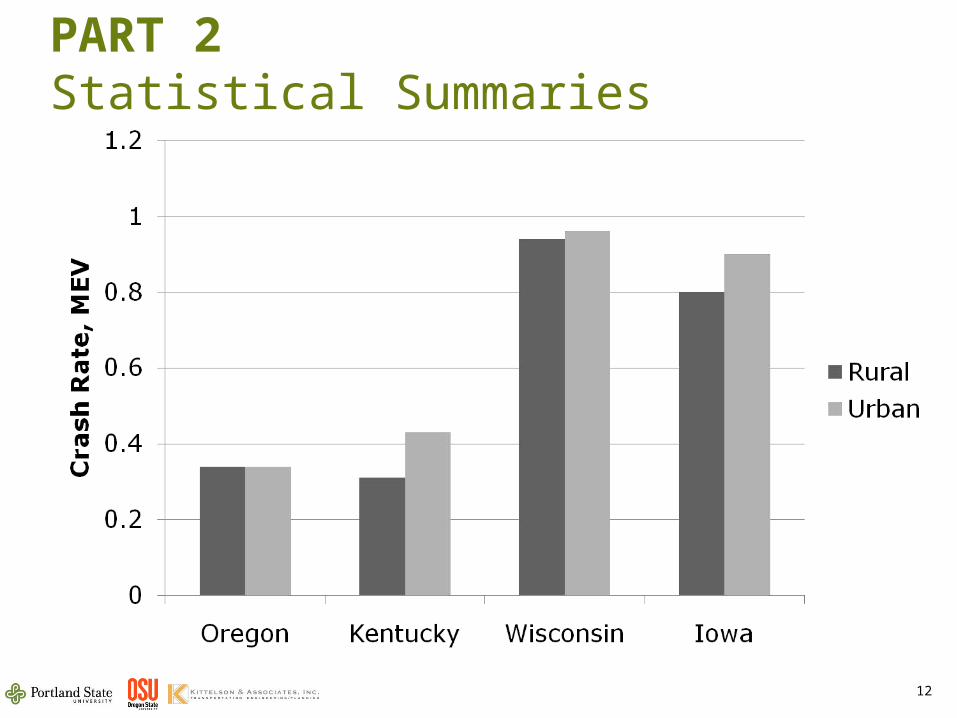
PART 2Statistical Summaries
12

PART 2 Pattern Diagnostics and Proportions
• Excess proportions– HSM/Safety Analyst
• Direct diagnostics– Comparisons of
individual crash type proportions to all others
13

PART 2 Safety Prediction Methods• Regression models
– Negative Binomial models– Tree-based regression– Probit models
• Urban – rural• Intersection type• Severity or crash type• Volumes significant in all models
14

Literature Review Conclusions
• Identified a long list of potential intersection elements
• Crash rates varied considerably from state-to-state • Most summaries aggregated at relatively high level• Interestingly, all summaries used total crashes and
did not develop separate injury rates or rates by any other crash category or causation. – Roundabouts were not included as separate category– Pedestrian or bicycle elements were also absent.
• All of the summaries are “snapshots” in time and do not appear to routinely updated.
15

Literature Review Conclusions
• Summarizing the crash data in terms of typical diagnostics appears to be very valuable effort.
• Data requirements for predictive models are significant and a primary reason why there has been limited development.
• The relationship of intersection characteristics with crash frequency, crash severity, and particular crash types is complex.
• In nearly every model, volumes were a significant variable.
16

Data Assembly • ODOT CAR Code Setup Book
– State highway system intersections (9,139)– Other system (143,186)
• ODOT Crash Data System (via OrTSDA)• ODOT Digital Video Log (DVL)• ODOT Integrated Transportation Information
System (ITIS)• Google Earth / GIS Files• Counts
– Traffic counting firms– City/County Engineering & Planning Offices– PORTAL, Google Traffic
17

Intersection Crash Data
• State Highway– Highway and milepost
• City– Intersecting street numbers
• County– Either mileposted or intersecting street numbers
18
Intersection Possible Intersection-related

ODOT CAR Code Setup Book
19

CAR Setup Book
Traffic ControlHighway System Intersections
Non-Highway System
All SystemPercent of Total
Uncontrolled 6 32 38 0.2%
Signal-controlled 1,759 4,281 6,040 32.6%
Flashing beacon, red
7 34 41 0.2%
Flashing beacon, amber
20 24 44 0.2%
Stop-controlled 1,715 9,624 11,339 61.2%
Yield-controlled 3 24 27 0.1%
One way street 730 261 991 5.3%
Total 4,240 14,290 18,530
20
Remaining records “NULL” traffic control
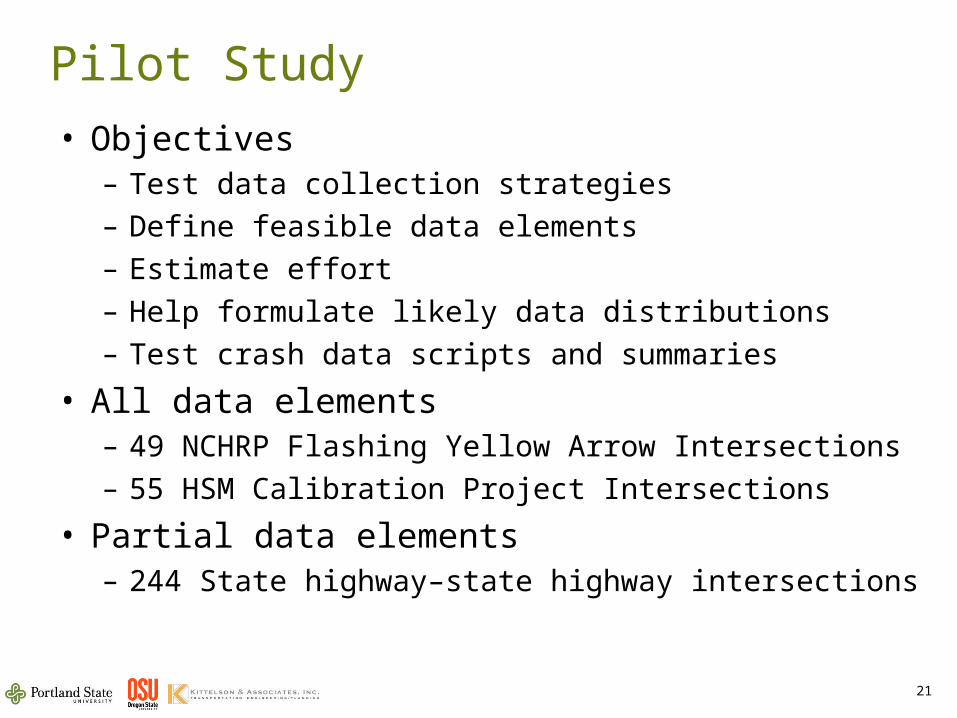
Pilot Study
• Objectives– Test data collection strategies– Define feasible data elements– Estimate effort– Help formulate likely data distributions– Test crash data scripts and summaries
• All data elements– 49 NCHRP Flashing Yellow Arrow Intersections– 55 HSM Calibration Project Intersections
• Partial data elements– 244 State highway–state highway intersections
21

Google Earth Map of Intersections
22

23
24
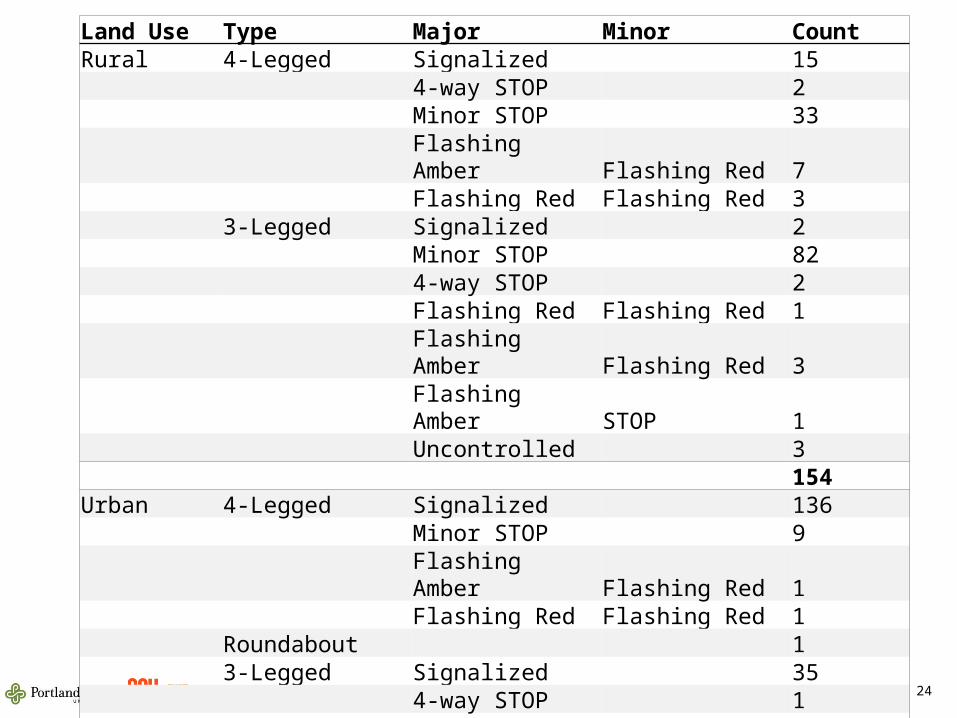
Land Use Type Major Minor CountRural 4-Legged Signalized 15 4-way STOP 2 Minor STOP 33 Flashing Amber Flashing Red 7 Flashing Red Flashing Red 3 3-Legged Signalized 2 Minor STOP 82 4-way STOP 2 Flashing Red Flashing Red 1 Flashing Amber Flashing Red 3 Flashing Amber STOP 1 Uncontrolled 3 154Urban 4-Legged Signalized 136 Minor STOP 9 Flashing Amber Flashing Red 1 Flashing Red Flashing Red 1 Roundabout 1 3-Legged Signalized 35 4-way STOP 1 Minor STOP 8 Minor YIELD 1 193

Data Collection Form
25

Data Collection: Google Earth Google Earth can
provide an aerial view of:-Intersection Type-Turning Lanes-Parking-Channelization-Lat/Long Coord.-Urban/Rural-Bicycle Facilities-Ped. Facilities-Measurements-Length, Width

Data Collection• Resolution is an issue in rural areas when
making measurements.
John Day:US 26 (005) and US 395 (048)

Digital Video Log
• ODOT’s Digital Video Log provides street level views which can be used to identify:– Signalization -Intersections (ex: S = 3 = S)– # of Turning Legs -Medians and Channelization
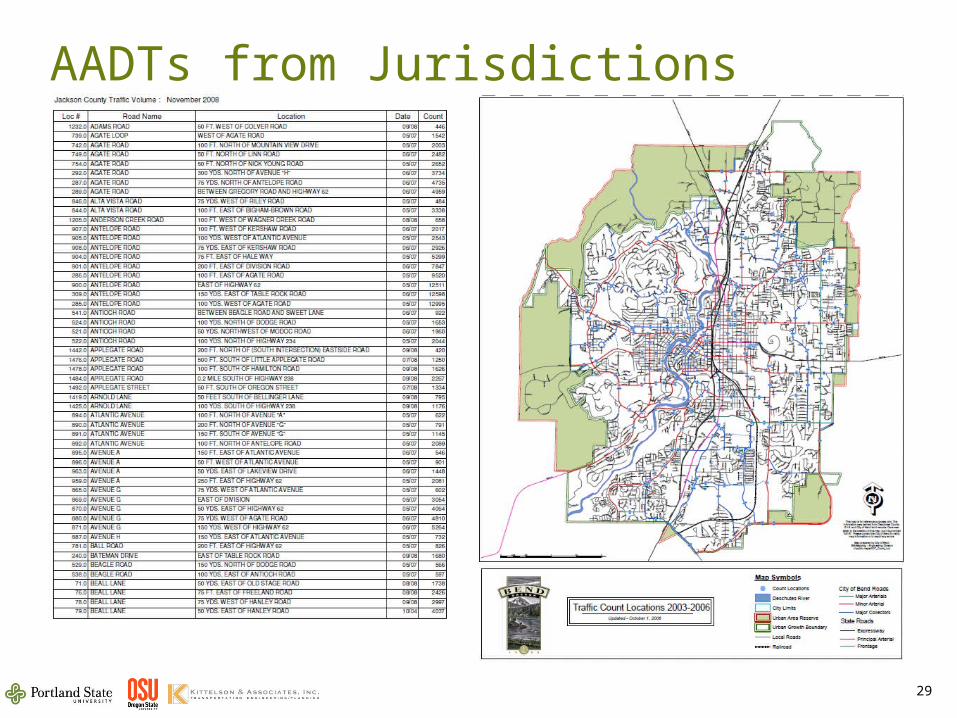
AADTs from Jurisdictions
29
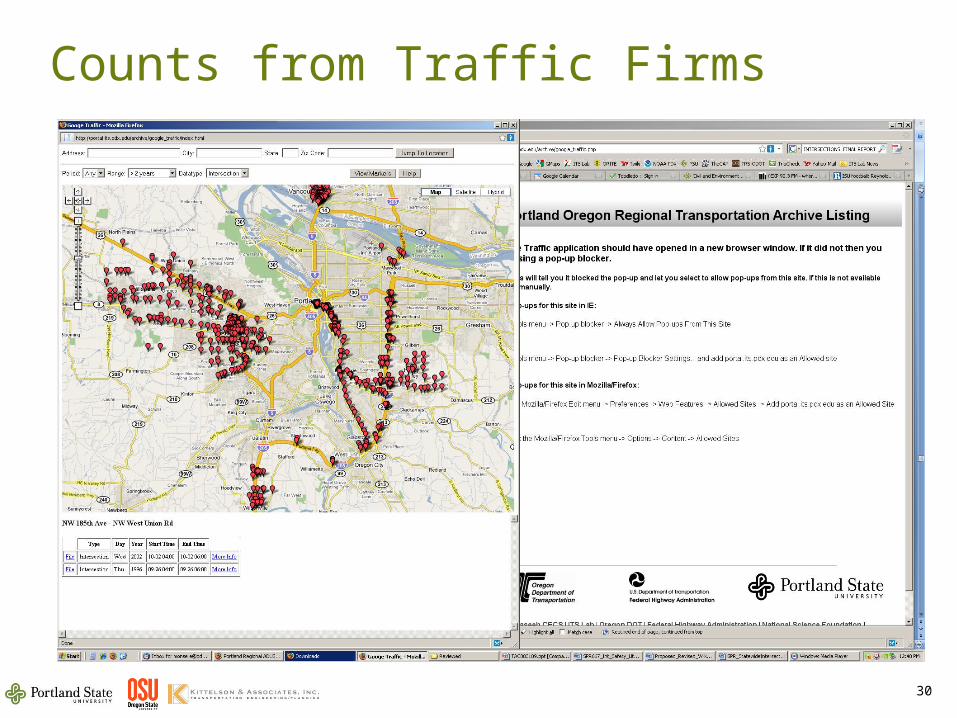
Counts from Traffic Firms
30

Variable Summary (N=104)
31
4-Le
gged
Cro
ss
T 3
-Leg
ged
Y 3
-Leg
ged
INT_TYPE
0
10
20
30
40
0 20 40 60 80 100
1
2
3
4
5
MAJ_APPRO_LANE_NUM
0 20 40 60 80 100
10
12
14
16
18
20
22
MAJ_APPRO_LANE_WIDTH
0 20 40 60 80 100
0.0
0.5
1.0
1.5
2.0
2.5
3.0
MAJ_LEFT_TURN_NUM_NE
0 20 40 60 80 100
0
50
100
150
200
250
300
MAJ_LEFT_TURN_LENGTH_NE
0 20 40 60 80 100
0.0
0.2
0.4
0.6
0.8
1.0
MAJ_LEFT_TURN_NUM_SW
0 20 40 60 80 100
0
100
200
300
400MAJ_LEFT_TURN_LENGTH_SW
0 20 40 60 80 100
0
20
40
60
80
SKEW
0 20 40 60 80 100
0
2
4
6
8
MAJ_SIDEWALK_WIDTH
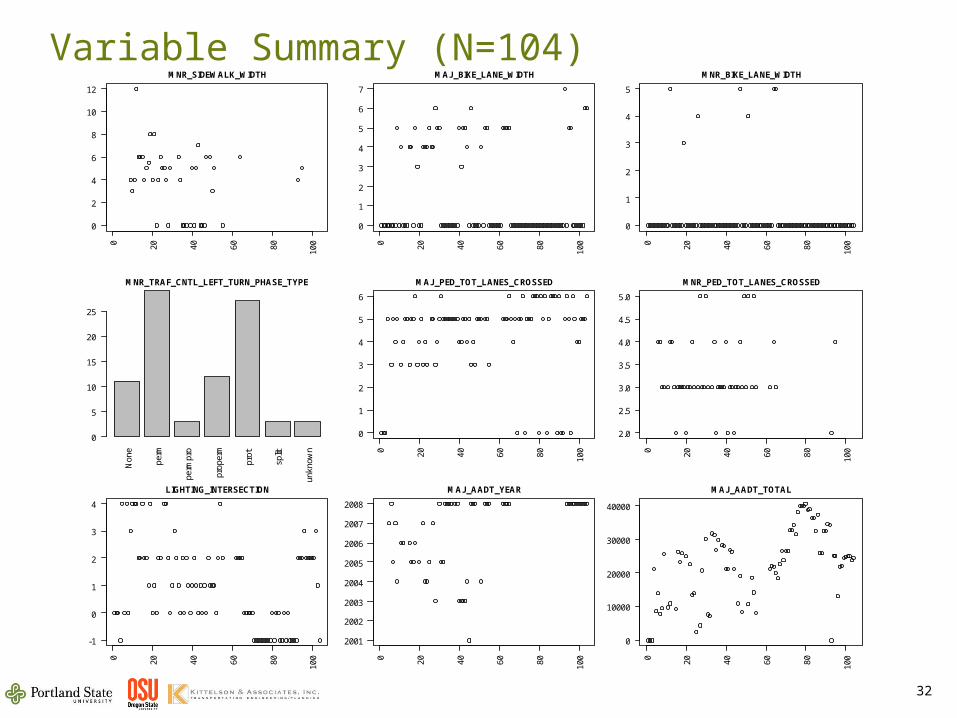
Variable Summary (N=104)
32
0 20 40 60 80 100
0
2
4
6
8
10
12
MNR_SIDEWALK_WIDTH
0 20 40 60 80 100
0
1
2
3
4
5
6
7
MAJ_BIKE_LANE_WIDTH
0 20 40 60 80 100
0
1
2
3
4
5
MNR_BIKE_LANE_WIDTH
Non
e
perm
perm
pro
prop
erm
prot
split
unkn
own
MNR_TRAF_CNTL_LEFT_TURN_PHASE_TYPE
0
5
10
15
20
25
0 20 40 60 80 100
0
1
2
3
4
5
6
MAJ_PED_TOT_LANES_CROSSED
0 20 40 60 80 100
2.0
2.5
3.0
3.5
4.0
4.5
5.0
MNR_PED_TOT_LANES_CROSSED
0 20 40 60 80 100
-1
0
1
2
3
4
LIGHTING_INTERSECTION
0 20 40 60 80 100
2001
2002
2003
2004
2005
2006
2007
2008
MAJ_AADT_YEAR
0 20 40 60 80 100
0
10000
20000
30000
40000
MAJ_AADT_TOTAL

Crash Frequency (N=347)
33
Intersection Characteristic
Number of Intersections
in Sample
Percentage of Total
Intersections
Number of Crashes
2 year total Percentage of Total Crashes
Area Type Urban 193 56% 1572 89% Rural 154 44% 188 11% Traffic Control Signalized 187 55% 1554 89% 4-Way Stop 10 3% 20 1% Minor Stop 143 42% 169 10% Minor Yield 2 1% 13 6% Uncontrolled 4 3% 4 2% Average Annual Entering Volumes (AADT) – Vehicles (2007 Counts) < 10,000 115 45% 89 8% 10,000 <= x <= 20,000 68 27% 212 20% > 20,000 71 28% 780 72%
DR
AF
T-D
RA
FT
– D
RA
FT
– D
RA
FT
- D
RA
FT
- D
RA
FT

Crash Rates (N=254)
34
Intersection Characteristic
Crash Rate (per million entering vehicles)
Max Crash Rate in Sample Std Dev
Area Type Urban 0.424 2.35 0.447 Rural 0.303 4.13 0.640 Traffic Control Signalized 0.427 2.35 0.456 4-Way Stop 0.215 0.21 0.295 Minor-Stop 0.327 0.33 0.664Minor Yield Small Sample Size - - Uncontrolled Small Sample Size - - Average Annual Entering Volumes (AADT) - Vehicles < 10,000 0.321 4.13 0.710 10,000 <= x <= 20,000 0.282 1.32 0.284 > 20,000 0.481 2.35 0.493 DR
AF
T-D
RA
FT
– D
RA
FT
– D
RA
FT
- D
RA
FT
- D
RA
FT

Crash Patterns
35
DR
AF
T-D
RA
FT
– D
RA
FT
– D
RA
FT
- D
RA
FT
- D
RA
FT

Crash Patterns By Vehicle Movement
36

Draft Results from Pilot Study
• Many elements probably not needed for summaries / patterns
• Crash script developed– Refining / testing in Access database– Quality control checks needed
• Traffic volumes – Hardest to get (off state system)– Time challenge (year of data collection)– Still some other avenues to pursue
• Signal timing• Need to study appropriate aggregations
37
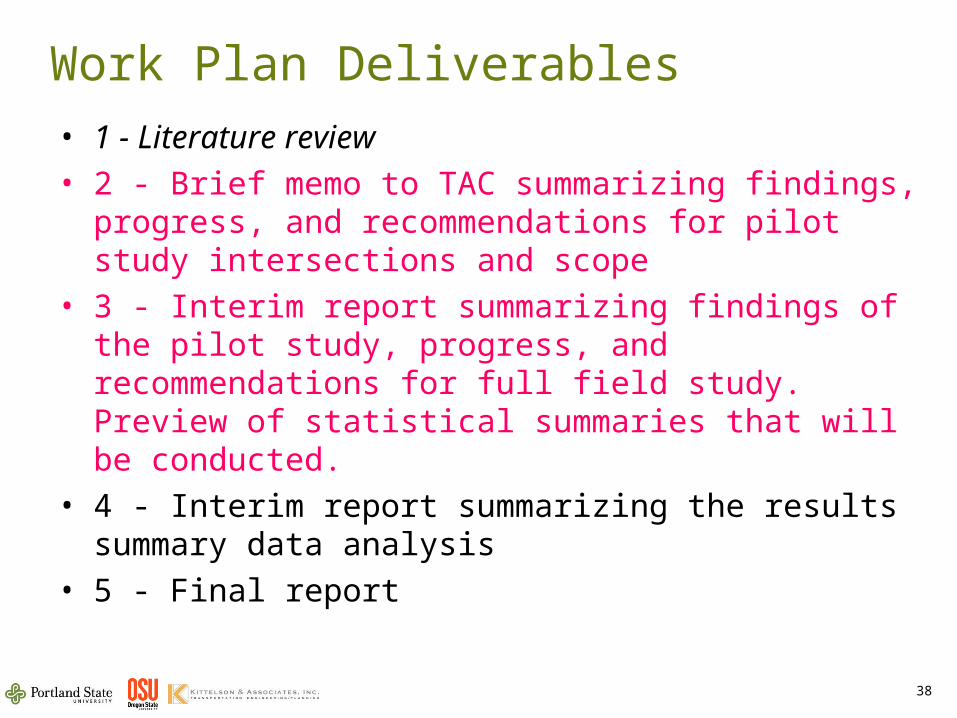
Work Plan Deliverables• 1 - Literature review• 2 - Brief memo to TAC summarizing findings,
progress, and recommendations for pilot study intersections and scope
• 3 - Interim report summarizing findings of the pilot study, progress, and recommendations for full field study. Preview of statistical summaries that will be conducted.
• 4 - Interim report summarizing the results summary data analysis
• 5 - Final report
38

Revised Work Plan
• Discussion
39


![TITLE 310. OKLAHOMA STATE DEPARTMENT OF HEALTH CHAPTER 667 ... NRI... · 310:667-49-21. General stores [REVOKED] 310:667-49-22. Linen services [REVOKED] 310:667-49-23. Facilities](https://img.pdfslide.us/doc/110x75/5f0ca20e7e708231d4365f88/title-310-oklahoma-state-department-of-health-chapter-667-nri-310667-49-21.jpg)