Embed Size (px)
Citation preview
1
SOFTWARE PROCESS AND PROJECT METRICS
2
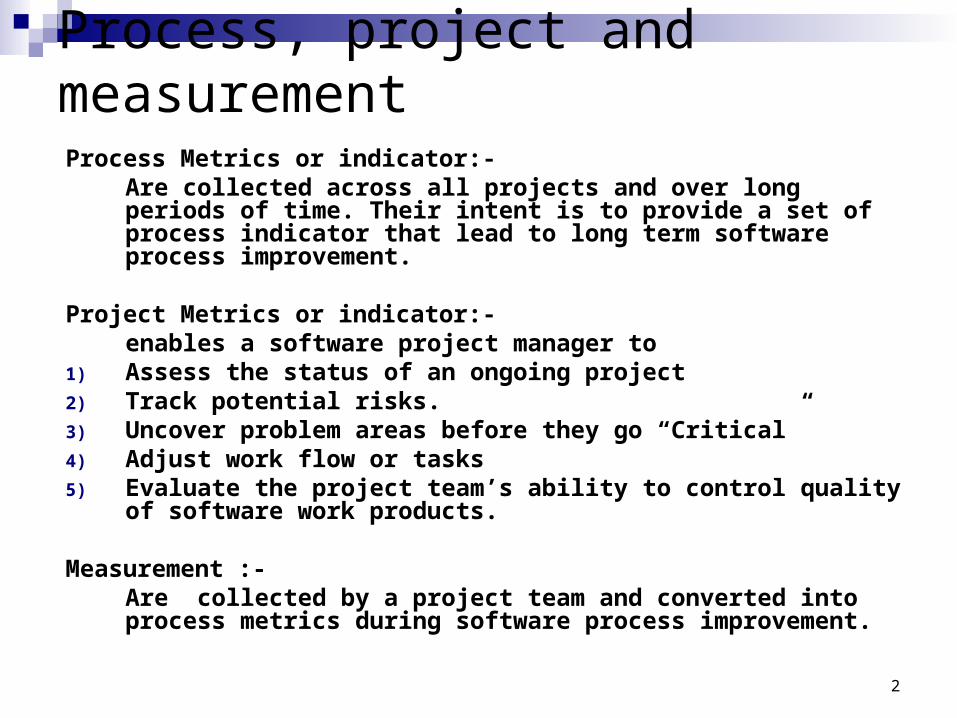
Process, project and measurementProcess Metrics or indicator:-
Are collected across all projects and over long periods of time. Their intent is to provide a set of process indicator that lead to long term software process improvement.
Project Metrics or indicator:-enables a software project manager to
1) Assess the status of an ongoing project2) Track potential risks.3) Uncover problem areas before they go “Critical”4) Adjust work flow or tasks5) Evaluate the project team’s ability to control quality of software
work products.
Measurement :- Are collected by a project team and converted into process metrics during software process improvement.
3
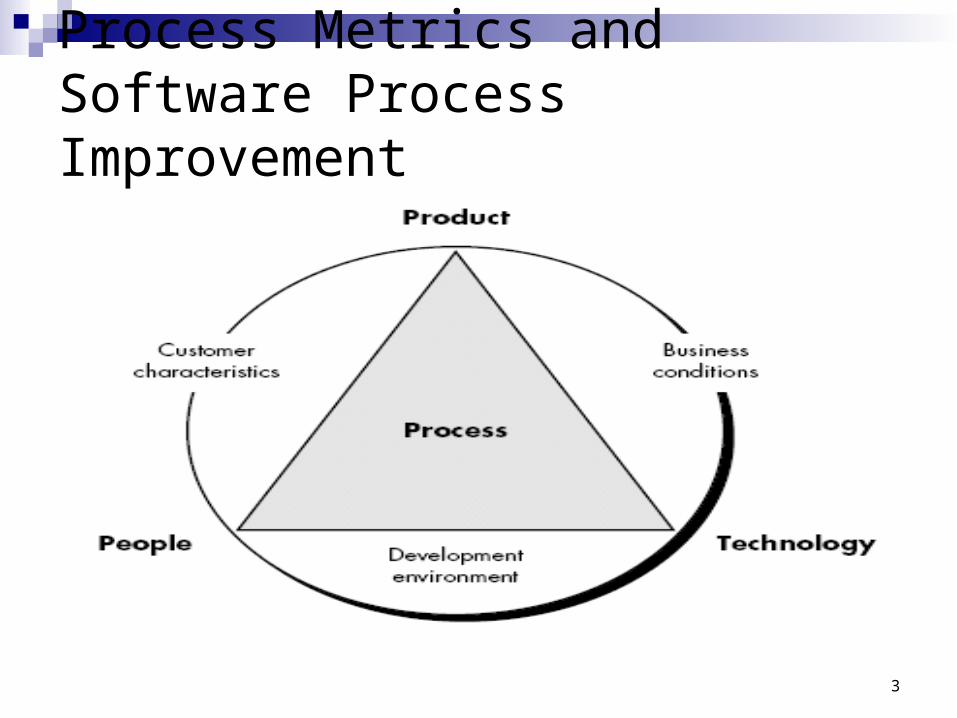
Process Metrics and Software Process Improvement
4
Process Metrics and Software Process Improvement
Process at the center connecting 3 factors that have a profound influence on software quality and organizational performance.
The skill and motivation of people has been shown to be the single most influential factor in quality and performance.
The complexity of the product can have a substantial impact on quality and team performance.
The technology that populate the process also has an impact.
5
Process triangle exists within a circle of environmental conditions that include the development environment, business conditions and customer characteristics.
To measure the efficacy of a software process indirectly. From set of metrics, need to derives outcomes. Outcomes include
measures of errors uncovered before release of the software
defects delivered to and reported by end-users work products delivered (productivity) human effort expended calendar time expended schedule conformance other measures.
6
Use common sense and organizational sensitivity when interpreting metrics data.
Provide regular feedback to the individuals and teams who collect measures and metrics.
Don’t use metrics to appraise individuals. Work with practitioners and teams to set clear goals and
metrics that will be used to achieve them. Never use metrics to threaten individuals or teams. Metrics data that indicate a problem area should not be
considered “negative.” These data are merely an indicator for process improvement.
Don’t obsess on a single metric to the exclusion of other important metrics.
Process Metrics Guidelines
7
Fish-bone diagram
The collection of process metrics is the driver for the creation of the fishbone diagram.
A completed fishbone diagram can be analyzed to derive that will enable a software organization to modify its process to reduce the frequency of errors and defects.
Statistical software process improvement (SSPI) approaches uses software failure analysis to collect information about all errors and defects encountered.
8
9
10
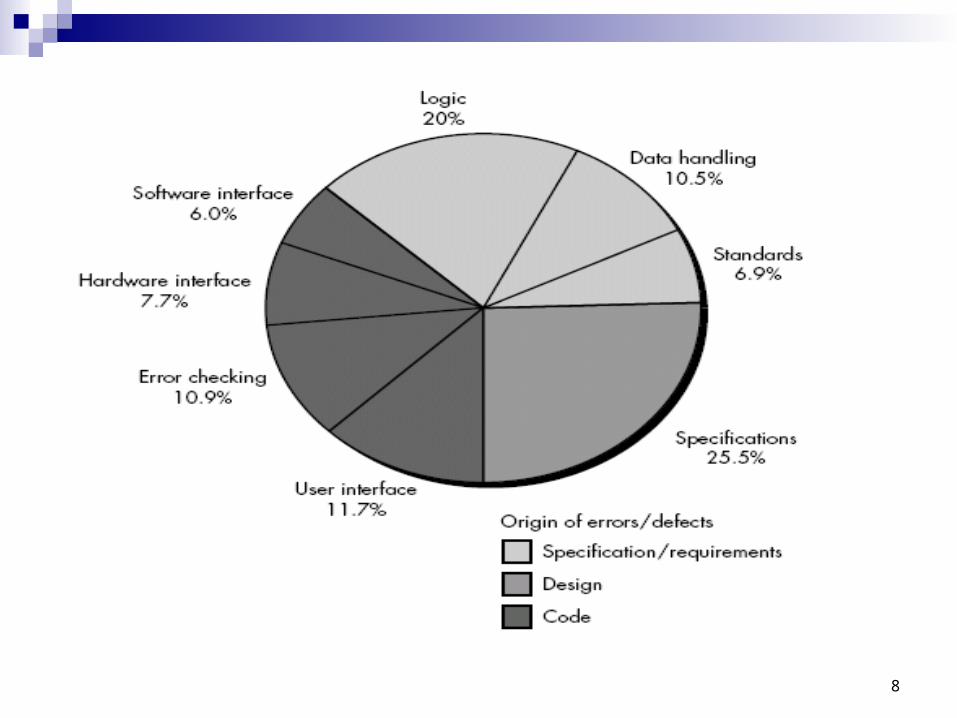
For the pie-chart noted in the figure, eight causes of defects and their origin (indicated by shading) are shown
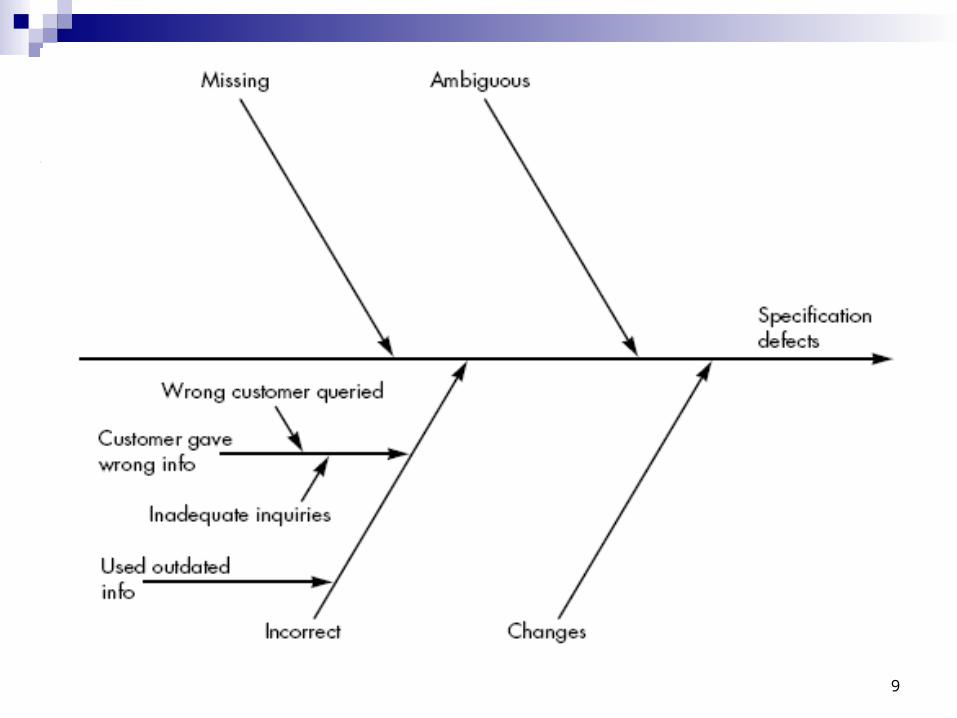
The development of a fishbone diagram, to help in diagnosing the data represented in the frequency diagram.
The spine of the diagram (the central line) represents the quality factor under consideration ((in this case specification defects)
Each of the ribs (diagonal lines) connecting to the spine indicate potential causes for the quality problem (e.g., missing requirements, ambiguous specification, incorrect requirements, changed requirements).
The spine and ribs notation is then added to each of the major ribs of the diagram to expand upon the cause noted.
Expansion is shown only for the incorrect cause in figure
11
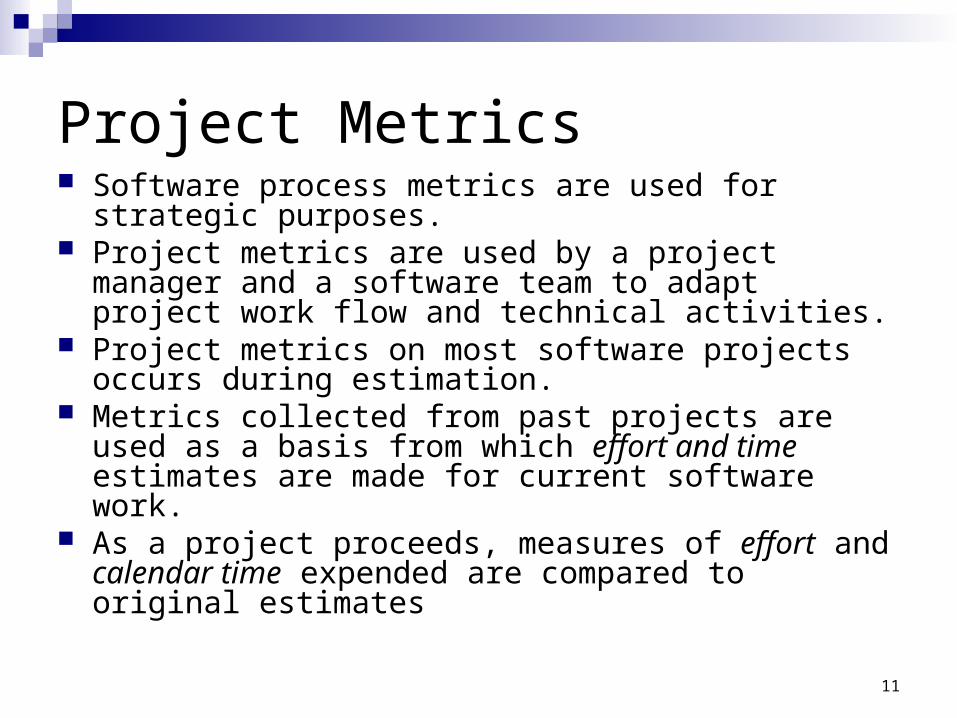
Project Metrics Software process metrics are used for strategic
purposes. Project metrics are used by a project manager and a
software team to adapt project work flow and technical activities.
Project metrics on most software projects occurs during estimation.
Metrics collected from past projects are used as a basis from which effort and time estimates are made for current software work.
As a project proceeds, measures of effort and calendar time expended are compared to original estimates
12
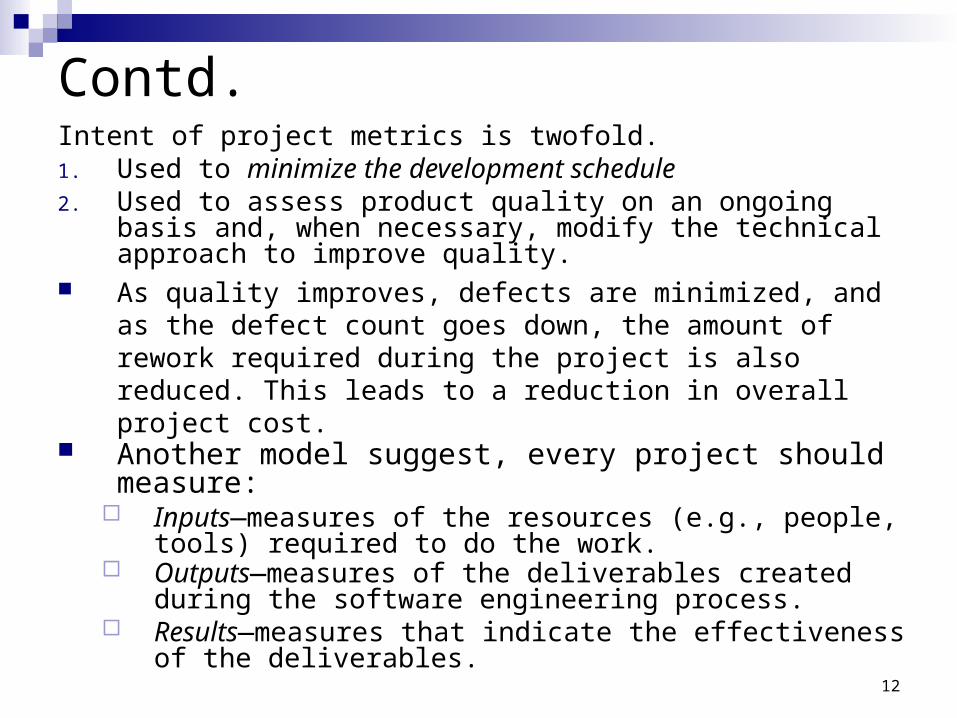
Contd.Intent of project metrics is twofold.1. Used to minimize the development schedule 2. Used to assess product quality on an ongoing basis and,
when necessary, modify the technical approach to improve quality.
As quality improves, defects are minimized, and as the defect count goes down, the amount of rework required during the project is also reduced. This leads to a reduction in overall project cost.
Another model suggest, every project should measure: Inputs—measures of the resources (e.g., people, tools)
required to do the work. Outputs—measures of the deliverables created during the
software engineering process. Results—measures that indicate the effectiveness of the
deliverables.
13
Software Measurement
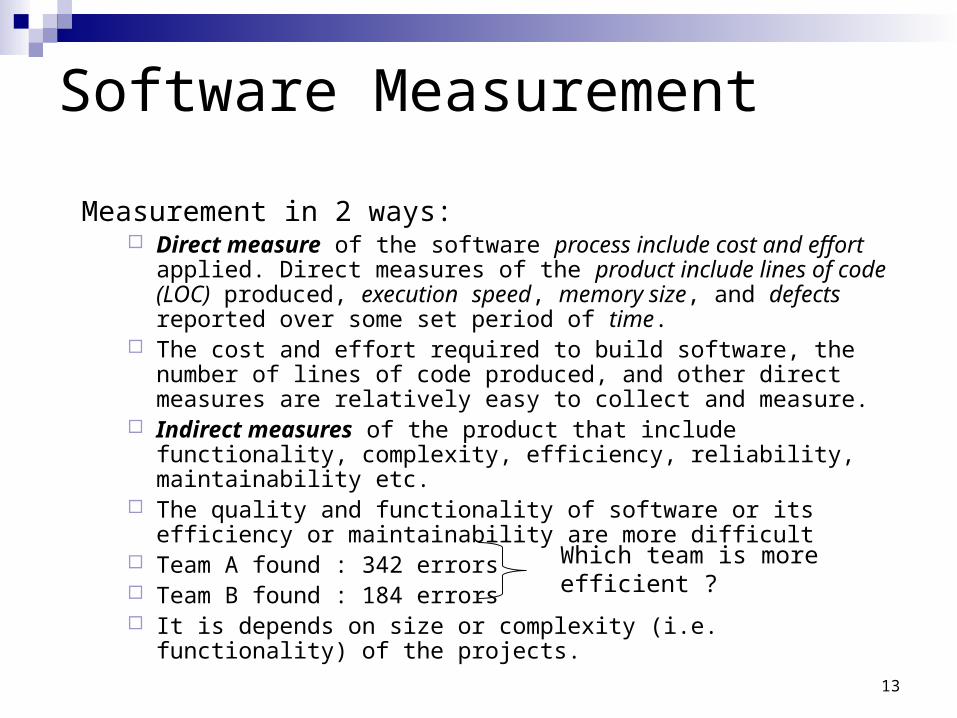
Measurement in 2 ways: Direct measure of the software process include cost and effort
applied. Direct measures of the product include lines of code (LOC) produced, execution speed, memory size, and defects reported over some set period of time.
The cost and effort required to build software, the number of lines of code produced, and other direct measures are relatively easy to collect and measure.
Indirect measures of the product that include functionality, complexity, efficiency, reliability, maintainability etc.
The quality and functionality of software or its efficiency or maintainability are more difficult
Team A found : 342 errors Team B found : 184 errors It is depends on size or complexity (i.e. functionality) of the projects.
Which team is more efficient ?
14
Size oriented metrics

15
Contd.
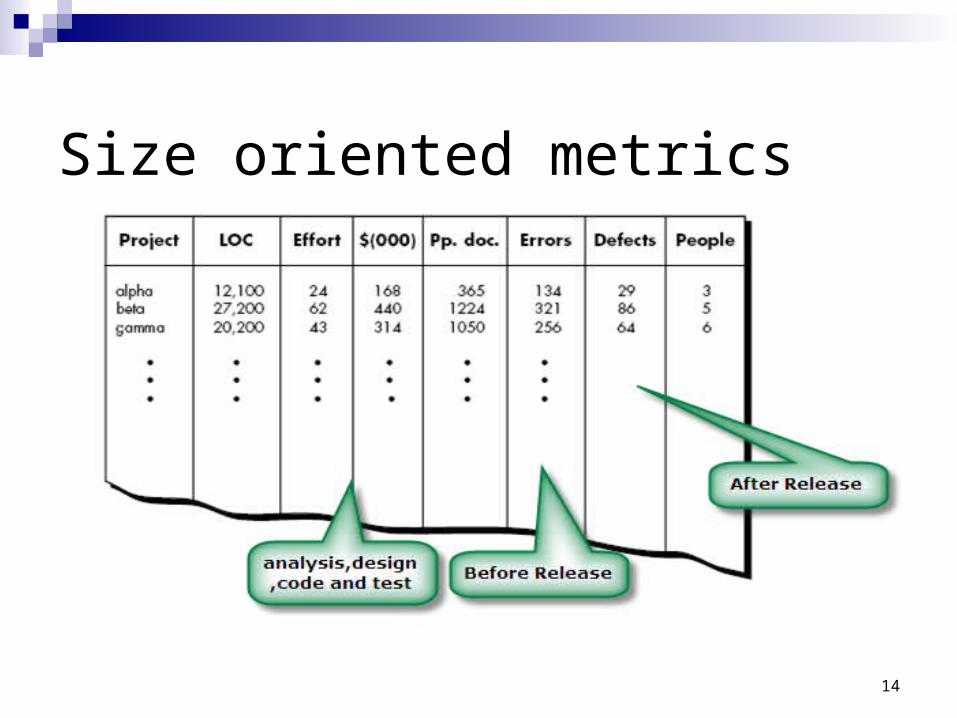
Size-oriented software metrics are derived by normalizing quality and/or productivity measures by considering the size of the software that has been produced.
Software organization can maintains simple records as shown in fig.
The table lists each software development project that has been completed over the past few years and corresponding measures for that project.

16
Contd. In order to develop metrics that can be understand with
similar metrics from other projects, we choose lines of code as our normalization value. Errors per KLOC (thousand lines of code) Defects per KLOC $ per LOC Pages of documentation per KLOC
Size-oriented metrics are widely used, but debate about their validity and applicability continues.
LOC measures are programming language dependent. Their use in estimation requires a level of detail that may
be difficult to achieve
17
Function-Oriented Metrics It use a measure of functionality delivered by the
application as a normalization value. Since ‘functionality’ cannot be measured directly, it
must be derived indirectly using other direct measures
Function Point (FP) is widely used as function oriented metrics.
FP is based on characteristic of Software information domain.
FP is programming language independent.
18
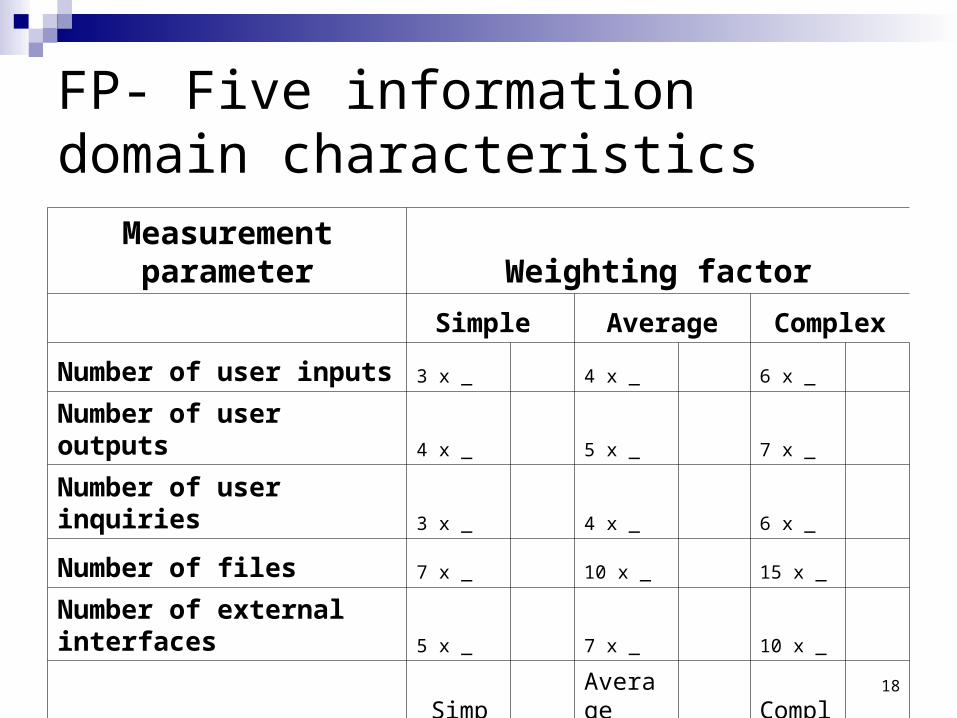
FP- Five information domain characteristicsMeasurement parameter Weighting factor
Simple Average Complex
Number of user inputs 3 x _ 4 x _ 6 x _
Number of user outputs 4 x _ 5 x _ 7 x _
Number of user inquiries 3 x _ 4 x _ 6 x _
Number of files 7 x _ 10 x _ 15 x _
Number of external interfaces 5 x _ 7 x _ 10 x _
Simple Total
Average Total
Complex total
Count Total
19
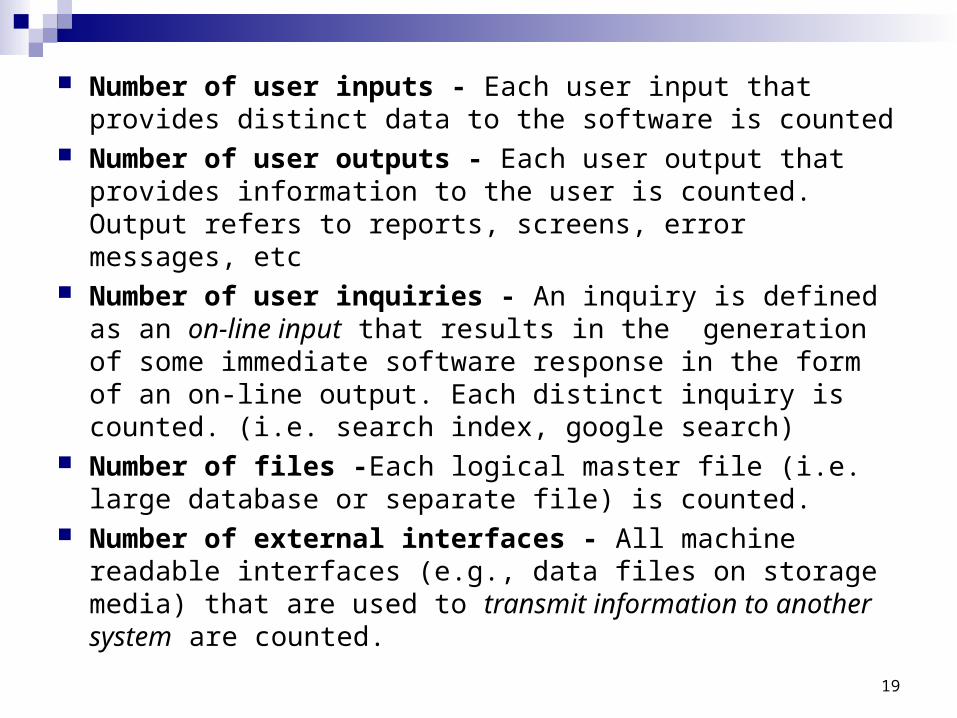
Number of user inputs - Each user input that provides distinct data to the software is counted
Number of user outputs - Each user output that provides information to the user is counted. Output refers to reports, screens, error messages, etc
Number of user inquiries - An inquiry is defined as an on-line input that results in the generation of some immediate software response in the form of an on-line output. Each distinct inquiry is counted. (i.e. search index, google search)
Number of files -Each logical master file (i.e. large database or separate file) is counted.
Number of external interfaces - All machine readable interfaces (e.g., data files on storage media) that are used to transmit information to another system are counted.
20
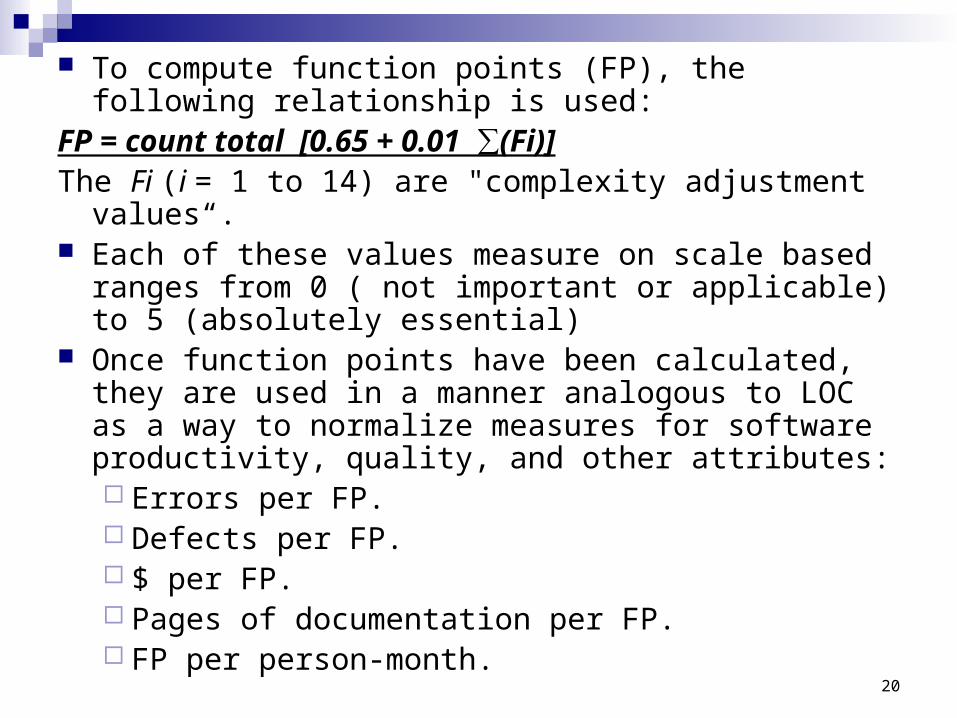
To compute function points (FP), the following relationship is used:
FP = count total [0.65 + 0.01 ∑(Fi)]The Fi (i = 1 to 14) are "complexity adjustment values“. Each of these values measure on scale based ranges
from 0 ( not important or applicable) to 5 (absolutely essential)
Once function points have been calculated, they are used in a manner analogous to LOC as a way to normalize measures for software productivity, quality, and other attributes: Errors per FP. Defects per FP. $ per FP. Pages of documentation per FP. FP per person-month.
21
Metrics for software quality
Measuring Quality It consist of 4 parameter.
Correctness Maintainability Integrity Usability
Defect Removal Efficiency method
22
Correctness A program must operate correctly or it provides
little value to its users. Correctness is the degree to which the software
performs its required function. The most common measure for correctness is
defects per KLOC, where a defect is defined as a verified lack of conformance to requirements.
When considering the overall quality of a software product, defects are those problems reported by a user of the program

23
Maintainability Maintenance required more effort than any other software
engineering activity. Maintainability is the ease with which a program can be
corrected if an error is encountered, adapted if its environment changes, or enhanced if the customer desires a change in requirement.
There is no way to measure maintainability directly; therefore, we must use indirect measures.
A simple time-oriented metric is mean-time-to-change (MTTC), the time it takes to analyze the change request, design an appropriate modification, implement the change, test it, and distribute the change to all users.
24
Contd.
Another method is, cost-oriented metric for maintainability called spoilage - the cost to correct defects encountered after the software has been released to its end-users.
By determining spoilage ratio to overall cost is plotted as a function time.
Project manager can determine, overall maintainability of software produced by a software development team.
25
Integrity Software integrity has become increasingly important in
the age of hackers and firewalls. This attribute measures a system's ability to withstand
attacks (both accidental and intentional) to its security. Attacks can be made on all three components of
software: Programs Data Documents
To measure integrity, two additional attributes must be defined: Threat Security
26
Threat is the probability (which can be estimated or derived from practical evidence) that an attack of a specific type will occur within a given time.
Security is the probability (which can be estimated or derived from practical evidence) that the attack of a specific type will be prevent.
Integrity of a system can then be defined asintegrity = summation [(1 – threat) X (1 –
security)]where threat and security are summed over each type of
attack.
27
Usability
The phrase "user-friendliness" has become everywhere in discussions of software products.
If a program is not user-friendly, it is often doomed to failure, even if the functions that it performs are valuable.
Usability is an attempt to quantify user-friendliness and can be measured in terms of four characteristics: the physical and or intellectual skill required to learn the system, the time required to become moderately efficient in the use of the
system productivity measured when the system is used by someone who is
moderately efficient A subjective assessment (sometimes through a questionnaire) of users
attitudes toward the system.
28
Defect Removal Efficiency
A quality metric that provides benefit at both the project and process level is defect removal efficiency (DRE).
DRE is a measure of the filtering ability of quality assurance and control activities as they are applied throughout all process framework activities.
To compute DRE: DRE = E / (E + D)Where E= no. of error before release and D = defect found
after release of software to end users
29
Contd.
The ideal value for DRE is 1. That is, no defects are found in the software.
Realistically, D will be greater than 0, but the value of DRE can still approach 1. As E increases (for a given value of D), the overall value of DRE begins to approach 1.
In fact, as E increases, it is likely that the final value of D will decrease (errors are filtered out before they become defects).
DRE encourages a software project team to institute techniques for finding as many errors as possible before delivery.

30
DRE can also be used within the project to assess a team’s ability to find errors before they are passed to the next framework activity or software engineering task.
For example, the requirements analysis task produces an analysis model that can be reviewed to find and correct errors. Those errors that are not found during the review of the analysis model are passed on to the design task.
When used in this context, we redefine DRE asDREi = Ei/(Ei + Ei+1)
Ei is the number of errors found during software engineering activity i. Ei+1 number of errors found during software engineering activity i+1
A quality objective for a software team is to achieve DREi that approaches 1. That is, errors should be filtered out before they are passed on to the next activity.
Contd.

31
OBJECT-ORIENTED METRICS
Primary objectives for object-oriented metrics are no different than those for metrics derived for conventional software:To better understand the quality of the productTo assess the effectiveness of the processTo improve the quality of work performed at a
project level

32
CHARACTERISTICS OF OBJECT-ORIENTED METRICS
Metrics for OO systems must be tuned to the characteristics that distinguish OO from conventional software.
So there are five characteristics that lead to specialized metrics: Localization Encapsulation Information hiding, Inheritance, and Object abstraction techniques.

33
Localization
Localization is a characteristic of software that indicates the manner in which information is concentrated within a program.
For example, in conventional methods for functional decomposition localize information around functions & Data-driven methods localize information around specific data structures.
But In the OO context, information is concentrated by summarize both data and process within the bounds of a class or object.
Since the class is the basic unit of an OO system, localization is based on objects.
Therefore, metrics should apply to the class (object) as a complete entity.

34
Relationship between operations (functions) and classes is not necessarily one to one.
Therefore, classes collaborate must be capable of accommodating one-to-many and many-to-one relationships.
35
Encapsulation Defines encapsulation as “the packaging (or binding
together) of a collection of items For conventional software,
Low-level examples of encapsulation include records and arrays,
mid-level mechanisms for encapsulation include functions, subroutines, and paragraphs
For OO systems, Encapsulation include the responsibilities of a class,
including its attributes and operations, and the states of the class, as defined by specific attribute values.
Encapsulation influences metrics by changing the focus of measurement from a single module to a package of data (attributes) and processing modules (operations).
36
Information Hiding
Information hiding suppresses (or hides) the operational details of a program component.
Only the information necessary to access the component is provided to those other components that wish to access it.
A well-designed OO system should encourage information hiding. And its indication of the quality of the OO design.
37
Inheritance
Inheritance is a mechanism that enables the responsibilities of one object to be propagated to other objects.
Inheritance occurs throughout all levels of a class hierarchy. In general, conventional software does not support this characteristic.
Because inheritance is a crucial characteristic in many OO systems, many OO metrics focus on it.

38
Abstraction
Abstraction focus on the essential details of a program component (either data or process) with little concern for lower-level details.
Abstraction is a relative concept. As we move to higher levels of abstraction we ignore more and more details.
Because a class is an abstraction that can be viewed at many different levels of detail and in a number of different ways (e.g., as a list of operations, as a sequence of states, as a series of collaborations), OO metrics represent abstractions in terms of measures of a class

39
CLASS-ORIENTED METRICS
To measure class OO metrics:Chidamber and Kemerer (CK) metrics suitesLorenz and Kidd(LK) metrics suitesThe Metrics for Object-Oriented Design
(MOOD) Metrics Suite
40
CK metrics suite CK have proposed six class-based design metrics for OO
systems.1. Weighted methods per class (WMC):- Assume that n methods of complexity c1, c2, . . ., cn are
defined for a class C. The specific complexity metric that is chosen (e.g.,
cyclomatic complexity) should be normalized so that nominal complexity for a method takes on a value of 1.0.
WMC = ∑ ci for i = 1 to n. The number of methods and their
complexity are reasonable indicators of the amount of effort required to implement and test a class.
So if no. of methods are increase, complexity of class also increase. Therefore, limiting potential reuse (i.e. use inheritance concept)
41
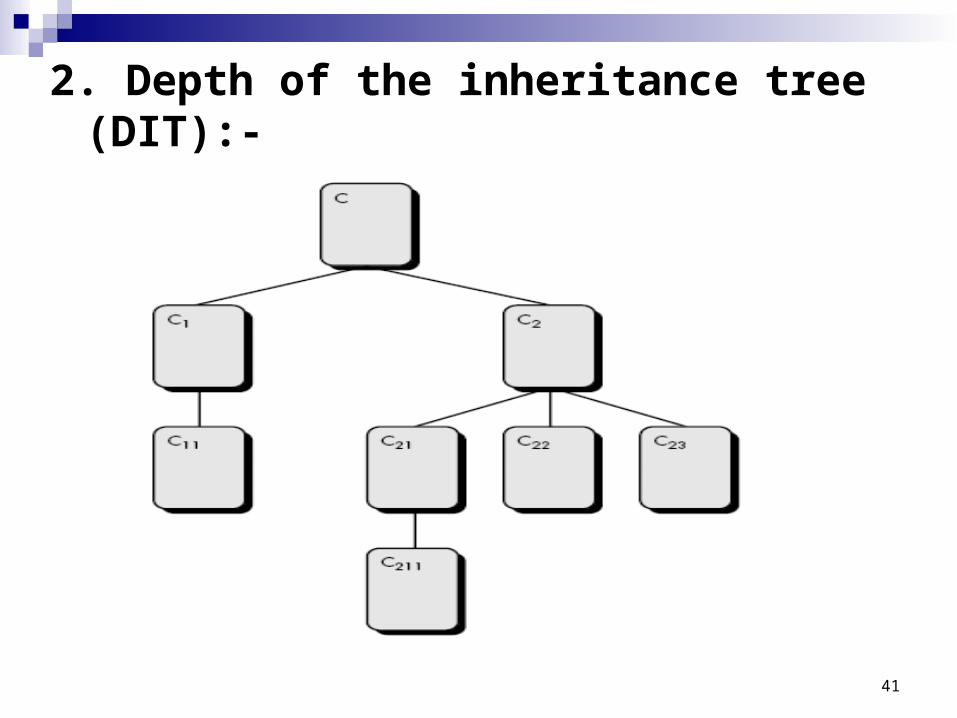
2. Depth of the inheritance tree (DIT):-

42
DIT
This metric is “the maximum length from the node to the root of the tree”
Referring to Figure, the value of DIT for the class-hierarchy shown is 4.
As DIT grows, it is likely that lower-level classes will inherit many methods. This leads to potential difficulties when attempting to predict the behavior of a class.
A deep class hierarchy (DIT is large) also leads to greater design complexity.
On the positive side, large DIT values imply that many methods may be reused.

43
3. Number of children (NOC):- The subclasses that are immediately
subordinate to a class in the class hierarchy are termed its children.
Referring to previous figure, class C2 has three children—subclasses C21, C22, and C23.
As the number of children grows, reuse increases, the abstraction represented by the parent class can be diluted.
In this case, some of the children may not really be appropriate members of the parent class.
As NOC increases, the amount of testing (required to exercise each child in its operational context) will also increase.

44
4. Coupling between object classes (CBO): The CRC model may be used to determine the
value for CBO CBO is the number of collaborations listed for a
class on its CRC index card. As CBO increases, it is likely that the reusability
of a class will decrease. If values of CBO is high, then modification get
complicated. Therefore, CBO values for each class should be
kept as low as is reasonable.
45
5. Response for a class (RFC) Response for a class is “a set of methods that
can potentially be executed in response to a message received by an object of that class”
RFC is the number of methods in the response set.
As RFC increases, the effort required for testing also increases because the test sequence grows.
As RFC increases, the overall design complexity of the class increases.

46
6. Lack of cohesion in methods (LCOM). LCOM is the number of methods that access one or more of
the same attributes. If no methods access the same attributes, then LCOM = 0. To illustrate the case where LCOM ≠ 0, consider a class with
six methods. Four of the methods have one or more attributes in common
(i.e.,they access common attributes). Therefore, LCOM = 4. If LCOM is high, methods may be coupled to one another via
attributes. This increases the complexity of the class design. In general, high values for LCOM imply that the class might
be better designed by breaking it into two or more separate classes.
It is desirable to keep cohesion high; that is, keep LCOM low.
47
Lorenz and Kidd metrics suite Four categories:
Size Inheritance Internal External
Size-oriented metrics for the OO class focus on counts of attributes and operations for an individual class.
Inheritance-based metrics focus on the manner in which operations are reused through the class hierarchy.
Metrics for class internals look at cohesion and code-oriented issues, and external metrics examine coupling and reuse.
48
The MOOD Metrics Suite1. Method inheritance factor (MIF). The degree to which the class architecture of an OO system
makes use of inheritance for both methods (operations) and attributes is defined
Value of MIF indicates impact of inheritance on the OO Software
2. Coupling factor (CF) : Coupling is an indication of the connections between
elements of the OO design.CF = ∑i ∑j is_client (Ci, Cj)]/(TC2 - TC)
where the summations occur over i = 1 to TC and j = 1 to TC. Function (is_client) = 1, if and only if a relationship exists
between the client class, Cc, and the server class, Cs, and Cc ≠ Cs
= 0, otherwise

49
As the value for CF increases, the complexity of the OO software will also increase and understandability, maintainability, and the potential for reuse may suffer as a result.
3. Polymorphism factor (PF). PF as “the number of methods that redefine
inherited methods, divided by the maximum number of possible distinct polymorphic situations
50
Operation oriented metrics
Operations (methods) - reside within a class.
LK proposed 3 methods:Average operation size (OSavg)Operation complexity (OC)Average number of parameters per
operation (NPavg)
51
1. Average operation size (OSavg) Lines of code (LOC) could be used as an indicator for
operation size. Operation has some roles and responsibilities related to
product. As the number of messages sent by a single operation
increases, it is likely that responsibilities have not been well-allocated within a class.
2. Operation complexity (OC) operations should be limited to a specific responsibility,
the designer should strive to keep OC as low as possible.
3.Average number of parameters per operation (NPavg) The larger the number of operation parameters, the
more complex the collaboration between objects. In general, NPavg should be kept as low as possible.
52
Bang metrics
Like the FP metric, the bang metric can be used to develop an indication of the size of the software to be implemented.
Bang metric is “an implementation independent indication of system size.”
To compute the bang metric, the software engineer must first evaluate a set of primitives (i.e. formula)
Primitives are determined by evaluating the analysis model and developing counts for the following forms:
53
Six primitives Functional primitives (FuP):- The number of
transformations (bubbles) that appear at the lowest level of a data flow diagram
Data elements (DE):- The number of attributes of a data object, data elements are not composite data and appear within the data dictionary.
Objects (OB). The number of data objects. Relationships (RE). The number of connections
between data objects. States (ST). The number of user observable states in
the state transition diagram Transitions (TR). The number of state transitions in the
state transition diagram
54
Modified manual function primitives (FuPM). Functions that lie outside the system boundary but must be modified to accommodate the new system.
Input data elements (DEI) Those data elements that are input to the system.
Output data elements (DEO) Those data elements that are output from the system.
Retained data elements (DER) Those data elements that are retained (stored) by the system.
Data tokens (TCi)- The data tokens (data items that are not subdivided within a functional primitive) that exist at the boundary (evaluated for each primitive).
Relationship connections (REi) The relationships that connect the object in the data model to other objects.
Additional counts are determined
55
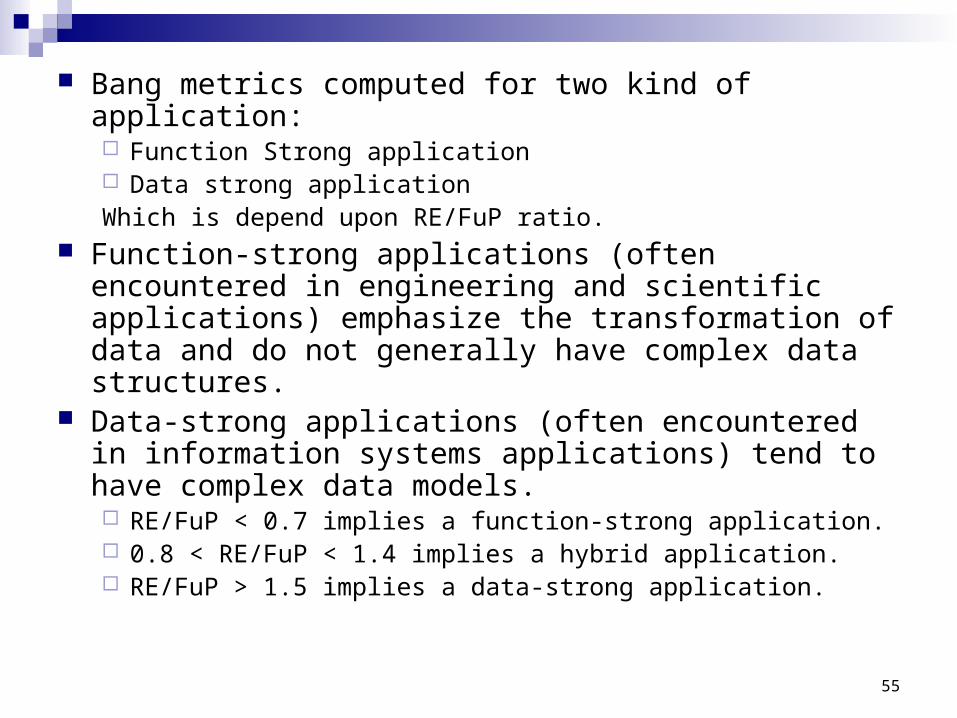
Bang metrics computed for two kind of application: Function Strong application Data strong applicationWhich is depend upon RE/FuP ratio.
Function-strong applications (often encountered in engineering and scientific applications) emphasize the transformation of data and do not generally have complex data structures.
Data-strong applications (often encountered in information systems applications) tend to have complex data models. RE/FuP < 0.7 implies a function-strong application. 0.8 < RE/FuP < 1.4 implies a hybrid application. RE/FuP > 1.5 implies a data-strong application.

56
To compute the bang metric for function-strong applications, the following algorithm is used:
set initial value of bang = 0;do while functional primitives remain to be evaluated
Compute token-count around the boundary of primitive iCompute corrected FuP increment (CFuPI)Allocate primitive to classAssess class and note assessed weightMultiply CFuPI by the assessed weightbang = bang + weighted CFuPI
enddo
57
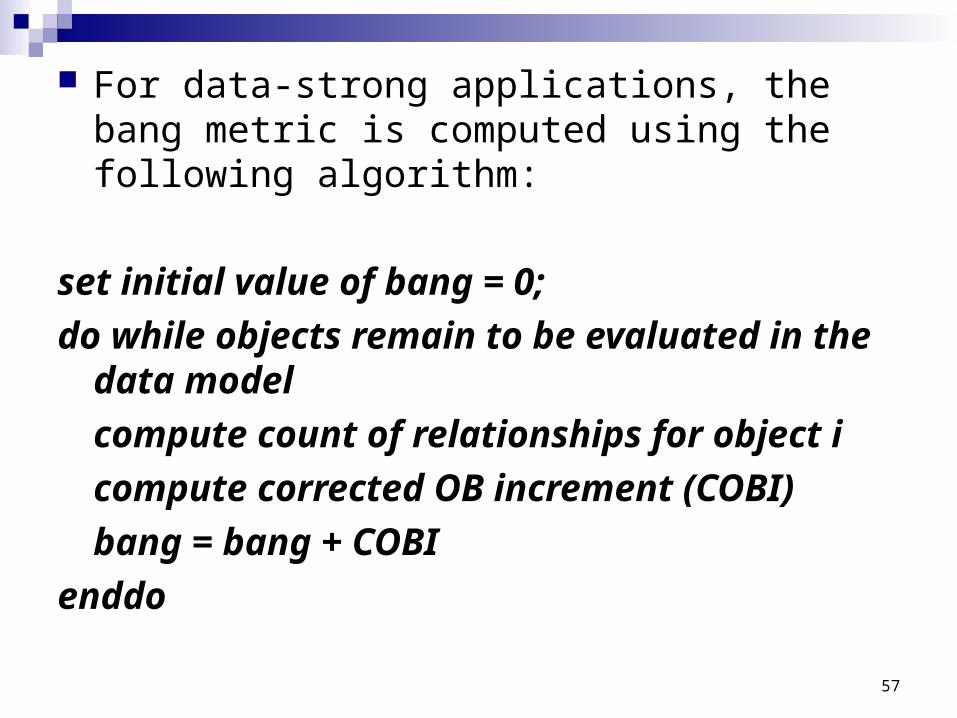
For data-strong applications, the bang metric is computed using the following algorithm:
set initial value of bang = 0;
do while objects remain to be evaluated in the data model
compute count of relationships for object i
compute corrected OB increment (COBI)
bang = bang + COBI
enddo


![Implementing Metrics For Process Improvementdoras.dcu.ie/19001/1/Angela_McAuley_20130613134623.pdfImplementing Metrics for Process Improvement ... COCOMO [Boehm81] and ... implement](https://img.pdfslide.us/doc/110x75/5b8840607f8b9a3d028cdf5f/implementing-metrics-for-process-metrics-for-process-improvement-cocomo-boehm81.jpg)