Embed Size (px)
Citation preview

1
Shifting Sands: Quantifying Shoreline and Dune Migration at Indiana Dunes National Lakeshore
Using time-series aerial photos to determine the average rate that the shoreline and dunes have moved inland.
Mark H. HorwitzDepartment of Geology, University of South Florida© 2010 University of South Florida Libraries. All rights reserved.
SSACgnp.TC225.MHH1.1
Core Quantitative Literacy TopicsWeighted average
Supporting Quantitative Literacy TopicsRate of change
Core Geoscience SubjectCoastal Erosion
Photo courtesy of the National Park Service
Photo courtesy of the National Park Service
The module you are viewing is a PowerPoint slide presentation.
•Move from slide to slide using the up/down and/or left/right arrow keys, the scroll wheel on the mouse if one is available, or the scrollbar on the right hand side of the window.
•Use the mouse to select hyperlinks (underlined, in blue type)
•When done, use the escape key to exit the presentation.
You can and probably should have a spreadsheet open in a separate window, so you can try out things that are explained in the presentation.
PowerPoint applications use lots of memory, so you may want to exit other programs while running this presentation, especially if it starts to act slowly or sluggishly. If you don’t immediately see the slideshow when switching back and forth between windows, use the up/down/left/right arrow keys (or scroll wheel on mouse) to ‘wake it up’.
Close this window to proceed with the slide show.
2
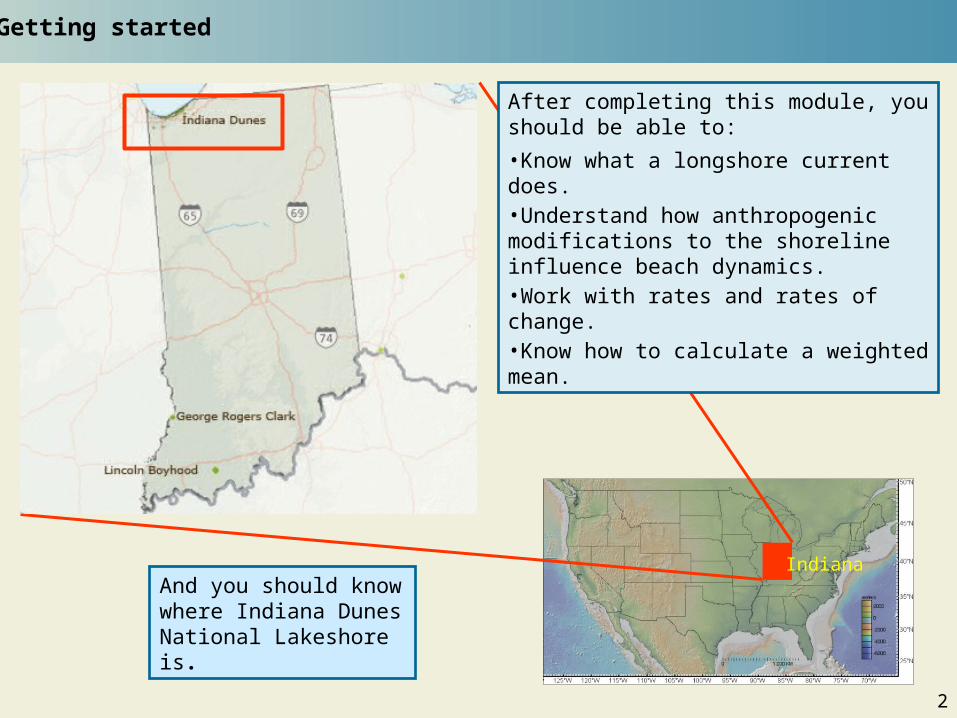
Getting started
And you should knowwhere Indiana DunesNational Lakeshore is.
After completing this module, you should be able to:
•Know what a longshore current does.•Understand how anthropogenic modifications to the shoreline influence beach dynamics.•Work with rates and rates of change.•Know how to calculate a weighted mean.
Indiana
3
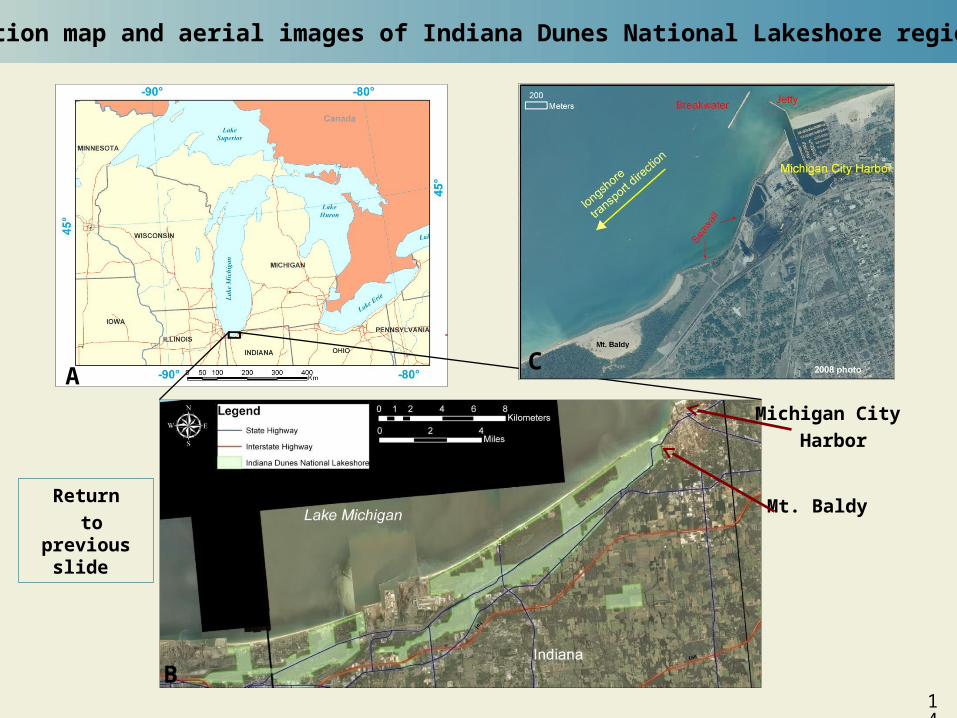
The Setting – Indiana Dunes National Lakeshore
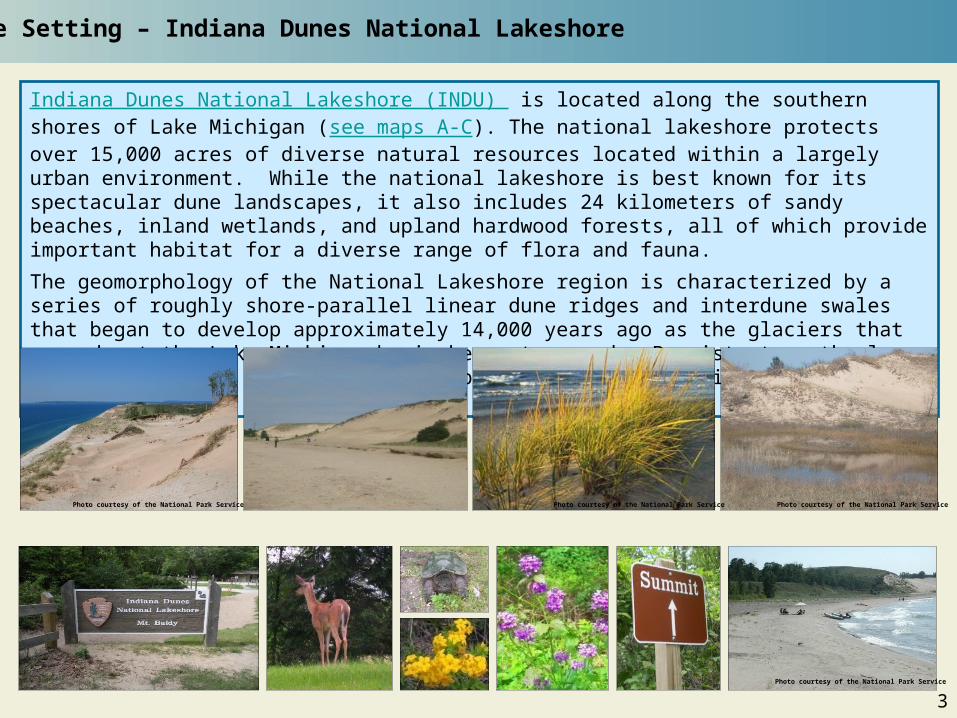
Indiana Dunes National Lakeshore (INDU) is located along the southern shores of Lake Michigan (see maps A-C). The national lakeshore protects over 15,000 acres of diverse natural resources located within a largely urban environment. While the national lakeshore is best known for its spectacular dune landscapes, it also includes 24 kilometers of sandy beaches, inland wetlands, and upland hardwood forests, all of which provide important habitat for a diverse range of flora and fauna.
The geomorphology of the National Lakeshore region is characterized by a series of roughly shore-parallel linear dune ridges and interdune swales that began to develop approximately 14,000 years ago as the glaciers that carved out the Lake Michigan basin began to recede. Persistent northerly winds continue to modify the landscape through hydrodynamic and aeolian processes.
Photo courtesy of the National Park Service Photo courtesy of the National Park Service
Photo courtesy of the National Park Service
Photo courtesy of the National Park Service
44
The problem
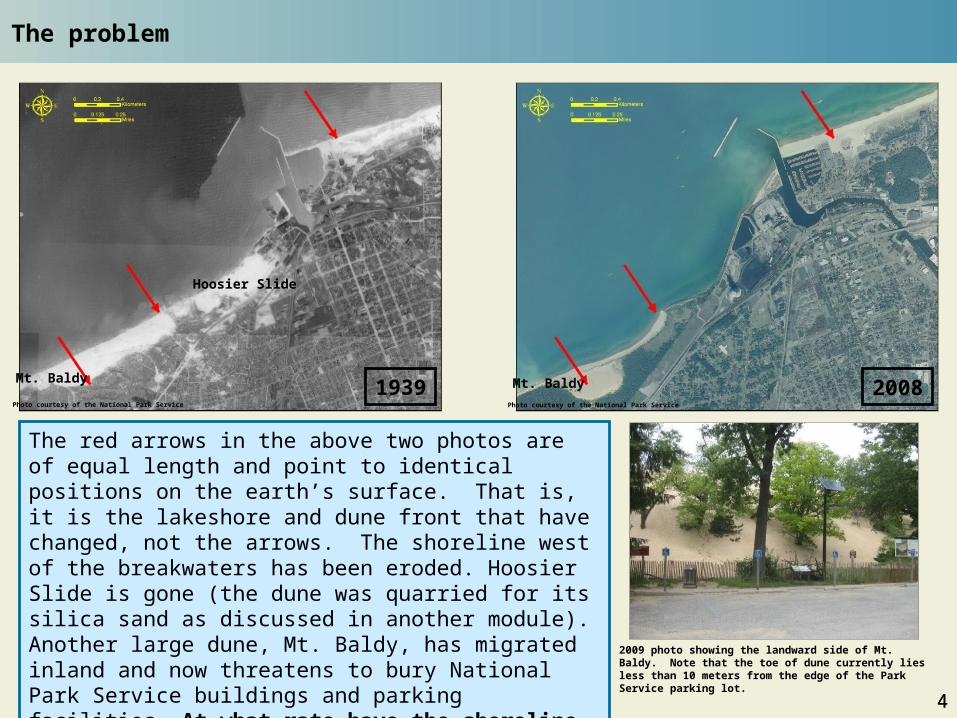
The red arrows in the above two photos are of equal length and point to identical positions on the earth’s surface. That is, it is the lakeshore and dune front that have changed, not the arrows. The shoreline west of the breakwaters has been eroded. Hoosier Slide is gone (the dune was quarried for its silica sand as discussed in another module). Another large dune, Mt. Baldy, has migrated inland and now threatens to bury National Park Service buildings and parking facilities. At what rate have the shoreline and dune front moved inland?
1939
Hoosier Slide
Mt. Baldy
2009 photo showing the landward side of Mt. Baldy. Note that the toe of dune currently lies less than 10 meters from the edge of the Park Service parking lot.
Photo courtesy of the National Park Service
2008Mt. Baldy
Photo courtesy of the National Park Service
5
The problem: causes of beach erosion and mitigation approaches
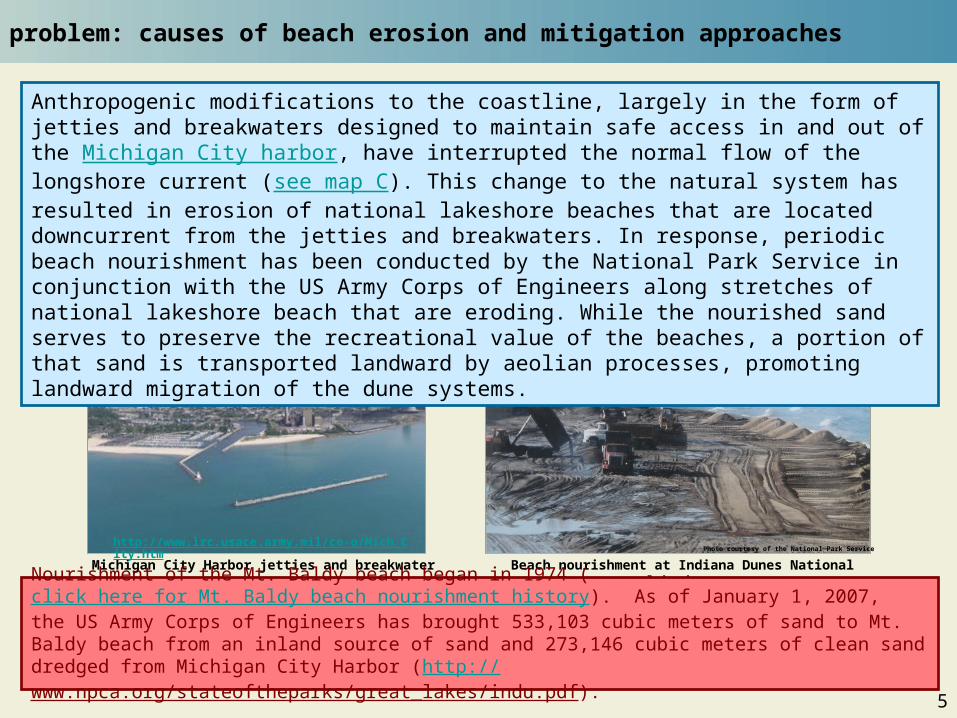
Anthropogenic modifications to the coastline, largely in the form of jetties and breakwaters designed to maintain safe access in and out of the Michigan City harbor, have interrupted the normal flow of the longshore current (see map C). This change to the natural system has resulted in erosion of national lakeshore beaches that are located downcurrent from the jetties and breakwaters. In response, periodic beach nourishment has been conducted by the National Park Service in conjunction with the US Army Corps of Engineers along stretches of national lakeshore beach that are eroding. While the nourished sand serves to preserve the recreational value of the beaches, a portion of that sand is transported landward by aeolian processes, promoting landward migration of the dune systems.
Michigan City Harbor jetties and breakwater
http://www.lrc.usace.army.mil/co-o/Mich_City.htm
Beach nourishment at Indiana Dunes National lakeshore
Nourishment of the Mt. Baldy beach began in 1974 (click here for Mt. Baldy beach nourishment history). As of January 1, 2007, the US Army Corps of Engineers has brought 533,103 cubic meters of sand to Mt. Baldy beach from an inland source of sand and 273,146 cubic meters of clean sand dredged from Michigan City Harbor (http://www.npca.org/stateoftheparks/great_lakes/indu.pdf).
Photo courtesy of the National Park Service
6
Coastal geology: beach and dune dynamics
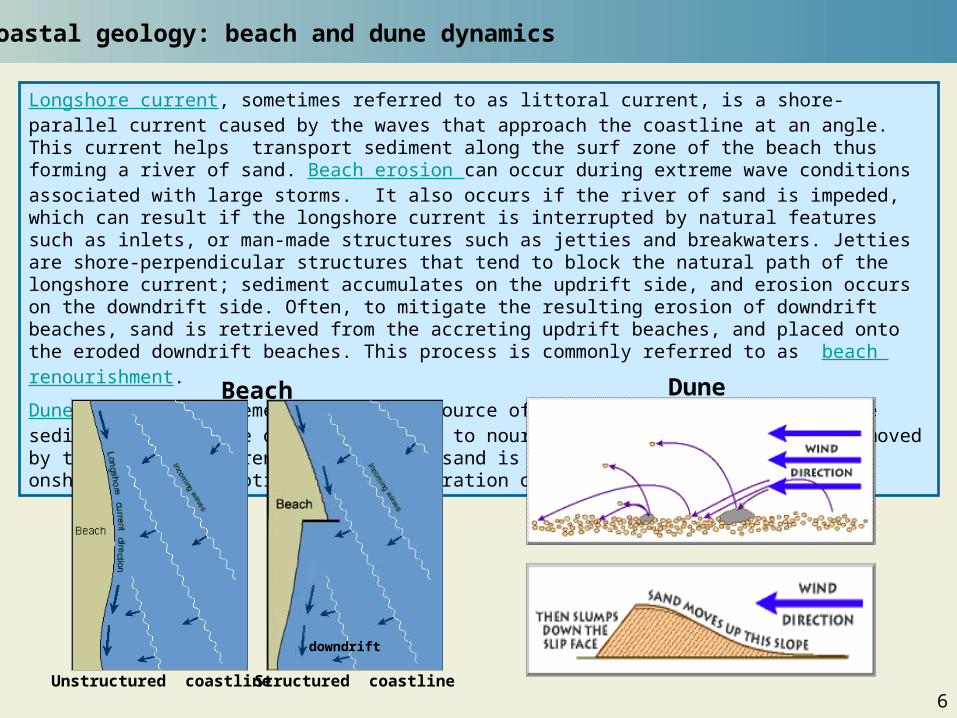
Longshore current, sometimes referred to as littoral current, is a shore-parallel current caused by the waves that approach the coastline at an angle. This current helps transport sediment along the surf zone of the beach thus forming a river of sand. Beach erosion can occur during extreme wave conditions associated with large storms. It also occurs if the river of sand is impeded, which can result if the longshore current is interrupted by natural features such as inlets, or man-made structures such as jetties and breakwaters. Jetties are shore-perpendicular structures that tend to block the natural path of the longshore current; sediment accumulates on the updrift side, and erosion occurs on the downdrift side. Often, to mitigate the resulting erosion of downdrift beaches, sand is retrieved from the accreting updrift beaches, and placed onto the eroded downdrift beaches. This process is commonly referred to as beach renourishment.
Dune growth and movement requires a source of sediment, and wind to move the sediment. While some of the sand used to nourish the beach is subsequently moved by the littoral current, some of the sand is blown landward by persistent onshore winds, promoting landward migration of the lakeshore dunes.
updrift
Unstructured coastline Structured coastline
downdrift
Beach Dune
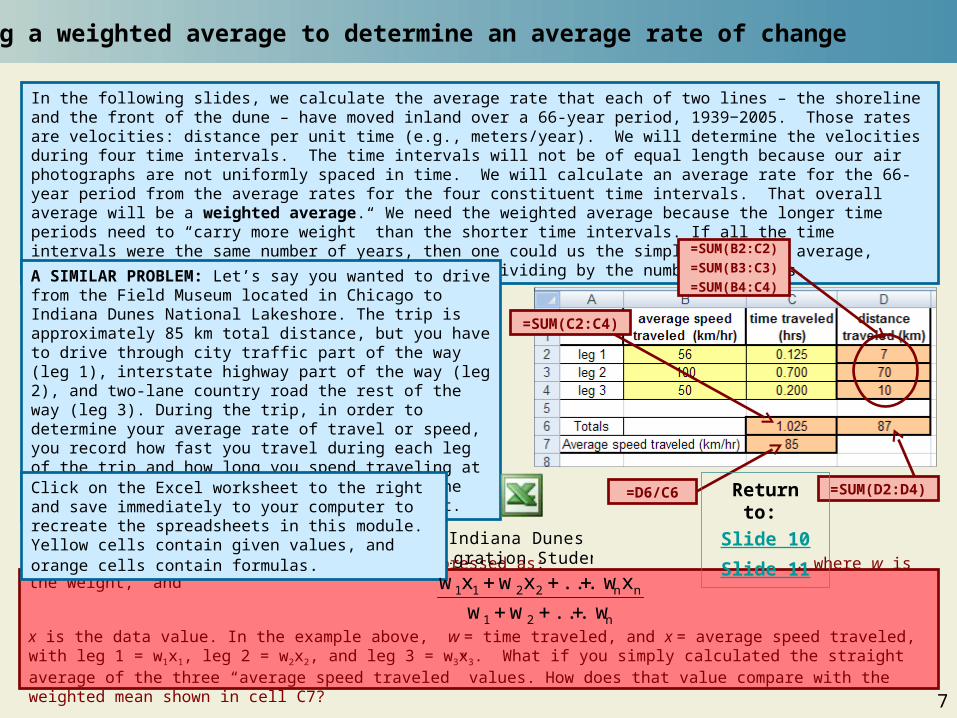
Mathematically, the weighted mean can be expressed as: , where w is the weight, and
x is the data value. In the example above, w = time traveled, and x = average speed traveled, with leg 1 = w1x1, leg 2 = w2x2, and leg 3 = w3x3. What if you simply calculated the straight average of the three “average speed traveled” values. How does that value compare with the weighted mean shown in cell C7?
7
Using a weighted average to determine an average rate of change
In the following slides, we calculate the average rate that each of two lines – the shoreline and the front of the dune – have moved inland over a 66-year period, 1939−2005. Those rates are velocities: distance per unit time (e.g., meters/year). We will determine the velocities during four time intervals. The time intervals will not be of equal length because our air photographs are not uniformly spaced in time. We will calculate an average rate for the 66-year period from the average rates for the four constituent time intervals. That overall average will be a weighted average. We need the weighted average because the longer time periods need to “carry more weight” than the shorter time intervals. If all the time intervals were the same number of years, then one could us the simple, familiar average, which results from adding up all the values and dividing by the number of values.
A SIMILAR PROBLEM: Let’s say you wanted to drive from the Field Museum located in Chicago to Indiana Dunes National Lakeshore. The trip is approximately 85 km total distance, but you have to drive through city traffic part of the way (leg 1), interstate highway part of the way (leg 2), and two-lane country road the rest of the way (leg 3). During the trip, in order to determine your average rate of travel or speed, you record how fast you travel during each leg of the trip and how long you spend traveling at that rate. Those values are entered into the yellow cells in the spreadsheet to the right.
Click on the Excel worksheet to the right and save immediately to your computer to recreate the spreadsheets in this module. Yellow cells contain given values, and orange cells contain formulas.
=SUM(B2:C2)
=SUM(B3:C3)
=SUM(B4:C4)
=SUM(D2:D4)
=SUM(C2:C4)
=D6/C6
n21
nn2211
w ... ww
x w ...xwxw
Return to:
Slide 10
Slide 11Indiana Dunes Migration Student

8
Determining rates of shoreline erosion and dune migration: 1
In order to determine the average rate of shoreline and dune advancement or retreat, orthorectified and georeferenced time series aerial photos of the Mt. Baldy region were examined for the period of time spanning from 1939 to 2005. The shoreline position, and landward margin of Mt. Baldy were digitized on each photo to allow for measurement.
The digitized positions of the shoreline and dune in the 1939 photo are outlined in yellow. They serve as baselines or starting positions, from which we will compare later shoreline and dune positions to determine rate of movement. The yellow lines in the right photo are simply the same lines shown in the 1939 image overlain on the 1972 image. The black lines represent shoreline and dune positions as they were in 1972. The 14 red lines connecting the 1939 and 1972 positions represent the change over the 33-year period. The value next to each red line represents the distance or change in position (in meter) that occurred during the 33-year period.
Return to:
Slide 10
Slide 11
9
Determining rates of shoreline erosion and dune migration: 2
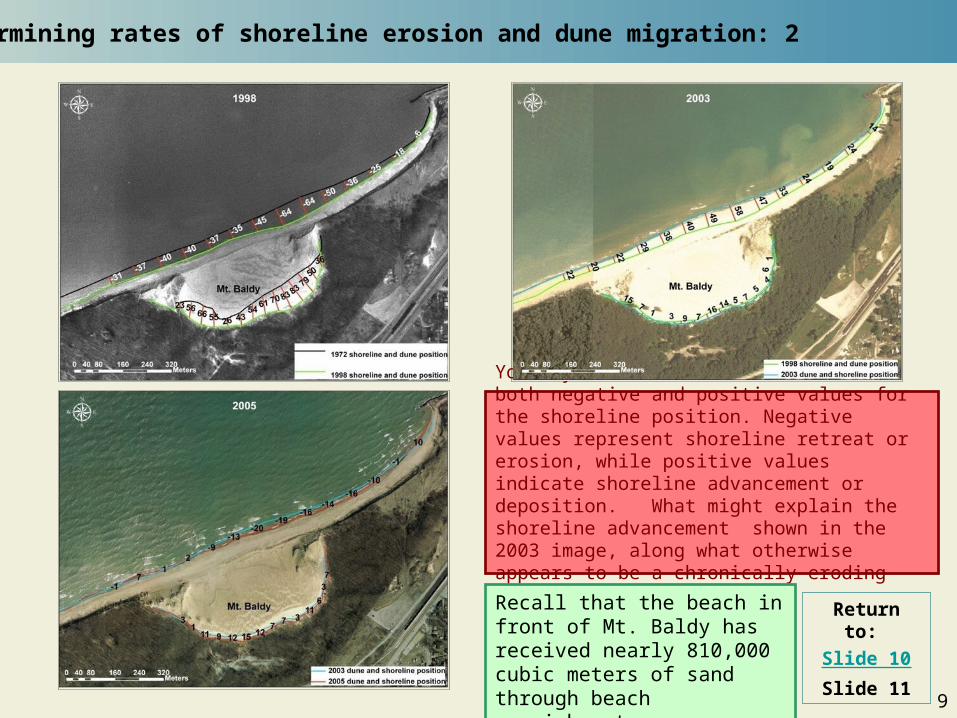
You may have noticed that there are both negative and positive values for the shoreline position. Negative values represent shoreline retreat or erosion, while positive values indicate shoreline advancement or deposition. What might explain the shoreline advancement shown in the 2003 image, along what otherwise appears to be a chronically eroding stretch of beach?
Recall that the beach in front of Mt. Baldy has received nearly 810,000 cubic meters of sand through beach nourishment.
Return to:
Slide 10
Slide 11
10
Calculating average rate of shoreline movement
1939-2005
2005 aerial photo of the Mt. Baldy area showing
1939 through 2005 shoreline and dune positions.
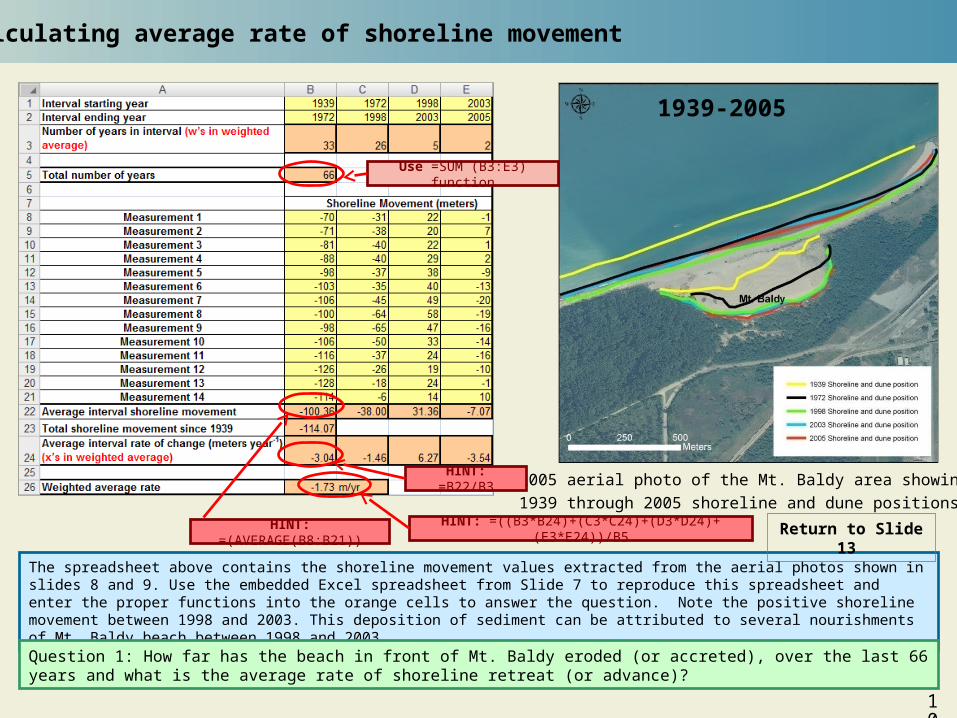
Use =SUM (B3:E3) function
HINT: =(AVERAGE(B8:B21))
HINT: =B22/B3
HINT: =((B3*B24)+(C3*C24)+(D3*D24)+(E3*E24))/B5
The spreadsheet above contains the shoreline movement values extracted from the aerial photos shown in slides 8 and 9. Use the embedded Excel spreadsheet from Slide 7 to reproduce this spreadsheet and enter the proper functions into the orange cells to answer the question. Note the positive shoreline movement between 1998 and 2003. This deposition of sediment can be attributed to several nourishments of Mt. Baldy beach between 1998 and 2003.
Question 1: How far has the beach in front of Mt. Baldy eroded (or accreted), over the last 66 years and what is the average rate of shoreline retreat (or advance)?
Return to Slide 13
11
Calculating average rate of dune migration
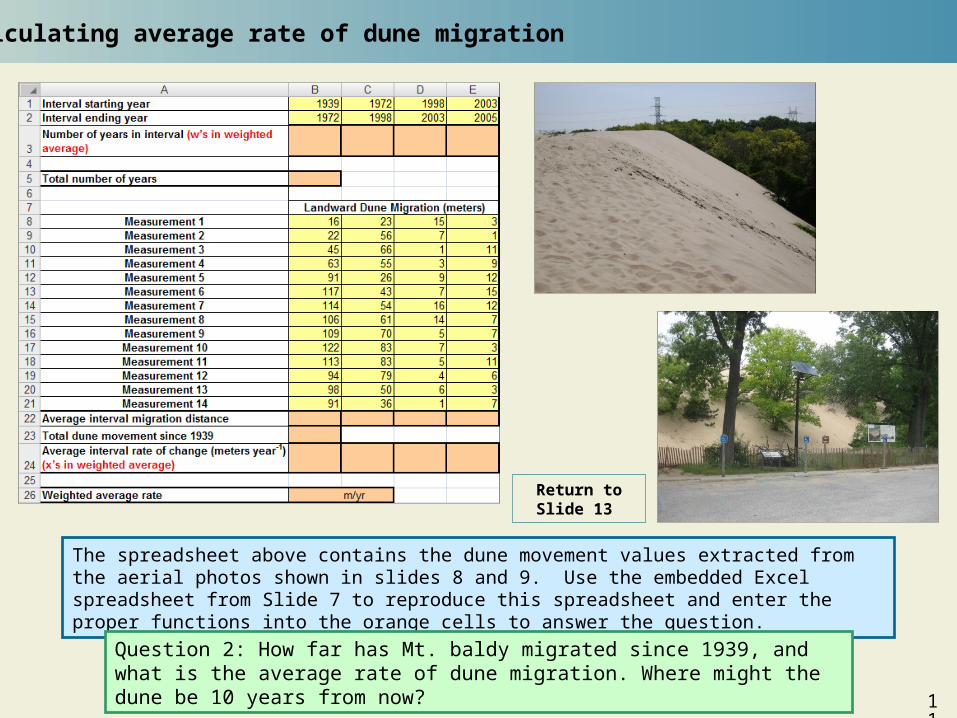
The spreadsheet above contains the dune movement values extracted from the aerial photos shown in slides 8 and 9. Use the embedded Excel spreadsheet from Slide 7 to reproduce this spreadsheet and enter the proper functions into the orange cells to answer the question.
Question 2: How far has Mt. baldy migrated since 1939, and what is the average rate of dune migration. Where might the dune be 10 years from now?
Return to Slide 13
12
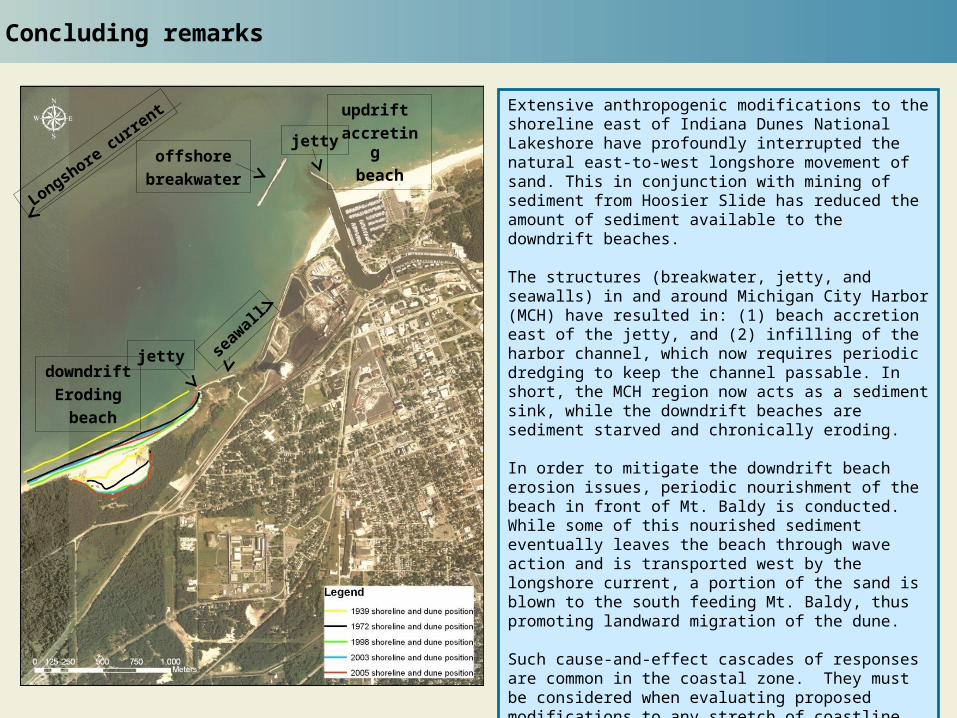
Concluding remarks
Extensive anthropogenic modifications to the shoreline east of Indiana Dunes National Lakeshore have profoundly interrupted the natural east-to-west longshore movement of sand. This in conjunction with mining of sediment from Hoosier Slide has reduced the amount of sediment available to the downdrift beaches.
The structures (breakwater, jetty, and seawalls) in and around Michigan City Harbor (MCH) have resulted in: (1) beach accretion east of the jetty, and (2) infilling of the harbor channel, which now requires periodic dredging to keep the channel passable. In short, the MCH region now acts as a sediment sink, while the downdrift beaches are sediment starved and chronically eroding.
In order to mitigate the downdrift beach erosion issues, periodic nourishment of the beach in front of Mt. Baldy is conducted. While some of this nourished sediment eventually leaves the beach through wave action and is transported west by the longshore current, a portion of the sand is blown to the south feeding Mt. Baldy, thus promoting landward migration of the dune.
Such cause-and-effect cascades of responses are common in the coastal zone. They must be considered when evaluating proposed modifications to any stretch of coastline.
updrift
accreting
beach
downdrift
Eroding
beach
seaw
all
offshore
breakwater
jetty
jetty
Longshore current
13
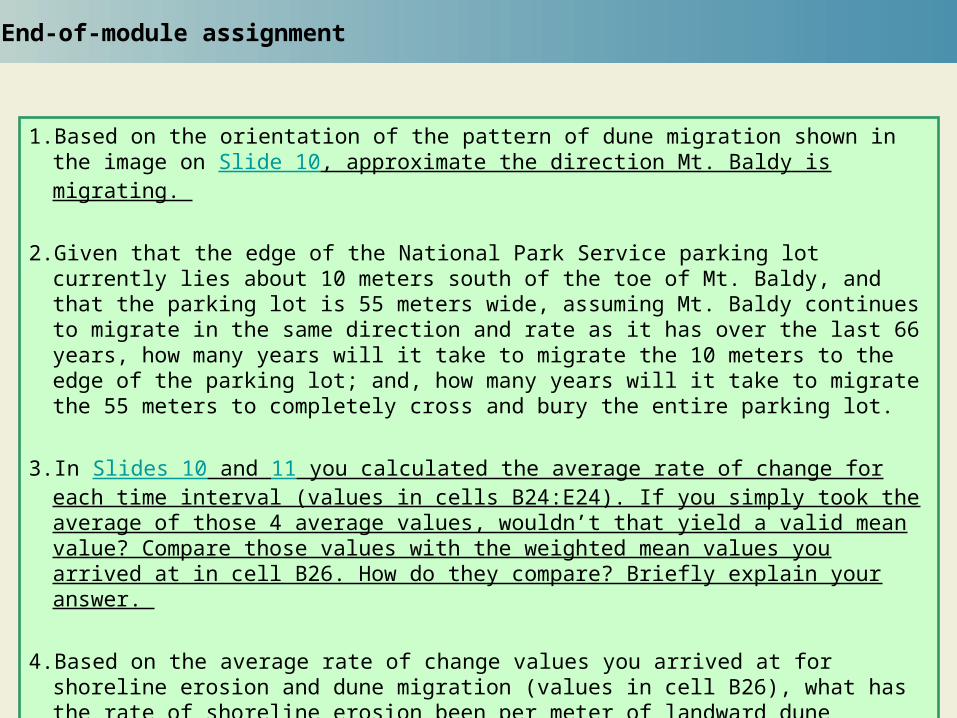
End-of-module assignment
1. Based on the orientation of the pattern of dune migration shown in the image on Slide 10, approximate the direction Mt. Baldy is migrating.
2. Given that the edge of the National Park Service parking lot currently lies about 10 meters south of the toe of Mt. Baldy, and that the parking lot is 55 meters wide, assuming Mt. Baldy continues to migrate in the same direction and rate as it has over the last 66 years, how many years will it take to migrate the 10 meters to the edge of the parking lot; and, how many years will it take to migrate the 55 meters to completely cross and bury the entire parking lot.
3. In Slides 10 and 11 you calculated the average rate of change for each time interval (values in cells B24:E24). If you simply took the average of those 4 average values, wouldn’t that yield a valid mean value? Compare those values with the weighted mean values you arrived at in cell B26. How do they compare? Briefly explain your answer.
4. Based on the average rate of change values you arrived at for shoreline erosion and dune migration (values in cell B26), what has the rate of shoreline erosion been per meter of landward dune migration over the last 66 years? In other words, how much beach erosion takes place during the period of time it takes for Mt. Baldy to migrate 1-meter landward?
14
Location map and aerial images of Indiana Dunes National Lakeshore region
A
Mt. Baldy
Michigan City
Harbor
Return
to previous slide
B
C
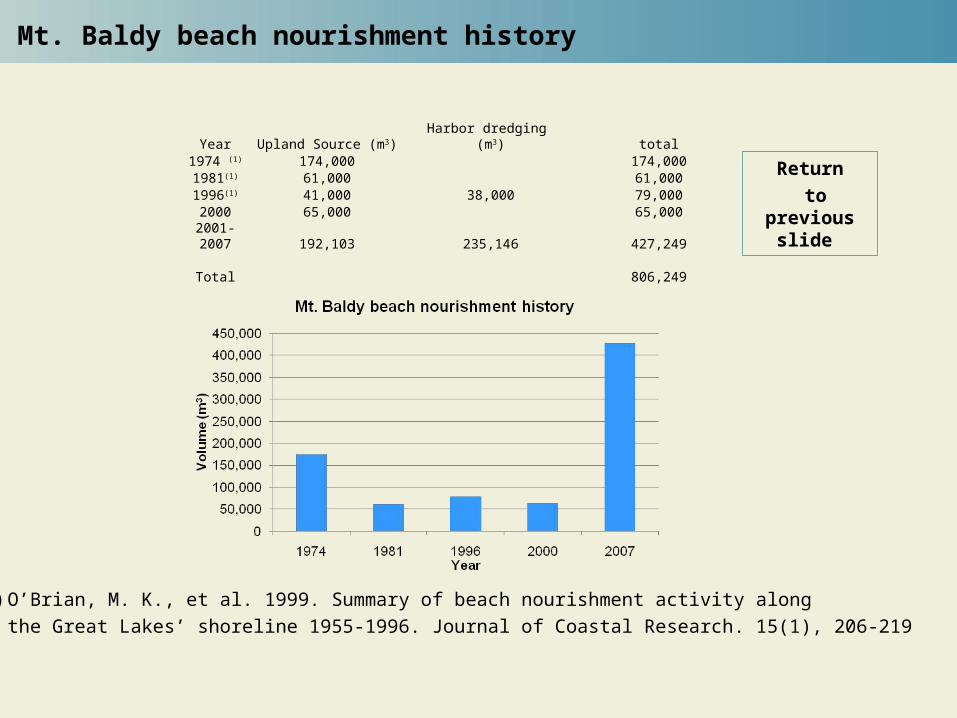
Mt. Baldy beach nourishment history
Year Upland Source (m3) Harbor dredging (m3) total1974 (1) 174,000 174,0001981(1) 61,000 61,0001996(1) 41,000 38,000 79,0002000 65,000 65,000
2001-2007 192,103 235,146 427,249
Total 806,249
Return
to previous slide
(1) O’Brian, M. K., et al. 1999. Summary of beach nourishment activity along
the Great Lakes’ shoreline 1955-1996. Journal of Coastal Research. 15(1), 206-219