Embed Size (px)
Citation preview
Section 3.9 1
Noise and Vibration 2
This section presents a discussion of existing noise and vibration conditions in the Project vicinity in 3 a regional and site-specific context. Potential impacts of the Project related to noise and vibration 4 are also considered, and applicable mitigation is proposed. 5
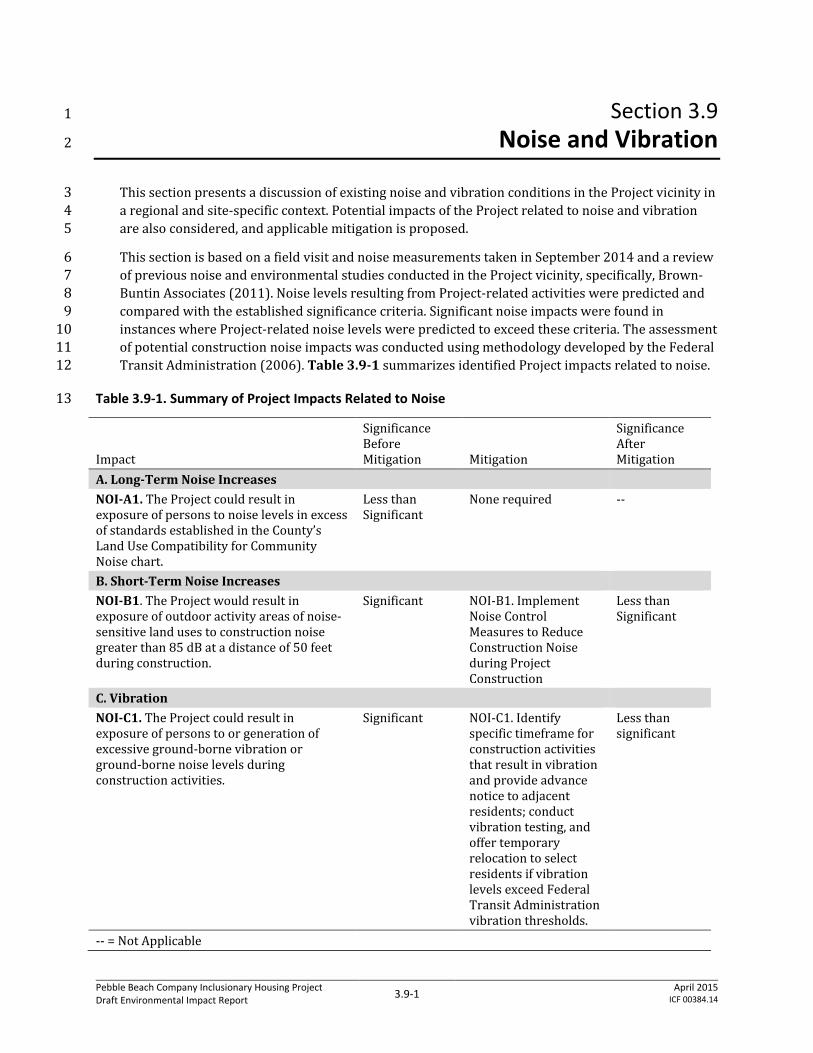
This section is based on a field visit and noise measurements taken in September 2014 and a review 6 of previous noise and environmental studies conducted in the Project vicinity, specifically, Brown-7 Buntin Associates (2011). Noise levels resulting from Project-related activities were predicted and 8 compared with the established significance criteria. Significant noise impacts were found in 9 instances where Project-related noise levels were predicted to exceed these criteria. The assessment 10 of potential construction noise impacts was conducted using methodology developed by the Federal 11 Transit Administration (2006). Table 3.9-1 summarizes identified Project impacts related to noise. 12
Table 3.9-1. Summary of Project Impacts Related to Noise 13
Impact
Significance Before Mitigation Mitigation
Significance After Mitigation
A. Long-Term Noise Increases NOI-A1. The Project could result in exposure of persons to noise levels in excess of standards established in the County’s Land Use Compatibility for Community Noise chart.
Less than Significant
None required --
B. Short-Term Noise Increases NOI-B1. The Project would result in exposure of outdoor activity areas of noise-sensitive land uses to construction noise greater than 85 dB at a distance of 50 feet during construction.
Significant NOI-B1. Implement Noise Control Measures to Reduce Construction Noise during Project Construction
Less than Significant
C. Vibration NOI-C1. The Project could result in exposure of persons to or generation of excessive ground-borne vibration or ground-borne noise levels during construction activities.
Significant NOI-C1. Identify specific timeframe for construction activities that result in vibration and provide advance notice to adjacent residents; conduct vibration testing, and offer temporary relocation to select residents if vibration levels exceed Federal Transit Administration vibration thresholds.
Less than significant
-- = Not Applicable
Pebble Beach Company Inclusionary Housing Project Draft Environmental Impact Report 3.9-1 April 2015
ICF 00384.14

Monterey County
Noise and Vibration
Regulatory Setting 1
Federal and State 2
There are no federal regulations applicable to the Project concerning noise. 3
California requires each local government entity to implement a noise element as part of its general 4 plan. California Code of Regulations (CCR), Title 24 (also known as the California Uniform Building 5 Code), has guidelines for evaluating the compatibility of various land uses as a function of 6 community noise exposure. Monterey County has developed noise compatibility standards based on 7 these guidelines. The County’s standards are addressed below. 8
Local 9
2010 Monterey County General Plan 10
The Project site is within Monterey County. The County has established policies and regulations 11 concerning the generation and control of noise that could adversely affect its citizens and noise-12 sensitive land uses. The 2010 Monterey County General Plan provides an overall framework for 13 development in the jurisdiction and protection of its natural and cultural resources. 14
Safety Element 15
The General Plan’s Safety Element contains the following planning guidelines relating to noise. 16
Goal S-7: Maintain a healthy and quiet environment free from annoying and harmful sounds. 17 Policy S-7.1: New noise-sensitive land uses may only be allowed in areas where existing and 18 projected noise levels are “acceptable” according to “Land Use Compatibility for Community Noise 19 Table” (included as Table 3.9-2 below). A Community Noise Ordinance shall be established 20 consistent with said Table that addresses, but is not limited to the following: 21
a. Capacity-related roadway improvement projects. 22 b. Construction-related noise impacts on adjacent land uses. 23 c. New residential land uses exposed to aircraft operations at any airport or air base. 24 d. Site planning and project design techniques to achieve acceptable noise levels such as: 25
building orientation, setbacks, earthen berms, and building construction practices. The use 26 of masonry sound walls for noise control in rural areas shall be discouraged. 27
e. Design elements necessary to mitigate significant adverse noise impacts on surrounding 28 land uses. 29
f. Impulse noise. 30 g. Existing railroad locations & noise levels. 31
Policy S-7.2: Proposed development shall incorporate design elements necessary to minimize noise 32 impacts on surrounding land uses and to reduce noise in indoor spaces to an acceptable level. 33 Policy S-7.3: Development may occur in areas identified as “normally unacceptable” provided 34 effective measures to reduce both the indoor and outdoor noise levels to acceptable levels are taken. 35 Policy S-7.6: Acoustical analysis shall be part of the environmental review process for projects 36 when: 37
Pebble Beach Company Inclusionary Housing Project Draft Environmental Impact Report 3.9-2 April 2015
ICF 00384.14

Monterey County
Noise and Vibration
a. Noise sensitive receptors are proposed in areas exposed to existing or projected noise levels 1 that are “normally unacceptable” or higher according to Table 3.9-2. 2
b. Proposed noise generators are likely to produce noise levels exceeding the levels shown in 3 the adopted Community Noise Ordinance when received at existing or planned noise-4 sensitive receptors. 5
Table 3.9-2. Monterey County Community Noise Exposure Levels (Ldn or CNEL, dBA) 6
Land Use Category 55 60 65 70 75 80 Interpretation: Residential – Low Density Single Family, Duplex, Mobile Homes
Normally Acceptable Specified land use is satisfactory,
based upon the assumption that any buildings involved are of normal conventional construction, without
Residential – Multi Family Conditionally
New construction or development should be undertaken only after a detailed analysis of the noise reduction requirements is made and needed noise insulation features included in the design.
Transient Lodging – Motels, Hotels
Schools, Libraries, Churches, Hospitals, Nursing Homes
Normally Unacceptable New construction or development
should generally be discouraged. If new construction or development does proceed, a detailed analysis of the noise reduction requirements must be made and needed noise insulation features included in the design.
Auditoriums, Concert Halls, Amphitheaters
Sports Arena, Outdoor Spectator Sports
Cleary Unacceptable New construction or development
should generally not be undertaken.
Playgrounds, Neighborhood Parks
Golf Courses, Riding Stables, Water Recreation, Cemeteries
Office Buildings, Business Commercial and Professional
Industrial, Manufacturing, Utilities, Agriculture
Source: 2010 Monterey County General Plan Safety Element Table S-2 (County of Monterey 2010). Ldn = day-night level. CNEL = community noise equivalent level. dBA = A-weighted decibel.
Pebble Beach Company Inclusionary Housing Project Draft Environmental Impact Report 3.9-3 April 2015
ICF 00384.14

Monterey County
Noise and Vibration
Policy S-7.7: All discretionary residential projects that are within roadway or railroad noise 1 contours of 60 CNEL or greater shall include a finding of consistency with the provisions of the Noise 2 Hazards section of the Safety Element. If found that roadway noise exceeds the 60 CNEL within the 3 project site, a project-specific noise impact analysis shall be required. If impacts are identified, the 4 applicant shall conduct mitigation analysis using published Caltrans/Federal Highway 5 Administration guidelines and implement mitigation measures as required. Mitigation measures may 6 include, but are not limited to sound walls, adjacent roadway design, dual pane glass, building 7 location or design, etc. Any proposed mitigation measures shall be concurrently implemented with 8 the implementation of the project. 9 Policy S-7.8: All discretionary projects that propose to use heavy construction equipment that has 10 the potential to create vibrations that could cause structural damage to adjacent structures within 11 100 feet shall be required to submit a pre-construction vibration study prior to the approval of a 12 building permit. Projects shall be required to incorporate specified measures and monitoring 13 identified to reduce impacts. Pile driving or blasting are illustrative of the type of equipment that 14 could be subject to this policy. 15 Policy S-7.9: No construction activities pursuant to a County permit that exceed “acceptable” levels 16 listed in Policy S-7.1 shall be allowed within 500 feet of a noise sensitive land use during the evening 17 hours of Monday through Saturday, or anytime on Sunday or holidays, prior to completion of a noise 18 mitigation study. Noise protection measures, in the event of any identified impact, may include but 19 not be limited to: 20 Constructing temporary barriers, or 21 Using quieter equipment than normal. 22 Policy S-7.10: Construction projects shall include the following standard noise protection measures: 23 Construction shall occur only during times allowed by ordinance/code unless such limits are 24
waived for public convenience; 25 All equipment shall have properly operating mufflers; and 26 Lay-down yards and semi-stationary equipment such as pumps or generators shall be located as 27
far from noise-sensitive land uses as practical. 28
In addition to the County’s land use compatibility guidelines summarized above, Monterey County 29 has established 70 decibels (dB) as the maximum acceptable noise level for residential uses 30 (Monterey County 2010). 31
Monterey County Noise Control Ordinance 32
Chapter 10.60, Noise Control, of the Monterey County Noise Ordinance (part of the Monterey County 33 Code), is legally enforceable. On December 16, 2014, the Noise Ordinance was amended and adopted 34 by the County Board of Supervisors. Section 10.60.030 of the County’s Noise Ordinance prohibits the 35 operation at any time of day of “any machine, mechanism, device, or contrivance which produces a 36 noise level exceeding 85 dBA [A-weighted decibels], measured fifty feet” from the noise source. This 37 ordinance is only applicable to noise generated within 2,500 feet of any occupied dwelling unit. For 38 the purposes of this analysis, this standard is interpreted as applying to noise generated by 39 construction equipment and activities. Section 10.60.040 of the County’s Noise Ordinance regulates 40 nighttime noise within the county and prohibits any loud and unreasonable sound any day of the 41 week between 10:00 p.m. and 7:00 a.m. Section 10.60.040 defines a loud and unreasonable sound as 42 being any sound in excess of the levels specified in Table 3.9-3. 43
Pebble Beach Company Inclusionary Housing Project Draft Environmental Impact Report 3.9-4 April 2015
ICF 00384.14

Monterey County
Noise and Vibration
Table 3.9-3. County of Monterey Noise Control Ordinance Exterior Noise Level Standards 1 (Nighttime Only) 2
Standard (dBA) Nighttime hourly equivalent sound level (Leq) 45 Maximum level (Lmax) 65 Source: Monterey County Code, Title 10, Chapter 10.60 (Noise Control). dBA = A-weighted decibel.
Environmental Setting 3
Terminology 4
The following is a brief background discussion of noise terminology: 5
Sound. A vibratory disturbance created by a vibrating object that, when transmitted by pressure 6 waves through a medium such as air, is capable of being detected by a receiving mechanism, 7 such as the human ear or a microphone. 8
Noise. Sound that is loud, unpleasant, unexpected, or otherwise undesirable. 9
Decibel (dB). A unitless measure of sound on a logarithmic scale, which indicates the squared 10 ratio of sound pressure amplitude to a reference sound pressure amplitude. The reference 11 pressure is 20 micropascals. 12
A-Weighted Decibel (dBA). An overall frequency-weighted sound level in decibels that 13 approximates the frequency response of the human ear. 14
Maximum Sound Level (Lmax). The maximum sound level measured during the measurement 15 period. 16
Minimum Sound Level (Lmin). The minimum sound level measured during the measurement 17 period. 18
Equivalent Sound Level (Leq). The equivalent steady-state sound level that, in a stated period 19 of time, would contain the same acoustical energy. 20
Percentile-Exceeded Sound Level (Lxx). The sound level exceeded “x” percent of a specific 21 time period. For instance, L10 is the sound level exceeded 10% of the time. 22
Day-Night Level (Ldn). The energy average of the A-weighted sound levels occurring during a 23 24-hour period, with 10 dB added to the A-weighted sound levels occurring from 10 p.m. to 24 7 a.m. 25
Community Noise Equivalent Level (CNEL). The energy average of the A-weighted sound 26 levels occurring during a 24-hour period, with 5 dB added to the A-weighted sound levels 27 occurring from 7 p.m. to 10 p.m. and 10 dB added from 10 p.m. to 7 a.m. 28
Ldn and CNEL values rarely differ by more than 1 dB. As a matter of practice, they are considered 29 equivalent and are treated as such in this assessment. Human sound perception is generally 30 such that a change in sound level of 3 dB is just noticeable, a change of 5 dB is clearly noticeable, 31
Pebble Beach Company Inclusionary Housing Project Draft Environmental Impact Report 3.9-5 April 2015
ICF 00384.14

Monterey County
Noise and Vibration
and a change of 10 dB is perceived as doubling or halving the sound level. The County’s exterior 1 community noise standards are expressed as “Ldn or CNEL.” In this report, references to these 2 standards use the term Ldn. 3
Vibration Velocity Level (or Vibration Decibel Level, VdB). The root mean square velocity 4 amplitude for measured ground motion expressed in dB. 5
Peak Particle Velocity (PPV). A measurement of ground vibration defined as the maximum 6 speed at which a particle in the ground is moving, expressed in inches per second (in/sec). 7
Noise and Sound 8
Noise is commonly defined as unwanted sound that annoys or disturbs people and potentially 9 causes an adverse psychological or physiological effect on human health. Because noise is an 10 environmental pollutant that can interfere with human activities, evaluation of noise is necessary 11 when considering the environmental impacts of a proposed project. 12
Sound is characterized by various parameters that include the rate of oscillation of sound waves 13 (frequency), the speed of propagation, and the pressure level or energy content (amplitude). In 14 particular, the sound pressure level is the most common descriptor used to characterize the 15 loudness of an ambient (existing) sound level. Although the decibel (dB) scale, a logarithmic 16 scale, is used to quantify sound intensity, it does not accurately describe how sound intensity is 17 perceived by human hearing. The human ear is not equally sensitive to all frequencies in the 18 entire spectrum, so noise measurements are weighted more heavily for frequencies to which 19 humans are sensitive in a process referred to as “A-weighted decibels” (dBA). Table 3.9-4 20 summarizes typical A-weighted sound levels for different noise sources. 21
Human sound perception, in general, is such that a change in sound level of 1 dB cannot typically be 22 perceived by the human ear; a change in sound level of 3 dB is just noticeable; a change of 5 dB is 23 clearly noticeable; and a change of 10 dB is perceived as doubling or halving the sound level. A 24 doubling of actual sound energy is required to result in a 3 dB (i.e., barely noticeable) increase in 25 noise; in practice, for example, this means that the volume of traffic on a roadway would typically 26 needs to double to result in a noticeable increase in noise. 27
The decibel level of a sound decreases (or attenuates) exponentially as the distance from the source 28 of that sound increases. For a point source such as a stationary compressor or construction 29 equipment, sound attenuates at a rate of 6 dB per doubling of distance. For a line source such as free 30 flowing traffic on a freeway, sound attenuates at a rate of 3 dB per doubling of distance (California 31 Department of Transportation 2013). Atmospheric conditions including wind, temperature 32 gradients, and humidity can change how sound propagates over distance and can affect the level of 33 sound received at a given location. The degree to which the ground surface absorbs acoustical 34 energy also affects sound propagation. Sound that travels over an acoustically absorptive surface 35 such as grass attenuates at a greater rate than sound that travels over a hard surface such as 36 pavement. The increased attenuation is typically in the range of 1 to 2 dB per doubling of distance. 37 Barriers such as buildings and topography that block the line of sight between a source and receiver 38 also increase the attenuation of sound over distance. 39
Pebble Beach Company Inclusionary Housing Project Draft Environmental Impact Report 3.9-6 April 2015
ICF 00384.14

Monterey County
Noise and Vibration
Table 3.9-4. Typical A-Weighted Sound Levels 1
Common Outdoor Activities Sound Level (dBA) Common Indoor Activities
110 Rock band
Jet flyover at 1,000 feet
100
Gas lawnmower at 3 feet
90
Diesel truck at 50 mph at 50 feet Food blender at 3 feet
80 Garbage disposal at 3 feet
Noisy urban area, daytime Gas lawnmower at 100 feet 70 Vacuum cleaner at 3 feet Commercial area Normal speech at 3 feet Heavy traffic at 300 feet 60
Large business office Quiet urban area, daytime 50 Dishwasher in next room
Quiet urban area, nighttime 40 Theater, large conference room (background)
Quiet suburban area, nighttime
30 Library
Quiet rural area, nighttime Bedroom at night, concert hall (background) Rustling of leaves 20
Broadcast/recording studio
10
Lowest threshold of human hearing 0 Lowest threshold of human hearing Source: California Department of Transportation 2013.
Community noise environments are generally perceived as “quiet” when the 24-hour average noise 2 level is below 45 dBA, “moderate” in the 45 to 60 dBA range, and “loud” above 60 dBA. Very noisy 3 urban residential areas are usually around 70 dBA CNEL. Along major thoroughfares, roadside noise 4 levels are typically between 65 and 75 dBA CNEL. Increments of 3 to 5 dB to existing 1-hour Leq, or 5 to the CNEL, are commonly used as thresholds for an adverse community reaction to a noise 6 increase. However, there is evidence that incremental thresholds in this range may not be 7 sufficiently protective in areas where noise-sensitive uses are located and CNEL is already high (i.e., 8 above 60 dBA). In these areas, limiting noise increases to 3 dB or less is recommended (Federal 9 Transit Administration 2006). Noise intrusions that cause short-term interior levels to rise above 45 10 dBA at night can disrupt sleep. Exposures to noise levels greater than 85 dBA of 8-hours or longer 11 can cause permanent hearing damage. 12
Ground-borne Vibration 13
Ground-borne vibration is an oscillatory motion of the soil with respect to the equilibrium position 14 and can be quantified in terms of velocity or acceleration. Ground-borne vibration can be a serious 15
Pebble Beach Company Inclusionary Housing Project Draft Environmental Impact Report 3.9-7 April 2015
ICF 00384.14

Monterey County
Noise and Vibration
concern for nearby neighbors of a transit system route or maintenance facility, as it can cause 1 buildings to shake and generate rumbling sounds. It is unusual for vibration from sources such as 2 buses and trucks to be perceptible, even in locations close to major roads. Some common sources of 3 ground-borne vibration are trains, buses on rough roads, heavy vehicles over bumps and 4 construction activities such as blasting, pile driving, and operating heavy earth-moving equipment. If 5 a roadway is smooth, the ground-borne vibration and noise from traffic is rarely perceptible. 6
Ground-borne vibration can be quantified by its peak or root-mean-square (RMS) velocity 7 amplitudes. The RMS amplitude is useful for assessing human annoyance; the RMS amplitude is 8 expressed in terms of the velocity level in decibel units (VdB). The peak amplitude is most often 9 used for assessing the potential for damage to building structures; the peak amplitude is typically 10 assessed in terms of peak particle velocity (PPV), measured in inches per second. 11
In extreme cases, ground-borne vibrations can cause damage to buildings. Building damage is not a 12 factor for normal transportation projects, with the occasional exception of blasting and pile driving 13 during construction. Annoyance from vibration often occurs when the vibration exceeds the 14 threshold of perception by only a small margin. A vibration level that causes annoyance is well 15 below the damage threshold for normal buildings. 16
Table 3.9-5 summarizes the typical ground-borne vibration velocity levels and average human 17 response to vibration that may be anticipated when a person is at rest in quiet surroundings. If the 18 person is engaged in any type of physical activity, vibration tolerance increases considerably. The 19 duration of the event has an effect on human response, as does its daily frequency of occurrence. 20 Generally, as the duration and frequency of occurrence increase, the potential for adverse human 21 response increases. 22
The background vibration velocity level in residential areas is usually around 50 VdB or lower. The 23 vibration velocity level threshold of perception for humans is approximately 65 VdB. Most 24 perceptible indoor vibration is caused by sources within buildings, such as the operation of 25 mechanical equipment, movement of people, or the slamming of doors. Typical outdoor sources of 26 perceptible ground-borne vibration are heavy construction equipment, steel-wheeled trains, and 27 traffic on rough roads. If a roadway is smooth, the ground-borne vibration from traffic is rarely 28 perceptible. 29
Ground-borne noise is a secondary phenomenon of ground-borne vibration. When building 30 structure vibrates, noise is radiated into the interior of the building. Typically, this is a low 31 frequency sound that would be perceived as a low rumble. The magnitude of the sound depends on 32 the frequency characteristic of the vibration and the manner in which the room surfaces in the 33 building radiate sound. Ground-borne noise is quantified by the A-weighted sound level inside the 34 building. The sound level accompanying vibration is generally 25 to 40 dBA lower than the vibration 35 velocity level in VdB. Ground-borne vibration levels of 65 VdB can result in ground-borne noise 36 levels up to 40 dBA, which can disturb sleep. Ground-borne vibration levels of 85 VdB can result in 37 ground-borne noise levels up to 60 dBA, which can be annoying to daytime noise-sensitive land uses 38 such as schools (Federal Transit Administration 2006). 39
Pebble Beach Company Inclusionary Housing Project Draft Environmental Impact Report 3.9-8 April 2015
ICF 00384.14

Monterey County
Noise and Vibration
Table 3.9-5. Typical Levels of Ground-Borne Vibration 1
Human or Structural Response Vibration Velocity Level (VdB)
Typical Sources (50 feet from source)
Threshold for minor cosmetic damage to fragile buildings 100 Blasting from construction project
Bulldozer or heavy tracked construction equipment
Difficulty in reading computer screen 90 Upper range of commuter rail Threshold for residential annoyance for occasional events (e.g. commuter rail) 80 Upper range of rapid transit
Threshold for residential annoyance for frequent events (e.g. rapid transit) Typical commuter rail.
Bus or truck over bump 70 Typical rapid transit Approximate threshold for human perception of vibration Limit for vibration-sensitive equipment
Typical bus or truck on public road
60 Typical background vibration 50 Source: Federal Transit Administration 2006.
Existing Noise Levels 2
The most significant and common source of noise in the vicinity of the Project site is vehicles 3 traveling on local roadways. Other typical noise sources in the Project vicinity include distant traffic, 4 wind in the trees, birds overhead, dogs barking, landscape and golf course maintenance, 5 construction activities, and occasional aircraft overflights. 6
Background noise level measurements were conducted in September 2014 to characterize the 7 typical ambient noise levels where noise-sensitive uses are located. Long-term noise measurements 8 were taken at two locations on the Project site, and short-term measurements were taken at three 9 locations adjacent to the Project site (Figure 3.9-1). 10
Long-Term Noise Measurements 11
Monitoring equipment used to assess long-term noise for the study consisted of Larson-Davis 12 Laboratories Model 720 sound level meters. Noise level monitoring was conducted over a 13 continuous 24-hour period at the proposed building façade facing SFB Morse Drive and over a 14 continuous 48-hour period near the proposed parking lot near Miles Avenue. The results of the long-15 term ambient noise level measurements are presented in Table 3.9-6. 16
Pebble Beach Company Inclusionary Housing Project Draft Environmental Impact Report 3.9-9 April 2015
ICF 00384.14

Monterey County
Noise and Vibration
Table 3.9-6. Summary of Long-Term Noise Level Measurements 1
Site ID Measurement Location
Measurement Period
Noise Sources
Measurement Results (dBA)
Date Start Time
Duration (hours)
Daytime Leq (7 a.m.–10 p.m.)
Nighttime Leq (10 p.m.–7 a.m.) Ldn
LT-1 Proposed building façade facing SFB Morse Drive
9/9/2014 12:00 24 Distant traffic noise on SFB Morse Drive
47.4 41.4 49.4
LT-2 Proposed parking lot near Miles Avenue
9/9/2014 12:00 48 Distant traffic noise on Miles Avenue and SFB Morse Drive.
42.8 38.1 45.1
Note: Noise measurement locations are shown in Figure 3.9-1. dBA = A-weighted decibel. Leq = equivalent sound level. Ldn = day-night level.
Short-Term Noise Measurements 2
Monitoring equipment used to assess short-term noise for the study consisted of a Larson-Davis 3 Laboratories Model 812 sound level meter. Three 15-minute noise level measurements were 4 conducted over a period of one Tuesday adjacent to Congress Road and Lawton Avenue. The results 5 of the long-term traffic noise monitoring are presented in Table 3.9-7. 6
Table 3.9-7. Summary of Short-Term Noise Level Measurements 7
Site ID Location
Start Timea Noise Sources
Measurement Results (dBA) Leq Lmax Lmin L10 L33 L50 L90
ST-1 2912 Congress Rd.
12:05 Vehicles on Congress Road, distant traffic noise on SFB Morse Drive
52.3 73.3 37.6 50.8 45.8 42.5 38.5
ST-2 2874 Congress Rd.
12:45 Vehicles on Congress Road, distant traffic on SFB Morse Drive
46.8 58.9 39.0 49.5 46.2 44.7 41.8
ST-3 1339 Lawton Ave.
13:40 Vehicles on Lawton Avenue, distant traffic noise
47.8 68.1 38.5 47.0 42.8 41.7 39.8
Notes: Noise measurement locations are shown in Figure 3.9-1. a All noise measurements were taken on September 11, 2014 and lasted 15 minutes. dBA = A-weighted decibel. Leq = equivalent sound level. Lmax = maximum sound level. Lmin = minimum sound level. L10 = sound level exceeded 10% of the time. L33 = sound level exceeded 33% of the time. L50 = sound level exceeded 50% of the time. L90 = sound level exceeded 90% of the time.
Pebble Beach Company Inclusionary Housing Project Draft Environmental Impact Report 3.9-10 April 2015
ICF 00384.14

PACIFIC
GROVE
PEBBLE BEACH
CONGRESS RD
ORTEGA RD
Source: Pebble Beach Company 2013.
Gra
phic
s …
003
84.1
4 (2
-9-2
015)
Figure 3.9-1Noise Measurement Locations
CONGRESS RD
LegendShort Term Noise Measurement Location
Long Term Noise Measurement Location
Project Site
Feet
120 180600
ST2
ST3
ST1
ST1
LT1
LT1LT2

Monterey County
Noise and Vibration
Existing Ground-Borne Vibration Levels 1
The most common sources of ground-borne vibration in the Project vicinity are construction 2 activities and roadway truck traffic. Large delivery trucks typically generate ground-borne vibration 3 velocity levels around 63 VdB at 50 feet from the source (Federal Transit Administration 2006). As 4 described above, the vibration velocity level threshold of perception for humans is approximately 65 5 VdB. Therefore, existing traffic vibration is neither distinctly nor generally perceptible. Additionally, 6 vibration velocity levels around 63 VdB would generally not produce ground-borne noise that 7 would disturb sleep. 8
Sensitive Receptors 9
Noise-sensitive land uses are generally defined as locations where people reside or where the 10 presence of unwanted sound could adversely affect the use of the land. Noise-sensitive land uses 11 typically include residences, hospitals, schools, guest lodgings, libraries and certain types of passive 12 recreational uses, such as parks to be used for reading, conversation, meditation, and similar uses 13 (Federal Transit Administration 2006). As a matter of practice, frequent human use is considered to 14 occur at exterior locations where people are exposed to roadway noise for at least 1 hour on a 15 regular basis. 16
There are sensitive receptors on three sides of the Project site. The Del Monte Park residential 17 neighborhood is adjacent to the east. Pebble Beach residential areas are to the north and west, and 18 undeveloped open space is to the south. The closest sensitive receptors to the proposed 19 development site are the residences of Miles Avenue approximately 50 feet away from the eastern 20 edge of the Morse Court parking spaces. Refer to Figures 2-3 in Chapter 2, Project Description. 21
The nearest recreational uses are the formal recreation trails located south of the Project site in the 22 approximately 84-acre SFB Morse Botanical Reserve and the 372-acre Huckleberry Hill Natural 23 Habitat Area, south of SFB Morse Drive (refer to Figure 3.8-3 in Section 3.8, Land Use and 24 Recreation). Trails and open space in the general vicinity of the Project site are primarily used for 25 active recreation (e.g., hiking, equestrian use). Recreationalists in these areas are not considered 26 noise-sensitive receptors for this analysis because they are mobile through the open space or along 27 trails and would thus be exposed to noise levels only from Project sources or roadways for a short 28 duration of time in any one location, and then would have attenuated noise levels as they moved 29 away from the noise source location. 30
Additionally, there are unofficial trails on the Project site used for walking and off-road biking, 31 including a series of man-made jumps and berms. People using these trails are not considered noise-32 sensitive receptors for this analysis because the Project site is private property not designated for 33 recreational use. 34
Pebble Beach Company Inclusionary Housing Project Draft Environmental Impact Report 3.9-11 April 2015
ICF 00384.14

Monterey County
Noise and Vibration
Impacts Analysis 1
Methodology 2
Approach 3
This analysis evaluates noise and vibration impacts at the sensitive receptors from the short-term 4 construction and long-term operation of residential use at the Project site. These impacts are 5 determined through comparison with the significance criteria in the following section. Where 6 impacts are identified, appropriate mitigation measures are provided to reduce impacts to a less-7 than-significant level. The dominant source of noise increase is anticipated to be from traffic 8 generated by the Project. Traffic noise impacts were evaluated using existing and predicted future 9 traffic volumes provided by the Project’s traffic engineers (Appendix C) and a spreadsheet model 10 based on the Federal Highway Administration’s (FHWA’s) Traffic Noise Model. For the predicted 11 future traffic volumes, the cumulative operational year (2030) used for the traffic analysis was used, 12 as it is the year with the greatest traffic volumes and noise levels, to provide a conservative noise 13 analysis. 14
Criteria for Determining Significance 15
In accordance with CEQA, the State CEQA Guidelines, Monterey County plans and policies, and 16 agency and professional standards, a project impact would be considered significant if the project 17 would result in any of the following conditions. 18
Long-Term Noise Increases 19
Expose persons to or generate noise levels in excess of standards established in the County’s 20 Land Use Compatibility for Exterior Community Noise chart and result in a significant increase 21 in noise levels over existing noise levels (i.e., >5-dB increase in noise where existing noise levels 22 are less than 60 dBA Ldn, >3-dB increase in noise where existing noise levels are between 60 and 23 65 dBA Ldn, or a >1.5-dB increase in noise where existing noise levels are more than 65 dBA Ldn). 24
Short-Term Noise Increases 25
Expose outdoor activity areas of noise-sensitive land uses to construction noise of more than 26 85 dB at 50 feet between the hours of 7:00 am and 10:00 pm or 45 dBA, Leq/65 dBA, Lmax 27 between10:00 pm and 7:00 am. 28
Vibration 29
Generate ground-borne vibration and noise at nearby residences in excess vibration level of 83 30 VdB and noise level of 48 dBA1. 31
1 Neither the County’s General Plan nor the Noise Ordinance establishes thresholds for ground-borne vibration or noise. The Federal Transit Administration vibration and noise impact thresholds for infrequent events are used to assess ground-borne vibration and noise. Infrequent events are defined as fewer than 30 vibration events of the same kind per day. The thresholds for residences and buildings where people normally sleep are 80 VdB for ground-borne vibration and 43 dBA for ground-borne noise, which are the thresholds for residential annoyance for occasional events, while the thresholds for institutional buildings with primarily daytime use (such as schools, churches, and quiet offices) are 83 VdB for ground-borne vibration and 48 dBA for ground-borne noise.
Pebble Beach Company Inclusionary Housing Project Draft Environmental Impact Report 3.9-12 April 2015
ICF 00384.14
Monterey County
Noise and Vibration
Project Impacts and Mitigation Measures 1
A. Long-Term Noise Increases 2
Impact NOI-A1. The Project could result in exposure of persons to noise levels in excess of 3 standards established in the County’s Land Use Compatibility for Community Noise chart. 4 (Less than significant) 5
Operation of 24 residential units at the Project would increase noise levels in the vicinity of the 6 Project site. This noise could include human voices, music, cars idling, and traffic noise. Traffic noise 7 levels are anticipated to be the most noticeable and, therefore, are discussed further below. The 8 other noises generated by the residential land use are anticipated to be between 40 and 50 dBA, 9 based on the typical sound levels described (Table 3.9-4), which would be well below the County’s 10 established noise thresholds. Additionally, the open space preservation area surrounding the new 11 residential development would serve as a noise buffer. 12
The dominant source of noise increase would be traffic generated by the Project. To provide for a 13 conservative analysis, the cumulative operational year (2030) is used for comparison with existing 14 conditions. Traffic noise levels for existing (2014) and future (2030) conditions have been modeled 15 for receivers at various locations in the general vicinity of the Project site using the FHWA Traffic 16 Noise Model and traffic volumes provided by the project traffic engineers (see Appendix G, Noise 17 Calculations). This model calculates an Ldn value based on the predicted daily traffic volume. The 18 traffic data used in this analysis (vehicle volume, truck mix, vehicle speed, and day/night traffic 19 distribution) were based on data provided by the project traffic consultant (Appendix C) and PBC. 20 Noise exposure at 50 and 100 feet from roadway centerlines was calculated for existing (2014) and 21 the cumulative operational year (2030) conditions. Appendix G provides the calculations of traffic 22 noise. The results of noise modeling are presented in Table 3.9-8. 23
The results in Table 3.9-8 indicate that cumulative traffic noise levels with the Project in 2030 are 24 expected to increase by 1 dB over existing (2014) conditions at all evaluated roadway segments. 25 Table 3.9-8 also indicates that the Project would not contribute to noise level increases (i.e., 26 changes in noise levels between 2030 with and without the Project), as noise level increases are 27 projected at 0 dB between the without Project and with Project conditions. Table 3.9-2 shows the 28 standards for exterior noise exposure in the Safety Element. 29
There are residences located to the north, west, and east of the Project site. They would be buffered 30 from the new residential development by the surrounding open space preservation areas. The 31 closest sensitive receptor locations are the residences to the east on Miles Avenue, which are 32 approximately 50 feet away from the development site boundary (Figure 2-3). The nearest 33 evaluated major roadway in the vicinity of the project site is SFB Morse Drive, between Congress 34 Road and State Route 68. As indicated in Table 3.9-8, project-related traffic noise along this 35 segment and all evaluated segments would be well below the County’s noise standards (Table 3.9-36 2). The acceptable increases in noise over existing noise levels are listed below. 37
As indicated in Chapter 2, Project Description, construction activities would be limited to the hours of 8:00 a.m. to 6:00 p.m. and would not occur during nighttime hours. Therefore, the residential ground-borne vibration and noise threshold for buildings where people normally sleep are not used, and the industrial thresholds are used to evaluate impacts.
Pebble Beach Company Inclusionary Housing Project Draft Environmental Impact Report 3.9-13 April 2015
ICF 00384.14

Monterey County
Noise and Vibration
>5-dB increase in noise where existing noise levels are less than 60 dBA, Ldn. 1
>3-dB increase in noise where existing noise levels are between 60 and 65 dBA Ldn. 2
>1.5-dB increase in noise where existing noise levels are more than 65 dBA, Ldn. 3
As presented in Table 3.9-8, the increases in noise from the Project would be less than these 4 acceptable increases in noise (i.e., increases in noise would all be below the minimal accepted 5 increase of 1.5 dBA, Ldn). Therefore, the impacts related to traffic noise would be less than 6 significant. 7
Pebble Beach Company Inclusionary Housing Project Draft Environmental Impact Report 3.9-14 April 2015
ICF 00384.14

Monterey County
Noise and Vibration
Table 3.9-8. Traffic Noise Exposure at Typical Residential Setbacks, Existing (2014) and 2030 Conditions
Roadway Segment Location
2014 Traffic Noise (dB Ldn)
2030 Traffic Noise (dB Ldn)
Change Project Contribution
2030 With Project minus Existing
2030 With Project minus 2030 No
Project Existing 50 feet
Existing 100 feet
No Project With Project 50 feet 100 feet 50 feet 100 feet 50 feet 100 feet 50 feet 100 feet
Congress Avenue Forest Lodge Road-David Avenue 63 60 63 60 63 60 1 1 0 0 Forest Lodge Road Congress Road-Congress Avenue 61 57 61 58 61 58 1 1 0 0 SFB Morse Avenue/ SFB Morse Drive
Congress Road-State Route 68 59 56 60 56 60 56 1 1 0 0
David Avenue East of Congress Avenue 62 59 63 59 63 59 1 1 0 0 David Avenue West of State Route 68 63 59 63 60 63 60 1 1 0 0 State Route 68 South of David Avenue 69 65 69 66 69 66 1 1 0 0 State Route 68 North of SFB Morse Avenue 70 66 70 67 70 67 1 1 0 0
Pebble Beach Company Inclusionary Housing Project Draft Environmental Impact Report 3.9-15 April 2015
ICF 00384.14

Monterey County
Noise and Vibration
B. Short-Term Noise Increases 1
Impact NOI-B1. The Project would result in exposure of outdoor activity areas of noise-2 sensitive land uses to construction noise greater than 85 dB at a distance of 50 feet during 3 construction. (Less than significant with mitigation) 4
Potential noise impacts resulting from construction of the Project were evaluated by estimating the 5 amount of noise generated on the theoretical worst-case day of construction activity. A detailed 6 inventory of construction equipment was obtained from the Project applicant. Table 3.9-9 lists the 7 noise generation levels for construction equipment associated with the Project. The list, compiled by 8 FHWA (2006), was used in this analysis to estimate construction noise. The magnitude of 9 construction noise impacts was assumed to depend on the type of construction activity, noise level 10 generated by various pieces of construction equipment, duration of the activity, distance between 11 the activity and noise-sensitive receivers, and any shielding effects that might result from local 12 barriers, including topography. 13
Table 3.9-9. Construction Equipment Noise Emission Levels 14
Equipment Acoustical Utilization Factor (%)
Typical Noise Level at 50 feet from Source (dBA) Lmax Leq
Dozer 40 82 78 Dump truck 40 77 72 Grader 40 85 81 Man Lift 20 75 68 Paver 50 77 74 Roller 20 80 73 Source: Federal Highway Administration 2006. dBA = A-weighted decibel. Leq = equivalent sound level. Lmax = maximum sound level.
A reasonable worst-case noise level resulting from construction of the Project was evaluated by 15 summing the noise levels of the three loudest pieces of equipment that would likely operate at the 16 same time (dozer, grader, and roller), using the standard construction equipment data shown in 17 Table 3.9-9. The combined maximum noise level (Lmax) and combined average noise level (Leq) 18 were determined to be 88 dBA and 83 dBA at 50 feet, respectively, and 85 dBA and 80 dBA at 70 19 feet, respectively. This represents a conservative scenario because it assumes that the three loudest 20 equipment pieces would be operating in the same location simultaneously, which would be an 21 unlikely event. 22
It should be noted that the noise levels in Table 3.9-9 are typical values based on the construction 23 equipment that is likely to be used for Project construction; thus, there could be wide fluctuations in 24 the noise levels, depending on actual site-specific conditions and the type and mix of equipment 25 used at the construction site. 26
Pebble Beach Company Inclusionary Housing Project Draft Environmental Impact Report 3.9-16 April 2015
ICF 00384.14

Monterey County
Noise and Vibration
Table 3.9-10 shows the estimated sound levels from construction activities from the three loudest 1 pieces of equipment as a function of distance, based on calculated point-source attenuation over 2 “soft” (i.e., acoustically absorptive) ground. 3
Table 3.9-10. Calculated Construction Noise Emission Levels 4
Distance between Source and Receiver (feet)
Geometric Attenuation (dB)
Ground Effect Attenuation (dB)
Calculated Lmax Sound Level (dBA)
Calculated Leq Sound Level (dBA)
50 0 0.0 88 83 70 -3 -0.0 85 80
100 -6 -1.5 80 75 200 -12 -3.0 73 68 300 -16 -3.9 68 64 400 -18 -4.5 65 60 550 -21 -5.2 62 57 600 -22 -5.4 61 56 700 -23 -5.7 59 54 800 -24 -6.0 57 53 900 -25 -6.3 56 52 950 -26 -6.4 56 51
1,200 -28 -6.9 53 48 1,400 -29 -7.2 51 47 1,600 -30 -7.5 50 45 1,800 -31 -7.8 49 44 2,000 -32 -8.0 48 43 2,500 -34 -8.5 45 40 3,000 -36 -8.9 43 39 dB = Decibel. dBA = A-weighted decibel. Leq = equivalent sound level. Lmax = maximum sound level.
Table 3.9-10 indicates that the Project would not exceed Monterey County’s Health and Safety 5 Noise Control Ordinance limitations (i.e., significance criteria) of 85 dBA at a distance of 50 feet or 6 less from construction activities. The nearest sensitive receptors to the proposed development site 7 are the residences of Miles Avenue, which are approximately 50 feet away from the eastern edge of 8 the planned Morse Court parking spaces. Although most of the construction activities would occur 9 greater than 50 feet away from the residences, some construction activities in the planned parking 10 area would be at or possibly within 50 feet of the residences. In addition, Table 3.9-10 also 11 indicates construction activities would be in excess of the nighttime (10:00 pm to 7:00 am) noise 12 standards enumerated in the County’s Noise Ordinance (Table 3.9-3). However, as indicated in 13 Chapter 2, Project Description, construction activities would be limited to the hours of 8:00 a.m. to 14 6:00 p.m. and would not occur during nighttime hours defined by the Ordinance (10:00 pm to 7:00 15 am). As there is the potential for construction activities to occur within 50 feet of a residence and 16
Pebble Beach Company Inclusionary Housing Project Draft Environmental Impact Report 3.9-17 April 2015
ICF 00384.14

Monterey County
Noise and Vibration
exceed 85 dBA, Lmax, this impact would be significant; and Mitigation Measure NOI-B1 is required 1 to reduce this impact to a less-than-significant level. 2
Mitigation Measure NOI-B1. Implement noise control measures to reduce construction 3 noise during Project construction. 4
The applicant shall ensure the construction contractor includes the following measures as notes 5 on the construction plans and implements the measures during construction of the Project. 6
Monitor the effectiveness of noise attenuation measures by taking noise measurements 7 during construction activities to evaluate noise levels and determine the need for mitigation 8 to reduce noise below 85 dBA, Lmax at a distance of 50 feet from construction activities. 9
Equipment and trucks used for Project construction shall use the best available noise 10 control techniques (e.g., improved mufflers, equipment redesign, use of intake silencers, 11 ducts, engine enclosures and acoustically attenuating shields or shrouds), wherever feasible. 12
Construction contractors, to the maximum extent feasible, shall be required to use “quiet” 13 gasoline-powered compressors or other electric-powered compressors, and use electric 14 rather than gasoline or diesel powered forklifts for small lifting. 15
Stationary noise sources, such as temporary generators, shall be located as far from nearby 16 receptors as possible, and they shall be muffled and enclosed within temporary enclosures 17 and shielded by barriers, or other measures to the extent feasible. 18
Install temporary noise barriers eight feet in height around the construction site to reduce 19 construction noise to 85 dBA as measured at the applicable property lines of the adjacent 20 uses, unless an acoustical engineer submits documentation that confirms that the barriers 21 are not necessary to achieve the attenuation levels. 22
Trucks shall be prohibited from idling along streets serving the construction site. 23
Monitor the effectiveness of noise attenuation measures by taking noise measurements 24 during construction activities. 25
The applicant shall ensure a monitoring report is prepared that documents the noise 26 measurements and the implementation of the noise-reduction measures. 27
Mitigation Monitoring: Prior to issuance of the first construction permit, the Monterey County 28 Environmental Health Bureau shall review and approve the construction plans for noise control 29 measures to be implemented throughout Project construction. During Project construction, 30 Monterey County Environmental Health Bureau shall review and approve the applicant’s 31 monitoring report. 32
C. Vibration 33
Impact NOI-C1. The Project could result in exposure of persons to or generation of excessive 34 ground-borne vibration or ground-borne noise levels during construction activities. (Less 35 than significant with mitigation) 36
Operation of the Project would consist of typical residential operations and would not involve 37 vibratory or impact equipment that would generate ground-borne vibration and noise after the 38 construction period. Therefore, there would be no ground-borne vibration or noise impacts 39
Pebble Beach Company Inclusionary Housing Project Draft Environmental Impact Report 3.9-18 April 2015
ICF 00384.14

Monterey County
Noise and Vibration
associated with Project operation. Thus, the discussion of vibration impacts focuses on the ground-1 borne vibration and noise associated with equipment during Project construction. 2
During construction, the operation of heavy-duty construction equipment could generate localized 3 ground-borne vibration and noise at buildings adjacent to the construction site. It is anticipated no 4 blasting, pile-driving, or vibratory equipment would be required for Project construction. It is 5 anticipated that grading activities would include soil compaction. However, the equipment 6 inventory provided by the project applicant indicates this would be done with non-vibratory rollers 7 (Table 3.9-9). However, the operation of heavy duty construction equipment, such as bulldozers 8 and off-road trucks, could generate ground-borne vibration and noise at adjacent sensitive land 9 uses. 10
Annoyance thresholds for vibration velocity levels are used to determine the ground-borne 11 vibration and noise impacts at surrounding buildings. Because a vibration level that causes 12 annoyance is well below the damage threshold for normal building (100 VdB), these thresholds are 13 conservative for potential building damage. Table 3.9-11 summarizes typical vibration velocity 14 levels for various types of construction equipment that would be used for the Project. 15
Table 3.9-11. Typical Vibration Levels for Construction Equipment 16
Equipment
Vibration Velocity Level (VdB) 25 Feet from Source
50 Feet from Sourcea
100 Feet from Sourcea
150 Feet from Sourcea
200 Feet from Sourcea
Pile Driver 104 95 86 81 77 Vibratory Roller 94 85 76 71 67 Large Dozer 87 78 69 64 60 Loaded Truck 86 77 68 63 59 Jack Hammer 79 70 61 56 52 Small Dozer 58 49 40 35 31 Source: Federal Transit Administration 2006. a Based on the formula VdB at D feet = VdB at 25 feet – 30 x log (D/25).
Based on the information in Table 3.9-11, the operation of non-impact and vibratory construction 17 equipment, such as a large dozer and loaded truck, could result in vibration levels of 78 VdB or 18 lower at the nearest residences located within 50 feet of earthmoving and grading activities. The 19 sound level accompanying vibration is generally 25 to 40 dBA lower than the vibration velocity level 20 in VdB. Therefore, the ground-borne noise levels from construction activities would be up to 53 dBA 21 at the nearest residences. This level of ground-borne vibration (78 VdB) is below the Federal Transit 22 Administration recommended threshold of 83 VdB, but the corresponding level of noise (53 dBA) 23 could occasionally exceed the 48 dBA threshold identified for the Proposed project. Therefore, the 24 ground-borne vibration and noise impact at residences in the Project vicinity could be potentially 25 significant. Implementation of Mitigation Measure NOI-C1 would reduce this impact to a less-than-26 significant level. 27
Pebble Beach Company Inclusionary Housing Project Draft Environmental Impact Report 3.9-19 April 2015
ICF 00384.14

Monterey County
Noise and Vibration
Mitigation Measure NOI-C1. Identify specific timeframe for construction activities that 1 result in vibration and provide advance notice to adjacent residents; conduct vibration 2 testing, and offer temporary relocation to select residents if vibration levels exceed 3 Federal Transit Administration vibration thresholds. 4
Prior to and during Project construction, the applicant and construction contractor shall ensure 5 that construction scheduling identifies the times and duration of vibration-causing effects 6 associated with earthmoving and grading activities. These construction activities shall be 7 limited to a specified period during the day, as determined by the applicant and construction 8 contractor with approval from Monterey County RMA-Planning. The applicant shall provide 9 advance notice to adjacent residents with 100 feet of vibration-causing activities, and also send 10 a copy of the notice to Monterey County Environmental Health Bureau. 11
Additionally, the applicant and construction contractor shall conduct vibration testing to 12 determine if earthmoving and grading activities result in vibration levels that exceed the Federal 13 Transit Administration recommended ground-borne vibration threshold of 83 VdB and ground-14 borne noise threshold of 48 dBA. If ground-borne vibration or noise levels exceed the 15 thresholds, the applicant shall offer to temporarily relocate residents who will be exposed to 16 vibration levels exceeding threshold levels during grading and excavation activities, and notify 17 the Monterey County Environmental Health Bureau. 18
These requirements shall be included in all relevant construction contracts and shown on 19 construction plans. 20
Mitigation Monitoring: Prior to issuance of the first construction permit, the Monterey County 21 Environmental Health Bureau shall review and approve the construction plans to ensure that 22 construction scheduling identifies the times and duration of vibration-causing effects associated 23 with earthmoving and grading activities. Additionally, the Monterey County Environmental 24 Health Bureau shall ensure that the applicant and construction contractor conduct vibration 25 testing to determine if construction activities will result in vibration levels in excess of FTA’s 26 recommended thresholds. 27
Pebble Beach Company Inclusionary Housing Project Draft Environmental Impact Report 3.9-20 April 2015
ICF 00384.14