Embed Size (px)
Citation preview

1
Scientific Method

2
1. Observation Leads to collecting data Data: The information collected from an experiment.
3
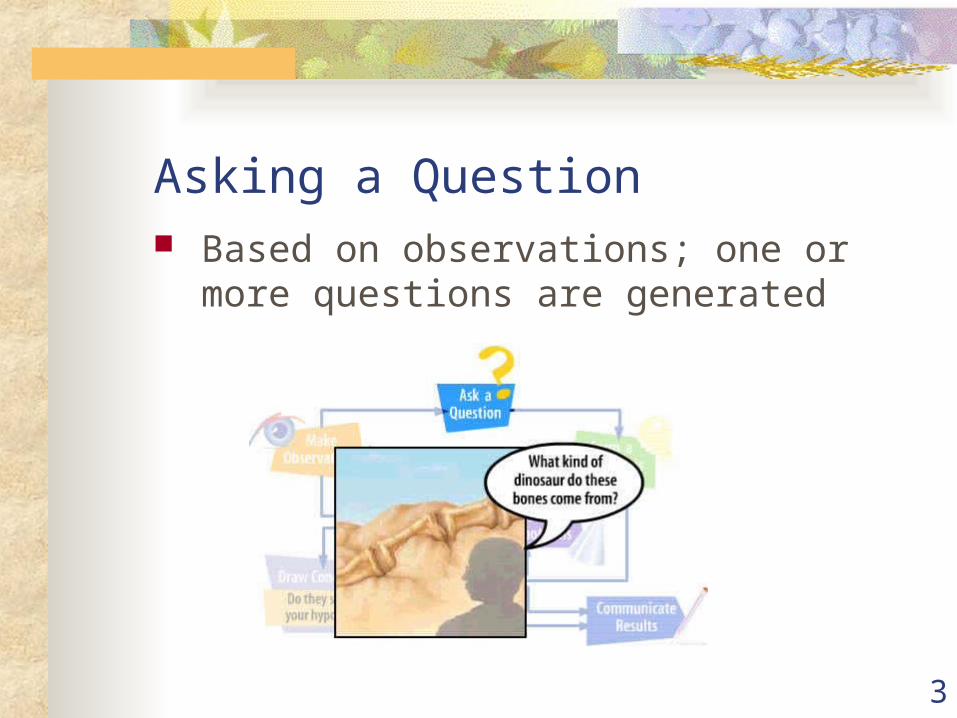
Asking a Question Based on observations; one or more
questions are generated

4
2. Hypothesis hypo (less than) thesis (theory) Explanation for what you have seen and
recorded An educated guess? A question or statement that can be tested. A suggested answer to a well-defined
scientific question - ( an explanation on trial)
5
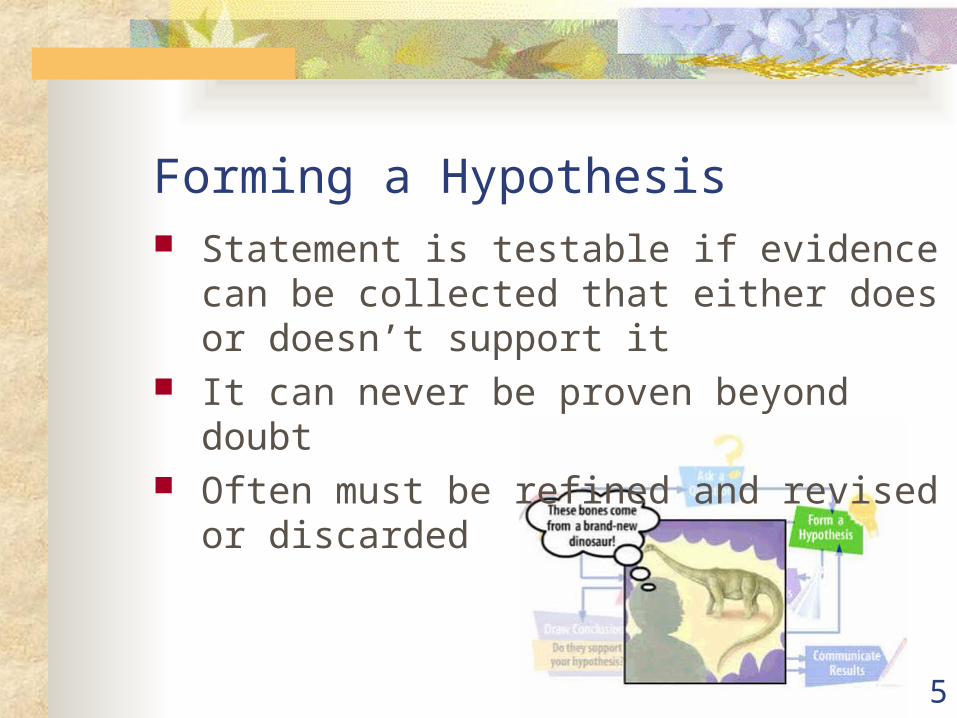
Forming a Hypothesis Statement is testable if evidence can be
collected that either does or doesn’t support it
It can never be proven beyond doubt Often must be refined and revised or
discarded

6
Predicting To test hypothesis it is necessary to make
predictions that logically follows from the hypothesis
A statement made in advance that states the results that will be obtained from testing the hypothesis
Often in the form of an “if-then” statement

7
3. Experiment
A procedure to test a hypothesis, under controlled conditions – conducting a controlled experiment.
8
3 Kinds of Variables
Controlled Variable – a variable that is not changed Also called constants Allow for a “fair test”
Controls ensure that all variables in the experiment are the same except for the variable being tested.

9
3 Kinds of Variables
DRY MIX
Independent Variable – something that is changed or can be manipulated by the scientist What is tested (the treatment) What is manipulated

10
3 Kinds of Variables Dependent Variable – something that might
be affected or responds to by the change in the independent variable What is observed What is measured The data collected during the
investigation (the result of the treatment)

11
For Example:

12
Students of different ages were given the same jigsaw puzzle to put together. They were timed to see how long it took to finish the puzzle.

13
Identify the variables
in this investigation.
14
What was the independent variable?
Ages of the students Different ages were tested by the scientist

15
What was the dependent variable?
The time it takes to put the puzzle together The time was observed and measured by the
scientist

16
What was a controlled variable?
Same puzzle All of the participants were tested with the
same puzzle. It would not have been a fair test if some had
an easy 30 piece puzzle and some had a harder 500 piece puzzle.

17
Another example:

18
An investigation was done with an electromagnetic system made from a battery and wire wrapped around a nail. Different sizes of nails were used. The number of paper clips the electromagnet could pick up was measured.

19
What are the variables in this investigation?
20
Independent variable:
Sizes of nails These were changed by the scientist

21
Dependent variable:
Number of paper clips picked up The number of paper clips observed and
counted (measured)

22
Controlled variables:
Battery, wire, type of nail None of these items were changed

23
One more:

24
The higher the temperature of water, the faster an egg
will boil and cook.
25
Independent variable – temperature of water Dependent variable – time to cook an egg Controlled variable – type of egg

26
Last one:

27
The temperature of water was measured at different depths
of a pond.

28
Independent variable – depth of the water Dependent variable – temperature Controlled variable – thermometer
29
Designing Investigations

30
The greater the amount of soap in a soap and water mixture, the bigger a soap bubble can be blown.
Design an investigation to test this hypothesis. Identify the variables What exactly will be changed? How will it be
changed? What exactly will be measured? How will it be
measured?
31
The farther a ball drops, the higher it will bounce.
Design an investigation to test this hypothesis. Identify the variables What exactly will be changed? How will it be
changed? What exactly will be measured? How will it be
measured?

32
4. Collecting Data Data is data, it isn't right or wrong -
presented in tables, charts, notes or diagrams.
Two Types Quantitative Qualitative

33
Quantitative Dataquantity - measured in numbers
Qualitative Data quality - measured in words
(descriptions)
Types of Data

34
5. Analyzing Data Make interpretations of data by graphing
data, correlating data with facts, using mathematical analysis etc.
35
6. Conclusions Report data - put your numbers into words.
Answer: What was found out and how do you know it to be true? How did it relate to your hypothesis? Did it support or fail to support?

36
Analyze process and repeat All valid data is reproducible

37
Communication Share the results of their studies with other
scientists Publish findings in journals or at scientific
meetings Sharing of information is essential to
scientific process Subject to examination and verification by
other scientists Allows scientists to build on the work of
others
38
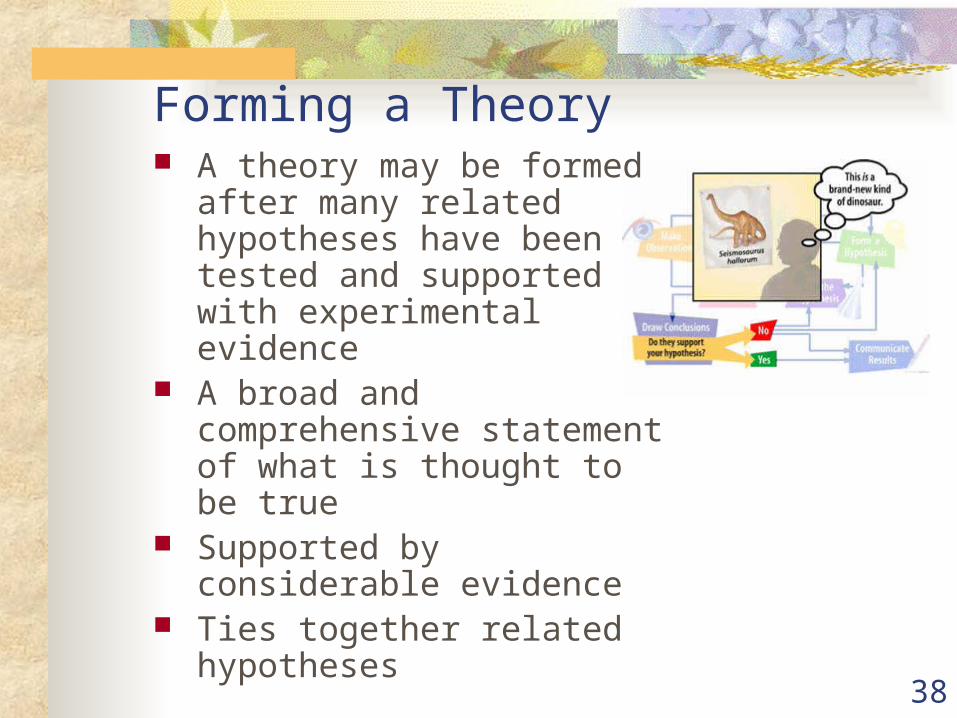
Forming a Theory A theory may be formed
after many related hypotheses have been tested and supported with experimental evidence
A broad and comprehensive statement of what is thought to be true
Supported by considerable evidence
Ties together related hypotheses

39
Theory Explanation supported by a large amount of
evidence obtained from many different investigations over a long period of time.
Common Misconception: Theory defined as a guess is not the scientific definition.
Example: Theory of Evolution

40
Law “Proven” theory - a theory explains a law Examples: Law of Gravity, Law of
Conservation of Energy, Law of Conservation of Matter

41
Measurements
We will be using SI (International System of Measurement ) units or metric system when possible --- get use to it --- the WHOLE world uses it except us (USA)
Examples: length in meters, volume in liters, temperature in Celsius, mass in grams and time in seconds.

42

43

44