Embed Size (px)
Citation preview

1
School Discipline in Arkansas
Kaitlin Anderson, Jennifer Ash, Gary RitterUA Office for Education Policy
July 11, 2014State Board of Education

•AR Education Reports
• Policy Briefs
• Report Cards
• Newsletters
• Data Resources
www.officeforeducationpolicy.org/2
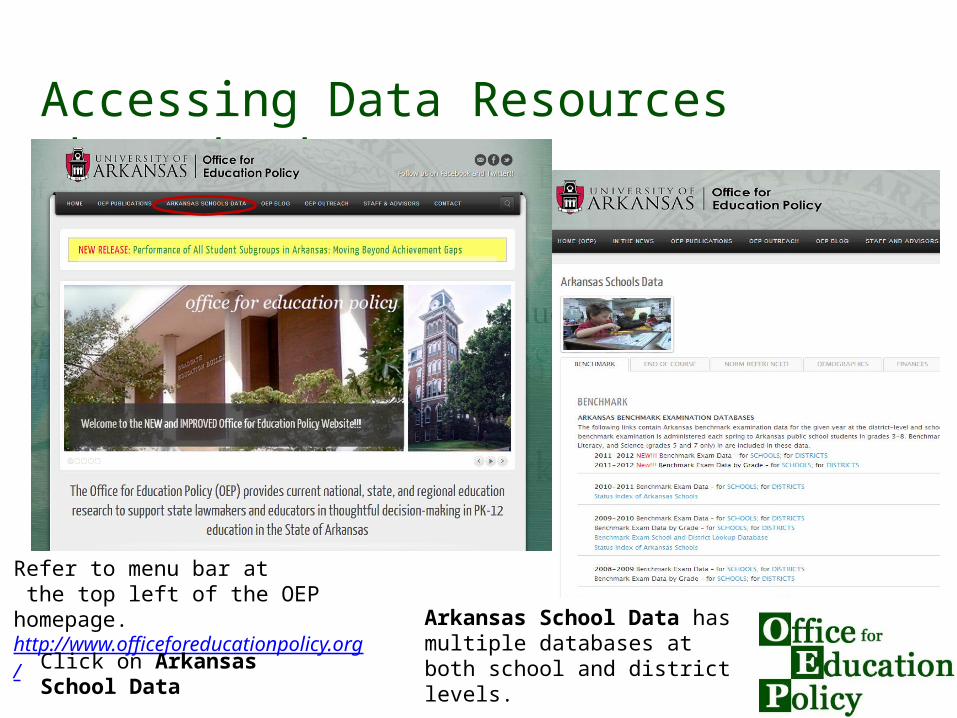
Refer to menu bar at the top left of the OEP homepage. http://www.officeforeducationpolicy.org/
Click on Arkansas School Data
Accessing Data Resources through the OEP
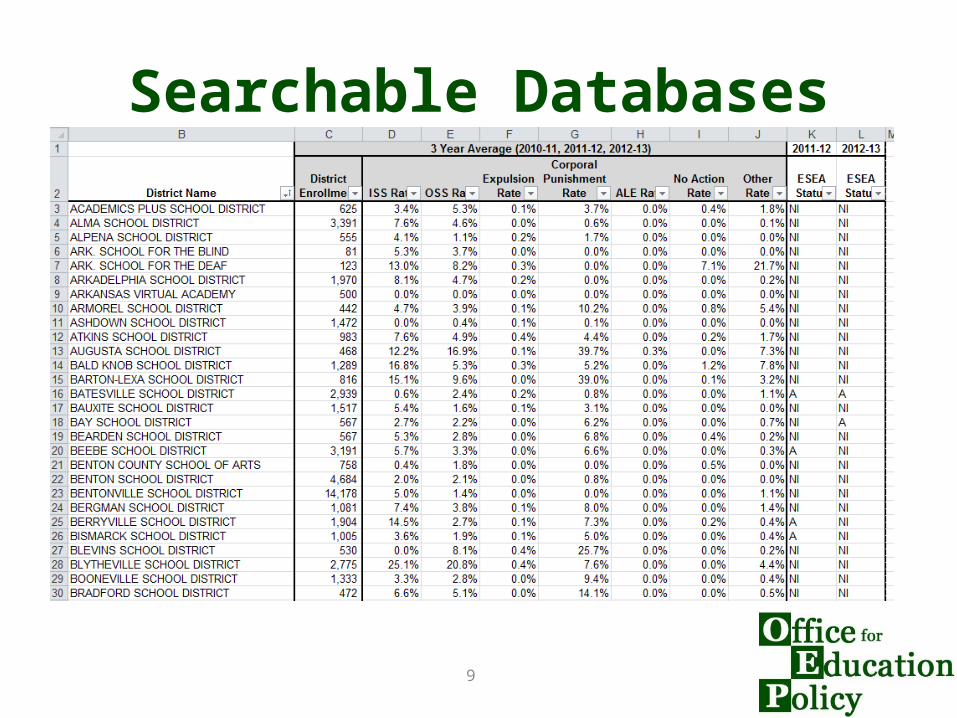
Arkansas School Data has multiple databases at both school and district levels.
4
Overview of 20 Minutes
1. Introduction – Act 1329 requires study of school discipline
2. Initial Report and Database3. Additional Analyses
a) Are there regional differences in discipline rates?b) Are their differences in discipline rates based on
district size, demographics, or academic performance?c) Are discipline rates and academic outcomes
correlated?
4. Questions

5
Introduction
• Act 1329: An Act to Evaluate the Impact of School Discipline on Student Achievement; And For Other Purposes – Report to be prepared by July 1 of each year,
beginning in 2014, to include:• Data on enrollment, disciplinary rates, achievement
status of districts, and disciplinary disparity between subgroups • Possible disciplinary strategies and resources Arkansas
school districts can access
6
Limitations of Data
• Discipline data – obtained from the Arkansas Department of Education: – Self-reported by districts– Some categories unstandardized • Including undefined “other” category (e.g. six districts
had “other” rates of over 20%. Norphlet, a district of about 412 students, had 1321-1474 “other” actions each year.)
– Missing data• Including “referrals to law enforcement authorities”
7
Challenges of Interpreting Data• Districts have varying:– Discipline policies and plans– Personnel to implement policies and plans
• Unclear whether high or low discipline rates are positive or negative?
• Unclear in how to interpret any potential disparities?– Act 1329: “Disparity in discipline rates does not necessarily
indicate discrimination; it can result from an ineffective school climate or from cultural strategies that are not successful in engaging the academic efforts of all students.”
8
Initial Report
• While interpretations not obvious, discipline findings are nonetheless interesting
• Initial Report includes:– Main Report: overview of state level findings– Appendix A: District Level Database (searchable) of all
7 disciplinary outcomes– Appendix B: District Level Database (searchable) with
7 disciplinary outcomes by subgroup– Appendix C: District Level Database (searchable) of
disparities between subgroups
9
Searchable Databases

10
Additional Analysis
11
District Mean
District Max
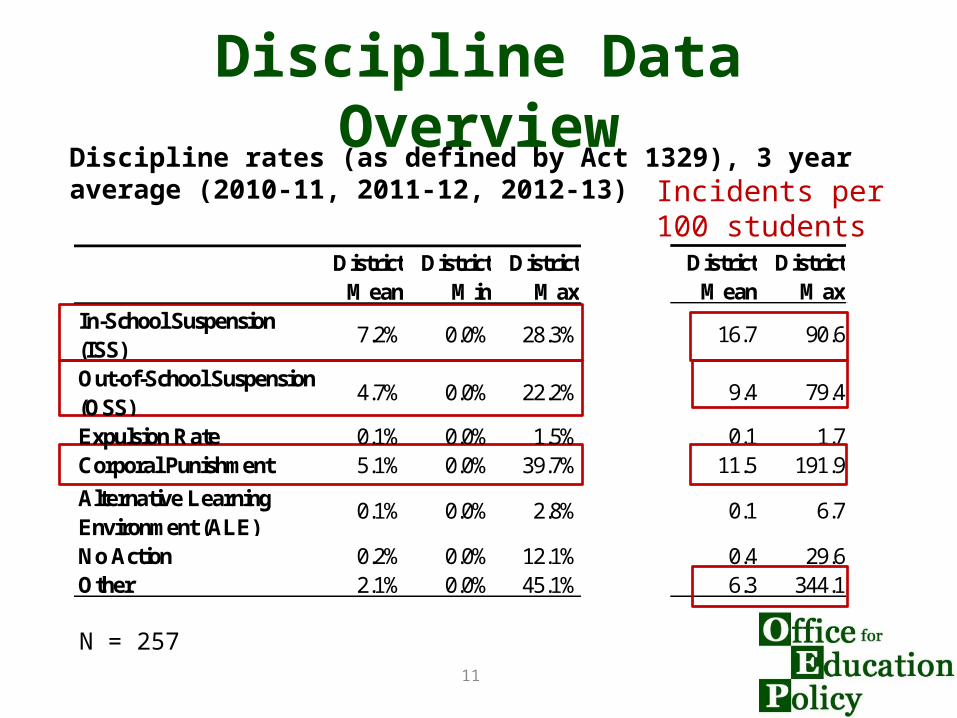
16.7 90.6
9.4 79.4
0.1 1.711.5 191.9
0.1 6.7
0.4 29.66.3 344.1
Discipline Data OverviewDiscipline rates (as defined by Act 1329), 3 year average (2010-11, 2011-12, 2012-13)
N = 257
Incidents per 100 students
District Mean
District Min
District Max
In-School Suspension (ISS)
7.2% 0.0% 28.3%
Out-of-School Suspension (OSS)
4.7% 0.0% 22.2%
Expulsion Rate 0.1% 0.0% 1.5%Corporal Punishment 5.1% 0.0% 39.7%
Alternative Learning Environment (ALE)
0.1% 0.0% 2.8%
No Action 0.2% 0.0% 12.1%Other 2.1% 0.0% 45.1%
12
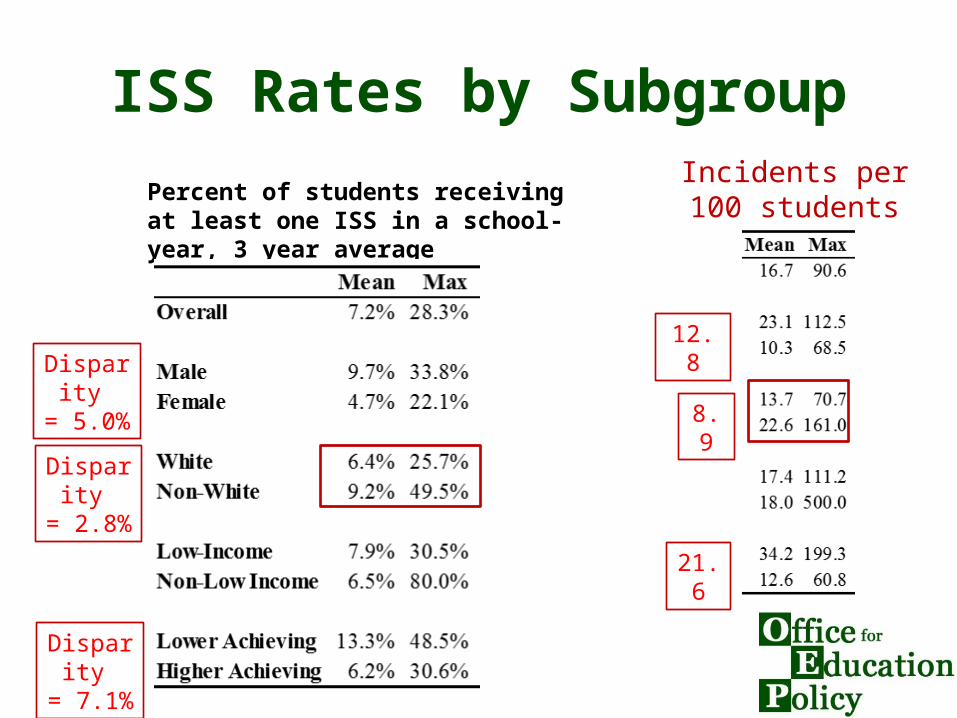
ISS Rates by Subgroup
Disparity = 5.0%
Disparity = 7.1%
Incidents per 100 students
12.8
21.6
Percent of students receiving at least one ISS in a school-year, 3 year average
Disparity = 2.8%
8.9
13
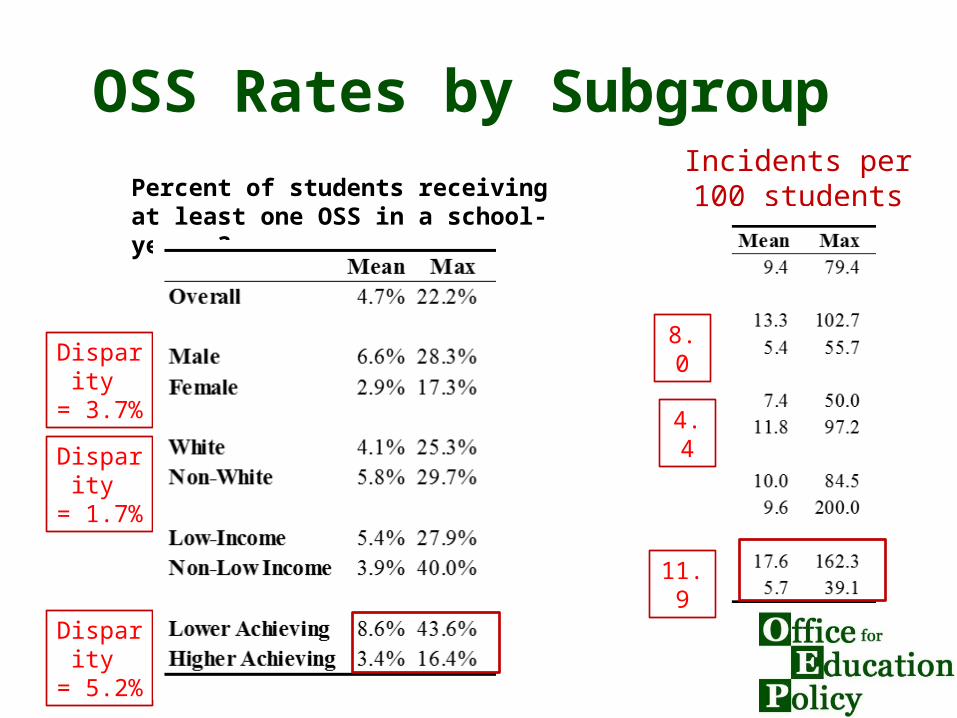
OSS Rates by Subgroup
Disparity = 3.7%
Disparity = 5.2%
Incidents per 100 students
8.0
11.9
Percent of students receiving at least one OSS in a school-year, 3 year average
Disparity = 1.7%
4.4
14
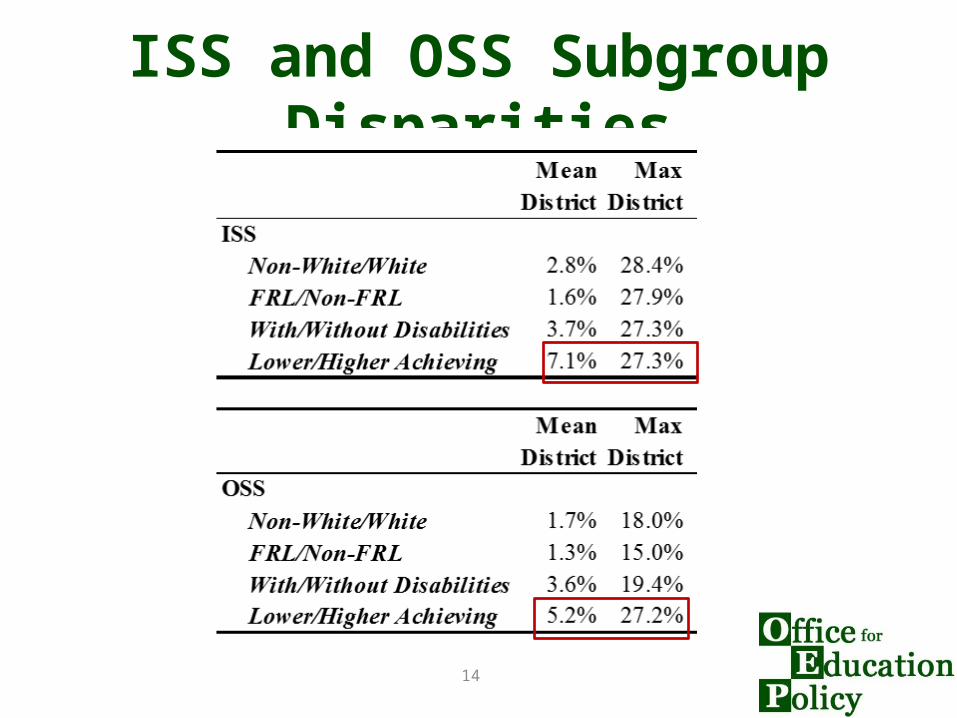
ISS and OSS Subgroup Disparities

Regional Differences
15
16
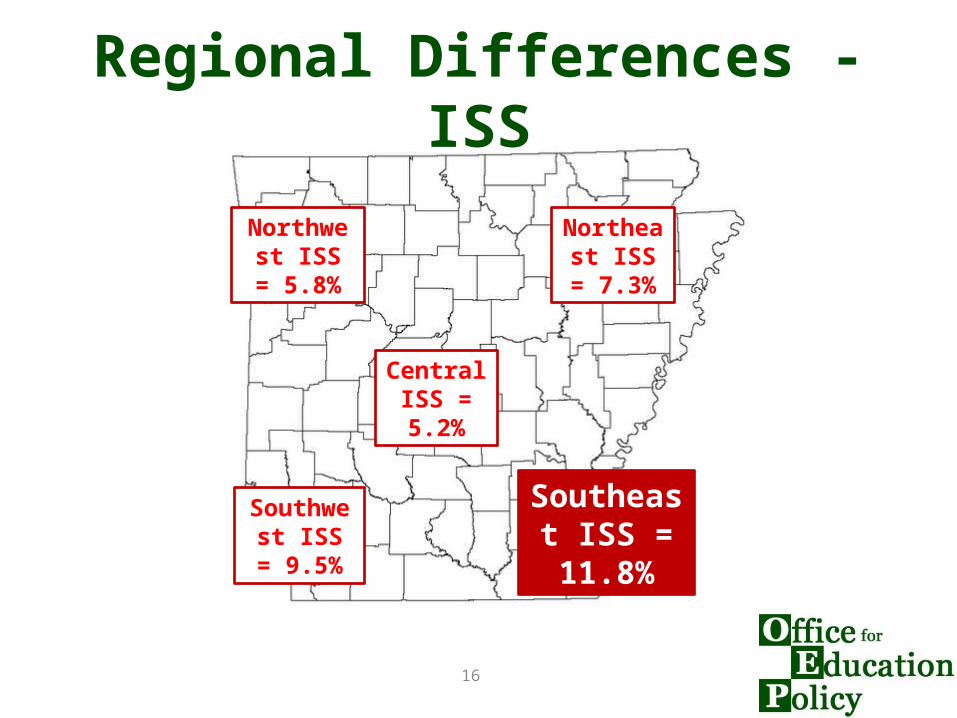
Regional Differences - ISS
Central ISS = 5.2%
Southeast ISS = 11.8%
Southwest ISS = 9.5%
Northeast ISS = 7.3%
Northwest ISS = 5.8%
17
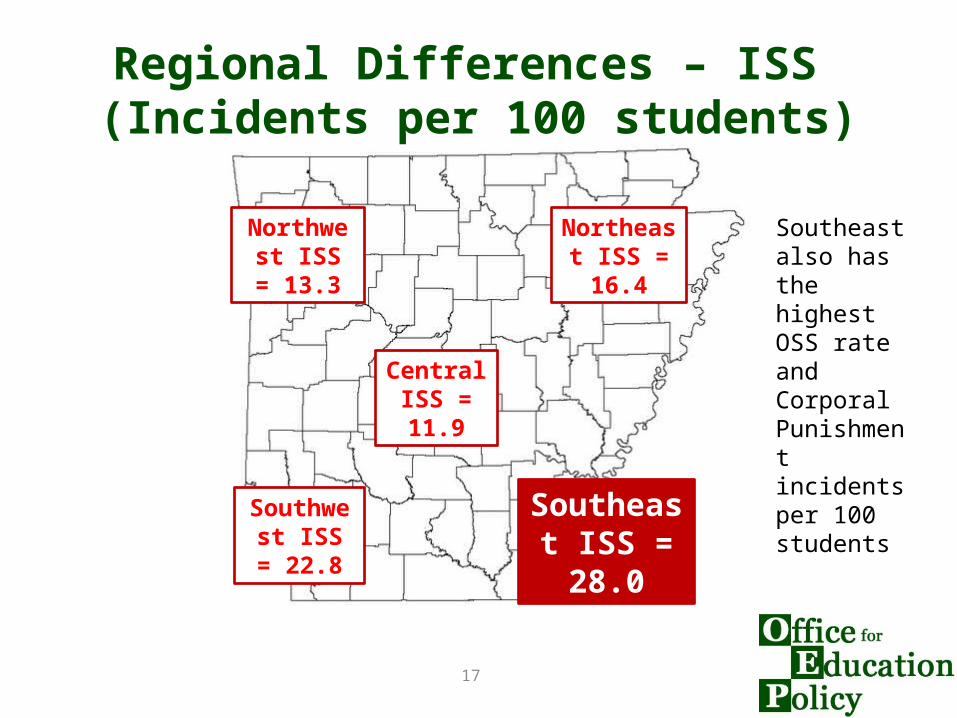
Regional Differences – ISS (Incidents per 100 students)
Central ISS = 11.9
Southeast ISS = 28.0
Southwest ISS = 22.8
Northeast ISS = 16.4
Northwest ISS = 13.3
Southeast also has the highest OSS rate and Corporal Punishment incidents per 100 students
18
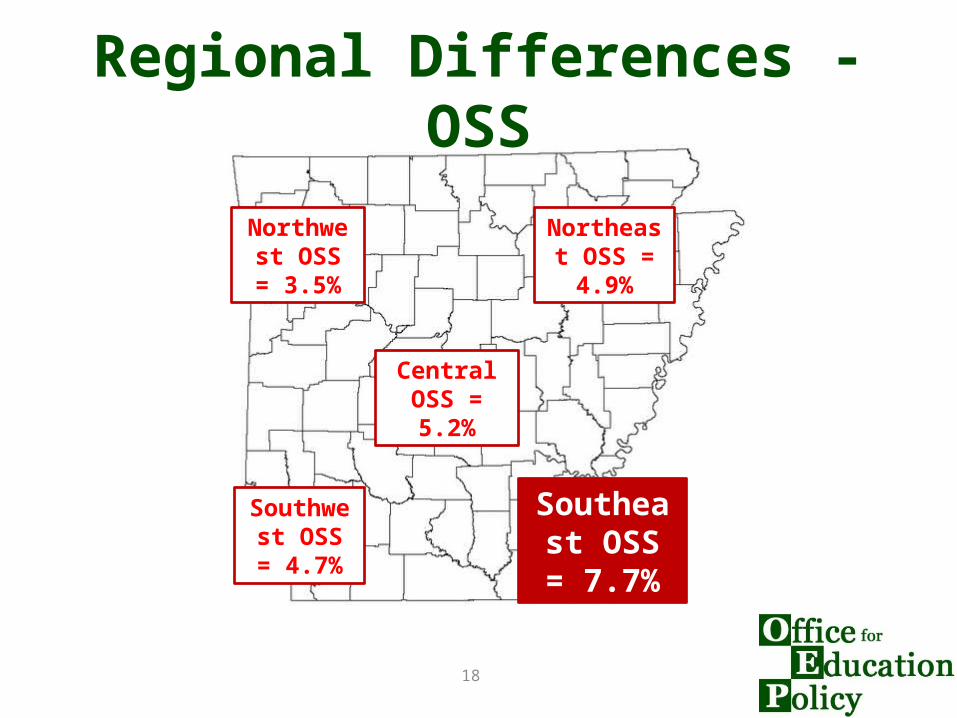
Regional Differences - OSS
Central OSS = 5.2%
Southeast OSS = 7.7%
Southwest OSS = 4.7%
Northeast OSS = 4.9%
Northwest OSS = 3.5%
19
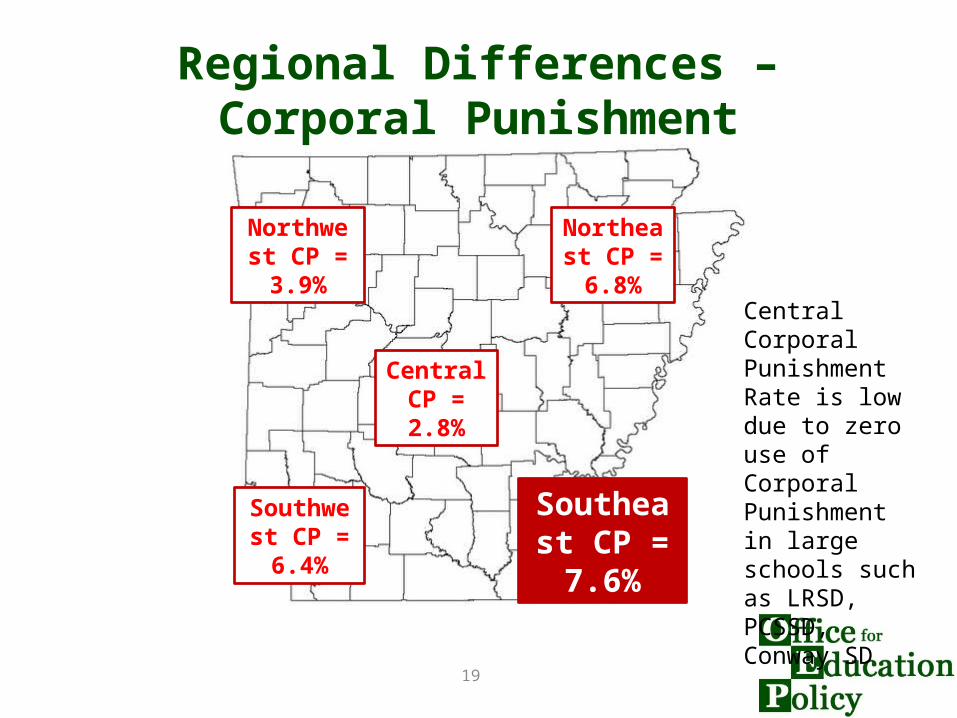
Regional Differences – Corporal Punishment
Central CP = 2.8%
Southeast CP = 7.6%
Southwest CP = 6.4%
Northeast CP = 6.8%
Northwest CP = 3.9%
Central Corporal Punishment Rate is low due to zero use of Corporal Punishment in large schools such as LRSD, PCSSD, Conway SD

20
State-wide Differences
21
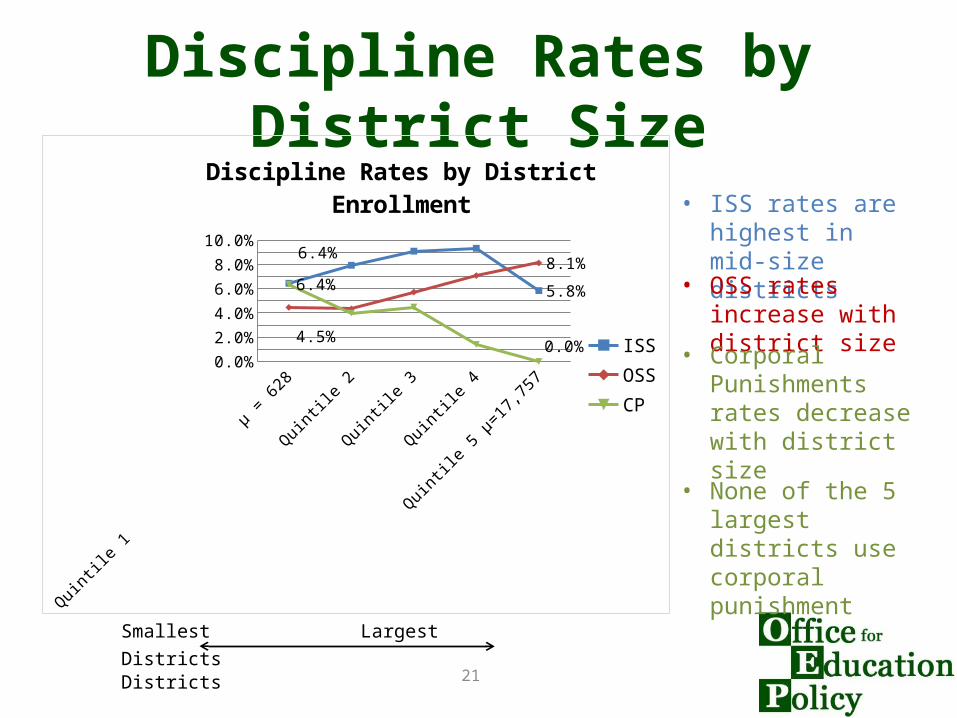
Discipline Rates by District Size
Quintile 1 µ = 628
Quintile 2 Quintile 3 Quintile 4 Quintile 5 µ=17,757
0.0%
1.0%
2.0%
3.0%
4.0%
5.0%
6.0%
7.0%
8.0%
9.0%
10.0%
6.4%
5.8%
4.5%
8.1%
6.4%
0.0%
Discipline Rates by District Enrollment
ISSOSSCP
• ISS rates are highest in mid-size districts
• OSS rates increase with district size
• Corporal Punishments rates decrease with district size
• None of the 5 largest districts use corporal punishment
Smallest Largest Districts Districts
22
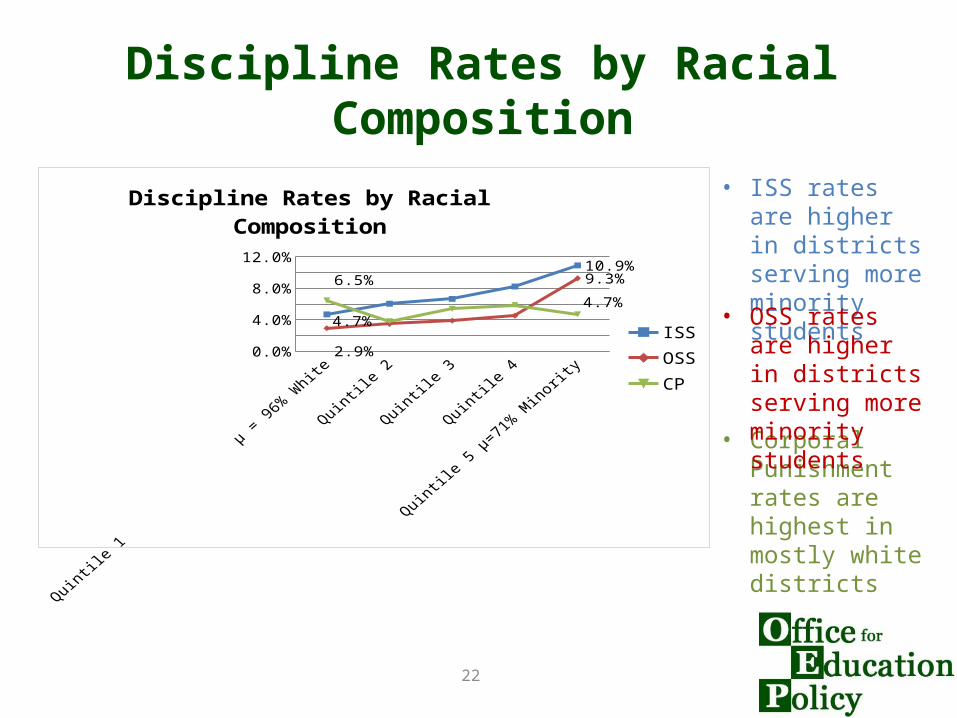
Discipline Rates by Racial Composition
• ISS rates are higher in districts serving more minority students
• Corporal Punishment rates are highest in mostly white districts
• OSS rates are higher in districts serving more minority students
Quintile 1
µ = 96% White
Quintile 2
Quintile 3
Quintile 4
Quintile 5 µ=71% Minorit
y0.0%
2.0%
4.0%
6.0%
8.0%
10.0%
12.0%
4.7%
10.9%
2.9%
9.3%6.5%
4.7%
Discipline Rates by Racial Composition
ISSOSSCP
23
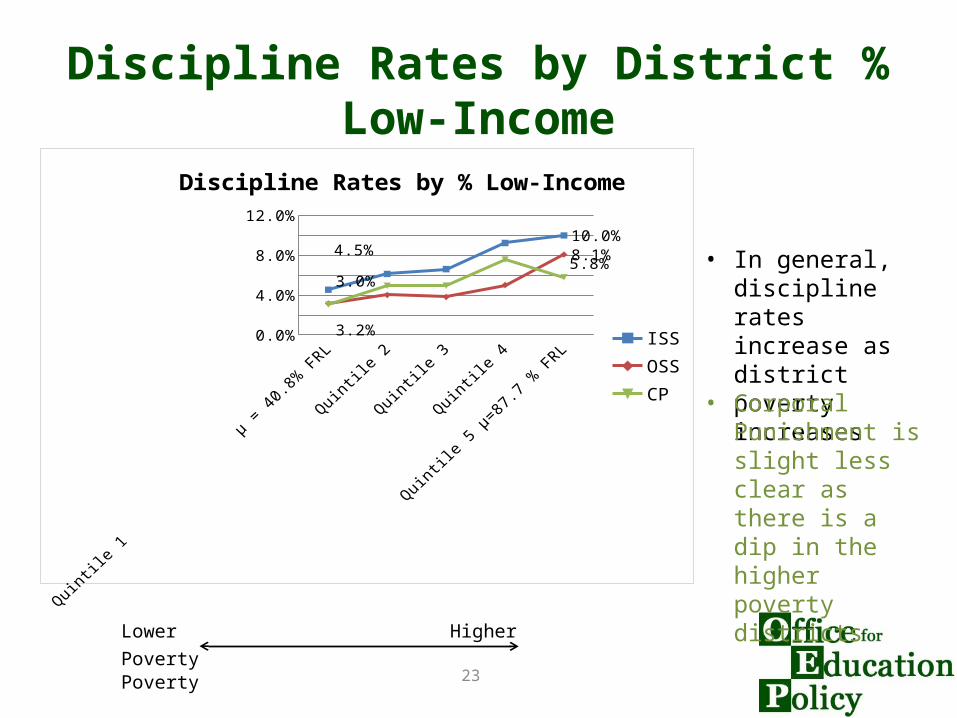
Discipline Rates by District % Low-Income
Quintile 1 µ =
40.8% FRL
Quintile 2 Quintile 3 Quintile 4 Quintile 5 µ=87.7 % FRL
0.0%
2.0%
4.0%
6.0%
8.0%
10.0%
12.0%
4.5%
10.0%
3.2%
8.1%
3.0%
5.8%
Discipline Rates by % Low-Income
ISSOSSCP
• In general, discipline rates increase as district poverty increases
• Corporal Punishment is slight less clear as there is a dip in the higher poverty districts
Lower HigherPoverty Poverty
24
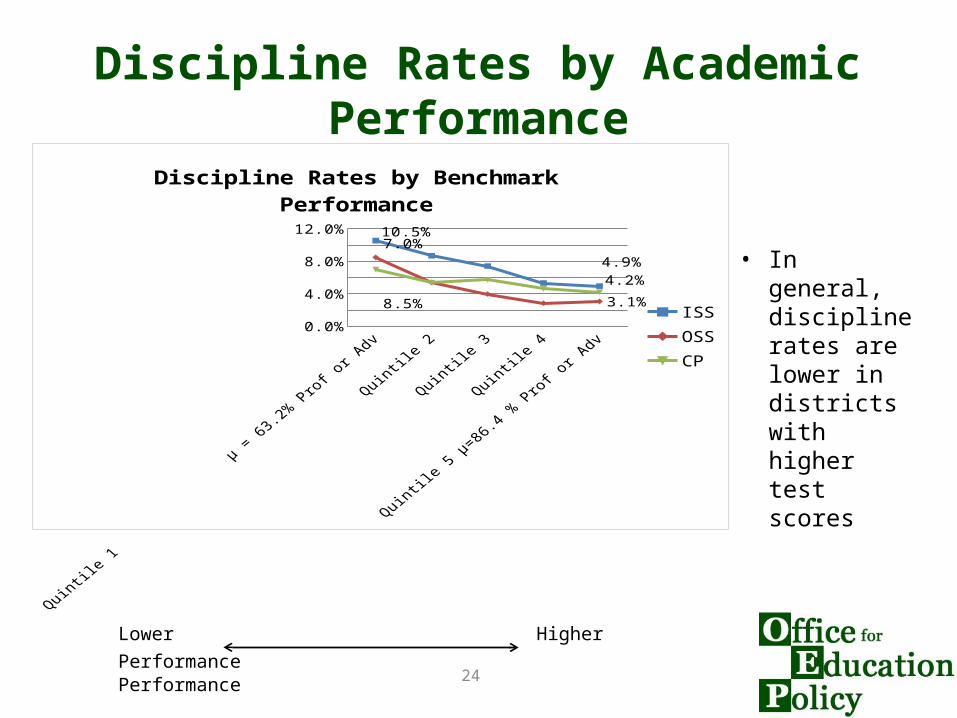
Discipline Rates by Academic Performance
Quintile 1 µ = 63.2%
Prof or Adv
Quintile 2 Quintile 3 Quintile 4 Quintile 5 µ=86.4 % Prof
or Adv
0.0%
2.0%
4.0%
6.0%
8.0%
10.0%
12.0%
10.5%
4.9%8.5%
3.1%
7.0%
4.2%
Discipline Rates by Benchmark Performance
ISSOSSCP
• In general, discipline rates are lower in districts with higher test scores
Lower Higher Performance Performance
25
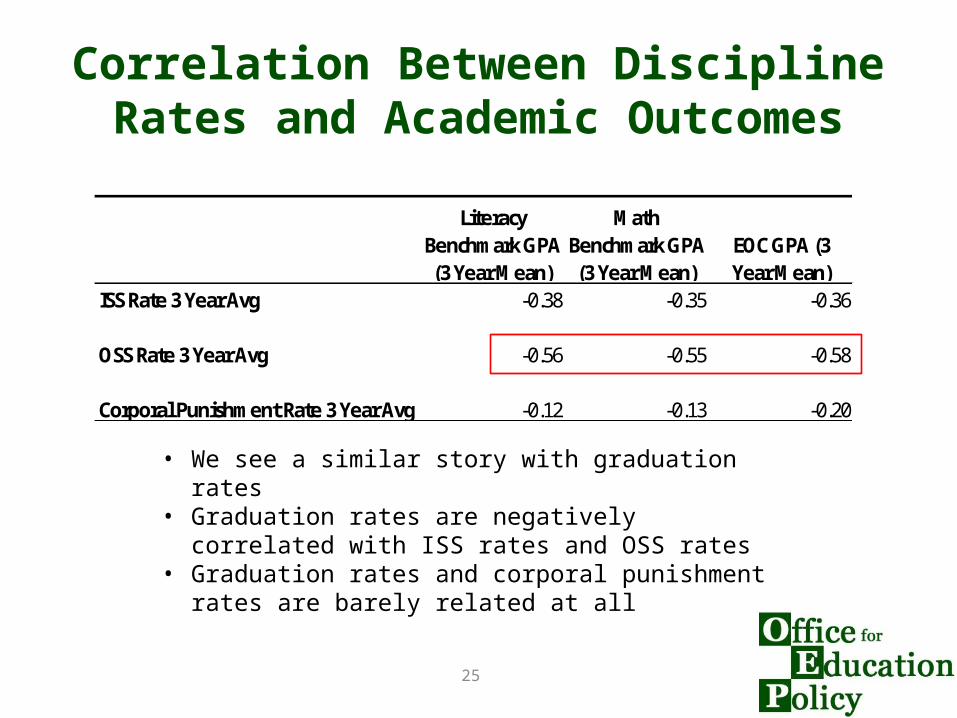
Correlation Between Discipline Rates and Academic Outcomes
• We see a similar story with graduation rates• Graduation rates are negatively correlated with ISS rates and
OSS rates• Graduation rates and corporal punishment rates are barely
related at all
Literacy Benchmark GPA (3 Year Mean)
Math Benchmark GPA (3 Year Mean)
EOC GPA (3 Year Mean)
ISS Rate 3 Year Avg -0.38 -0.35 -0.36
OSS Rate 3 Year Avg -0.56 -0.55 -0.58
Corporal Punishment Rate 3 Year Avg -0.12 -0.13 -0.20
26
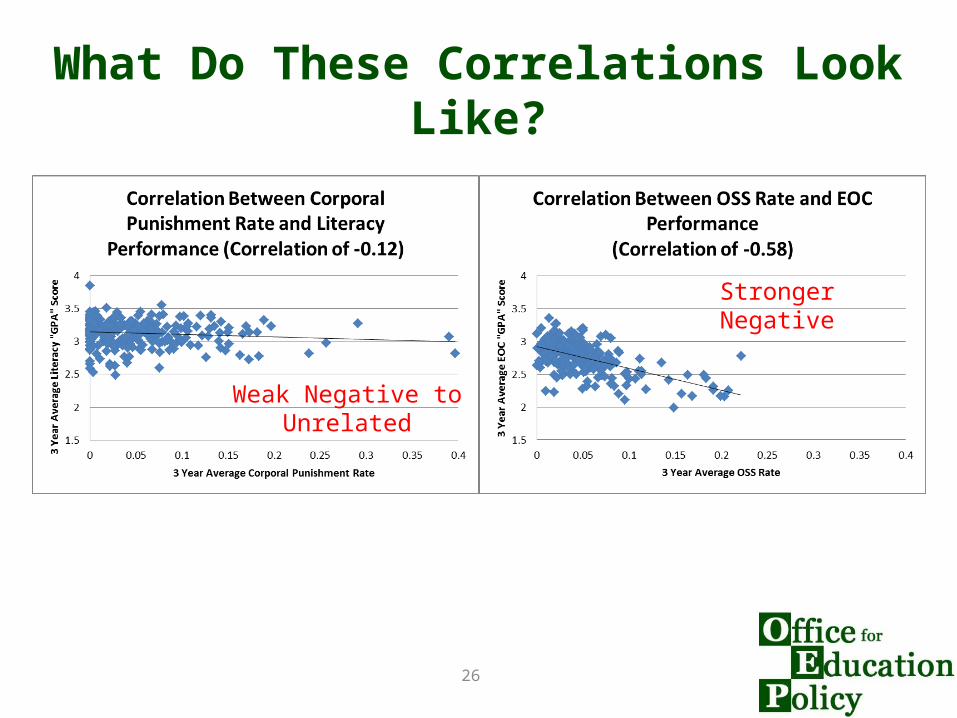
What Do These Correlations Look Like?
Weak Negative to Unrelated
Stronger Negative
27
In Summary…• Disparities exist between discipline rates for different
subgroups, in predictable ways• These disparities are greater when considering students have
repeated discipline actions• Caution: Not obvious how to interpret high or low discipline
rates• ISS and OSS rates are negatively correlated to academic
outcomes• Room for improvement in collection and categorization of data
(e.g. “other”)• This great database provided by the state can be used to answer
many more questions

28
Questions?