Embed Size (px)
Citation preview
1 | E n e r g y a n d E n v i r o n m e n t a l I m p a c t R e s p o n s e
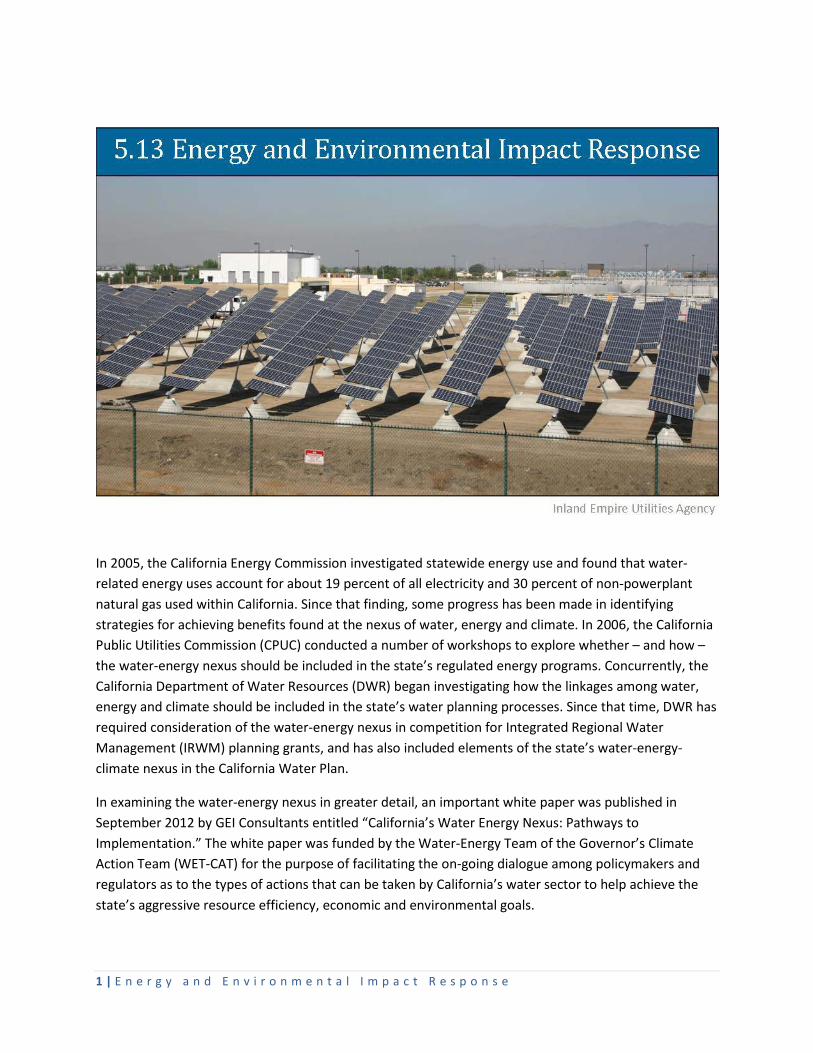
In 2005, the California Energy Commission investigated statewide energy use and found that water-related energy uses account for about 19 percent of all electricity and 30 percent of non-powerplant natural gas used within California. Since that finding, some progress has been made in identifying strategies for achieving benefits found at the nexus of water, energy and climate. In 2006, the California Public Utilities Commission (CPUC) conducted a number of workshops to explore whether – and how –the water-energy nexus should be included in the state’s regulated energy programs. Concurrently, the California Department of Water Resources (DWR) began investigating how the linkages among water, energy and climate should be included in the state’s water planning processes. Since that time, DWR has required consideration of the water-energy nexus in competition for Integrated Regional Water Management (IRWM) planning grants, and has also included elements of the state’s water-energy-climate nexus in the California Water Plan.
In examining the water-energy nexus in greater detail, an important white paper was published in September 2012 by GEI Consultants entitled “California’s Water Energy Nexus: Pathways to Implementation.” The white paper was funded by the Water-Energy Team of the Governor’s Climate Action Team (WET-CAT) for the purpose of facilitating the on-going dialogue among policymakers and regulators as to the types of actions that can be taken by California’s water sector to help achieve the state’s aggressive resource efficiency, economic and environmental goals.
2 | E n e r g y a n d E n v i r o n m e n t a l I m p a c t R e s p o n s e
GEI summarized key findings and recommendations that suggest that water and wastewater agencies have unique characteristics that could be leveraged through appropriate partnerships to provide significant benefits to the state’s electric system. As a result of the sizeable energy impact by water and wastewater agencies, the GEI report indicates that Santa Ana Watershed Project Authority (SAWPA), as a water resources management agency, is uniquely positioned to collaborate with and help California attain its energy efficiency, renewable energy and greenhouse gas reduction goals. Many areas of the state, water and wastewater agencies may have the capacity through their lands, facilities and professional staff to generate significant new amounts of renewable energy through solar, biogas, wind and other sources. Other agencies have the flexibility to consider feasible changes for when and how they use energy that are consistent with maintaining reliable water deliveries and public safety.
The two overarching conclusions from GEI’s white paper are:
• The choices that the water and wastewater agency sector make to invest in energy efficiency and renewable energy generation, matter to California
• It is rare to have so much opportunity for making such a positive and powerful impact – improvements in energy efficiency, renewable energy generation and reduction in greenhouse gases – concentrated into one sector. It is an opportunity that cannot be ignored
Under OWOW 1.0, a chapter was prepared by the Climate Change Pillar describing the impacts of climate change on the water resources-related projects. That chapter described the climate change impacts and various broad-based implementation strategies that the watershed should take to mitigate and adapt to these impacts. Under the OWOW 2.0 Plan, SAWPA reformed the Pillar as the “Energy and Environmental Impact Response” Pillar recognizing that each IRWM region needs to not only address climate change, but must also recognize and mobilize implementation actions to reduce energy demand and improve energy efficiencies in the water and wastewater industries in their areas. Craig Perkins, executive director of The Energy Coalition, a non-profit organization based in Irvine, California was named Co-chair of the new Energy and Environmental Response Pillar. Roy Herndon from Orange County Water District (OCWD) was named co-chair. The Pillar’s work focused on: 1) energy outreach to the water and wastewater industries, and 2) development of new and updated climate change models and forecasting tools as supported by the U.S. Department of the Interior’s Bureau of Reclamation (Reclamation).
3 | E n e r g y a n d E n v i r o n m e n t a l I m p a c t R e s p o n s e
Water-Energy Projects
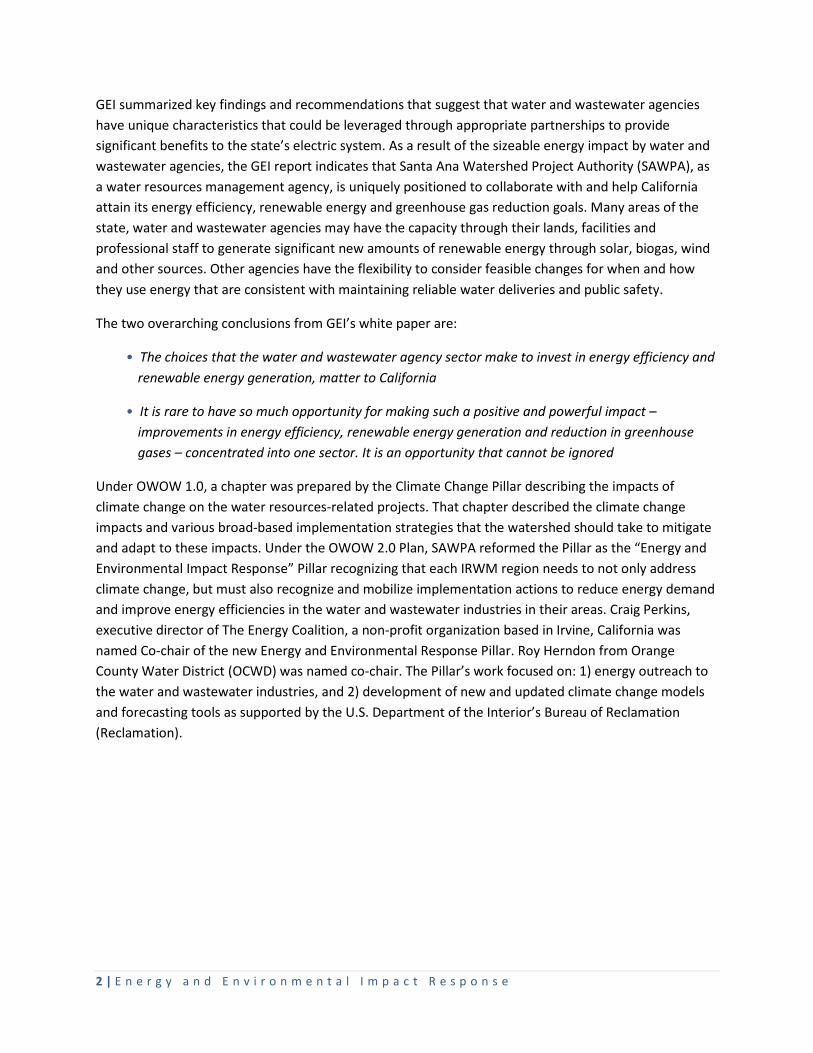
The Energy Coalition The Energy Coalition is a non-profit organization formed to develop and implement energy blueprints – the plans and strategies that integrate these energy efficiency practices to help schools, businesses, and governments. The Energy Coalition created The Energy Network, a program funded by the CPUC to provide a suite of services that increase participation in energy efficiency projects. The Energy Network’s services are available to public agencies in the Southern California Edison and Southern California Gas service territories. A team of professionals is working through The Energy Network to develop a regional model for local government collaboration statewide to support accountable energy communities.
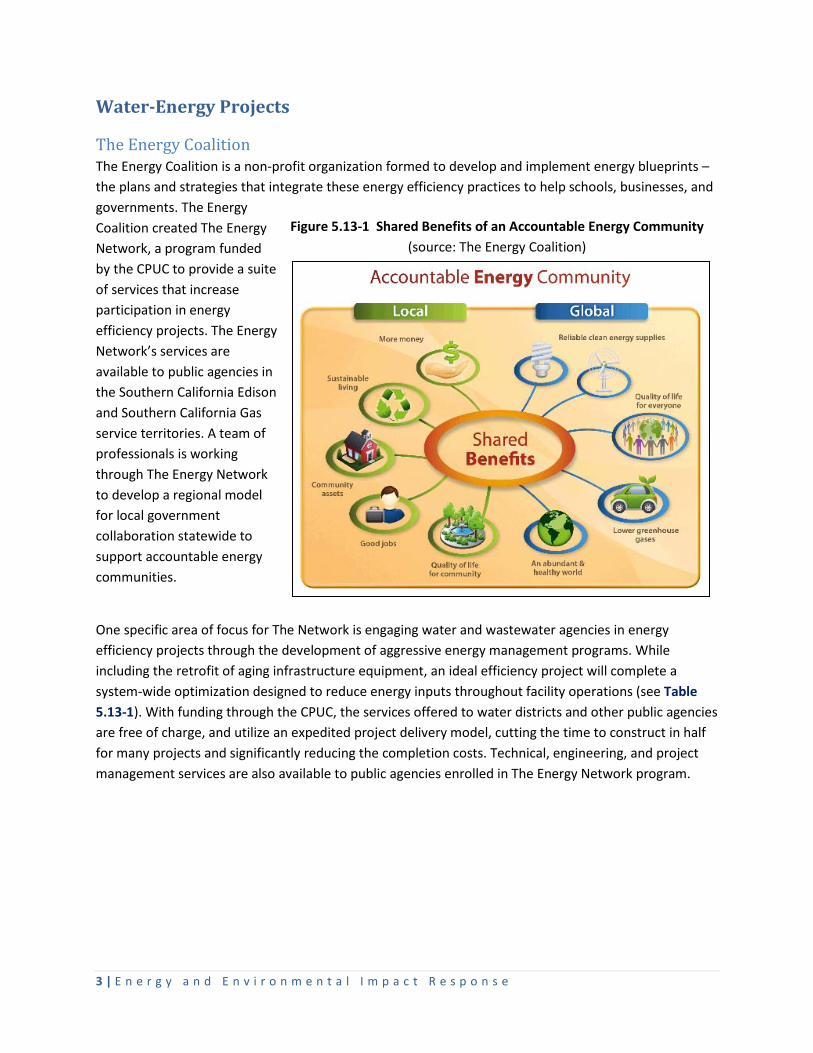
One specific area of focus for The Network is engaging water and wastewater agencies in energy efficiency projects through the development of aggressive energy management programs. While including the retrofit of aging infrastructure equipment, an ideal efficiency project will complete a system-wide optimization designed to reduce energy inputs throughout facility operations (see Table 5.13-1). With funding through the CPUC, the services offered to water districts and other public agencies are free of charge, and utilize an expedited project delivery model, cutting the time to construct in half for many projects and significantly reducing the completion costs. Technical, engineering, and project management services are also available to public agencies enrolled in The Energy Network program.
Figure 5.13-1 Shared Benefits of an Accountable Energy Community (source: The Energy Coalition)
4 | E n e r g y a n d E n v i r o n m e n t a l I m p a c t R e s p o n s e
Table 5.13-1 Energy Efficiency Measures for Water Management Facilities
By providing unbiased expertise and premium engineering services, The Energy Network addresses the common barriers that prevent many local governments and public agencies with limited resources from adopting energy saving measures. These new services will complement and support services provided by existing programs offered by the electric and gas utilities.
Under the first phase of a program specifically designed to work with water and wastewater agencies, The Energy Network is providing free technical, project management, financing and rebate information to cities, municipalities, and water agencies looking to pursue energy efficiency projects to improve facilities’ performance and streamline capital improvement processes. The Network’s technical staff, in
5 | E n e r g y a n d E n v i r o n m e n t a l I m p a c t R e s p o n s e
close collaboration with SAWPA, is conducting a number of outreach meetings to explain the program and engage water and wastewater agencies throughout the Santa Ana River Watershed (SARW).
The Energy Network will provide energy resources, expertise and technical assistance to multiple water and wastewater agencies to develop strategic energy management plans for municipal energy efficiency projects. The Network also offers assistance with securing an energy project master lease option to help agencies pay for projects that are beyond their current budget capacities. This private sector financing will enable participating agencies to pay for retrofits without up-front funding. The Energy Network will serve as a model for energy efficiency retrofit implementation and financing statewide. The following resources to the water and wastewater agencies in the SARW are being made available:
• Technical and project management support
• Competitive private sector funding
• Construction management support, including procurement and contractor coordination
• Aggregated procurement of equipment and construction services
• A data management platform that supports energy management and permitting
• Evaluation and assessment of energy efficiency opportunities to reduce operating costs
Multiple meetings among water and wastewater agencies throughout the SARW SARW were held with The Energy Network Project Manager James Ferro, with support of SAWPA staff, to explain these services and to explore opportunities to reduce energy consumption by water agencies within the watershed.
Water-Energy Innovation Projects A majority of public utility departments in the SARW encourage the implementation of projects that capture renewable sources of energy. These renewable energy projects are often recommended to businesses and homeowners through the use of financial incentives. However, water and wastewater agencies, both public and private, share the same benefits of renewable energy. Due to energy-intensive water infrastructure, such as pump stations and treatment facilities, water agencies implementing renewable energy collection systems benefit from considerable cost savings. These collection systems also assist in stabilizing the California Energy Grid by “giving back” to the grid.
Of those water agencies implementing a form of renewable energy, the most common water-energy innovation projects currently envisioned and being implemented are forms of solar and wind energy collection systems. These projects often range from modifications of wastewater treatment plant processes to installing windmills to utilizing solar panels that also provide shaded parking spaces. A few agencies are also exploring innovative, less conventional sources of renewable energy such as using food-waste to create energy to power their wastewater treatment plants, or mini-turbines installed in their water pipelines to create electricity. These renewable water-energy innovation projects not only
6 | E n e r g y a n d E n v i r o n m e n t a l I m p a c t R e s p o n s e
cut energy costs for municipal agencies, but are better for the environment. An overview of water-energy projects within the SARW are described in detail below.
Inland Empire Utilities Agency ‘Go Gridless by 2020’ The Inland Empire Utilities Agency (IEUA) is committed to building a better environment through better business practices. In addition to its LEED Platinum-level design administrative headquarters, IEUA is pursuing a progressive energy management strategy to be self-sufficient or ‘gridless’ by the year 2020. In 2008, IEUA installed 3.5 megawatts of solar power at its water recycling facilities and at the Inland Empire Regional Composting Facility. The solar energy saves IEUA hundreds of thousands of dollars a year on energy costs. In 2010 IEUA signed a 20-year Power Purchase Agreement with Anaergia Services to install, operate and maintain a 2.8-megawatt (MW) fuel cell system at the IEUA RP-1 Water Recycling Facility. Under the agreement, Anaergia is responsible for funding, design, construction, operation and maintenance of the system. IEUA will purchase power generated from the fuel cell plant at the agreed-upon price over the next 20 years, and use the heat generated from the process to heat the anaerobic digesters. The fuel cell plant will be fueled primarily with renewable biogas, making it the largest unit of its kind in the world. In 2012, IEUA installed 1 MW of wind energy at its northern water recycling plant. The treatment plant is located where a persistent wind source is available to drive a wind turbine, generating enough electricity to power the plant and provide an annual savings of more than $100,000 in electricity costs. Together, the existing and planned projects will generate 10+ megawatts of renewable energy for the agency.
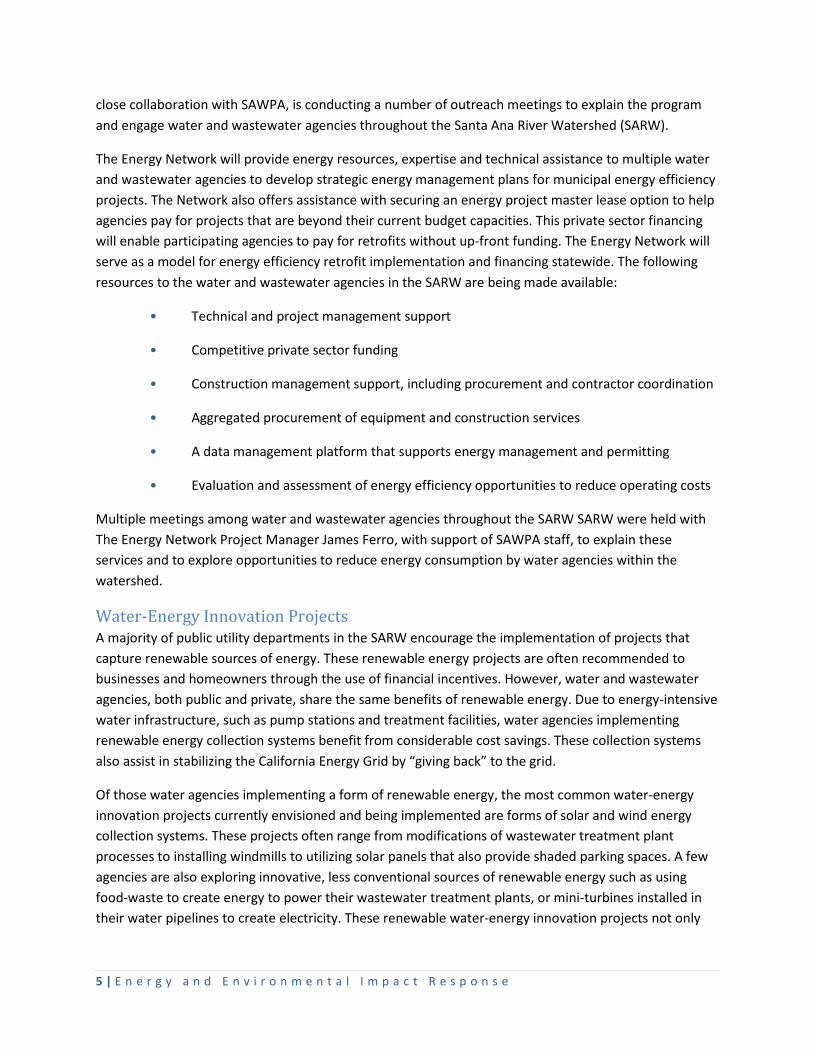
Western Municipal Water District - Solar Power System The Western Riverside County Regional Wastewater Authority (WRCRWA), which is managed by Western Municipal Water District (WMWD), has more than 5,000 solar panels covering nine acres at the WRCRWA’s wastewater treatment plant. This system can provide up to 1 MW of energy during peak energy use hours. WRCRWA is committed to utilizing renewable energy sources to help lower the amount of greenhouse gases released into the atmosphere.
The solar panels track the sun, increasing sunlight capture by up to 30 percent more than conventional fixed-tilt systems. At its peak, the solar panels provide 25 percent of the power needed to operate the wastewater treatment plant.
This will help reduce WRCRWA’s energy costs as the price of electricity increases in the years to come. It also increases the reliability of the plant and protects the region against power outages by reducing the burden on the California electrical grid during peak demand.
7 | E n e r g y a n d E n v i r o n m e n t a l I m p a c t R e s p o n s e
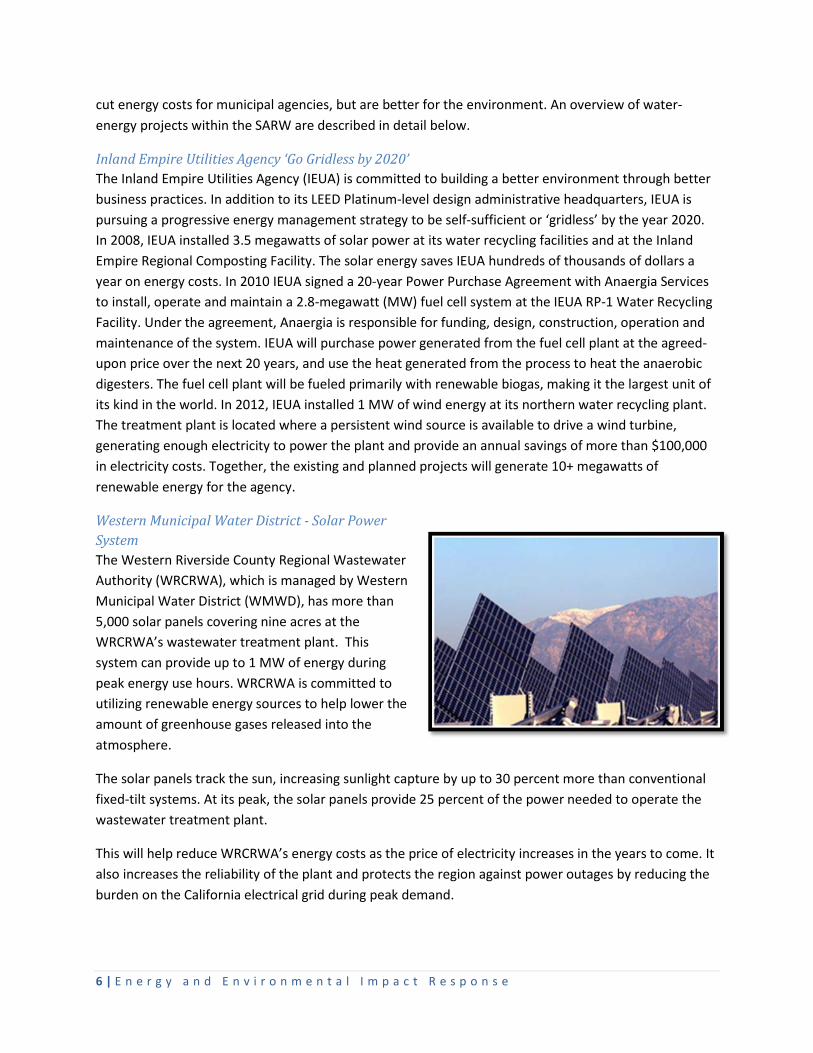
The Metropolitan Water District of Southern California – Skinner Solar Array As part of an ongoing district-wide sustainability initiative, The Metropolitan Water District of Southern California activated a 10-acre solar power facility at its Robert A. Skinner Water Treatment Plant in Riverside County. The one-megawatt solar installation generates about 2.4 million kilowatt-hours (kWh) of clean, renewable energy a year.
Eastern Municipal Water District Solar Photovoltaic Renewable Energy Project A 500-kilowatt (kW) solar photovoltaic renewable energy facility was constructed at Eastern Municipal Water District’s (EMWD) Administrative Campus to provide approximately 1 to 1.2 MWs for its Administrative Campus in the City of Perris. The site, adjacent to the I-215 freeway, provides high visibility for the project to the public. The panels are ground-mounted, with underground electrical transmission conduits, instrumentation conduits, and other related appurtenances.
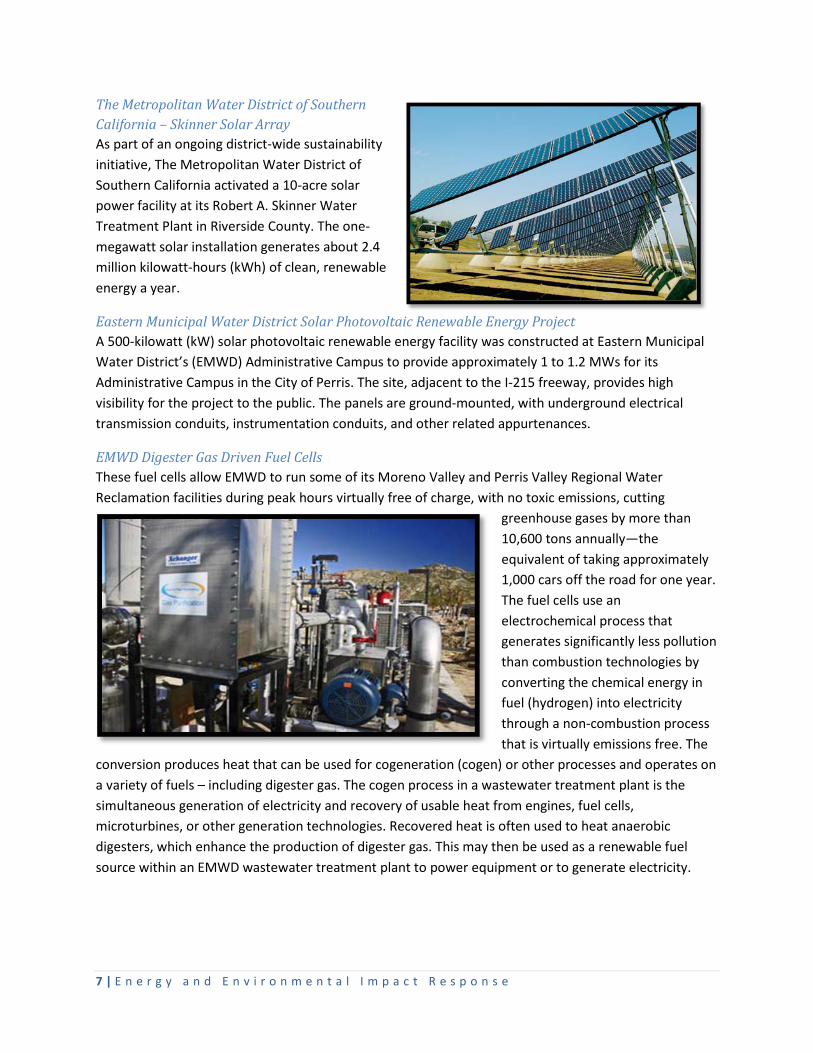
EMWD Digester Gas Driven Fuel Cells These fuel cells allow EMWD to run some of its Moreno Valley and Perris Valley Regional Water Reclamation facilities during peak hours virtually free of charge, with no toxic emissions, cutting
greenhouse gases by more than 10,600 tons annually—the equivalent of taking approximately 1,000 cars off the road for one year. The fuel cells use an electrochemical process that generates significantly less pollution than combustion technologies by converting the chemical energy in fuel (hydrogen) into electricity through a non-combustion process that is virtually emissions free. The
conversion produces heat that can be used for cogeneration (cogen) or other processes and operates on a variety of fuels – including digester gas. The cogen process in a wastewater treatment plant is the simultaneous generation of electricity and recovery of usable heat from engines, fuel cells, microturbines, or other generation technologies. Recovered heat is often used to heat anaerobic digesters, which enhance the production of digester gas. This may then be used as a renewable fuel source within an EMWD wastewater treatment plant to power equipment or to generate electricity.
8 | E n e r g y a n d E n v i r o n m e n t a l I m p a c t R e s p o n s e
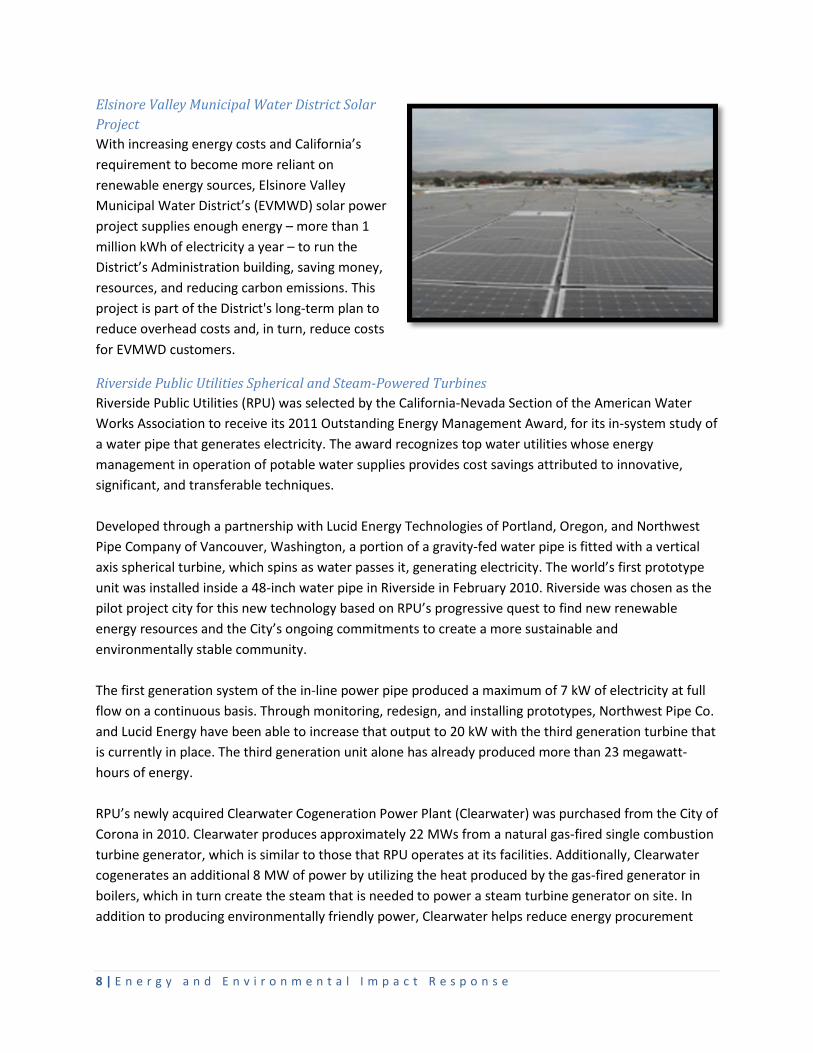
Elsinore Valley Municipal Water District Solar Project With increasing energy costs and California’s requirement to become more reliant on renewable energy sources, Elsinore Valley Municipal Water District’s (EVMWD) solar power project supplies enough energy – more than 1 million kWh of electricity a year – to run the District’s Administration building, saving money, resources, and reducing carbon emissions. This project is part of the District's long-term plan to reduce overhead costs and, in turn, reduce costs for EVMWD customers.
Riverside Public Utilities Spherical and Steam-Powered Turbines Riverside Public Utilities (RPU) was selected by the California-Nevada Section of the American Water Works Association to receive its 2011 Outstanding Energy Management Award, for its in-system study of a water pipe that generates electricity. The award recognizes top water utilities whose energy management in operation of potable water supplies provides cost savings attributed to innovative, significant, and transferable techniques. Developed through a partnership with Lucid Energy Technologies of Portland, Oregon, and Northwest Pipe Company of Vancouver, Washington, a portion of a gravity-fed water pipe is fitted with a vertical axis spherical turbine, which spins as water passes it, generating electricity. The world’s first prototype unit was installed inside a 48-inch water pipe in Riverside in February 2010. Riverside was chosen as the pilot project city for this new technology based on RPU’s progressive quest to find new renewable energy resources and the City’s ongoing commitments to create a more sustainable and environmentally stable community. The first generation system of the in-line power pipe produced a maximum of 7 kW of electricity at full flow on a continuous basis. Through monitoring, redesign, and installing prototypes, Northwest Pipe Co. and Lucid Energy have been able to increase that output to 20 kW with the third generation turbine that is currently in place. The third generation unit alone has already produced more than 23 megawatt-hours of energy. RPU’s newly acquired Clearwater Cogeneration Power Plant (Clearwater) was purchased from the City of Corona in 2010. Clearwater produces approximately 22 MWs from a natural gas-fired single combustion turbine generator, which is similar to those that RPU operates at its facilities. Additionally, Clearwater cogenerates an additional 8 MW of power by utilizing the heat produced by the gas-fired generator in boilers, which in turn create the steam that is needed to power a steam turbine generator on site. In addition to producing environmentally friendly power, Clearwater helps reduce energy procurement
9 | E n e r g y a n d E n v i r o n m e n t a l I m p a c t R e s p o n s e
costs for RPU, which helps the agency provide high quality, reliable power to its customers at the lowest rates possible.
The City Council authorized RPU to move forward with an agreement with Shoshone Renaissance LLC that provides 64 MW of renewable geothermal power resources for the city, increasing its renewable resources portfolio to 33 percent in 2011. Geothermal power plants utilize super-heated fluid from the Earth to create pressurized steam, which is used to turn the blades of a turbine that creates electricity. Compared to solar or wind generation sources (which don't produce energy at night or when there is no wind), geothermal plants provide reliable sources of energy for utilities to use for baseload needs. At full capacity, the 64 MW received through the new facility will provide 20 percent of Riverside's baseload.
San Bernardino Municipal Water District Methane Gas Generators The San Bernardino Municipal Water Reclamation Plant (WRP) reuses resources generated during the wastewater treatment processes. Since 2000, methane gas has been used as a renewable energy source to power two pump stations operated by San Bernardino Municipal Water District. In 2010, a co-generation facility was installed at the WRP which uses the methane gas produced during the treatment processes as a source of energy. This highly valuable energy source is used to fuel two 750-watt generators, which supply electricity to the WRP, minimizing the amount of electricity required to be purchased for WRP operations.
Irvine Ranch Water District Food Waste to Energy / Solar Project The Irvine Ranch Water District (IRWD) is evaluating several potential projects for renewable energy sources to be implemented as early as 2014. The IRWD Food Waste Energy Project evaluates the collection and use of pre-processed and liquefied food waste to increase digester gas production to be used to generate electricity. Equipment would include a food waste receiving station and microturbine generators. The IRWD Solar Program evaluates the potential for future solar projects, and various purchase structures including: IRWD-owned and -operated, a power purchase agreement, and a land lease to a solar developer at Jackson Ranch.
Cucamonga Valley Water District Solar Project The Cucamonga Valley Water District (CVWD) joined with SolarWorld California to construct a new ground-mounted solar energy system and Environmental Learning Center in 2006. Designed to augment the energy needs of CVWD particularly during peak summer demand periods, the system also serves as an on-site example of clean energy production for the students who visit the Environmental Learning Center. It is innovatively designed to teach children from grades K-12 about their role in preserving the environment.
The solar system was designed in response to CVWD’s visionary approach to satisfy long-term energy needs, provide a hedge against rising electricity rates, and proactively preserve and protect the environment. Consisting of 1,416 modules, the 274 kW system annually generates 380,000 kWh. The system also eliminates the production of 240 metric tons of carbon dioxide per year, or the pollution an average car emits over 10,132 days. SolarWorld's proprietary panelization process, consisting of a factory-assembled design, allows for more efficient installation and virtually eliminates packaging.
10 | E n e r g y a n d E n v i r o n m e n t a l I m p a c t R e s p o n s e
CVWD has indicated that the project will ultimately reduce the required power load by 27 percent. As part of the Self-Gen Program, Southern California Edison defrayed a significant portion of the installation cost with a $720,000 rebate to CVWD.
City of Redlands Wastewater Treatment Plant Photovoltaic Array In 2011, the City of Redlands implemented a project to install a photovoltaic array on property located at the city’s wastewater treatment plant (WWTP). The WWTP is a city-owned facility that operates 24 hours per day, 365 days per the year. It is a high-energy user, and can use as much as 239,000 kWh during a 32-day billing cycle. An Energy Efficiency and Conservation Block Grant project will contribute to other efforts designed to make this high-energy-use facility into a greener, leaner operation. Under this renewable energy project, the city would develop a scope of work and construction documents for competitive bid. The scope of work includes installation of a photovoltaic array on a piece of property referred to as the brine pond, which has a surface area of roughly 42,124 square feet on which to perform the installation. Project components of this installation are: 627 solar panels at 175 watts each; a 100-kW power inverter with AC/DC current disconnects; and other integration parts such as combiner boxes and MC connectors. The solar panel installation will yield an estimated system size of 113 kilowatts with an estimated output of 14,416 kWh per month. The city estimates the cost of the project to be $678,400 for the equipment and installation. This project will contribute to an overall improvement in energy efficiency of the WWTP.
Future Opportunities The Energy Network is also leading a water/energy nexus pilot project designed to facilitate the implementation of water efficiency projects that capture embedded energy savings. Many discussions on how to quantify embedded energy in water savings have occurred at the statewide level, yet little has been done to move forward on identifying the lost opportunities of doing nothing. The pilot project has brought together a team of experts from academia, the private sector, and the government throughout California to apply a scientifically robust energy intensity factor to a portfolio of water supplies at the watershed level. Using historical data collected from SAWPA member agencies, this metric will be applied to completed water efficiency measures and rebates issued within the watershed from SAWPA member agencies from 2010-2012. This data will be compiled and presented in the form of a report to the CPUC and other interested state agencies to support the inclusion of embedded energy rebates for water efficiency projects in the next program cycle.
The second phase of this project will integrate high energy intensity water efficiency measures into The Energy Network’s offerings for public agencies to implement as part of their energy efficiency strategies through the Network’s comprehensive project delivery method. The third and final phase of the pilot will result in the publication of a ‘how-to guide’ for public agencies looking to broaden their energy and water efficiency programs, including the identification of high energy intensity water efficiency projects that can result in significant energy savings for the state.
The Energy Coalition, in coordination with SAWPA, is also developing a white paper describing the increased opportunities that are available by capturing the embedded energy in the water use cycle.
11 | E n e r g y a n d E n v i r o n m e n t a l I m p a c t R e s p o n s e
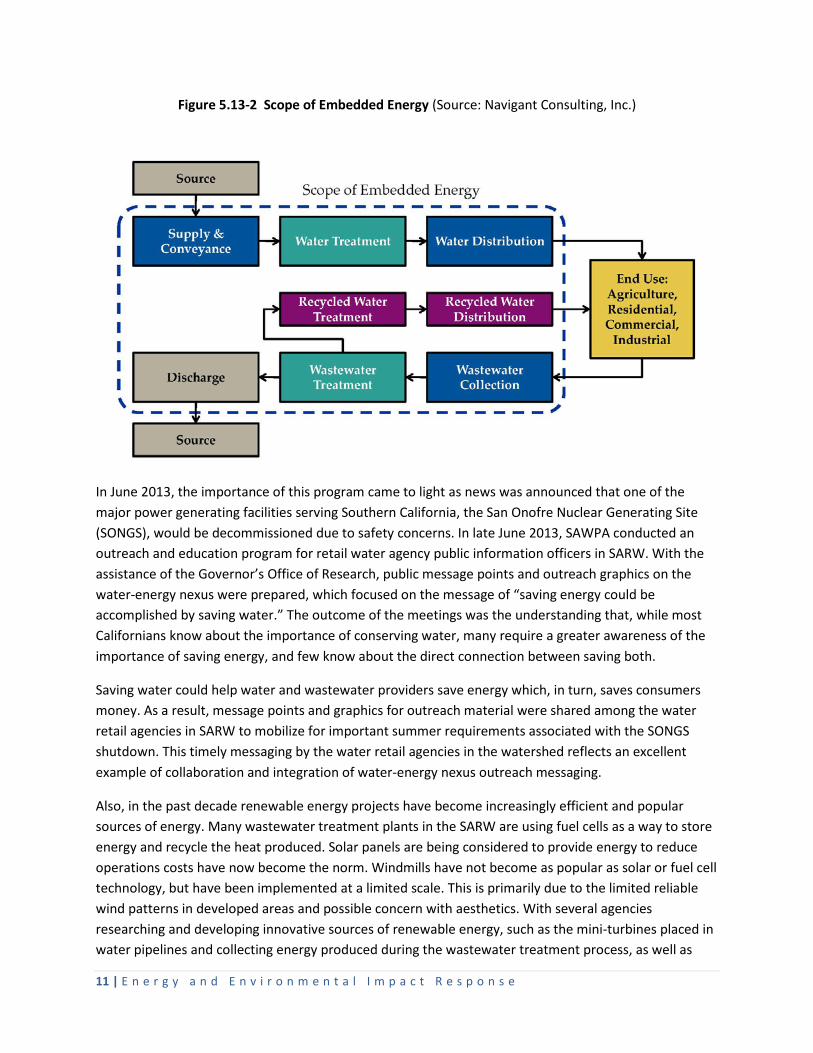
Figure 5.13-2 Scope of Embedded Energy (Source: Navigant Consulting, Inc.)
In June 2013, the importance of this program came to light as news was announced that one of the major power generating facilities serving Southern California, the San Onofre Nuclear Generating Site (SONGS), would be decommissioned due to safety concerns. In late June 2013, SAWPA conducted an outreach and education program for retail water agency public information officers in SARW. With the assistance of the Governor’s Office of Research, public message points and outreach graphics on the water-energy nexus were prepared, which focused on the message of “saving energy could be accomplished by saving water.” The outcome of the meetings was the understanding that, while most Californians know about the importance of conserving water, many require a greater awareness of the importance of saving energy, and few know about the direct connection between saving both.
Saving water could help water and wastewater providers save energy which, in turn, saves consumers money. As a result, message points and graphics for outreach material were shared among the water retail agencies in SARW to mobilize for important summer requirements associated with the SONGS shutdown. This timely messaging by the water retail agencies in the watershed reflects an excellent example of collaboration and integration of water-energy nexus outreach messaging.
Also, in the past decade renewable energy projects have become increasingly efficient and popular sources of energy. Many wastewater treatment plants in the SARW are using fuel cells as a way to store energy and recycle the heat produced. Solar panels are being considered to provide energy to reduce operations costs have now become the norm. Windmills have not become as popular as solar or fuel cell technology, but have been implemented at a limited scale. This is primarily due to the limited reliable wind patterns in developed areas and possible concern with aesthetics. With several agencies researching and developing innovative sources of renewable energy, such as the mini-turbines placed in water pipelines and collecting energy produced during the wastewater treatment process, as well as
12 | E n e r g y a n d E n v i r o n m e n t a l I m p a c t R e s p o n s e
local energy rebates being offered by federal and state government, the probability of increased levels of reliable and renewable sources of energy is very likely. In the near future, one can expect to see more water agencies moving to be “gridless” through renewable energy projects.
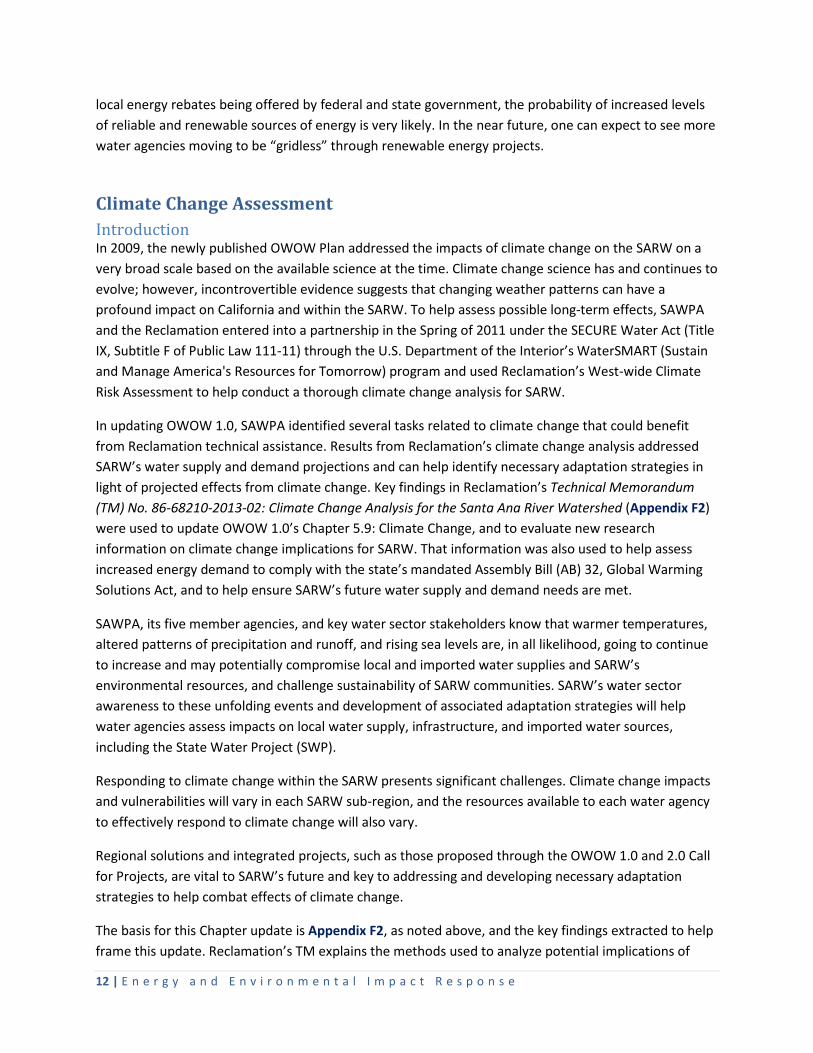
Climate Change Assessment
Introduction In 2009, the newly published OWOW Plan addressed the impacts of climate change on the SARW on a very broad scale based on the available science at the time. Climate change science has and continues to evolve; however, incontrovertible evidence suggests that changing weather patterns can have a profound impact on California and within the SARW. To help assess possible long-term effects, SAWPA and the Reclamation entered into a partnership in the Spring of 2011 under the SECURE Water Act (Title IX, Subtitle F of Public Law 111-11) through the U.S. Department of the Interior’s WaterSMART (Sustain and Manage America's Resources for Tomorrow) program and used Reclamation’s West-wide Climate Risk Assessment to help conduct a thorough climate change analysis for SARW.
In updating OWOW 1.0, SAWPA identified several tasks related to climate change that could benefit from Reclamation technical assistance. Results from Reclamation’s climate change analysis addressed SARW’s water supply and demand projections and can help identify necessary adaptation strategies in light of projected effects from climate change. Key findings in Reclamation’s Technical Memorandum (TM) No. 86-68210-2013-02: Climate Change Analysis for the Santa Ana River Watershed (Appendix F2) were used to update OWOW 1.0’s Chapter 5.9: Climate Change, and to evaluate new research information on climate change implications for SARW. That information was also used to help assess increased energy demand to comply with the state’s mandated Assembly Bill (AB) 32, Global Warming Solutions Act, and to help ensure SARW’s future water supply and demand needs are met.
SAWPA, its five member agencies, and key water sector stakeholders know that warmer temperatures, altered patterns of precipitation and runoff, and rising sea levels are, in all likelihood, going to continue to increase and may potentially compromise local and imported water supplies and SARW’s environmental resources, and challenge sustainability of SARW communities. SARW’s water sector awareness to these unfolding events and development of associated adaptation strategies will help water agencies assess impacts on local water supply, infrastructure, and imported water sources, including the State Water Project (SWP).
Responding to climate change within the SARW presents significant challenges. Climate change impacts and vulnerabilities will vary in each SARW sub-region, and the resources available to each water agency to effectively respond to climate change will also vary.
Regional solutions and integrated projects, such as those proposed through the OWOW 1.0 and 2.0 Call for Projects, are vital to SARW’s future and key to addressing and developing necessary adaptation strategies to help combat effects of climate change.
The basis for this Chapter update is Appendix F2, as noted above, and the key findings extracted to help frame this update. Reclamation’s TM explains the methods used to analyze potential implications of
13 | E n e r g y a n d E n v i r o n m e n t a l I m p a c t R e s p o n s e
changing climate, and how those implications might affect issues of importance to SAWPA and the SARW.
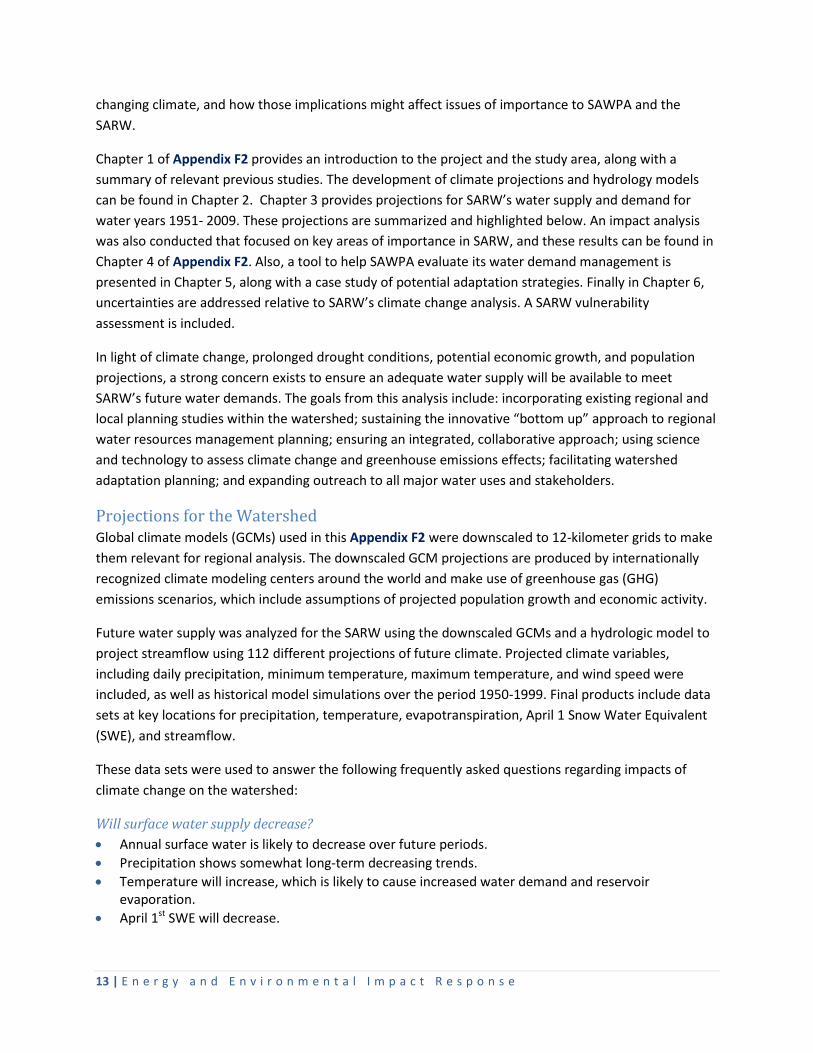
Chapter 1 of Appendix F2 provides an introduction to the project and the study area, along with a summary of relevant previous studies. The development of climate projections and hydrology models can be found in Chapter 2. Chapter 3 provides projections for SARW’s water supply and demand for water years 1951- 2009. These projections are summarized and highlighted below. An impact analysis was also conducted that focused on key areas of importance in SARW, and these results can be found in Chapter 4 of Appendix F2. Also, a tool to help SAWPA evaluate its water demand management is presented in Chapter 5, along with a case study of potential adaptation strategies. Finally in Chapter 6, uncertainties are addressed relative to SARW’s climate change analysis. A SARW vulnerability assessment is included.
In light of climate change, prolonged drought conditions, potential economic growth, and population projections, a strong concern exists to ensure an adequate water supply will be available to meet SARW’s future water demands. The goals from this analysis include: incorporating existing regional and local planning studies within the watershed; sustaining the innovative “bottom up” approach to regional water resources management planning; ensuring an integrated, collaborative approach; using science and technology to assess climate change and greenhouse emissions effects; facilitating watershed adaptation planning; and expanding outreach to all major water uses and stakeholders.
Projections for the Watershed Global climate models (GCMs) used in this Appendix F2 were downscaled to 12-kilometer grids to make them relevant for regional analysis. The downscaled GCM projections are produced by internationally recognized climate modeling centers around the world and make use of greenhouse gas (GHG) emissions scenarios, which include assumptions of projected population growth and economic activity.
Future water supply was analyzed for the SARW using the downscaled GCMs and a hydrologic model to project streamflow using 112 different projections of future climate. Projected climate variables, including daily precipitation, minimum temperature, maximum temperature, and wind speed were included, as well as historical model simulations over the period 1950-1999. Final products include data sets at key locations for precipitation, temperature, evapotranspiration, April 1 Snow Water Equivalent (SWE), and streamflow.
These data sets were used to answer the following frequently asked questions regarding impacts of climate change on the watershed:
Will surface water supply decrease? • Annual surface water is likely to decrease over future periods. • Precipitation shows somewhat long-term decreasing trends. • Temperature will increase, which is likely to cause increased water demand and reservoir
evaporation. • April 1st SWE will decrease.
14 | E n e r g y a n d E n v i r o n m e n t a l I m p a c t R e s p o n s e
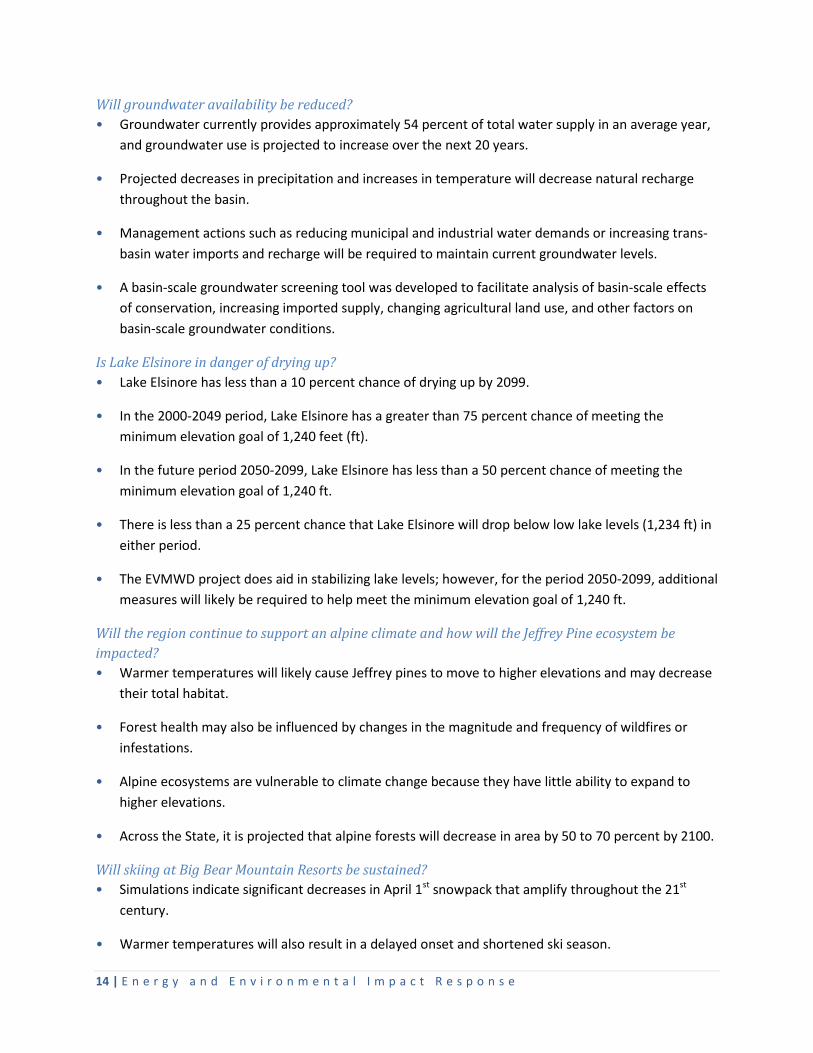
Will groundwater availability be reduced? • Groundwater currently provides approximately 54 percent of total water supply in an average year,
and groundwater use is projected to increase over the next 20 years.
• Projected decreases in precipitation and increases in temperature will decrease natural recharge throughout the basin.
• Management actions such as reducing municipal and industrial water demands or increasing trans-basin water imports and recharge will be required to maintain current groundwater levels.
• A basin-scale groundwater screening tool was developed to facilitate analysis of basin-scale effects of conservation, increasing imported supply, changing agricultural land use, and other factors on basin-scale groundwater conditions.
Is Lake Elsinore in danger of drying up? • Lake Elsinore has less than a 10 percent chance of drying up by 2099.
• In the 2000-2049 period, Lake Elsinore has a greater than 75 percent chance of meeting the minimum elevation goal of 1,240 feet (ft).
• In the future period 2050-2099, Lake Elsinore has less than a 50 percent chance of meeting the minimum elevation goal of 1,240 ft.
• There is less than a 25 percent chance that Lake Elsinore will drop below low lake levels (1,234 ft) in either period.
• The EVMWD project does aid in stabilizing lake levels; however, for the period 2050-2099, additional measures will likely be required to help meet the minimum elevation goal of 1,240 ft.
Will the region continue to support an alpine climate and how will the Jeffrey Pine ecosystem be impacted? • Warmer temperatures will likely cause Jeffrey pines to move to higher elevations and may decrease
their total habitat.
• Forest health may also be influenced by changes in the magnitude and frequency of wildfires or infestations.
• Alpine ecosystems are vulnerable to climate change because they have little ability to expand to higher elevations.
• Across the State, it is projected that alpine forests will decrease in area by 50 to 70 percent by 2100.
Will skiing at Big Bear Mountain Resorts be sustained? • Simulations indicate significant decreases in April 1st snowpack that amplify throughout the 21st
century.
• Warmer temperatures will also result in a delayed onset and shortened ski season.
15 | E n e r g y a n d E n v i r o n m e n t a l I m p a c t R e s p o n s e
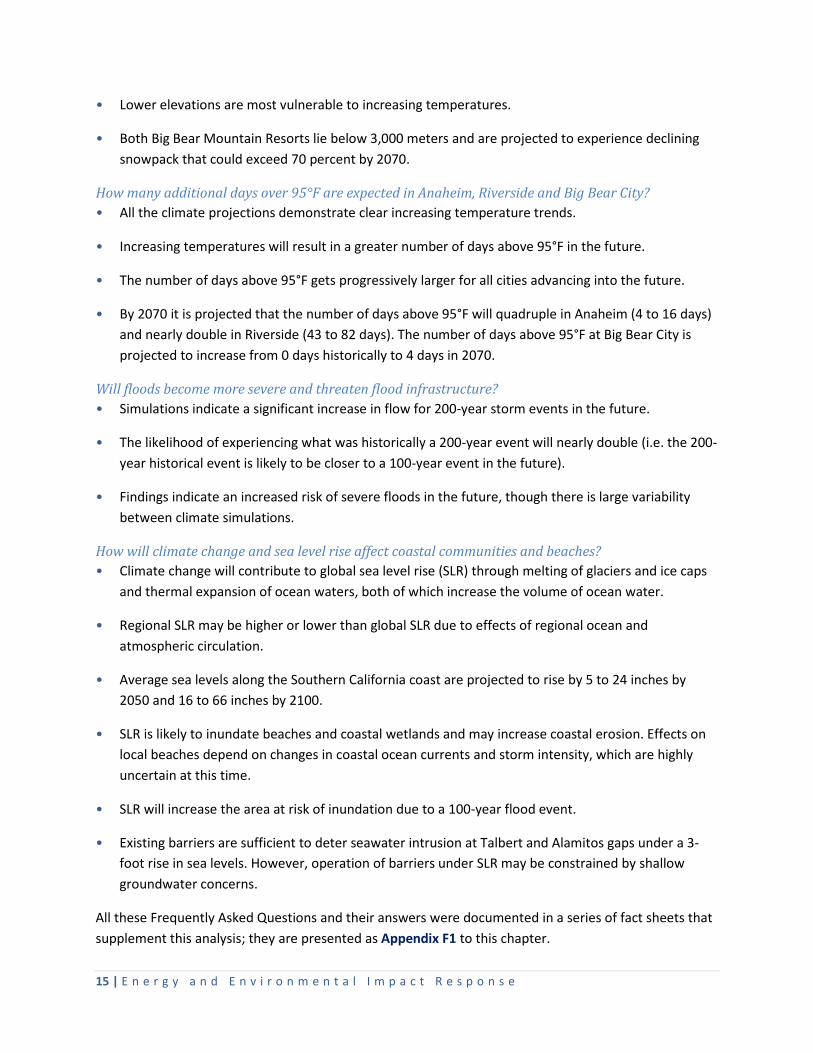
• Lower elevations are most vulnerable to increasing temperatures.
• Both Big Bear Mountain Resorts lie below 3,000 meters and are projected to experience declining snowpack that could exceed 70 percent by 2070.
How many additional days over 95°F are expected in Anaheim, Riverside and Big Bear City? • All the climate projections demonstrate clear increasing temperature trends.
• Increasing temperatures will result in a greater number of days above 95°F in the future.
• The number of days above 95°F gets progressively larger for all cities advancing into the future.
• By 2070 it is projected that the number of days above 95°F will quadruple in Anaheim (4 to 16 days) and nearly double in Riverside (43 to 82 days). The number of days above 95°F at Big Bear City is projected to increase from 0 days historically to 4 days in 2070.
Will floods become more severe and threaten flood infrastructure? • Simulations indicate a significant increase in flow for 200-year storm events in the future.
• The likelihood of experiencing what was historically a 200-year event will nearly double (i.e. the 200-year historical event is likely to be closer to a 100-year event in the future).
• Findings indicate an increased risk of severe floods in the future, though there is large variability between climate simulations.
How will climate change and sea level rise affect coastal communities and beaches? • Climate change will contribute to global sea level rise (SLR) through melting of glaciers and ice caps
and thermal expansion of ocean waters, both of which increase the volume of ocean water.
• Regional SLR may be higher or lower than global SLR due to effects of regional ocean and atmospheric circulation.
• Average sea levels along the Southern California coast are projected to rise by 5 to 24 inches by 2050 and 16 to 66 inches by 2100.
• SLR is likely to inundate beaches and coastal wetlands and may increase coastal erosion. Effects on local beaches depend on changes in coastal ocean currents and storm intensity, which are highly uncertain at this time.
• SLR will increase the area at risk of inundation due to a 100-year flood event.
• Existing barriers are sufficient to deter seawater intrusion at Talbert and Alamitos gaps under a 3-foot rise in sea levels. However, operation of barriers under SLR may be constrained by shallow groundwater concerns.
All these Frequently Asked Questions and their answers were documented in a series of fact sheets that supplement this analysis; they are presented as Appendix F1 to this chapter.
16 | E n e r g y a n d E n v i r o n m e n t a l I m p a c t R e s p o n s e
Climate Change Analysis Methodology Reclamation conducted an extensive literature review relevant to SARW, and also consulted with IEUA about their 2006 work with the RAND Corporation and the National Science Foundation that was used to prepare the Climate Change chapter for the SARW’s 2010 OWOW 1.0 Plan. The RAND report evaluated case studies addressing water management decision-making under conditions of abrupt climate change.
Under the OWOW 1.0 Plan’s Climate Change chapter, the IEUA’s 2005 Urban Water Management Plan (UWMP) was used to create a baseline case for water management. That plan emphasized development of local supplies and a reduced dependence on imported water supplies.
Under base-year conditions, approximately 70 percent of the water supplies come from local sources (e.g., groundwater, recycled water, and desalted groundwater supplies). These ratios of potential water supply sources are relatively common throughout SARW, but in some regions are less so, and some are more dependent on imported water. The UWMP projected that IEUA would be able meet nearly 80 percent of its service area water demand by 2025.
The RAND study showed that IEUA’s 2005 UWMP performed well under many potential climate change scenarios. Still, after four years of research, SARW faces significant risk to its water supply sources if nothing more is done now or in the future, especially to develop additional local supplies.
The core vulnerability identified from the UWMP model run was the region’s continued reliance on imported water supply; climate change scenarios show that imported supply is likely to be severely impacted by declines in statewide precipitation. The most cost-effective scenarios were those which included significant improvements in local water use efficiency along with the development of additional conjunctive use and recycled water programs.
For the OWOW 2.0 Plan Climate Change evaluation, Appendix F2, Reclamation reviewed a large body of research that has been conducted over the past ten or more years on climate change and how the western United States might be affected. Most of this research has focused on large-scale implications (for example, over the western United States), while providing limited regional scale information. The following section summarizes research that is relevant to the SARW, and shows that although these results are applicable, additional research was required – through this Basin Study – to evaluate smaller scale, site specific, climate change impacts.
Reclamation also used a combined physical and statistical modeling approach for the climate change research. Specific details on these approaches can be found in the report.
Observed trends in hydroclimatology over the western United States will likely have significant impacts on water resources planning and management. There have been preliminary efforts by agencies managing California’s water resources to incorporate climate change research into their planning and management tools, including preliminary modeling studies of potential impacts of climate change to operations of the SWP and Central Valley Project, Delta water quality and water levels, flood forecasting and evapotranspiration rates.
17 | E n e r g y a n d E n v i r o n m e n t a l I m p a c t R e s p o n s e
Weather projections for SARW, reflective of climate changes predicted by the scientific community’s global climate models, were developed. That data was used with a water management model to evaluate how various water management scenarios for the region would perform under different scenarios of climate and other management options.
The probable scenarios affecting water supplies in SARW included increased temperature but variable precipitation levels. It also was recognized and confirmed by Reclamation’s analysis that the statewide climate trends would likely result in reduced snowpack and runoff amounts, which would, in turn, reduce the amount of water that is likely to be available for water imports to the region.
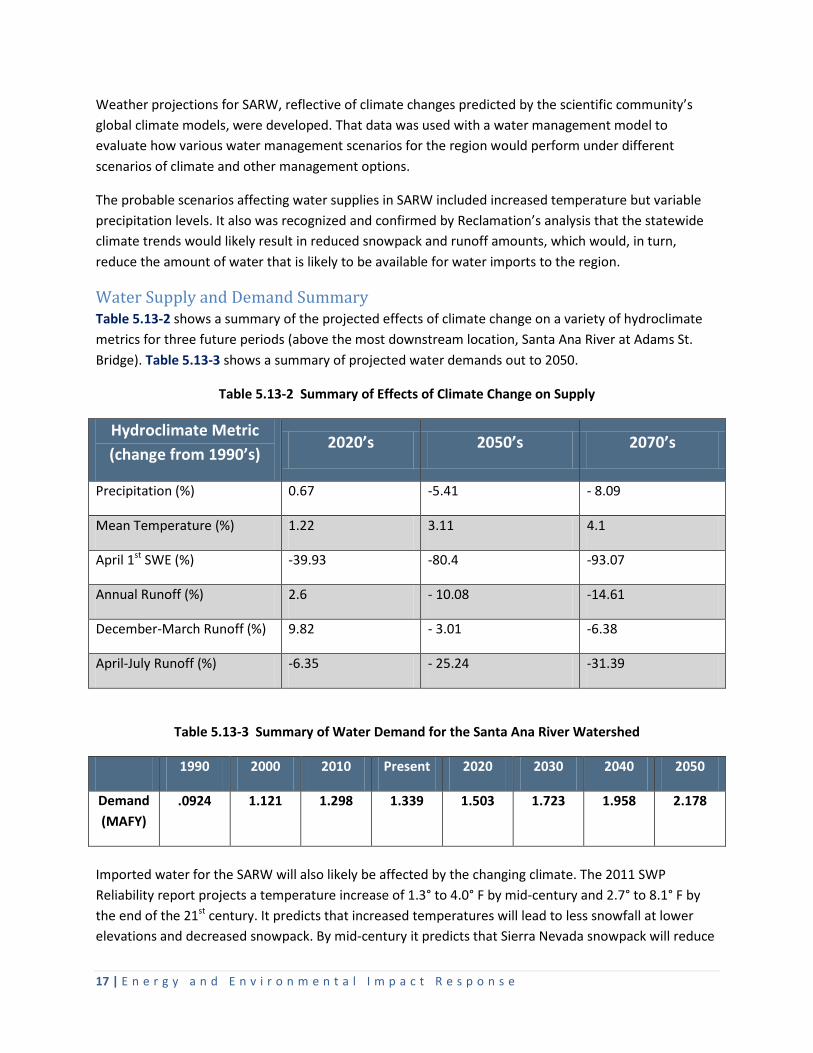
Water Supply and Demand Summary Table 5.13-2 shows a summary of the projected effects of climate change on a variety of hydroclimate metrics for three future periods (above the most downstream location, Santa Ana River at Adams St. Bridge). Table 5.13-3 shows a summary of projected water demands out to 2050.
Table 5.13-2 Summary of Effects of Climate Change on Supply
Hydroclimate Metric (change from 1990’s)
2020’s 2050’s 2070’s
Precipitation (%) 0.67 -5.41 - 8.09
Mean Temperature (%) 1.22 3.11 4.1
April 1st SWE (%) -39.93 -80.4 -93.07
Annual Runoff (%) 2.6 - 10.08 -14.61
December-March Runoff (%) 9.82 - 3.01 -6.38
April-July Runoff (%) -6.35 - 25.24 -31.39
Table 5.13-3 Summary of Water Demand for the Santa Ana River Watershed
1990 2000 2010 Present 2020 2030 2040 2050
Demand (MAFY)
.0924 1.121 1.298 1.339 1.503 1.723 1.958 2.178
Imported water for the SARW will also likely be affected by the changing climate. The 2011 SWP Reliability report projects a temperature increase of 1.3° to 4.0° F by mid-century and 2.7° to 8.1° F by the end of the 21st century. It predicts that increased temperatures will lead to less snowfall at lower elevations and decreased snowpack. By mid-century it predicts that Sierra Nevada snowpack will reduce
18 | E n e r g y a n d E n v i r o n m e n t a l I m p a c t R e s p o n s e
by 25 to 40 percent of its historical average. Decreased snowpack is projected to be greater in the northern Sierra Nevada, closer to the origin of SWP water, than in the southern Sierra Nevada. Furthermore, an increase in “rain on snow” events may lead to earlier runoff.
Given these changes, a water shortage worse than the 1977 drought could occur one out of every six to eight years by the middle of the 21st century and one out of every two to four years by the end of 21st century. Also, warmer temperatures might lead to increased demand. This factor, combined with declining flows, will likely lead to decreased carryover storage from year to year. Alternative water supply options, such as recycled water, rainwater harvesting, and desalination may need to be relied upon in order to meet the continually growing demand.
Sea Level Rise Impacts Climate change will contribute to global SLR through melting of glaciers and ice caps and thermal expansion of ocean waters, both of which increase the volume of water in the oceans. Regional SLR may be higher or lower than global SLR due to effects of regional ocean and atmospheric circulation.
California’s 2,000 miles of coastline has experienced just under eight inches of sea level rise over the past decade, a number that is likely to increase drastically as the climate continues to change. Critical infrastructure, such as roads, hospitals, schools, emergency facilities, wastewater treatment plants, power plants, and more will also be at increased risk of inundation, as would vast areas of wetlands and other natural ecosystems.
Flooding and erosion already pose a threat to communities along the California coast and there is compelling evidence that these risks will increase in the future. In areas where the coast erodes easily, SLR will likely accelerate shoreline recession due to erosion. Erosion of some barrier dunes may expose previously protected areas to flooding.
OCWD conducted a study to evaluate the potential effects of projected sea level rise on coastal Orange County groundwater conditions. Two locations were selected near the Talbert and Alamitos seawater intrusion injection barriers for analysis. The model for the analysis used data from well logs, aquifer pump tests, groundwater elevation measurements, hand-drawn contour maps, geologic cross sections, water budget spreadsheets, and other data stored in OCWD’s Water Resources Management System database.
The results showed that increasing temperatures will melt ice sheets and glaciers and cause thermal expansion of ocean water, both of which will increase the volume of water in the oceans and thus contribute to global mean SLR. Regional SLR may be higher or lower than global mean SLR due to regional changes in atmospheric and ocean circulation patterns. Regional mean sea level along the Southern California coast is projected to rise by 1.5 to 12 inches by 2030, 5 to 24 inches by 2050, and 16 to 66 inches by 2100.
Inundation due to SLR is likely to reduce the area of beaches and wetlands along the Southern California coast. In addition, SLR is likely to increase erosion of sea cliffs, bluffs, sand bars, dunes, and beaches
19 | E n e r g y a n d E n v i r o n m e n t a l I m p a c t R e s p o n s e
along the California coast. However, the overall effects of climate change on local beaches will depend on changes in coastal ocean currents and storm intensities, which are less certain at this time.
SLR is likely to increase the coastal area vulnerable to flooding during storm events. Also, detailed analysis carried out by OCWD found that the Talbert Barrier would be effective at preventing seawater intrusions through the Talbert Gap under a 3-foot sea level rise. In the case of the Alamitos Barrier, seawater intrusion through the Alamitos Gap would likely be prevented once current plans to construct additional injection wells are implemented. At both barriers, however, shallow groundwater concerns could limit injection rates and thus reduce the effectiveness of the barriers in preventing seawater intrusion under rising sea levels.
Addressing Climate Change Addressing climate change in OWOW 2.0 provides SAWPA staff, the OWOW Steering Committee, OWOW Pillars, and SARW’s water sector stakeholders with specific information necessary to plan, assess, and rank proposed IRWM projects. These proposed projects must address reductions to greenhouse gas (GHG) emissions within their water management activities. Projects are given a performance measure to help determine how effectively criteria are addressed, which helps with the ranking process.
Proposed projects that could be funded under the DWR IRWM Proposition 84 grant program and other funding programs can help adapt or mitigate effects from climate change, as they are required to track the effectiveness and performance of GHG emissions during and after implementation and construction.
SAWPA is a member in good standing with the California Climate Action Registry, and encourages SAWPA’s member agencies and water sector partners to also do the same. SAWPA also continuously tracks legislative developments at the Federal and State level that deal with climate change, especially as it relates to IRWM planning.
SAWPA and key watershed stakeholders continuously analyze current, past, and or proposed legislation and policies relative to the water sector, and the context of Executive Orders (EO), such as EO S-3-05, the California Global Warming Solutions Act of 2006 (AB 32); Senate Bill 97, the California Environmental Quality Act (CEQA) and GHG Emissions; and EO S-13-18, Climate Adaptation Strategy. The following list of publications, updates, and presentations, relative to California and climate change, have been reviewed and are continuously being monitored.
• Update to the Climate Change Scoping Plan, California Air Resources Board (2013)
• California Climate Adaptation Strategy, California Natural Resources Agency (2013 Update)
• Preparing for New Risks: Addressing Climate Change in California’s Urban Water Management Plans, University of California - Berkeley and DWR (June 2013)
• Sea-Level Rise for Coasts of California, Oregon, and Washington: Past, Present, and Future, The National Academies Press (June 2012)
• Atmospheric Rivers, Floods, and Climate Change, DWR (January 2012)
20 | E n e r g y a n d E n v i r o n m e n t a l I m p a c t R e s p o n s e
• Climate Change and Integrated Regional Water Management in California, University of California - Berkeley and DWR (June 2012)
• Climate Change, Extreme Weather, and Southern California Floods, DWR (January 2012)
• Draft Climate Action Plan Phase 1: Greenhouse Gas Emissions Reduction Plan, DWR (March 2012)
• Proposition 84 and 1E Guidelines Update, DWR (November 2012)
• California Adaptation Planning Guide, California Emergency Management Agency and Natural Resources Agency (July 2012)
• Climate Change Handbook for Regional Water Planning, DWR (November 2011)
• Water & Climate Change Adaptation Symposium: From the Sierra to the Ocean, DWR (October 2011)
• Annual Climate Change Reports, DWR (2008, 2009, 2010, & 2011).
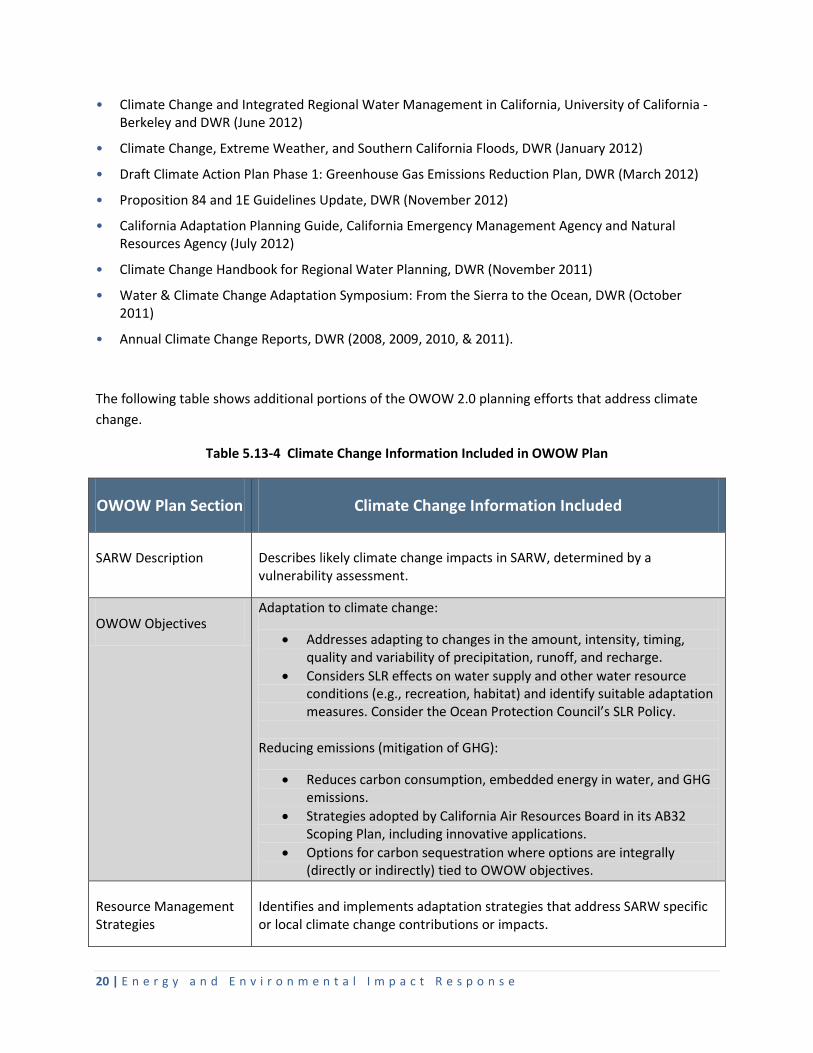
The following table shows additional portions of the OWOW 2.0 planning efforts that address climate change.
Table 5.13-4 Climate Change Information Included in OWOW Plan
OWOW Plan Section Climate Change Information Included
SARW Description Describes likely climate change impacts in SARW, determined by a vulnerability assessment.
OWOW Objectives Adaptation to climate change:
• Addresses adapting to changes in the amount, intensity, timing, quality and variability of precipitation, runoff, and recharge.
• Considers SLR effects on water supply and other water resource conditions (e.g., recreation, habitat) and identify suitable adaptation measures. Consider the Ocean Protection Council’s SLR Policy.
Reducing emissions (mitigation of GHG):
• Reduces carbon consumption, embedded energy in water, and GHG emissions.
• Strategies adopted by California Air Resources Board in its AB32 Scoping Plan, including innovative applications.
• Options for carbon sequestration where options are integrally (directly or indirectly) tied to OWOW objectives.
Resource Management Strategies
Identifies and implements adaptation strategies that address SARW specific or local climate change contributions or impacts.
21 | E n e r g y a n d E n v i r o n m e n t a l I m p a c t R e s p o n s e
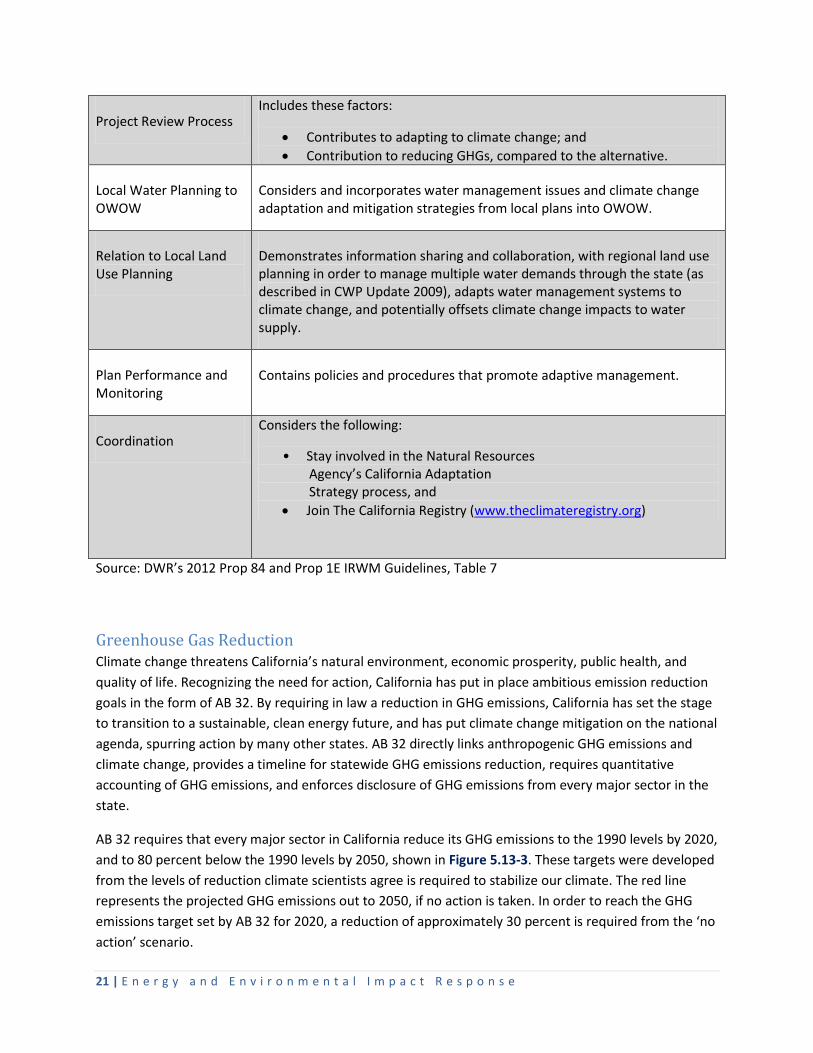
Project Review Process Includes these factors:
• Contributes to adapting to climate change; and • Contribution to reducing GHGs, compared to the alternative.
Local Water Planning to OWOW
Considers and incorporates water management issues and climate change adaptation and mitigation strategies from local plans into OWOW.
Relation to Local Land Use Planning
Demonstrates information sharing and collaboration, with regional land use planning in order to manage multiple water demands through the state (as described in CWP Update 2009), adapts water management systems to climate change, and potentially offsets climate change impacts to water supply.
Plan Performance and Monitoring
Contains policies and procedures that promote adaptive management.
Coordination Considers the following:
• Stay involved in the Natural Resources Agency’s California Adaptation Strategy process, and • Join The California Registry (www.theclimateregistry.org)
Source: DWR’s 2012 Prop 84 and Prop 1E IRWM Guidelines, Table 7
Greenhouse Gas Reduction Climate change threatens California’s natural environment, economic prosperity, public health, and quality of life. Recognizing the need for action, California has put in place ambitious emission reduction goals in the form of AB 32. By requiring in law a reduction in GHG emissions, California has set the stage to transition to a sustainable, clean energy future, and has put climate change mitigation on the national agenda, spurring action by many other states. AB 32 directly links anthropogenic GHG emissions and climate change, provides a timeline for statewide GHG emissions reduction, requires quantitative accounting of GHG emissions, and enforces disclosure of GHG emissions from every major sector in the state.
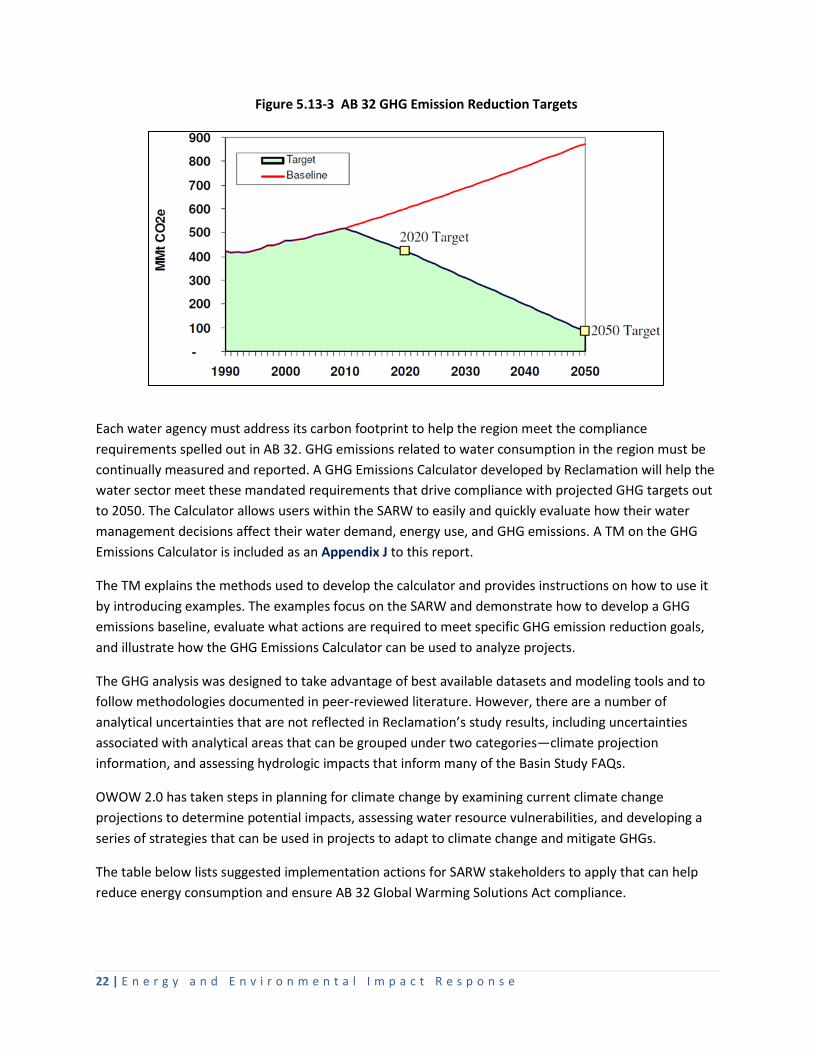
AB 32 requires that every major sector in California reduce its GHG emissions to the 1990 levels by 2020, and to 80 percent below the 1990 levels by 2050, shown in Figure 5.13-3. These targets were developed from the levels of reduction climate scientists agree is required to stabilize our climate. The red line represents the projected GHG emissions out to 2050, if no action is taken. In order to reach the GHG emissions target set by AB 32 for 2020, a reduction of approximately 30 percent is required from the ‘no action’ scenario.
22 | E n e r g y a n d E n v i r o n m e n t a l I m p a c t R e s p o n s e
Each water agency must address its carbon footprint to help the region meet the compliance requirements spelled out in AB 32. GHG emissions related to water consumption in the region must be continually measured and reported. A GHG Emissions Calculator developed by Reclamation will help the water sector meet these mandated requirements that drive compliance with projected GHG targets out to 2050. The Calculator allows users within the SARW to easily and quickly evaluate how their water management decisions affect their water demand, energy use, and GHG emissions. A TM on the GHG Emissions Calculator is included as an Appendix J to this report.
The TM explains the methods used to develop the calculator and provides instructions on how to use it by introducing examples. The examples focus on the SARW and demonstrate how to develop a GHG emissions baseline, evaluate what actions are required to meet specific GHG emission reduction goals, and illustrate how the GHG Emissions Calculator can be used to analyze projects.
The GHG analysis was designed to take advantage of best available datasets and modeling tools and to follow methodologies documented in peer-reviewed literature. However, there are a number of analytical uncertainties that are not reflected in Reclamation’s study results, including uncertainties associated with analytical areas that can be grouped under two categories—climate projection information, and assessing hydrologic impacts that inform many of the Basin Study FAQs.
OWOW 2.0 has taken steps in planning for climate change by examining current climate change projections to determine potential impacts, assessing water resource vulnerabilities, and developing a series of strategies that can be used in projects to adapt to climate change and mitigate GHGs.
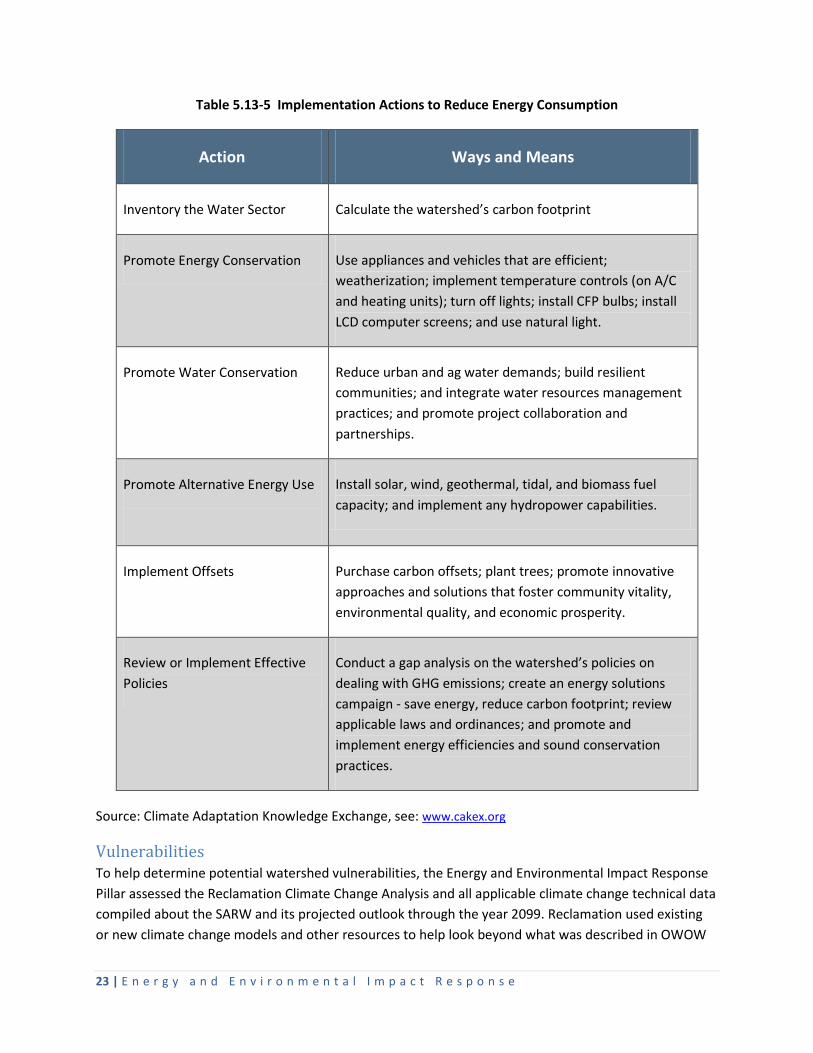
The table below lists suggested implementation actions for SARW stakeholders to apply that can help reduce energy consumption and ensure AB 32 Global Warming Solutions Act compliance.
Figure 5.13-3 AB 32 GHG Emission Reduction Targets
23 | E n e r g y a n d E n v i r o n m e n t a l I m p a c t R e s p o n s e
Table 5.13-5 Implementation Actions to Reduce Energy Consumption
Action Ways and Means
Inventory the Water Sector Calculate the watershed’s carbon footprint
Promote Energy Conservation Use appliances and vehicles that are efficient; weatherization; implement temperature controls (on A/C and heating units); turn off lights; install CFP bulbs; install LCD computer screens; and use natural light.
Promote Water Conservation
Reduce urban and ag water demands; build resilient communities; and integrate water resources management practices; and promote project collaboration and partnerships.
Promote Alternative Energy Use
Install solar, wind, geothermal, tidal, and biomass fuel capacity; and implement any hydropower capabilities.
Implement Offsets Purchase carbon offsets; plant trees; promote innovative approaches and solutions that foster community vitality, environmental quality, and economic prosperity.
Review or Implement Effective Policies
Conduct a gap analysis on the watershed’s policies on dealing with GHG emissions; create an energy solutions campaign - save energy, reduce carbon footprint; review applicable laws and ordinances; and promote and implement energy efficiencies and sound conservation practices.
Source: Climate Adaptation Knowledge Exchange, see: www.cakex.org
Vulnerabilities To help determine potential watershed vulnerabilities, the Energy and Environmental Impact Response Pillar assessed the Reclamation Climate Change Analysis and all applicable climate change technical data compiled about the SARW and its projected outlook through the year 2099. Reclamation used existing or new climate change models and other resources to help look beyond what was described in OWOW
24 | E n e r g y a n d E n v i r o n m e n t a l I m p a c t R e s p o n s e
1.0 and evaluate the amount, intensity, quality, variability of runoff, recharge, and imported water deliveries to the watershed that will potentially result from climate change.
Climate change is projected to affect many aspects of water resources management in the SARW. A critical first step to help prevent and/or mitigate those impacts is identifying key water sector vulnerabilities. Below is a summary of key vulnerabilities relative to the SARW:
Water Supply • Insufficient local water supply • Increased dependence on imported supply • Inability to meet water demand during droughts • Shortage in long-term operational water storage capacity
Water Quality
• Poor water quality • Increased water treatment needs
Flooding
• Increased flash flooding and inland flooding damage • Increased coastal flooding and inundation of coastal community storm drains • Damage to coastal community sewer systems from sea level rise
Ecosystem and Habitat
• Damage to coastal ecosystems and habitats • Adverse impacts to threatened and sensitive species from reduced terrestrial flows and SLR
Direct coordination with OCWD on SLR modeling in Orange County was also conducted to help assess potential impacts to their seawater intrusion barrier infrastructure and groundwater basins. Another part of critical criteria in addressing SARW’s vulnerabilities is dealing with GHG emissions from operations of construction equipment, passenger vehicle trips during construction and operation, transportation of construction materials and equipment, transportation of material inputs and output for operations and maintenance activities, generation of electricity used for project operations, and waste generation and disposal of materials during construction and operations.
Climate Change Adaptation Strategies
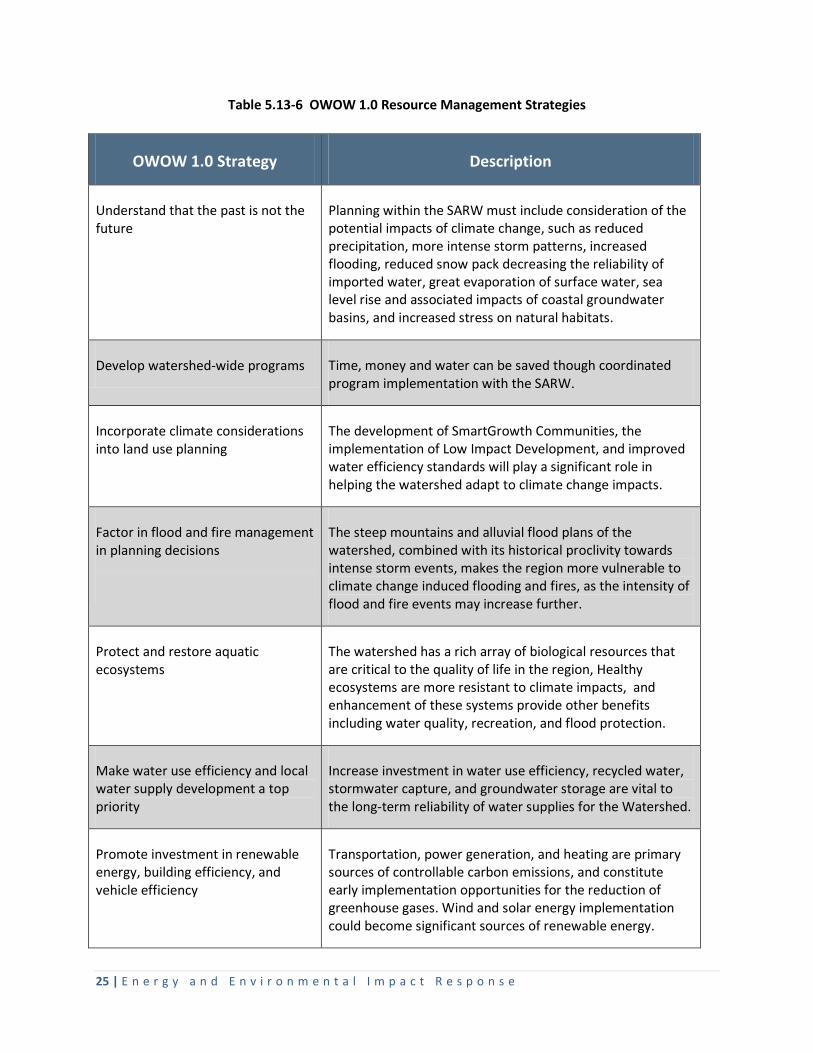
OWOW Implementation Activities Identifying SARW’s vulnerabilities helps establish a foundation for SAWPA staff, its member agencies and key stakeholders to implement actions and employ resource management strategies necessary to address, adapt to, and mitigate the projected effects of climate change. OWOW’s Resource Management Strategies, as identified in the OWOW 1.0 Plan and the follow-up implementation activities under the OWOW 2.0 Plan, are detailed in the two tables below.
25 | E n e r g y a n d E n v i r o n m e n t a l I m p a c t R e s p o n s e
Table 5.13-6 OWOW 1.0 Resource Management Strategies
OWOW 1.0 Strategy Description
Understand that the past is not the future
Planning within the SARW must include consideration of the potential impacts of climate change, such as reduced precipitation, more intense storm patterns, increased flooding, reduced snow pack decreasing the reliability of imported water, great evaporation of surface water, sea level rise and associated impacts of coastal groundwater basins, and increased stress on natural habitats.
Develop watershed-wide programs Time, money and water can be saved though coordinated program implementation with the SARW.
Incorporate climate considerations into land use planning
The development of SmartGrowth Communities, the implementation of Low Impact Development, and improved water efficiency standards will play a significant role in helping the watershed adapt to climate change impacts.
Factor in flood and fire management in planning decisions
The steep mountains and alluvial flood plans of the watershed, combined with its historical proclivity towards intense storm events, makes the region more vulnerable to climate change induced flooding and fires, as the intensity of flood and fire events may increase further.
Protect and restore aquatic ecosystems
The watershed has a rich array of biological resources that are critical to the quality of life in the region, Healthy ecosystems are more resistant to climate impacts, and enhancement of these systems provide other benefits including water quality, recreation, and flood protection.
Make water use efficiency and local water supply development a top priority
Increase investment in water use efficiency, recycled water, stormwater capture, and groundwater storage are vital to the long-term reliability of water supplies for the Watershed.
Promote investment in renewable energy, building efficiency, and vehicle efficiency
Transportation, power generation, and heating are primary sources of controllable carbon emissions, and constitute early implementation opportunities for the reduction of greenhouse gases. Wind and solar energy implementation could become significant sources of renewable energy.
26 | E n e r g y a n d E n v i r o n m e n t a l I m p a c t R e s p o n s e
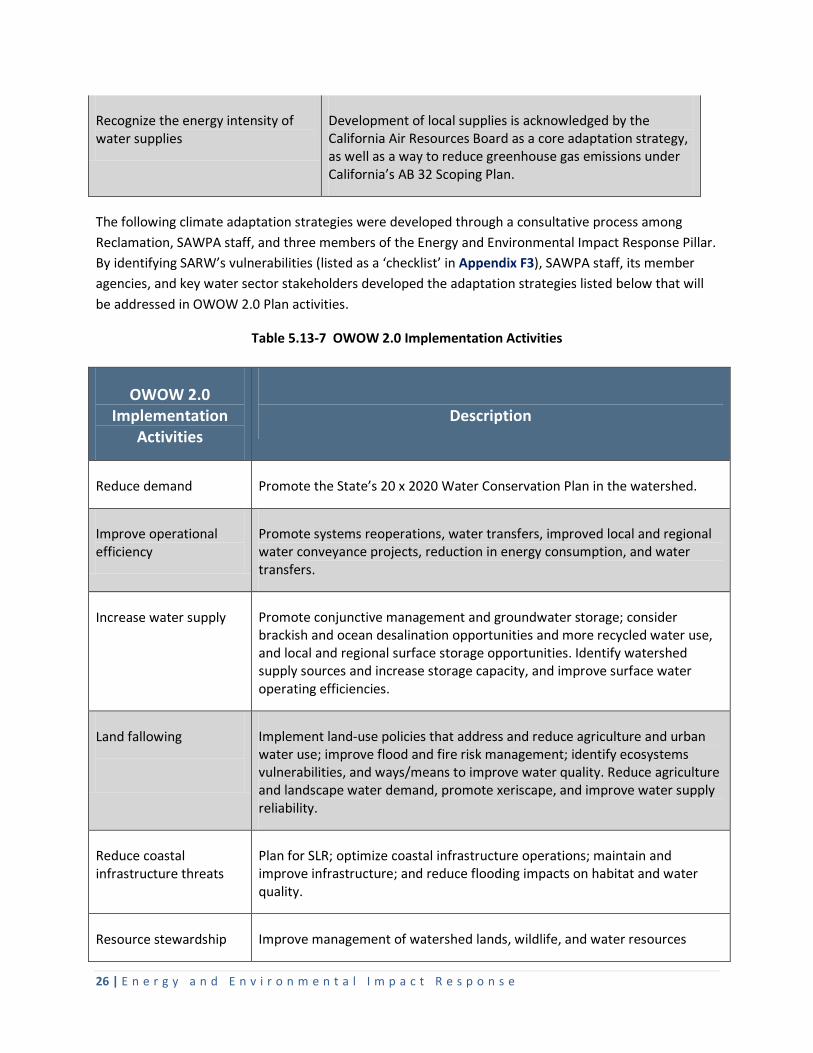
The following climate adaptation strategies were developed through a consultative process among Reclamation, SAWPA staff, and three members of the Energy and Environmental Impact Response Pillar. By identifying SARW’s vulnerabilities (listed as a ‘checklist’ in Appendix F3), SAWPA staff, its member agencies, and key water sector stakeholders developed the adaptation strategies listed below that will be addressed in OWOW 2.0 Plan activities.
Table 5.13-7 OWOW 2.0 Implementation Activities
Recognize the energy intensity of water supplies
Development of local supplies is acknowledged by the California Air Resources Board as a core adaptation strategy, as well as a way to reduce greenhouse gas emissions under California’s AB 32 Scoping Plan.
OWOW 2.0 Implementation
Activities
Description
Reduce demand Promote the State’s 20 x 2020 Water Conservation Plan in the watershed.
Improve operational efficiency
Promote systems reoperations, water transfers, improved local and regional water conveyance projects, reduction in energy consumption, and water transfers.
Increase water supply Promote conjunctive management and groundwater storage; consider brackish and ocean desalination opportunities and more recycled water use, and local and regional surface storage opportunities. Identify watershed supply sources and increase storage capacity, and improve surface water operating efficiencies.
Land fallowing
Implement land-use policies that address and reduce agriculture and urban water use; improve flood and fire risk management; identify ecosystems vulnerabilities, and ways/means to improve water quality. Reduce agriculture and landscape water demand, promote xeriscape, and improve water supply reliability.
Reduce coastal infrastructure threats
Plan for SLR; optimize coastal infrastructure operations; maintain and improve infrastructure; and reduce flooding impacts on habitat and water quality.
Resource stewardship Improve management of watershed lands, wildlife, and water resources
27 | E n e r g y a n d E n v i r o n m e n t a l I m p a c t R e s p o n s e
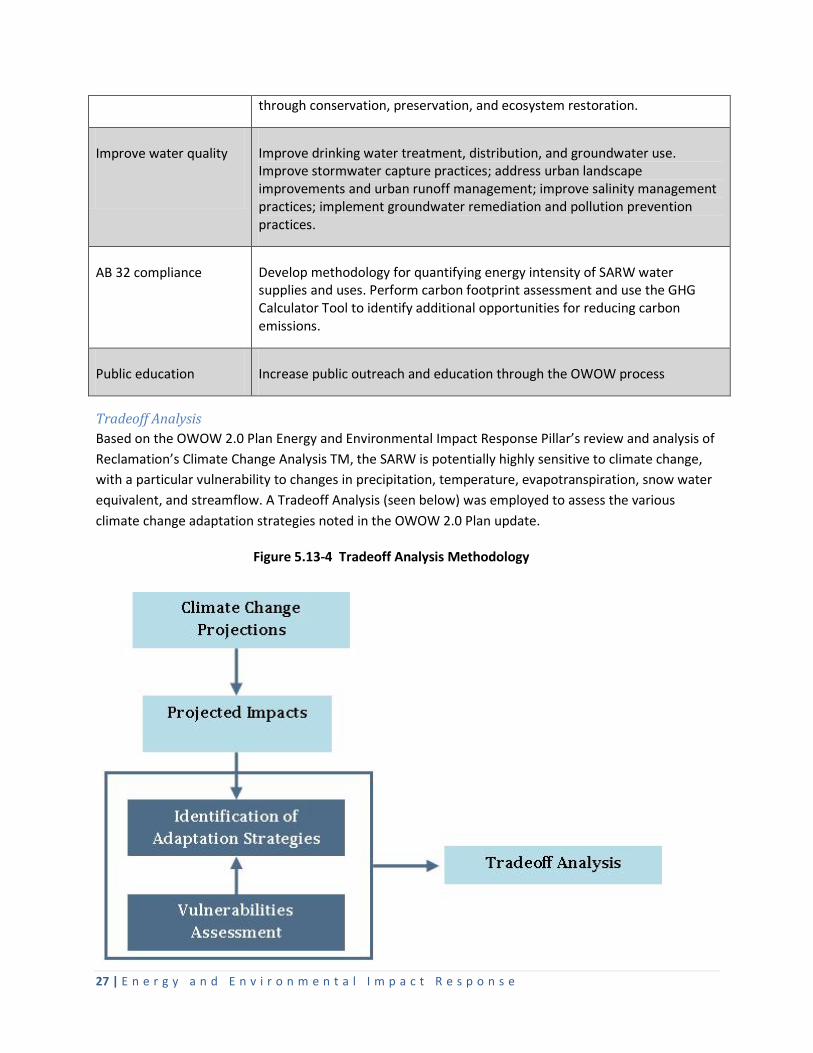
Tradeoff Analysis Based on the OWOW 2.0 Plan Energy and Environmental Impact Response Pillar’s review and analysis of Reclamation’s Climate Change Analysis TM, the SARW is potentially highly sensitive to climate change, with a particular vulnerability to changes in precipitation, temperature, evapotranspiration, snow water equivalent, and streamflow. A Tradeoff Analysis (seen below) was employed to assess the various climate change adaptation strategies noted in the OWOW 2.0 Plan update.
through conservation, preservation, and ecosystem restoration.
Improve water quality
Improve drinking water treatment, distribution, and groundwater use. Improve stormwater capture practices; address urban landscape improvements and urban runoff management; improve salinity management practices; implement groundwater remediation and pollution prevention practices.
AB 32 compliance Develop methodology for quantifying energy intensity of SARW water supplies and uses. Perform carbon footprint assessment and use the GHG Calculator Tool to identify additional opportunities for reducing carbon emissions.
Public education Increase public outreach and education through the OWOW process
Figure 5.13-4 Tradeoff Analysis Methodology
28 | E n e r g y a n d E n v i r o n m e n t a l I m p a c t R e s p o n s e
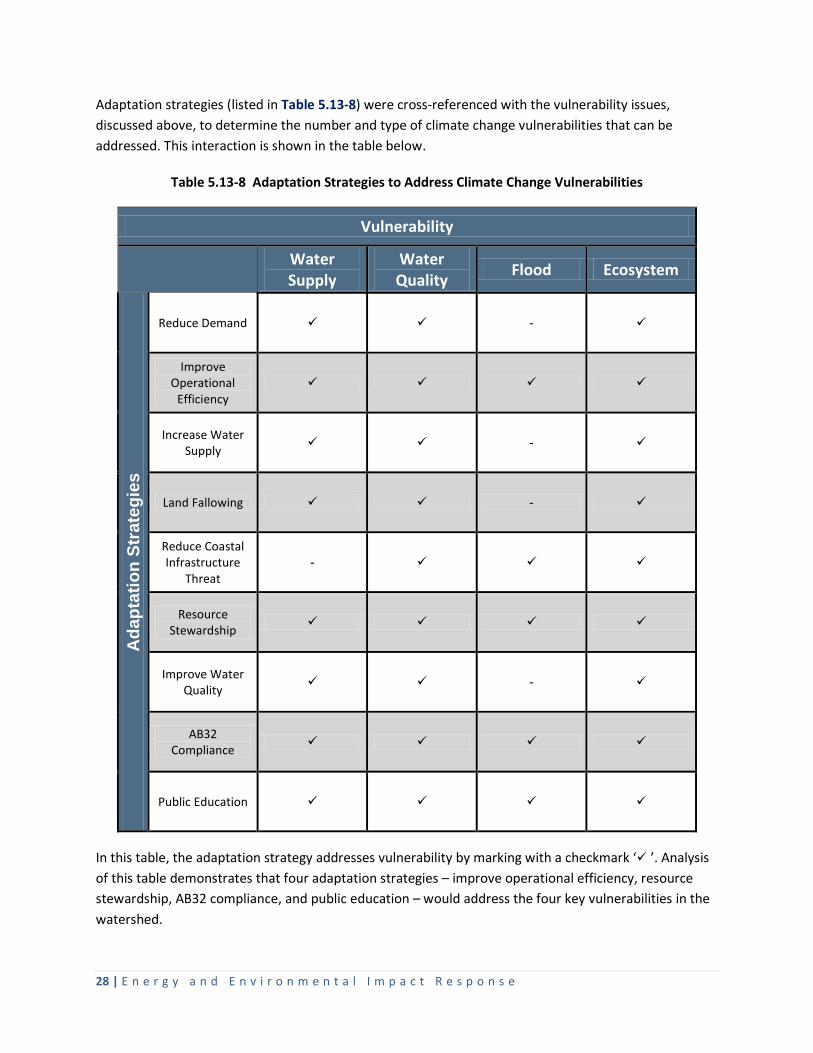
Adaptation strategies (listed in Table 5.13-8) were cross-referenced with the vulnerability issues, discussed above, to determine the number and type of climate change vulnerabilities that can be addressed. This interaction is shown in the table below.
Table 5.13-8 Adaptation Strategies to Address Climate Change Vulnerabilities
Vulnerability
Water Supply
Water Quality Flood Ecosystem
Ada
ptat
ion
Stra
tegi
es
Reduce Demand -
Improve Operational
Efficiency
Increase Water Supply -
Land Fallowing -
Reduce Coastal Infrastructure
Threat -
Resource Stewardship
Improve Water Quality -
AB32 Compliance
Public Education
In this table, the adaptation strategy addresses vulnerability by marking with a checkmark ‘ ’. Analysis of this table demonstrates that four adaptation strategies – improve operational efficiency, resource stewardship, AB32 compliance, and public education – would address the four key vulnerabilities in the watershed.
29 | E n e r g y a n d E n v i r o n m e n t a l I m p a c t R e s p o n s e
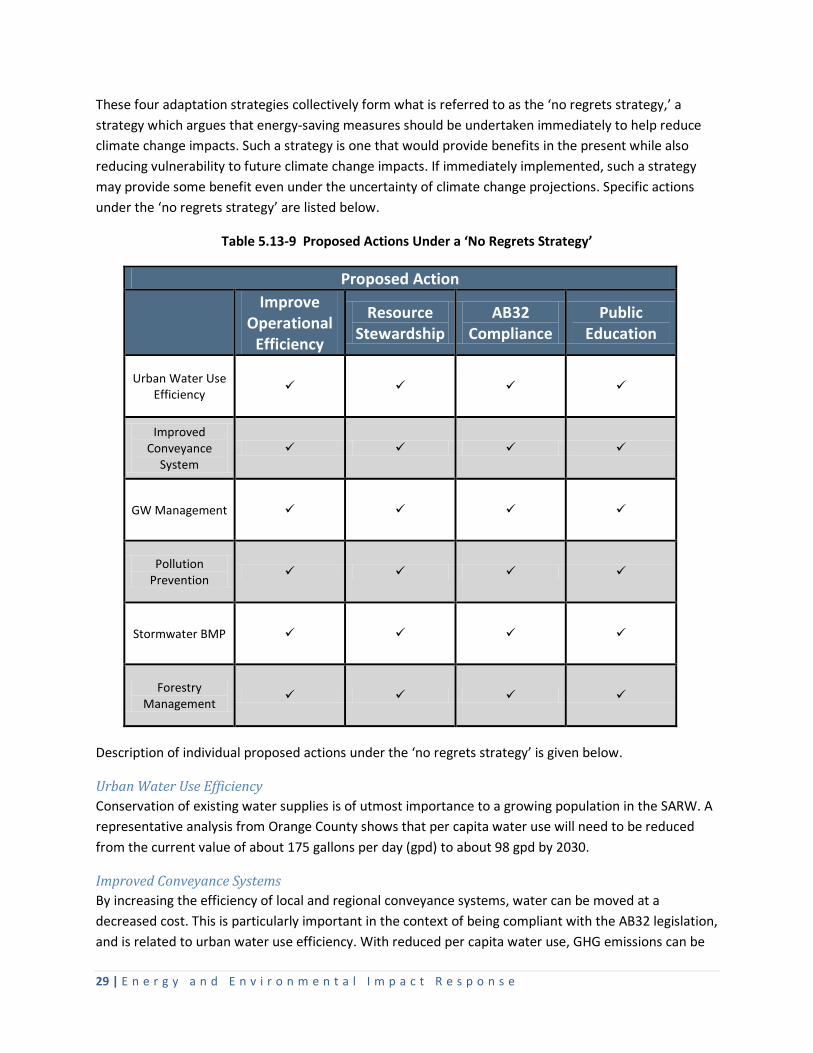
These four adaptation strategies collectively form what is referred to as the ‘no regrets strategy,’ a strategy which argues that energy-saving measures should be undertaken immediately to help reduce climate change impacts. Such a strategy is one that would provide benefits in the present while also reducing vulnerability to future climate change impacts. If immediately implemented, such a strategy may provide some benefit even under the uncertainty of climate change projections. Specific actions under the ‘no regrets strategy’ are listed below.
Table 5.13-9 Proposed Actions Under a ‘No Regrets Strategy’
Proposed Action
Improve Operational
Efficiency
Resource Stewardship
AB32 Compliance
Public Education
Urban Water Use Efficiency
Improved Conveyance
System
GW Management
Pollution Prevention
Stormwater BMP
Forestry Management
Description of individual proposed actions under the ‘no regrets strategy’ is given below.
Urban Water Use Efficiency Conservation of existing water supplies is of utmost importance to a growing population in the SARW. A representative analysis from Orange County shows that per capita water use will need to be reduced from the current value of about 175 gallons per day (gpd) to about 98 gpd by 2030.
Improved Conveyance Systems By increasing the efficiency of local and regional conveyance systems, water can be moved at a decreased cost. This is particularly important in the context of being compliant with the AB32 legislation, and is related to urban water use efficiency. With reduced per capita water use, GHG emissions can be
30 | E n e r g y a n d E n v i r o n m e n t a l I m p a c t R e s p o n s e
reduced from the current level of about 120,000 GHG emissions to about 75,000 GHG emissions by 2030.
Groundwater Management By taking into account the balance between groundwater and surface water, managers can improve long-term viability of each resource. Reclamation’s Groundwater Screening Tool evaluates impacts to groundwater from a changing climate, and evaluates effective conjunctive surface water groundwater management. The groundwater screening tool was applied to four groundwater basins (Orange County, Upper Santa Ana Valley, San Jacinto, and Elsinore) within the watershed. As an example, potential actions to avoid projected water level declines in Orange County are listed below. Each alternative listed will protect against groundwater declines through 2060.
• Reduce municipal and industrial demand with a gradual reduction of approximately 15 percent by 2020 (i.e., reduce per capita use from ~175 gpd in 2010 to ~150 gpd by 2020 to ~98 gpd by 2030).
• Increase local water supplies by ~75,000 acre-feet (af) per year through recycled water treatment capacity and development of seawater desalination capacity, and increase stormwater capture efficiency.
• Increase imports from the Colorado River Aqueduct and SWP gradually from ~30,000 af per year to ~105,000 af per year (this may not be feasible due to cost, greenhouse gas emissions, or availability).
• Reduce summertime groundwater pumping.
Pollution Prevention Preventing and remediating polluted water resources improves quality for users and improves long-term viability of local resources. This includes improved salt management in brackish desalinization and water reuse systems in the SARW. Specific alternatives analyzed include:
• Modify the existing Brine Line system.
• Salton Sea considerations including, restoration plans, salt load and increased water supply to the sea.
• Brine pre-treatment strategies.
• Alternative pipeline alignments including easement, right of way, and designs.
• Remediate polluted groundwater to reduce treatment of larger quantities of migrating water (future avoided costs).
31 | E n e r g y a n d E n v i r o n m e n t a l I m p a c t R e s p o n s e
Stormwater Best Management Practices Implementing stormwater best management practices (BMP) reduces storm runoff and pollution, improves groundwater recharge, improves air quality, reduces heat island effect, and decreases sun exposure to asphalt. BMPs will continue to be required in the SARW. SAWPA member agencies, flood control districts, and the Regional Water Quality Control Board will continue to enforce BMPs.
Forestry Management Create plans to restore, sustain and enhance forest health and watershed functions within forests. As part of forest management, SAWPA has initiated a Forest First initiative in collaboration with the U.S. Forest Service. As home to the headwaters of the Santa Ana River, the National Forests encompass approximately 30 percent of the SARW’s land mass. These forest areas also receive 90 percent of the SARW annual precipitation. Forest management practices have direct effects on both water quality and quantity, particularly relative to forest fires and the consequential effects of soil erosion and water storage. The collaborative efforts in the Forest First initiative include four main watershed restoration strategies that would provide significant benefits to downstream water supply and quality. The first of these strategies includes forest fuels management, which would focus on reducing understory growth that can contribute to the intensity of fires, making them more devastating and difficult to fight. The second strategy involves restoration of chaparral plant communities in areas that have not recovered due to repeated fires, and where native vegetation has been replaced by grasses that increase runoff, instead of the chaparral capturing and dispersing rainfall, and allowing moisture to percolate and recharge groundwater basins. The third strategy is meadow restoration that would involve returning water that had been converted to conveyance back to a meadow sheet flow so that the meadow can function in a natural groundwater recharge capacity. The last strategy involves retrofitting roads in order to reduce water conveyance, reduce fire risk, and increase the number of fire breaks. Further details on this initiative are available at: http://www.sawpa.org/collaboration/projects/forest-first/.
This analysis of the ‘no regrets strategy’ allows SAWPA, its member agencies, and key stakeholders an opportunity to assess proposed Proposition 84 projects and specific adaptation strategies, and the associated costs and benefits in terms of productivity, mitigation potential, resilience, and sustainability. The most promising projects and strategies can then become part of SAWPA’s toolbox of climate change adaptation strategies. SAWPA’s ‘no regret strategies’ will, however, tend to encourage incremental adaptation responses as opposed to more expansive adaptation responses.
Additional Strategies Beyond ‘no regrets strategies’, a group of actions, under what could be referred to as ‘low regrets strategies,’ can be formulated. ‘Low regrets strategies’ are designed to facilitate adaptation with respect to climate change predictions. These strategies are marginally more costly than ‘no regrets strategies’ and have a stronger reliance upon climate change predictions, especially for more severe scenario predictions. As such, they provide a scientifically conservative approach to public health and safety in terms of water supply.
32 | E n e r g y a n d E n v i r o n m e n t a l I m p a c t R e s p o n s e
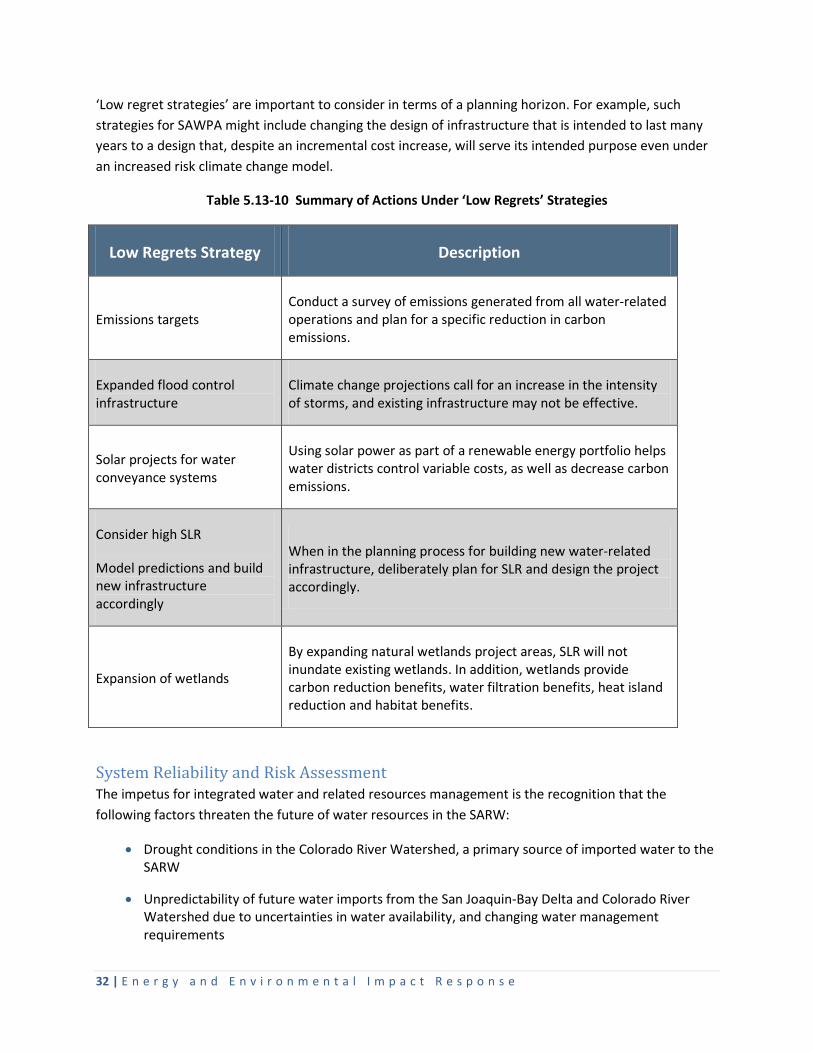
‘Low regret strategies’ are important to consider in terms of a planning horizon. For example, such strategies for SAWPA might include changing the design of infrastructure that is intended to last many years to a design that, despite an incremental cost increase, will serve its intended purpose even under an increased risk climate change model.
Table 5.13-10 Summary of Actions Under ‘Low Regrets’ Strategies
Low Regrets Strategy Description
Emissions targets Conduct a survey of emissions generated from all water-related operations and plan for a specific reduction in carbon emissions.
Expanded flood control infrastructure
Climate change projections call for an increase in the intensity of storms, and existing infrastructure may not be effective.
Solar projects for water conveyance systems
Using solar power as part of a renewable energy portfolio helps water districts control variable costs, as well as decrease carbon emissions.
Consider high SLR
Model predictions and build new infrastructure accordingly
When in the planning process for building new water-related infrastructure, deliberately plan for SLR and design the project accordingly.
Expansion of wetlands
By expanding natural wetlands project areas, SLR will not inundate existing wetlands. In addition, wetlands provide carbon reduction benefits, water filtration benefits, heat island reduction and habitat benefits.
System Reliability and Risk Assessment The impetus for integrated water and related resources management is the recognition that the following factors threaten the future of water resources in the SARW:
• Drought conditions in the Colorado River Watershed, a primary source of imported water to the SARW
• Unpredictability of future water imports from the San Joaquin-Bay Delta and Colorado River Watershed due to uncertainties in water availability, and changing water management requirements
33 | E n e r g y a n d E n v i r o n m e n t a l I m p a c t R e s p o n s e
• Continued population growth and development, which puts further stress on the natural hydrology of the watershed and increases the need for additional assured water supplies
• Uncertainties of climate change and its associated hydrologic variability
OWOW 2.0 is this watershed’s preliminary answer to these threats. The OWOW 2.0 Plan envisions a region where its stakeholders take an active role in creating a watershed that:
• Is sustainable, drought-proofed, and salt balanced by 2035
• Protects its water resources and uses water efficiently
• Supports economic and environmental viability
• Mitigates and adapts to a changing climate
• Corrects environmental justice deficiencies
• Minimizes interruptions to natural hydrology
• Creates a water ethic at both institutional and personal levels
Next Steps Several tools are available for SAWPA, its member agencies, and key water sector stakeholders to help address the effects of climate change and plan ways to adapt to or mitigate those potential impacts. Adaptation is the key component in the toolbox to help water resources planners and water sector decision-makers thoroughly understand and evaluate potential vulnerabilities from climate change impacts.
Research on climate change impacts is still evolving and as new findings are developed, they are shared throughout the SARW and California. SAWPA will continue to explore innovative quantitative tools to help assess vulnerabilities and conduct decision support analysis to help progress toward addressing climate change impacts in SARW. Actions that have been productive, and will continue to be in working toward this goal include:
• Aggregation of climate change knowledge from State and Federal research
• Further assess No and Low Regret strategies
• Develop a centralized and clearinghouse of information and lessons-learned for member agencies
• Offer web-based and workshop-delivered information on climate change impacts for the SARW
• Create adaptation strategies and share that information with the water sector
34 | E n e r g y a n d E n v i r o n m e n t a l I m p a c t R e s p o n s e
• Conduct webinars to further collaboration among water agencies
• Develop regional case studies to discuss implementation actions
• Bring additional agencies and officials into the discussion
• Encourage innovative projects and search for flexibility
• Seek to use evaluation studies/economic analysis as part of the message
• Examine co-benefits to gain more support
• Ensure disadvantaged and tribal communities have roles in the planning
• Continue to involve key watershed stakeholders
• Explore supportive resources/connections: Water Research Foundation, Water Environment Federation, Climate Ready Estuaries
• Collaborate whenever possible
Implications of Climate Change The SARW and its water sector leaders are preparing to meet the uncertainty associated with climate change, tackling its challenges head-on with various adaptation strategies and decision support tools from the latest climate science available. The region continues to see population and business growth and development. With unreliable imported water supply sources from the SWP and Colorado River, which could help sustain this growth and development, addressing the region’s water supply and demand management balance within finite water resources, will be equally challenging.
Additionally, the region’s increased construction and development patterns invite more hardscape surfaces, reduce natural water infiltration into groundwater basins, and impede groundwater recharge opportunities. The call for urban communities to employ more “green” development standards should be increased region-wide for all new and existing homes. These communities and the water sector should also embrace the Ahwahnee Water Principles (Principles) developed by California’s Local Government Commission. The Principles provide the communities of California a broader, more coordinated and more flexible water management system that tackles water quality, supply and flood risks together. In support of the Principles, several proposed Proposition 84 projects will help address potential water shortfalls once they are complete. They are: WMWD’s Customer Handbook for Using Water Efficiently in the Landscape, and its commercial, industrial, and institutional performance-based Water Use Efficiency Program; and the Inland Empire Utility Agency's (IEUA) Regional Residential Landscape Retrofit Program.
35 | E n e r g y a n d E n v i r o n m e n t a l I m p a c t R e s p o n s e
Coupled with all this uncertainty is a growing concern of the basin’s water quality and the cost of water from various (imported and local) supply sources. SAWPA, its member agencies, and watershed stakeholders, continue to explore alternative means to augment and convey imported water supplies, especially if they were to be interrupted on a large-scale from a major earthquake. Some additional options being addressed include developing more brackish desalination, increasing water recycling with advanced water treatment technologies, and cleaning up contaminated water plumes with advanced water treatment in SARW’s groundwater basins. None of these options are inexpensive, but investing in today’s technology may prove to be less costly in comparison to the future price of water. Investing in local resources now buys down risk to future key water vulnerabilities. Some projects that are proposed for funding under OWOW and DWR’s Proposition 84 Round 2 IRWM Implementation grant program include EMWD’s Perris Desalination Program - Brackish Water Wells 94, 95, & 96; the City of Irvine’s Peters Canyon Channel Water Capture and Reuse Pipeline; WMWD’s Arlington Basin Water Quality Improvement Program; and Lake Elsinore and San Jacinto Watersheds Authority’s Canyon Lake Hybrid Treatment Process.
Projected increases in the region’s temperature over time will increase water demand (and increase evapotranspiration) in urban communities and the environment. The heat island effect will also become more prominent, especially during summer months, as will the impacts to the region’s wildlife habitat and air quality. Heat islands can affect communities by increasing summertime peak energy demand, air conditioning costs, air pollution and GHG emissions, heat-related illness and mortality.
Less snowpack, which feeds SARW’s creeks, streams, and rivers, is projected in the future. Less runoff from snowmelt will negatively impact local water supply. Potential increases in storm intensity or extreme weather events will also increase the likelihood of impact and effects from flooding. Some of the proposed projects supported by OWOW will help abate that impact through more stormwater capture that would otherwise be lost to the sea. Stormwater runoff helps groundwater replenishment, and smarter management practices of that precious resource will help further basin-wide recharge efforts. Proposed projects supported by OWOW and DWR’s Proposition 84 IRWM Implementation program include the City of Yucaipa’s Wilson III Basin Project and Wilson Basins/Spreading Grounds; the City of Fontana’s Vulcan Pit Flood Control and Aquifer Recharge Project; the City of Ontario’s Francis Street Storm Drain and Ely Basin Flood Control and Aquifer Recharge Project; San Bernardino Valley Municipal Water District’s Enhanced Stormwater Capture and Recharge along the Santa Ana River project; and the IEUA’s San Sevaine Groundwater Recharge Basin.
SLR will impact Orange County coastal communities and some of their essential infrastructure and coastal habitat. SLR leads to flooding of low-lying areas, loss of coastal wetlands, erosion of coastal beaches, saltwater contamination of groundwater aquifers and impacts on roads, sewage treatment plants and other coastal infrastructure. It also increases sea water intrusion opportunities to coastal groundwater basins and impairs the available fresh water supplies, which, if affected, would require the use of advanced water treatment systems. That would raise the cost of water produced and delivered to the end-user. Orange County Water District’s Alamitos Barrier Improvement Project recommended by OWOW for funding under DWR’s Proposition 84 Round 2 IRWM Implementation grant program would help curtail potential seawater intrusion of their freshwater aquifer.
36 | E n e r g y a n d E n v i r o n m e n t a l I m p a c t R e s p o n s e
All these implications of climate change have a direct result on SARW’s socio-economics. Future predictions of development affect estimates of future climate change impacts. In some instances, different estimates of development trends can lead to a reversal from a predicted positive to a predicted negative impact, or vice versa. Climate change in the region will create inequalities between the counties that make up SARW, its communities, and within the watershed as a whole. The future level of adaptive capacity of SARW’s residents, businesses, and the natural systems to climate change will affect how our society will be impacted by climate change.
Future Considerations The SARW and our world, as we know it, will change over time, requiring that the strategies implemented to avoid, adapt, or mitigate the most severe impacts of climate change must be flexible enough to change too. The imminence and severity of the problems posed by the accelerating changes in the global climate are becoming increasingly evident: global surface temperatures are rising, heat waves and droughts are becoming more severe, storm events are becoming more frequent and more intense, land and sea ice cover is shrinking, sea level is rising, and the pH of the ocean is changing with the potential to disrupt healthy and functional ocean ecosystems. Our environment and the communities dependent on it are facing a global crisis with real, local impacts.
What is needed in these ever-changing times are ways to help identify research needs that can support scientifically-based regulations to minimize effects of climate change on our forests, aquatic resources, and fish and wildlife populations. Much of the most innovative work on climate change is occurring at the State and local levels, but this work must be coordinated with efforts around the globe to ensure reliability and consistency of approaches. Wherever you look in the SARW, it is not difficult to find at a city council, county board, or planning and zoning meeting where a concerned citizen is raising an energy policy or climate change concern and demanding action from their leaders.
SARW’s water sector leaders are also engaged in those discussions and, with respect to climate change and implementing an adaptation strategy, they are committed to helping reduce agency carbon footprint by reaching the mandated AB 32 compliance by 2020. SAWPA, its member agencies, and key watershed stakeholders, recognize that the reality of climate change is that human activity is contributing significantly to altering or damaging our environment, and that it has the potential to create significant social and economic impacts. Hence, climate change management strategies can help reduce the significance of the projected impacts.
The impacts of climate change span many issues, including: combined sewer overflows, inundation of treatment water and wastewater facilities, and shifts in the timing of the rainfall that recharges groundwater basins and provides much needed surface water supply to sustain the region’s drinking water supply and prevents saltwater intrusion in coastal aquifers. The new climate reality in SARW must incorporate land-use decisions across the watershed into regional water management strategies. This will be challenging because land-use decisions are often made at the local level, and the role for State or Federal agency engagement is not very clear.
37 | E n e r g y a n d E n v i r o n m e n t a l I m p a c t R e s p o n s e
Preserving the function of valuable ecosystem services is critical in the battle to combat the impacts of climate change in the region. One of the best things that can be done to prevent flooding is to preserve wetlands. Regulators and planners need to consider adaptation strategies when making decisions about preserving or filling local wetlands. Another land-use concern is building structures in the water or up to the water’s edge. Based on past data and the intensity of storms, such structures are vulnerable to damage and are unlikely to be rebuilt quickly given today’s economic situation. This type of thinking brings the conversation about building resilience to a watershed level.
Some of the greatest impacts related to local effects of climate change are highly variable and uncertain. SLR is the only factor in the climate equation that has durability and simplicity, and the observation that more frequent extreme events likely will occur at the local level is among the few that can be made with confidence. The need for resilience—that is, flexibility in thinking about a potential change and the ability to learn and adjust with the realities of that change—is very clear.
In developing management strategies that address climate change, SAWPA can serve as a catalyst throughout the watershed to help address human activity and instigate the necessary behavior changes to bring about meaningful desired effects. A plan of action detailing how SARW stakeholders can make a difference must be developed and periodically updated. External factors, such as weather changes, will prompt the need for watershed stakeholders to consider changes in technology, human behavior, and water sector investments to help address the uncertainty associated with climate change.
To that end, the SARW’s climate change analysis helps identify necessary adaptation strategies. These strategies focus on flood risk, stormwater management, and water use efficiency optimization. In this arid region of the state, every drop of water counts, and SAWPA and its member agencies and stakeholders need to nurture the resilience of the watershed.
Regional water resources planners must continue to address the watershed’s flood protection and stormwater capture opportunities, and must also promote more project integration with regional benefits. By implementing adaptation strategies that help optimize our finite water resources, realize greater water and energy conservation practices, and identify rain harvesting opportunities while implementing flood control measures, managers of SARW water resources can help reduce risk to property and lives.
To manage unavoidable impacts from a changing climate, water managers should consider changes to their infrastructure and storage reservoir operations, funding tools and incentives, and flood control approaches. Traditional approaches of the past are not adequate because they underestimate the severity and speed of climate change and overestimate the ability of natural systems to respond. Moreover, the impacts of climate change will have greater variability across our region than has been seen before. The water and energy resource management strategies described throughout this chapter should be implemented on a regional scale to harness process efficiencies and conservation savings.
OWOW 2.0 addresses this by developing an IRWM plan that is flexible, forward looking, and integrates environmental and societal constraints, considerations, and opportunities across stakeholder groups.
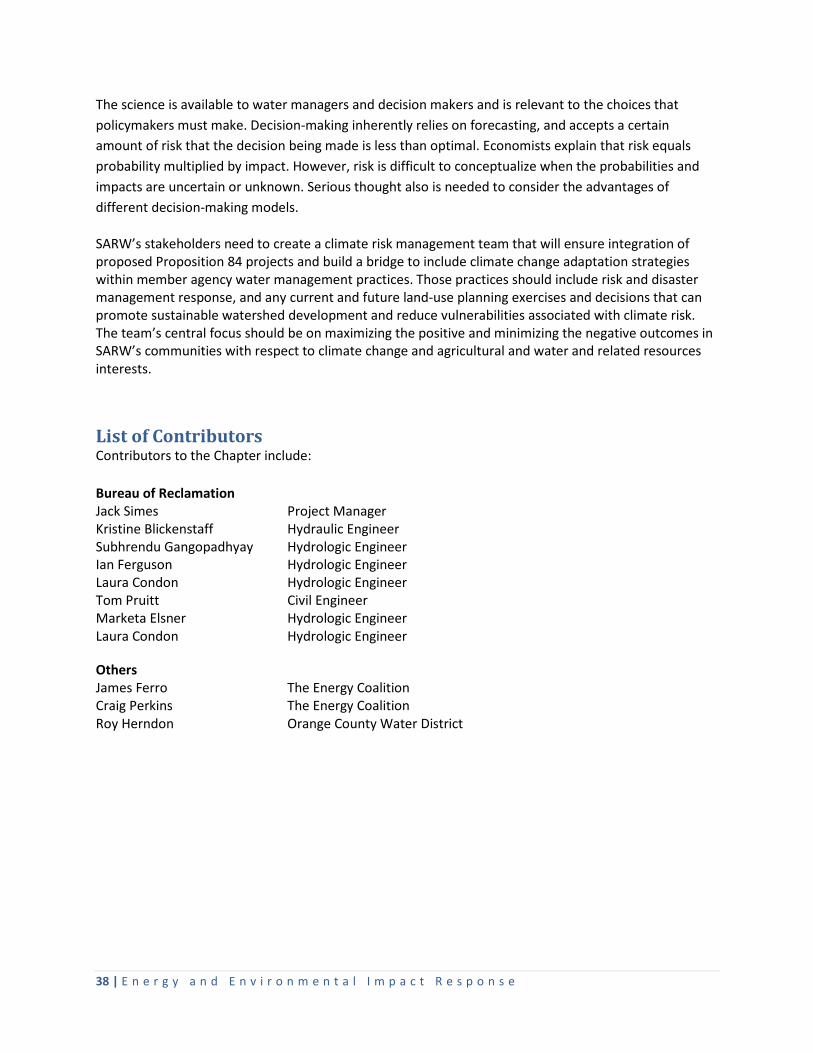
38 | E n e r g y a n d E n v i r o n m e n t a l I m p a c t R e s p o n s e
The science is available to water managers and decision makers and is relevant to the choices that policymakers must make. Decision-making inherently relies on forecasting, and accepts a certain amount of risk that the decision being made is less than optimal. Economists explain that risk equals probability multiplied by impact. However, risk is difficult to conceptualize when the probabilities and impacts are uncertain or unknown. Serious thought also is needed to consider the advantages of different decision-making models.
SARW’s stakeholders need to create a climate risk management team that will ensure integration of proposed Proposition 84 projects and build a bridge to include climate change adaptation strategies within member agency water management practices. Those practices should include risk and disaster management response, and any current and future land-use planning exercises and decisions that can promote sustainable watershed development and reduce vulnerabilities associated with climate risk. The team’s central focus should be on maximizing the positive and minimizing the negative outcomes in SARW’s communities with respect to climate change and agricultural and water and related resources interests.
List of Contributors Contributors to the Chapter include: Bureau of Reclamation Jack Simes Project Manager Kristine Blickenstaff Hydraulic Engineer Subhrendu Gangopadhyay Hydrologic Engineer Ian Ferguson Hydrologic Engineer Laura Condon Hydrologic Engineer Tom Pruitt Civil Engineer Marketa Elsner Hydrologic Engineer Laura Condon Hydrologic Engineer
Others James Ferro The Energy Coalition Craig Perkins The Energy Coalition Roy Herndon Orange County Water District


![Extreme Wave Loading on Offshore Wave Energy Devices using ... Energy/EWTEC 2009... · plexity are being investigated. Wave-wave interaction has successfully been modelled [1]. This](https://img.pdfslide.us/doc/110x75/5d36f3b388c993c93f8c170f/extreme-wave-loading-on-offshore-wave-energy-devices-using-energyewtec-2009.jpg)


![Energy Conversion and Managementracelab/static/Webpublication/2019-ECM-ZS.pdf · 2019-11-07 · [22]. Energy management strategies using MPC on shipboard micro-grids have been investigated](https://img.pdfslide.us/doc/110x75/5f651a801a29253f05441da6/energy-conversion-and-racelabstaticwebpublication2019-ecm-zspdf-2019-11-07.jpg)