Embed Size (px)
Citation preview

7/27/2019 1-s2.0-S1878535211003030-main
http://slidepdf.com/reader/full/1-s20-s1878535211003030-main 1/8
ORIGINAL ARTICLE
Characterization of activated carbon prepared
by phosphoric acid activation of olive stones
S.M. Yakout *, G. Sharaf El-Deen
Hot Labs Center, Atomic Energy Authority, P.C. 13759 Cairo, Egypt
Received 26 June 2011; accepted 10 December 2011
KEYWORDS
Activated carbon;
Yield;
Olive stones;
Phosphoric acid;
Porous texture
Abstract The effects of activating agent concentration on the pore structure and surface chemistry
of activated carbons derived from olive stone with chemical activation method using phosphoric acid
as the activating agent were studied. Mass changes associated with the impregnation, carbonization
and washing processes were measured. With H3PO4 dilute solutions (60, 70, and 80 wt% H3PO4), the
loading of substance on CS increases with concentration. The concentration of the H3PO4 solution
seems to control the processes of impregnation, carbonization and washing in the preparation of AC
from olive stones by H3PO4 chemical activation. ACs have been characterized from the resultsobtained by N2 adsorption at 77 K. Moreover, the fractal dimension (D) has been calculatedin order
to determine the AC surface roughness degree. Optimal textural properties of ACs have been
obtained by chemical activation with H3PO4 80 wt.%. The BET surface areas and total pore volumes
of the carbons produced at H3PO4 80 wt.% are 1218 m2/g and 0.6 cm3/g, respectively.
ª 2011 King Saud University. Production and hosting by Elsevier B.V. All rights reserved.
1. Introduction
Olives are the most extensively cultivated fruit crop in the
world. Olive cultivation is particularly widespread throughout
the Mediterranean region and plays an important role in its
rural economy, local heritage, and environment protection.
The largest producing countries are located in the Mediterra-
nean and Middle East regions providing 98% of the total cul-
tivated surface area, and 99% of the total olive fruit
production (Niaounakis and Halvadakis, 2006). The world
production of olives, for the year 2007, was 17.4 Mton, of
which 12.6 Mton came from Europe (FAOSTAT, 2009).Activated carbon is also among the potential conversions,
with applications in the removal of dyes, odors, tastes, and
contaminants, in water purification and other decontamina-
tion processes (Matos et al., 2010). Olive stone is a lignocellu-
losic material, with hemicellulose, cellulose and lignin as the
main components. Olive stones could be a very adequate feed-
stock to obtain active carbons with good adsorptive properties
and hardness, which could be of interest in future environmen-
tal protection programs.
Activated carbon (AC) is widely used on an industrial scale
as an adsorbent mainly in the purification/separation of liquids
and gases and also as a catalyst and catalyst support
* Corresponding author. Tel.: +20 0482807763.
E-mail address: [email protected] (S.M. Yakout).
1878-5352 ª 2011 King Saud University. Production and hosting by
Elsevier B.V. All rights reserved.
Peer review under responsibility of King Saud University.
doi:10.1016/j.arabjc.2011.12.002
Production and hosting by Elsevier
Arabian Journal of Chemistry (2012) xxx, xxx – xxx
King Saud University
Arabian Journal of Chemistry
www.ksu.edu.sawww.sciencedirect.com
Please cite this article in press as: Yakout, S.M., Sharaf El-Deen, G. Characterization of activated carbon prepared by phosphoricacid activation of olive stones. Arabian Journal of Chemistry (2012), doi:10.1016/j.arabjc.2011.12.002

7/27/2019 1-s2.0-S1878535211003030-main
http://slidepdf.com/reader/full/1-s20-s1878535211003030-main 2/8
(Olivares-Marin et al., 2006). Furthermore, newer applications
are ever emerging, particularly those concerning environmen-
tal protection and technological development.
There are basically two methods for activated carbons’ pro-
duction: physical and chemical activations. Physical activation
includes the carbonization of the starting material and the acti-
vationof thecarbonizate using steam andcarbon dioxide. In the
chemical activation method, phosphoric acid and zinc chloride
are used for the activation of lignocellulosic materials, whichhave not been carbonized previously; whereas metal com-
pounds such as potassium hydroxide are used for the activation
of coal precursors or chars. When compared to zinc chloride,
phosphoric acid is the most preferred because of the environ-
mental disadvantages associated with zinc chloride. Problems
of corrosion and inefficient chemical recovery are also associ-
ated with it. Moreover, the carbons obtained using zinc chloride
cannot be used in pharmaceutical and food industries as they
may contaminate the product (Prahas et al., 2008). Although
potassium hydroxide develops large microporosity, the yield
of activated carbon impregnated by potassium hydroxide is
lower than those activated with zinc chloride or phosphoric
acid, and at high temperature, i.e. > ±650 C, the carbon con-
tent is less than fixed carbon in the initial precursor. The pres-ence of metallic potassium will intercalate to the carbon
matrix(Prahas et al., 2008), yielding lower yield of activatedcar-
bon, less than the carbon content of the raw material. H3PO4 is
the most widely used impregnation agent. Using this substance,
most of the numerous studies carried out so far on the prepara-
tion of AC have focused on the influence of concentration of the
impregnation solution and soaking temperature on the porous
structure. Because of the highly polar character of H3PO4 and
hence the control of the physical and chemical interactions
occurring in the bulk of the solution and with the substratum
during the impregnation treatment, the solution concentration
is likely to be the primary factor of the activation process. Here,
dilute and concentrated solutions of H3PO4 are used in theimpregnation of an AC precursor, the influence of phosphoric
acid concentration on theloading of H3PO4 is investigated. This
work deals with the influence of the treatment methods of olive
stones and SEOP on the structure and surface properties of the
produced activated carbons.
2. Materials and methods
2.1. Active carbon preparation
As indicated above, olive stones (OS) were used as a precursor.
OS as received was ground, dried and sieved, and only the
fraction of particle sizes comprised between 1 and 2 mm wasselected for the preparation of activated carbons. Approxi-
mately, 50 g of conditioned OS was impregnated with 200 ml
of phosphoric acid solutions with concentrations of 60, 70
and 80 wt.% mixture stirred at 85 C, maintaining for 4 h to
ensure the access of H3PO4 to the interior of the olive stones.
After mixing, carbonization of acid-impregnated OS was car-
ried out in a stainless steel reactor provided with gas inlet
and outlet, which was placed in a vertical cylindrical furnace.
The temperature within the furnace was first calibrated and
the length and position of the constant temperature hot zone
determined. Heating from room temperature to the maximum
heat treatment temperature 500 C (i.e., carbonization
temperature) in inert atmosphere of nitrogen (flow
rate = 200 mL/min. The heating rate was 3 C/min and hold-
ing time 2 h). After heating, the system was cooled down to
room temperature under the same flow of nitrogen and the
product obtained was washed with distilled water until pH 6
was reached in the residual liquid and finally oven-dried at
120 C. OS6, OS7, OS8 were used as a label for activated car-
bon prepared from olive stones at H3PO4 60wt.%, 70wt.%,
80wt.% concentrations, respectively.Low temperature-ramping rate of 3 C/min was used in this
stage to minimize the temperature difference between the fur-
nace chamber and activation mixture as well as maintain the
mixture at a specific temperature range for enough time so that
perceptible activation extent could be obtained and an opti-
mized activation temperature range could be determined.
2.2. Active carbon characterization
Nitrogen adsorption/desorption isotherms were measured at
77 K on an automatic adsorption instrument (Quantachrome
Instruments, Model Nova1000e series, USA) in relative pres-
sure ranging from 10
6
to 0.999. Prior to the measurement,all the samples were crushed and powdered to shorten the time
required for reaching equilibrium in the isotherm study and de-
gassed at 250 C under nitrogen flow for 16 h.
The nitrogen adsorption–desorption isotherms were used to
determine the following parameters: specific surface area
SBET (according to the BET equation), total pore volume V tot(calculated from the nitrogen uptake at relative pressure of
0.95), total micropore volume V micro, according to simplified
equations (Mehandjiev et al., 1994; Nickolov and Mehandjiev,
2000, 1995), total mesopore volume V mes (determined by sub-
tracting the micropore volume from the total pore volume),
mean pore radius rp (calculated using the total pore volume
and the BET surface area, assuming a cylindrical pore model),
the micropore size distribution parameter X o (the half-width of the distribution curve maximum) was calculated according to
simplified equation of the Horvath–Kawazone (HK) method
(Ustinov and Do, 2002).
The fractal dimension is often used as an index of rough-
ness or irregularity of the surface of ACs (Dıaz-Dıez et al.,
2004) among other materials. In this work, the fractal dimen-
sion was determined by applying the FHH (Frenkel–Halsey–
Hill) equation (Halsey, 1948) to the adsorption isotherm.
Apparent (bulk) density of all samples was calculated as the
ratio between weight and volume of packed dry material.
The FTIR spectra of the samples were recorded between
4000 and 450 cm1 in a Perkin-Elmer 1720 spectrometer. Pel-
lets were prepared by thoroughly mixing carbon and KBr at
the 1:400 carbon/KBr weight ratio in a small size agate mortar.
The resulting mixture was compacted in a Perkin-Elmer man-
ual hydraulic press at 10 ton for 3 min.
The sample morphology was observed using a scanning
electron microscope (SEM) model JEOL 5400. The specimens
for SEM observation were prepared by depositing the fibers
onto specimen-stubs with conductive double sticky copper
tapes, and then sputter-coating (model Polaron SC7640, Quo-
rum Technologies Ltd., UK) the sample surface with Au–Pd to
prevent electrical charging during examination. Imaging was
done in the high vacuum mode under an accelerating voltage
of 15 kV, using secondary electrons.
2 S.M. Yakout, G. Sharaf El-Deen
Please cite this article in press as: Yakout, S.M., Sharaf El-Deen, G. Characterization of activated carbon prepared by phosphoricacid activation of olive stones. Arabian Journal of Chemistry (2012), doi:10.1016/j.arabjc.2011.12.002

7/27/2019 1-s2.0-S1878535211003030-main
http://slidepdf.com/reader/full/1-s20-s1878535211003030-main 3/8
3. Result and discussion
3.1. Yield of activated carbon
The nomenclature, operation conditions, density and yield of
the different samples prepared by the method of chemical acti-
vation with phosphoric acid are summarized in Table 1. The
results obtained clearly show that, as expected, as H3PO4 con-
centration increases the total yield of the process decreases.
Essentially, Olive stone is a lignocellulosic material, with hemi-
cellulose, cellulose and lignin as the main components. In acti-
vation or carbonization, these polymeric structures decompose
and liberate most of the non-carbon elements, mainly hydro-
gen, oxygen and nitrogen in the form of liquid (called as tars)
and gases, leaving behind a rigid carbon skeleton in the form
of aromatic sheets and strips. In other words, the reaction of
lignocellulose with phosphoric acid begins as soon as the com-
ponents are mixed, the acid first attacks hemicellulose and lig-
nin because cellulose is known to be more resistant to acid
hydrolysis (Jagtoyen and Derbyshire, 1998). Here the acid will
hydrolyze glycosidic linkages in lignocellulosic and cleave aryl
ether bond in lignin. These reactions are accompanied by fur-ther chemical transformations that include dehydration, degra-
dation, and condensation. As the acid concentration increases,
the aromatic condensation reactions also take place among the
adjacent molecules, which result in the evolution of gaseous
products from the hydroaromatic structure of carbonized char
leading to decreased yield of carbon (Timur et al., 2006). Also,
here the excess phosphoric acid will promote gasification of
char and increased the total weight loss of carbon. The same
result was also observed by other researchers (Jagtoyen and
Derbyshire, 1998; Timur et al., 2006).
As seen from table, the bulk density decreases with increas-
ing acid concentration. This means that increasing acid con-
centration results in carbon richer in carbon and is more
porous. Also, as seen the weight after impregnation increasesas the acid concentration increases. This means that the weight
of residue after phosphoric acid impregnation shows a great
influence of the H3PO4 concentration on the amount of
H3PO4 loaded on OS.
From these results it is clear that with the concentrated
H3PO4 solution a synergic effect occurred in the impregnation
of OS which was likely connected with the strong dependence
of the molecular association of H3PO4 on the concentration of
its aqueous solutions. Perhaps as a result of the loading of
H3PO4 on OS, the supernatant diluted and this facilitated the
vaporization of water to dryness. For the dilute solutions, the
solute–solvent interactions occurring in the bulk of the solution
shouldbe stronger than for theconcentrated solution because of the smaller degree of H3PO4 association, and this should have
an unfavorable effect on the loading of H3PO4 on OS.
Close inspection of the weight of carbon after washing com-
pared after carbonization indicates that loaded phosphoric
acid species were very sensitive to the subsequent washing.
This was expected as the mass loss produced by washing of
the OS-derived carbon with distilled water is attributable to
lixiviation of phosphorus species, which are very polar ions/
molecules and therefore highly soluble in water. Perhaps, the
solution process was favored as a result of a decrease in the size
of phosphorus species present in the OS carbon because of the
carbonization process.
A slightly lower bulk density of activated carbon product
was also observed at high phosphoric acid content due to the
difference in the pore structure of the carbon product as dis-
cussed later on.
3.2. Characterizing pore structure of the carbons
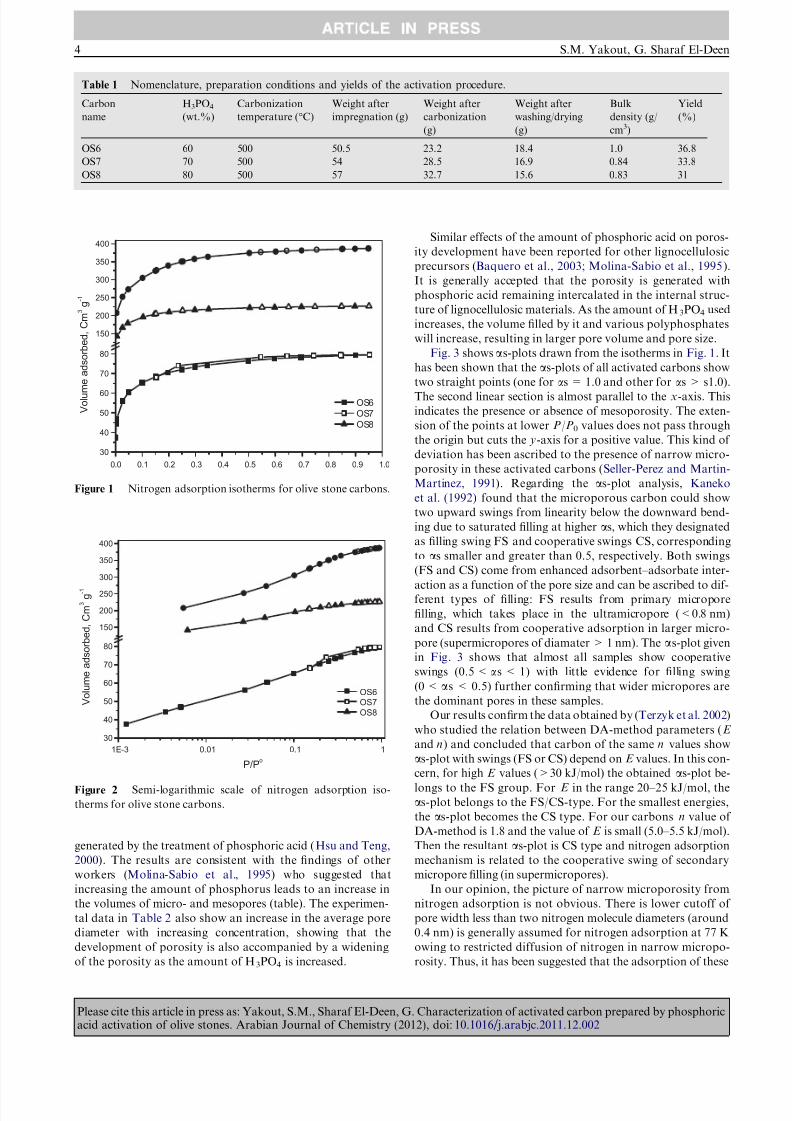
The shape of the adsorption isotherm can provide qualitative
information on the adsorption process and the extent of thesurface area available to the adsorbate. Fig. 1 shows the N2
adsorption–desorption isotherms at 196 C of OS-based car-
bon prepared by phosphoric acid activation at different con-
centration. It is apparent that all isotherms of all carbon
series belonging to type I according to the IUPAC classifica-
tion (Sing et al., 1985), showing a significant increase in the
adsorption at low P/P0 values (<0.1), with barely defined knee
and long plateau which extends to P/P0 1.0, indicate that the
ACFs are essentially microporous solids. An absence of hyster-
esis indicated the absence of mesoporosity, and suggested that
the carbon products contained mostly micropores with only a
small contribution of mesopore.
In the present investigation, although the adsorption iso-
therms for all samples are similar, the adsorption capacities
are significantly different according to the H3PO4 concentra-
tion. It was observed that increasing H3PO4 concentration
shifts the isotherm upward compared to that of other carbons.
To take full advantages of the information provided by
high-resolution nitrogen isotherm, these isotherms are repre-
sented on a semilogarithmic scale (Li et al., 1998). The adsorp-
tion isotherms expressed in a logarithmic pressure scale are
often useful to investigate the differences in the structural
properties especially at lower P/P0 region (Park and Jung,
2003). Adsorption processes can be divided into several dis-
tinct stages at relative pressures of 106 –104, 104 –102,
102 –101, 0.1–0.9, and 0.9–1.0 which can be attributed to
multiple stage pore filling processes (Ryu et al., 2000), suchas: (i) filling of narrow micropores; (ii) monolayer formation
on the surfaces of wider micropores such as supermicropores;
(iii) filling of these wider micropores; (iv) monolayer formation
and filling of mesopores by capillary condensation, and (v) fill-
ing of macropores by capillary condensation, which takes
place at relative pressures close to unity.
Fig. 2 shows the adsorbed volume of N2 on the carbons vs.
the logarithmic pressure. As seen from these semilogarithmic
plots all samples show no uptake of nitrogen under a relative
pressure of 103, indicating the presence of a few ultra microp-
ores. There is significant uptake of nitrogen in the relative pres-
sure range of 103 –101 indicating that all prepared samples
have great part of its pores as super micropores and wider
micropores.
The effect of acid concentration on the BET surface area,
micropore, mesopore volume, and total pore volume are given
in Table 2. The total pore volume, V total, was calculated from
nitrogen adsorption data as volume of liquid nitrogen at a rel-
ative pressure of 0.95. The micropore volume, V micro, was
determined by DR method, and the mesopore volume, V meso,
was obtained by the subtraction of micropore volume and
total pore volume. As can be seen, the BET surface area and
total pore volume increase with the increasing acid concentra-
tion. The increase in porosity with temperature can be attrib-
uted to the release of tars from cross-linked framework
Characterization of activated carbon prepared by phosphoric acid activation of olive stones 3
Please cite this article in press as: Yakout, S.M., Sharaf El-Deen, G. Characterization of activated carbon prepared by phosphoricacid activation of olive stones. Arabian Journal of Chemistry (2012), doi:10.1016/j.arabjc.2011.12.002
7/27/2019 1-s2.0-S1878535211003030-main
http://slidepdf.com/reader/full/1-s20-s1878535211003030-main 4/8
generated by the treatment of phosphoric acid (Hsu and Teng,
2000). The results are consistent with the findings of other
workers (Molina-Sabio et al., 1995) who suggested that
increasing the amount of phosphorus leads to an increase in
the volumes of micro- and mesopores (table). The experimen-
tal data in Table 2 also show an increase in the average pore
diameter with increasing concentration, showing that the
development of porosity is also accompanied by a widening
of the porosity as the amount of H3PO4 is increased.
Similar effects of the amount of phosphoric acid on poros-
ity development have been reported for other lignocellulosic
precursors (Baquero et al., 2003; Molina-Sabio et al., 1995).
It is generally accepted that the porosity is generated with
phosphoric acid remaining intercalated in the internal struc-
ture of lignocellulosic materials. As the amount of H3PO4 used
increases, the volume filled by it and various polyphosphates
will increase, resulting in larger pore volume and pore size.
Fig. 3 shows as-plots drawn from the isotherms in Fig. 1. It
has been shown that the as-plots of all activated carbons show
two straight points (one for as = 1.0 and other for as > s1.0).
The second linear section is almost parallel to the x-axis. Thisindicates the presence or absence of mesoporosity. The exten-
sion of the points at lower P/P0 values does not pass through
the origin but cuts the y-axis for a positive value. This kind of
deviation has been ascribed to the presence of narrow micro-
porosity in these activated carbons (Seller-Perez and Martin-
Martinez, 1991). Regarding the as-plot analysis, Kaneko
et al. (1992) found that the microporous carbon could show
two upward swings from linearity below the downward bend-
ing due to saturated filling at higher as, which they designated
as filling swing FS and cooperative swings CS, corresponding
to as smaller and greater than 0.5, respectively. Both swings
(FS and CS) come from enhanced adsorbent–adsorbate inter-
action as a function of the pore size and can be ascribed to dif-ferent types of filling: FS results from primary micropore
filling, which takes place in the ultramicropore (<0.8 nm)
and CS results from cooperative adsorption in larger micro-
pore (supermicropores of diamater > 1 nm). The as-plot given
in Fig. 3 shows that almost all samples show cooperative
swings (0.5 < as < 1) with little evidence for filling swing
(0 < as < 0.5) further confirming that wider micropores are
the dominant pores in these samples.
Our results confirm the data obtained by (Terzyk et al. 2002)
who studied the relation between DA-method parameters (E
and n) and concluded that carbon of the same n values show
as-plot with swings (FS or CS) depend on E values. In this con-
cern, for high E values (>30 kJ/mol) the obtained as-plot be-
longs to the FS group. For E in the range 20–25 kJ/mol, theas-plot belongs to the FS/CS-type. For the smallest energies,
the as-plot becomes the CS type. For our carbons n value of
DA-method is 1.8 and the value of E is small (5.0–5.5 kJ/mol).
Then the resultant as-plot is CS type and nitrogen adsorption
mechanism is related to the cooperative swing of secondary
micropore filling (in supermicropores).
In our opinion, the picture of narrow microporosity from
nitrogen adsorption is not obvious. There is lower cutoff of
pore width less than two nitrogen molecule diameters (around
0.4 nm) is generally assumed for nitrogen adsorption at 77 K
owing to restricted diffusion of nitrogen in narrow micropo-
rosity. Thus, it has been suggested that the adsorption of these
Table 1 Nomenclature, preparation conditions and yields of the activation procedure.
Carbon
name
H3PO4
(wt.%)
Carbonization
temperature (C)
Weight after
impregnation (g)
Weight after
carbonization
(g)
Weight after
washing/drying
(g)
Bulk
density (g/
cm3)
Yield
(%)
OS6 60 500 50.5 23.2 18.4 1.0 36.8
OS7 70 500 54 28.5 16.9 0.84 33.8
OS8 80 500 57 32.7 15.6 0.83 31
1E-3 0.01 0.1 1
30
40
50
60
70
80
150
200
250
300
350
400
OS6
OS7
OS8
V o l u m e a d s o r b e d ,
C m
3 g
- 1
P/Po
Figure 2 Semi-logarithmic scale of nitrogen adsorption iso-
therms for olive stone carbons.
0.0 0.1 0.2 0.3 0.4 0.5 0.6 0.7 0.8 0.9 1.0
30
40
50
60
70
80
150
200
250
300
350
400
OS6
OS7
OS8
V o l u m
e a d s o r b e d ,
C m
3 g
- 1
Figure 1 Nitrogen adsorption isotherms for olive stone carbons.
4 S.M. Yakout, G. Sharaf El-Deen
Please cite this article in press as: Yakout, S.M., Sharaf El-Deen, G. Characterization of activated carbon prepared by phosphoricacid activation of olive stones. Arabian Journal of Chemistry (2012), doi:10.1016/j.arabjc.2011.12.002

7/27/2019 1-s2.0-S1878535211003030-main
http://slidepdf.com/reader/full/1-s20-s1878535211003030-main 5/8
two molecules should be used in a complementary way in order
to characterize microporosity more fully such as carbon diox-
ide adsorption. In this way, data obtained from nitrogen
adsorption isotherms should only be taken as a qualitative esti-
mation of the presence, to a lesser or larger extent, of narrow
microporosity (Bello et al., 2002).Bansal et al., (1988) have fit adsorption data for strongly
activated and heterogeneous carbons with n values (of DA
equation) between 1.5 and 2. For the activated carbons studied
herein, it has been found that n is around 1.8. This indicates
that carbons under study are strongly activated with great het-
erogenous micropore structure.
The structural heterogeneity of porous material is generally
characterized in terms of the pore size distribution. This pore
size distribution represents a model of solid internal structure,
which assumes that an equivalent set of non-interacting and
regularly shaped model pores can represent the complex void
spaces within the real solid (Ismadji and Bhatia, 2001). The
pore size distribution is closely related to both kinetic and
equilibrium properties of porous material and perhaps is themost important aspect for characterizing the structural hetero-
geneity of porous materials used in industrial application. The
pore size distribution of the samples was evaluated by Horv-
arth–Kawazoe (HK) method (Ustinov and Do, 2002). The
HK pore size distribution of activated carbons studied is
shown in Fig. 4.
The HK plots are in all cases bimodal, with two maxima
centered around 0.8 and 1.0 nm for OS6 and shifted to new
two peak maxima 1.2 and 1.6 for OS7 and OS8 with the
increase of acid concentration. The predominant pore width
indicates here that the presence of semicropore (diame-
ter<0.7 nm) is not observed. OS8 exhibits larger values of
the micropore volumes, since the area under the HK curve is
larger in this latter case. The fact that the pore size distribution
plots show Downward end in the zone of the wider micropores
close to the mesopores (i.e., around 2 nm) suggests no develop-
ment of the mesoporosity in our samples.
3.3. External surfaces of resulting carbon using SEM
Scanning electron micrographs of the surface morphology of
different samples of the activated carbons are given in Fig. 5.
This figure shows the differences of the surface and porosity
of the activated carbons prepared at 60wt.% and 70wt.%
H3PO4. From these figures, it is obvious that the carbons pro-
duced at 60wt.% are non-porous carbons, while the activated
carbons produced at 70wt.% have cavities and cracks on their
external surfaces. It seems that the cavities on the surfaces of
carbons resulted from the evaporation of the activating agent
which in this case is phosphoric acid during carbonization,
leaving the space previously occupied by the activating agent.The impregnation with H3PO4 followed by a thermal treat-
ment under inert atmosphere involves a remarkable degrada-
tion of the microstructure. Such degradation is coupled to
relatively important mass losses. This mass effect becomes
more and more noticeable as the acid increases, which results
in a progressive decrease of the global yield of the process.
3.4. FTIR analysis
The carbon matrix does not consist of carbon atoms alone, but
is also formed by other heteroatoms like hydrogen, oxygen,
nitrogen, halogen, sulfur, phosphorus, etc. These heteroatoms
Table 2 Pore structure parameters of olive stones carbons.
Carbon S BET (m2/g) r (nm) V total (cc/g) V micro (cc/g) V meso (cc/g)
OS6 257 0.954 0.123 0.11 0.012
OS7 779 1.0 0.35 0.32 0.03
OS8 1218 1.1 0.6 0.5 0.1
0.0 0.5 1.0 1.5 2.0 2.5
0.000
0.002
0.004
0.006
0.008
0.010
0.012
0.014
0.016
0.018
0.020
0.022
OS6
OS7
OS8
d v c c / n m / g
pore width nm
Figure 4 H–K pore size distribution of olive stones activated
carbon samples.
0.4 0.6 0.8 1.0 1.2 1.4 1.6 1.8 2.0 2.2
50
100
150
200
250
300
350
400
OS6
OS7
OS8
V o l u m e a d s o r b e d c c / g
alpha
Figure 3 a-plot of various olive stones’ carbon samples.
Characterization of activated carbon prepared by phosphoric acid activation of olive stones 5
Please cite this article in press as: Yakout, S.M., Sharaf El-Deen, G. Characterization of activated carbon prepared by phosphoricacid activation of olive stones. Arabian Journal of Chemistry (2012), doi:10.1016/j.arabjc.2011.12.002

7/27/2019 1-s2.0-S1878535211003030-main
http://slidepdf.com/reader/full/1-s20-s1878535211003030-main 6/8
are bonded to the edges of the carbon layers, which govern the
surface chemistry of the activated carbon.
Infrared spectroscopy provides information on the chemi-
cal structure of the carbon material. Fig. 6 shows FTIR spectra
of the synthetic carbons obtained by phosphoric acid activa-
tion at different concentrations. All spectra show a wide trans-
mittance band at 3200–3600 cm1 with a maximum at about
3420–3440 cm
1
. This band can be assigned to the O–Hstretching mode of hydroxyl groups and adsorbed water. The
position and asymmetry of this band at lower wave numbers
indicate the presence of strong hydrogen bonds (from carbox-
yls, phenols or alcohols) (Solum et al., 1995). A weak sharp
transmittance band at 3733 cm1 present in spectra of all car-
bons and decreasing in carbons treated with high H3PO4 con-
centration (OS7 and OS8). This peak may be ascribed to
isolated O–H groups.
The FTIR spectrum of synthetic carbons OS6 and OS8
shows absorption bands due to aliphatic (2921 and
2855 cm1: C–H stretching in –CH–; 1450 cm1: –CH– defor-
mation). In Fig. 6, the bands at 885, 840, and 775 cm1 are due
to out-of-plane deformation mode of C–H for different substi-
tuted benzene rings. The small band at about 1700 cm
1 is usu-ally assigned to C‚ O stretching vibrations of ketones,
aldehydes, lactones or carboxyl groups.
The spectra of the prepared activated carbons also show a
strong band at 1600–1580 cm1 due to C–C vibrations in
aromatic rings. Broad band at 1000–1300 cm1 (maxima at
1190–1200 cm1) is usually found with oxidized carbons and
has been assigned to C–O stretching in acids, alcohols, phe-
nols, ethers and/or esters groups (Zawadzki, 1989). Neverthe-
less, it is also a characteristic of phosphorous and phosphor
carbonaceous compounds present in the phosphoric acid acti-vated carbons (Puziy et al., 2002). Assignment in this region is
difficult because absorption bands are overlapped. The peak at
1190–1200 cm1 may be also assigned to the stretching mode
of hydrogen-bonded P‚ O, to O–C stretching vibrations in
P–O–C (aromatic) linkage and to P‚ OOH (Puziy et al.,
2002). The shoulder at 1100 cm1 was ascribed to ionized link-
age P–O– in acid phosphate esters, and to symmetrical vibra-
tion in a P–O–P chain (Bourbigot et al., 1995). To conclude
on IR characterization, the most important changes
introduced by the increase of the acid concentration are the
development of C–H vibrations (possibly because of the loss
of oxygen at the surface of the carbon material) as well as
the increase of phosphorous group content (1100 cm1).
When concentrated H3PO4 is mixed with date stones at hightemperature, it appears to function both as an acid catalyst to
promote bond cleavage reactions and formation of cross-links
Figure 5 Scanning electron microscope of OS6 (a) and OS7 (b).
Figure 6 FTIR spectra of activated olive stones at different H3PO4 concentrations.
6 S.M. Yakout, G. Sharaf El-Deen
Please cite this article in press as: Yakout, S.M., Sharaf El-Deen, G. Characterization of activated carbon prepared by phosphoricacid activation of olive stones. Arabian Journal of Chemistry (2012), doi:10.1016/j.arabjc.2011.12.002

7/27/2019 1-s2.0-S1878535211003030-main
http://slidepdf.com/reader/full/1-s20-s1878535211003030-main 7/8
via processes such as cyclization and condensation and to
combine with organic species to form phosphate and polyphos-
phate bridges that connect and crosslink biopolymer fragments
(Jagtoyen and Derbyshire, 1998). Dastgheib and Rockstraw
(2001) proposed that various surface acidic functional groups
(oxygen- and/or phosphorus-containing groups) are developed
through the surface oxidation as well as attachment of different
oxygen/phosphorous groups to the surface, while developing re-
quired porosity. Benaddi et al. (1998) suggested that dehydra-tion of cellulose by phosphoric acid is similar to dehydration
of alcohols and at higher temperatures the phosphorous oxides
act as Lewis acids and can form C–O–P bonds.
3.5. Fractal dimension of samples
Fractal analysis has become a new and powerful tool to de-
scribe the surface heterogeneity, geometric and structural
properties of fractal surfaces and pore structures. The fractal
dimension is the number used to quantify these properties:
the larger the value of the surface fractal dimension, the more
irregular and rougher the pore surface (Pyun and Rhee, 2004).
According to Frenkel, Halsey and Hill, a perfectly smooth
surface has the fractal dimension of 2, whereas a very rough or
irregular surface has the fractal dimension of 3. An activated
carbon sample consists of very small crystallites such as graph-
ite and disorganized carbon, because of the cross-linked struc-
ture between the crystallites. If activated carbon has a
structure in which the crystallites are located parallel with re-
spect to each other and has no cross-linked structure between
the crystallites, then the fractal dimension is close to 2. On the
contrary, if the crystallites are located in a disorderly manner
and cross-linked structures develop, then the fractal dimension
is close to 3. Thus, there is a close relationship between changes
in the fractal dimension with that of the structure of activated
carbon (Hayashi et al., 2002).
The D values obtained for all products prepared in thisstudy are 2.95, 2.97 and 2.99 for OS6, OS7 and OS8, respec-
tively. Increase in D values is observed as H3PO4 concentration
grows which is indicative of a development of the porous tex-
ture, with the increasing concentration of acid. Generally all
samples have high values of fraction dimension near 3, which
suggests that the surfaces are irregular and have strong micro-
pore structures (Khalili et al., 2000).
4. Conclusions
Activated carbons with a well-developed pore structure are
prepared from Olive stone by chemical activation with phos-
phoric acid. In general, as the phosphoric acid concentrationincreases the porous structure developed gives high surface
and high total pore volume carbons.
References
Bansal, R.C., Donnet, J.B., Stoeckli, F., 1998. Active Carbon. Marcel
Deckker, New York.
Baquero, M.C., Giraldo, L., Moreno, J.C., Sua ´ rez-Garcı ´a, F., Martı ´-
nez-Alonso, A., Tasco ´ n, J.M.D., 2003. Activated carbons by
pyrolysis of coffee bean husks in presence of phosphoric acid. J.
Anal. Appl. Pyrolysis 70, 779–784.
Bello, G., Garcia, R., Arriagada, R., Sepulveda-Escribano, A.,
Rodriguez-Reinoso, F., 2002. Carbon molecular sieves from
eucalyptus globulus charcoal. Micropor. Mesopor. Mat. 56, 139–
145.
Benaddi, H., Legras, D., Rouzaud, J.N., Beguin, F., 1998. Influence of
the atmosphere in the chemical activation of wood by phosphoric
acid. Carbon 36, 306–309.
Bourbigot, S., Bras, M.L., Delobel, R., 1995. Carbonization mecha-
nisms resulting from intumescence. II. Association with an ethylene
terpolymer and the ammonium polyphosphate-pentaerythritol fireretardant system. Carbon 33 (3), 283–294.
Dastgheib, S.A., Rockstraw, D.A., 2001. Pecan shell activated carbon:
synthesis, characterization, and application for the removal of
copper from aqueous solution. Carbon 39, 1849–1855.
Dıaz-Dıez, M.A., Gomez-Serrano, V., Fernandez Gonzalez, C.,
Cuerda-Correa, E.M., Macıas-Garcıa, A., 2004. Porous texture of
activated carbons prepared by phosphoric acid activation of
woods. Appl. Sur. Sci. 238, 309–313.
FAOSTAT, 2009. Website of Food and Agriculture organization of
the United Nations. Available from: <http://faostat.fao.org/>.
Halsey, G.D., 1948. J. Chem. Phys. 16, 93.
Hayashi, J., Horikawa, T., Muroyama, K., Gomes, V.G., 2002.
Micropor. Mesopor. Mat. 55, 63–68.
Hsu, L.Y., Teng, H., 2000. Influence of different chemical reagents on
the preparation of activated carbons from bituminous coal. FuelProcess Technol. 64, 155–166.
Ismadji, S., Bhatia, S.K., 2001. Characterization of activated carbons
using liquid phase adsorption. Carbon 39, 1237–1250.
Jagtoyen, M., Derbyshire, F., 1998. Activated carbons from yellow
poplar and white oak by H3PO4 activation. Carbon 36, 1085–1097.
Kaneko, K., Ishii, C., Ruike, M., Kuwabara, H., 1992. Origin of super
high surface area and microcrystalline graphitic structures of
activated carbons. Carbon 30, 1075.
Khalili, N.R., Pan, M., Sandi, G., 2000. Determination of fractal
dimensions of solid carbons from gas and liquid phase adsorption
isothermes. Carbon 38, 573–588.
Li, Z., Kruk, M., Jaroniec, M., Ryu, S.K., 1998. Characterization of
structure and surface properties of activated carbon fiber. J.
Colloid. Interface Sci. 204, 151–156.
Matos, M., Barreiro, M.F., Gandini, A., 2010. Olive stone as arenewable source of biopolyols. Ind. Crop. Prod. 32, 7–12.
Mehandjiev, D., Bekyarova, E., Nickolov, R., 1994. Micropore size
distribution by a simplified equation. Carbon 32, 372–374.
Molina-Sabio, M., Rodrı ´guez-Reinoso, F., Caturla, F., Selle ´ s, M.J.,
1995. Porosity in granular carbons activated with phosphoric acid.
Carbon 33, 1105.
Niaounakis, M., Halvadakis, C.P., 2006. Olive Processing Waste
Management: Literature Review and Patent Survey. Elsevier,
Amsterdam.
Nickolov, R., Mehandjiev, D., 2000. The simplified equation for
micropore size distribution in adsorbents with different texture and
chemical nature. In: Proceeding of 9th International Symposium of
Catalysis, Varna, pp. 193–198.
Nickolov, R.N., Mehandjiev, D.R., 1995. Application of the simplified
equation for micropore size distribution to the study of watervapour adsorption on activated carbon. Adsorpt. Sci. Technol. 12,
203–209.
Olivares-Marin, M., Fernandez-Gonzalez, C., Macias-Garcia, A.,
Gomez-Serrano, V., 2006. Preparation of activated carbon from
cherry stones by chemical activation with ZnCl2. Sur. Sci. 252,
5967–5971.
Park, S.J., Jung, W.Y., 2003. KOH activation and characterization of
glass fibers-supported phenolic resin. J. Colloid. Interface Sci. 265,
245–250.
Prahas, D., Kartika, Y., Indraswati, N., Ismadji, S., 2008. Activated
carbon from jackfruit peel waste by H3PO4 chemical activation:
Characterization of activated carbon prepared by phosphoric acid activation of olive stones 7
Please cite this article in press as: Yakout, S.M., Sharaf El-Deen, G. Characterization of activated carbon prepared by phosphoricacid activation of olive stones. Arabian Journal of Chemistry (2012), doi:10.1016/j.arabjc.2011.12.002

7/27/2019 1-s2.0-S1878535211003030-main
http://slidepdf.com/reader/full/1-s20-s1878535211003030-main 8/8
Pore structure and surface chemistry characterization. Chem. Eng.
J. 140, 32–42.
Puziy, A.M., Poddubnaya, O.I., Martınez-Alonso, A., Suarez-Garcıa,
F., Tascon, J.M.D., 2002. Synthetic carbons activated with
phosphoric acid I. Surface chemistry and ion binding properties.
Carbon 40, 1493–1505.
Pyun, S.-I., Rhee, C.-K., 2004. An investigation of fractal character-
istics of mesoporous carbon electrodes with various pore structures.
Electrochim. Acta 49, 4171–4180.
Ryu, Z., Zheng, J., Whang, M., Zhang, B., 2000. Nitrogen adsorptionstudies of PAN-based activated carbon fibers prepared by different
activation methods. J. Colloid. Interface Sci. 230 (2), 312–319.
Seller-Perez, M.J., Martin-Martinez, J.M., 1991. J. Chem. Soc. Farady
Trans. 87, 1237–1243.
Sing, K.S.W., Everett, D.H., Haul, R.A.W., Moscow, L., Pinerotti,
R.A., Rouquerol, J., Siemieniewska, T., 1985. Pure Appl. Chem.
57, 603.
Solum, M.S., Pugmire, R.J., Jagtoyen, M., Derbyshire, F., 1995.
Evolution of carbon structure in chemically activated wood.
Carbon 33, 1247–1254.
Terzyk, A.P., Gauden, P.A., Kowalczyk, P., 2002. What kind of pore
size distribution is assumed in the Dubinin–Astakhov adsorption
isotherm equation? Carbon 40, 2879–2886.
Timur, S., Kantarli, I.C., Ikizoglu, E., Yanik, J., 2006. Preparation of
activated carbons from oreganum stalks by chemical activation.
Energ. Fuel. 20, 2636–2641.
Ustinov, E.A., Do, D.D., 2002. Adsorption in slit-like pores of activated carbons: improvement of the Horvath and Kawazoe
method. Langmuir 18, 4637–4647.
Zawadzki, J., 1989. Infrared spectroscopy in surface chemistry of
carbons. In: Thrower, P.A. (Ed.), . In: Chemistry and Physics of
Carbon, vol. 21. Marcel Dekker, New York, pp. 147–386.
8 S.M. Yakout, G. Sharaf El-Deen
Please cite this article in press as: Yakout, S.M., Sharaf El-Deen, G. Characterization of activated carbon prepared by phosphoricacid activation of olive stones Arabian Journal of Chemistry (2012) doi:10 1016/j arabjc 2011 12 002


